Free Access
Fig. 3
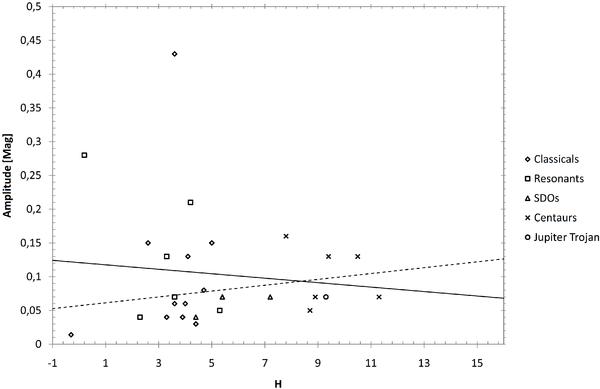
Amplitude versus H for all objects presented in this work. Different symbols correspond to different object classifications. Thick line is a linear fit of all our sample of data. Dash line is a linear fit to all our sample of data except Varuna, Haumea and 2003 VS2 which exhibit a peak-to-peak amplitude >0.20 mag.
Current usage metrics show cumulative count of Article Views (full-text article views including HTML views, PDF and ePub downloads, according to the available data) and Abstracts Views on Vision4Press platform.
Data correspond to usage on the plateform after 2015. The current usage metrics is available 48-96 hours after online publication and is updated daily on week days.
Initial download of the metrics may take a while.