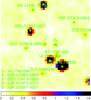
Fig. 3
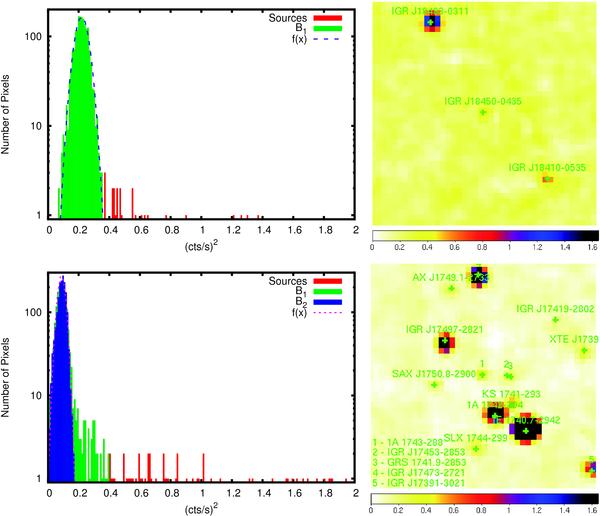
Top: the distributions of the intrinsic variability in pixels of 3.5° × 3.5° area (shown nearby) centered on the IGR J18450-0435. In green is B1 distribution in the range (min,2m − min) here representing the local intrinsic variance background, in red is the sources contribution, f(x) is the Gaussian distribution. Bottom: the 3.5° × 3.5° area (shown nearby) centered on the GC source 1A 1743-288. In green is B1 distribution in the range (min,2m − min), in blue is B2 distribution from the empty region in GC here representing the local intrinsic variance background, in red and f(x) are same as above.
Current usage metrics show cumulative count of Article Views (full-text article views including HTML views, PDF and ePub downloads, according to the available data) and Abstracts Views on Vision4Press platform.
Data correspond to usage on the plateform after 2015. The current usage metrics is available 48-96 hours after online publication and is updated daily on week days.
Initial download of the metrics may take a while.