Free Access
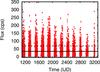
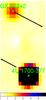
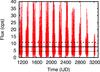
Fig. 1
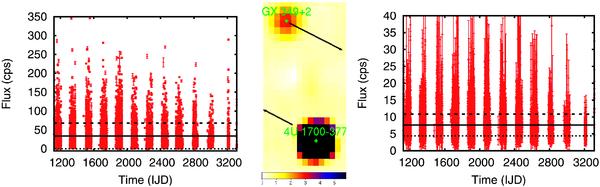
Lightcurves and variability map of HMXB 4U 1700-377 and LMXB GX 349+2. The solid line indicates the mean flux of the sources during the observation time, the dotted line shows the mean flux minus Sint, the dashed line shows the mean flux plus Sint.
This figure is made of several images, please see below:
Current usage metrics show cumulative count of Article Views (full-text article views including HTML views, PDF and ePub downloads, according to the available data) and Abstracts Views on Vision4Press platform.
Data correspond to usage on the plateform after 2015. The current usage metrics is available 48-96 hours after online publication and is updated daily on week days.
Initial download of the metrics may take a while.