| Issue |
A&A
Volume 521, October 2010
|
|
|---|---|---|
| Article Number | A19 | |
| Number of page(s) | 10 | |
| Section | Planets and planetary systems | |
| DOI | https://doi.org/10.1051/0004-6361/201014452 | |
| Published online | 15 October 2010 | |
Multi-color, rotationally resolved photometry of asteroid 21 Lutetia from OSIRIS/Rosetta observations![[*]](/icons/foot_motif.png)
P. L. Lamy1 - G. Faury1 - L. Jorda1 - M. Kaasalainen2 - S. F. Hviid3
1 - Laboratoire d'Astrophysique de Marseille, UMR
6110 CNRS/Université de Provence, 38 rue Frédéric Joliot-Curie, 13388
Marseille Cedex 13, France
2 - Tampere University of Technology, Finland
3 - Max-Planck-Institut für Sonnensystemforschung, Germany
Received 18 March 2010 / Accepted 19 June 2010
Abstract
Context. Asteroid 21 Lutetia is the second target of the
Rosetta space mission. Extensive pre-encounter, space-, and
ground-based observations are being performed to prepare for the flyby
in July 2010.
Aims. The aim of this article is to accurately characterize the
photometric properties of this asteroid over a broad spectral range
from the ultraviolet to the near-infrared and to search for evidence of
surface inhomogeneities.
Methods. The asteroid was imaged on 2 and 3 January 2007 with
the Narrow Angle Camera (NAC) of the Optical, Spectroscopic, and
Infrared Remote Imaging System (OSIRIS) during the cruise phase of
the Rosetta spacecraft. The geometric conditions were such that the
aspect angle was ![]() (i.e., mid-northern latitudes) and the phase angle
(i.e., mid-northern latitudes) and the phase angle
![]() .
Lutetia was continuously monitored over 14.3h, thus exceeding one
rotational period and a half, with twelve filters whose spectral
coverage extended from 271 to 986nm. An accurate photometric
calibration was obtained from the observations of a solar analog star,
16 Cyg B.
.
Lutetia was continuously monitored over 14.3h, thus exceeding one
rotational period and a half, with twelve filters whose spectral
coverage extended from 271 to 986nm. An accurate photometric
calibration was obtained from the observations of a solar analog star,
16 Cyg B.
Results. High-quality light curves in the U, B, V, R and I
photometric bands were obtained. Once they were merged with previous
light curves from over some 45 years, the sidereal period is accurately
determined:
![]() h.
Color variations with rotational phase are marginally detected with the
ultraviolet filter centered at 368nm but are absent in the other
visible and near-infrared filters. The albedo is directly determined
from the observed maximum cross-section obtained from an elaborated
shape model that results from a combination of adaptive-optics imaging
and light curve inversion. Using current solutions for the phase
function, we find geometric albedos
h.
Color variations with rotational phase are marginally detected with the
ultraviolet filter centered at 368nm but are absent in the other
visible and near-infrared filters. The albedo is directly determined
from the observed maximum cross-section obtained from an elaborated
shape model that results from a combination of adaptive-optics imaging
and light curve inversion. Using current solutions for the phase
function, we find geometric albedos
![]() when using the linear phase function and
when using the linear phase function and
![]() when using the (H-G)
phase function, which incorporates the opposition effect. The spectral
variation of the reflectance indicates a steady decrease with
decreasing wavelength rather than a sharp fall-off.
when using the (H-G)
phase function, which incorporates the opposition effect. The spectral
variation of the reflectance indicates a steady decrease with
decreasing wavelength rather than a sharp fall-off.
Key words: minor planets, asteroids: general - minor planets, asteroids: individual: 21 Lutetia - techniques: photometric
1 Introduction
The Rosetta spacecraft was successfully launched on 2 March 2004 and is now on its way to rendezvous comet 67P/Churyumov-Gerasimenko in May 2014 at a heliocentric distance of 4.5AU. During its journey to the comet, the spacecraft has already flown by asteroid 2867 Steins on 5 September 2008 (Keller et al. 2010). It will next flyby another main belt asteroid, 21 Lutetia, on 10 July 2010, at a velocity of 15 km s-1 and a closest approach of 3055 km. As for all targets of space missions, an a-priori knowledge of these ``terra incognita'' is important for preparing and optimizing the operations of the spacecraft and its instruments so as to maximize the scientific return.
We have already performed a detailed characterization of asteroid 2867 Steins before its flyby in a series of four articles (Barruci et al. 2008; Jorda et al. 2008; Lamy et al. 2008a; Lamy et al. 2008b). Our solution for the shape and size was instrumental in preparing the observational sequences. It further served as a starting model for the three-dimensional reconstruction from the Rosetta images and helped complete the unseen part of the body (Jorda et al. 2010). The flyby was too short to address the question of the rotational state fortunately solved by our earlier pre-flyby observations (Lamy et al. 2008a). Finally, our determination of the geometric albedo obtained by combining visible and infrared measurements (Lamy et al. 2008b) has been shown to be remarkably accurate by the in situ photometric analysis performed by Spjuth et al. (2010). We now turn our attention to the second target asteroid, 21 Lutetia, and present multi-color, rotationally resolved observations obtained with the OSIRIS narrow angle camera (NAC) onboard the Rosetta spacecraft, and discuss its photometric properties (color, albedo).
At about 100 km in diameter, 21 Lutetia is a large main belt asteroid discovered on 15 November 1852 by H.M.S. Goldschmidt (an amateur astronomer) at the Paris Observatory. Although its investigation has picked up momentum in recent years in anticipation of the upcoming Rosetta flyby, its nature remains controversial. Its early classification as an M-type asteroid based on eight-color photometry and a large IRAS albedo (Barucci et al. 1987; Tholen 1989) has been questioned, and the closest meteorite analogues to its surface composition appear to be particular types of carbonaceous chondrites such as CO3, CV3, and CH (e.g., Barucci et al. 2008).
Lutetia was recently classified in the Xc subclass (DeMeo et al. 2009); among its very few members, 97 Klotho presents spectral (Vernazza et al. 2009) and polarization (Belskaya et al. 2010) properties similar to those of Lutetia.
The purpose of the present investigation is to take advantage of a
space telescope, namely the OSIRIS narrow angle camera (NAC) onboard
the Rosetta spacecraft, to monitor Lutetia without the usual
limitations of ground-based observations (diurnal cycle, atmospheric
transmission).
We obtained a homogeneous set of complete, well-sampled light curves
whose spectral coverage extends from 368 to 880
![]() nm and additional data extending the spectral domain from 271 to 986
nm and additional data extending the spectral domain from 271 to 986
![]() nm,
which allowed us to address the questions of the spectral reflectance,
of possible color variations across the surface, and of the albedo.
nm,
which allowed us to address the questions of the spectral reflectance,
of possible color variations across the surface, and of the albedo.
Table 1: Summary of the observations of 21 Lutetia obtained with the OSIRIS-NAC using 12 filters.
2 Observations
![\begin{figure}
\par\includegraphics[width=8.5cm,clip]{aa14452-fig1.eps}
\end{figure}](/articles/aa/full_html/2010/13/aa14452-10/img13.png)
|
Figure 1: Spectral transmissions of the 12 OSIRIS-NAC filters normalized to their peak values. Standard Johnson-Kron-Cousins UBVRI bands are overplotted using different dashed/dotted lines for comparison. |
| Open with DEXTER | |
The narrow-angle camera (NAC) is the high-resolution camera of the OSIRIS imaging system (Keller et al. 2007) onboard ROSETTA.
The NAC is a three-mirror anastigmat telescope with an unobstructed aperture of 90
![]() mm and a focal length of 717
mm and a focal length of 717
![]() mm (f/D
= 8). In addition to its original optical concept for a planetary
camera, the NAC implements a novel all-silicon-carbide mechanical
design where the mirrors and the telescope structure are made of the
same material SiC (Dohlen et al. 1996; Calvel et al. 1999).
It is equipped with a dual filter wheel and an E2V 42-40 20482 pixel backlit, back-thinned CCD.
The pixel size of 13.5
mm (f/D
= 8). In addition to its original optical concept for a planetary
camera, the NAC implements a novel all-silicon-carbide mechanical
design where the mirrors and the telescope structure are made of the
same material SiC (Dohlen et al. 1996; Calvel et al. 1999).
It is equipped with a dual filter wheel and an E2V 42-40 20482 pixel backlit, back-thinned CCD.
The pixel size of 13.5![]() m corresponds to 3.88 arcsec.
The NAC offers an excellent point source sensitivity.
The optical point spread function has a FWHM of 8.3 arcsec (2.15 pixels) and is adequately sampled by the CCD detector (see Fig. 1 of Jorda et al. 2008).
m corresponds to 3.88 arcsec.
The NAC offers an excellent point source sensitivity.
The optical point spread function has a FWHM of 8.3 arcsec (2.15 pixels) and is adequately sampled by the CCD detector (see Fig. 1 of Jorda et al. 2008).
![\begin{figure}
\par\includegraphics[width=7.8cm,clip]{aa14452-fig2.eps}
\end{figure}](/articles/aa/full_html/2010/13/aa14452-10/img15.png)
|
Figure 2: Enlarged subframe images of asteroid 21 Lutetia obtained with the 12 OSIRIS-NAC filters. Each one is centered on Lutetia highlighted by a circle. Note the excellent tracking by the spacecraft. |
| Open with DEXTER | |
The observations started on 2.917 January 2007 UT and ended on 3.513 UT, thus covering an overall time span of 14.3
![]() h.
The geometric parameters varied only slightly over this interval:
the heliocentric distance changed from 2.5772 to 2.5763
h.
The geometric parameters varied only slightly over this interval:
the heliocentric distance changed from 2.5772 to 2.5763
![]() AU,
the distance to the Rosetta spacecraft from 1.6406 to 1.6433
AU,
the distance to the Rosetta spacecraft from 1.6406 to 1.6433
![]() AU, and
the solar phase angle increased from 22.26 to 22.48
AU, and
the solar phase angle increased from 22.26 to 22.48![]() .
Lutetia was observed with 12 different filters whose central wavelengths range from 271 to 986mn (Table 1 and Fig. 1).
They include both broad band filters for photometric characterization
and narrow band filters for mineralogic characterization.
The observational program started with 24 identical sequences taking
place every 30mn.
Each sequence included seven images successively acquired with filters
F16, F24, F23, F22, F28, F51, and F41, and it lasted 23.5mn.
Subsequently, five filters were added to the above list, F15, F27, F61,
F71, and F58, and this new sequence which lasted 45mn was repeated
twice without interruption.
The overall program is summarized in Table 1 and a total of 192
images acquired.
Each image corresponds to a window of
.
Lutetia was observed with 12 different filters whose central wavelengths range from 271 to 986mn (Table 1 and Fig. 1).
They include both broad band filters for photometric characterization
and narrow band filters for mineralogic characterization.
The observational program started with 24 identical sequences taking
place every 30mn.
Each sequence included seven images successively acquired with filters
F16, F24, F23, F22, F28, F51, and F41, and it lasted 23.5mn.
Subsequently, five filters were added to the above list, F15, F27, F61,
F71, and F58, and this new sequence which lasted 45mn was repeated
twice without interruption.
The overall program is summarized in Table 1 and a total of 192
images acquired.
Each image corresponds to a window of
![]() pixels centered on the expected position of Lutetia.
The spacecraft tracking the moving target was very accurate with an
error within a single exposure smaller than the PSF of the camera.
Figure 2 displays a set of 12 images taken with the 12 filters, each one an enlargement centered on the asteroid.
pixels centered on the expected position of Lutetia.
The spacecraft tracking the moving target was very accurate with an
error within a single exposure smaller than the PSF of the camera.
Figure 2 displays a set of 12 images taken with the 12 filters, each one an enlargement centered on the asteroid.
3 Data reduction
3.1 Image analysis
The data were reduced with the OSIRIS standard calibration pipeline that implements the following operations:
- the CCD is read out using a dual 14 bit analog-to-digital converter
(ADC). DN values created by the ``upper'' ADC (DN values
 214) get an additional offset added by the readout electronics. This offset is
subtracted;
214) get an additional offset added by the readout electronics. This offset is
subtracted;
- coherent noise produced by the power converter is filtered out;
- the bias value estimated from bias exposures taken immediately after the Lutetia observations is subtracted;
- the images are divided by the flat field relevant to the same filter.
The photometric analysis of the images follows the method developed by Jorda et al. (2008) for the previously observed asteroid 2867 Steins and insures that the flux measurements are properly corrected from contributions of any neighboring stars. For each of the 7 sets of 26 images, the first step consisted in constructing a reference background image from the 26 images accurately co-registered on the star positions at subpixel level. In practise, we used a single reference star free of any artifacts (saturation, impacts of cosmic rays). Figure 3 displays the sum of these 26 co-registered images obtained with the F22 filter, where the asteroid appears as a bright linear track. The background image itself was constructed by taking the median value of the 26 values at each pixel, thus efficiently removing the asteroid track and all artifacts.
The subpixel positions of the asteroid were first determined on each individual original images, and then transformed to instantaneous positions on the background image. Circular aperture photometry was performed using the IDL procedure ``APER'' from the ASTRON library, separately for the 26 original images of the asteroid and for the background image at the corresponding positions. As for asteroid Steins, we selected an aperture radius of 2 pixels as the best compromise between recording the bulk of the flux of the point spread function and limiting the spurious contributions from neighboring stars. This procedure was not really appropriate to the two sets of images obtained with the additional five filters and we implemented ``SExtractor'', an advanced procedure developed for reducing large-scale galaxy-survey data, but also adapted to the photometry of crowded fields (http://www.astromatic.net/software/sextractor).
![\begin{figure}
\includegraphics[width=9cm,clip]{aa14452-fig3.eps}
\vspace*{6mm}
\end{figure}](/articles/aa/full_html/2010/13/aa14452-10/img20.png)
|
Figure 3: Left panel: image of the sum of the individual 26 co-registered images obtained with the F22 filter where the asteroid appears as a bright linear track. Right panel: image of the reference background for the F22 filter. |
| Open with DEXTER | |
3.2 Uncertainty
We followed the method implemented by Jorda et al. (2008) for the photometry of Steins and expressed the 1![]() error of the data as
error of the data as
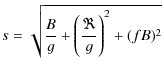
|
(1) |
where B is the observed signal in DN, g = 3 electrons DN-1 is the gain,
3.3 Absolute calibration
The solar spectral analog 16 Cyg B was observed with the
12 filters as part of the in-flight calibration of the NAC, and
photometric measurements were likewise performed using the same
aperture, i.e., a radius of 2 pixels.
In parallel, synthetic photometry was performed to obtain a consistency
check and to verify the absence of any red leaks in the ultraviolet
filters, the usual point of concern for these filters.
We used the solar spectrum from Colina et al. (1996)
and the throughput of the 12 channels of the NAC calculated from the
calibrated transmissions of all optical components and the calibrated
quantum efficiency of the detector.
For all channels, the direct and synthetic photometries of 16 Cyg B
agree at the ![]() 1% level.
1% level.
The 16 Cyg B photometry enabled us to determine the zero points (ZP) of the transformation between the standard UBVRI magnitudes of the Johnson-Kron-Cousins system and the instrumental magnitudes measured with the NAC filters. We associated the standard bands to the neighboring filters as follows: the U band to the F16 filter, the B band to F16 and F24, the V band to F23 and F24 (note that the F23 filter approximately matches the V band), the R band to F22 and F28, and the I band to F28, F41, and F51.
These zero points were corrected for the effect of the color of asteroid Lutetia. This was performed according to the procedure developed by Jorda et al. (2008) for Steins. In summary, the corrections of the zero points are given by equations of the type:
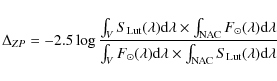
|
(2) |
where
![]() is the solar spectrum,
is the solar spectrum,
![]() (
(![]() )
is the Lutetia spectrum, and the integrals extend over the standard photometric bands
(the V band in the above example) and one of the NAC bandpass.
The Lutetia spectrum is expressed as
)
is the Lutetia spectrum, and the integrals extend over the standard photometric bands
(the V band in the above example) and one of the NAC bandpass.
The Lutetia spectrum is expressed as
| (3) |
where
![]() (
(![]() )
is the (relative) spectral reflectivity of Lutetia.
)
is the (relative) spectral reflectivity of Lutetia.
The solar spectrum ![]() (
(![]() )
is taken from Colina et al. (1996). The reflectivity of Lutetia was generated from the 320-1000nm spectrum obtained by Barucci et al. (2005) on 16 November 2004. We extrapolated the decreasing trend down to 200nm (Fig. 4) consistent with the widespread behavior of the reflectivity of asteroids in the ultra violet;
this extrapolation is not critical since it concerns a second-order correction of the zero points.
)
is taken from Colina et al. (1996). The reflectivity of Lutetia was generated from the 320-1000nm spectrum obtained by Barucci et al. (2005) on 16 November 2004. We extrapolated the decreasing trend down to 200nm (Fig. 4) consistent with the widespread behavior of the reflectivity of asteroids in the ultra violet;
this extrapolation is not critical since it concerns a second-order correction of the zero points.
The spectral profiles of the standard bands were taken from Landolt (1992).
![\begin{figure}
\par\includegraphics[width=9cm,clip]{aa14452-fig4.eps}
\end{figure}](/articles/aa/full_html/2010/13/aa14452-10/img32.png)
|
Figure 4: Relative spectral reflectivity of asteroid 21 Lutetia used for calculating the color corrections applied to the zero points of the photometric transformation formulae. |
| Open with DEXTER | |
4 Results
4.1 Multi-color light curves of asteroid 21 Lutetia
Figure 5 displays the light curves of asteroids 21 Lutetia for the UBVRI bands where the reduced magnitudes
![]() are plotted as functions of time.
As explained in the above section, either one (U), two (BVR), or three (I) filters were associated to the standard photometric bands as indicated in parentheses.
In the case of multiple light curves, i.e., two for the BVR bands and three for the I band, the agreements are excellent with dispersions always lying within the
are plotted as functions of time.
As explained in the above section, either one (U), two (BVR), or three (I) filters were associated to the standard photometric bands as indicated in parentheses.
In the case of multiple light curves, i.e., two for the BVR bands and three for the I band, the agreements are excellent with dispersions always lying within the ![]() error bars.
error bars.
The measured magnitudes
![]() for the five photometric bands are reported in Tables 4 to 8 (available at the CDS).
The V light curve has a mean value of
for the five photometric bands are reported in Tables 4 to 8 (available at the CDS).
The V light curve has a mean value of
![]() and an amplitude of
and an amplitude of
![]() mag.
Our data, together with recent ground-based light curves, were merged with the data set used by
Torppa et al. (2003) to extend the overall temporal coverage to 48 years and therefore to refine
the determination of the sidereal period:
mag.
Our data, together with recent ground-based light curves, were merged with the data set used by
Torppa et al. (2003) to extend the overall temporal coverage to 48 years and therefore to refine
the determination of the sidereal period:
![]() h (see the above reference for details
of the method and error estimation).
h (see the above reference for details
of the method and error estimation).
![\begin{figure}
\par\includegraphics[width=9cm,clip]{aa14452-fig5.eps}
\end{figure}](/articles/aa/full_html/2010/13/aa14452-10/img37.png)
|
Figure 5: Light curves of asteroid 21 Lutetia. The UBVRI reduced magnitudes are plotted as function of the MJD. |
| Open with DEXTER | |
![\begin{figure}
\par\includegraphics[width=8.5cm,clip]{aa14452-fig6.eps}
\end{figure}](/articles/aa/full_html/2010/13/aa14452-10/img38.png)
|
Figure 6:
Folded V band light curve of asteroid 21 Lutetia. The
|
| Open with DEXTER | |
The question of the rotationally resolved photometry of Lutetia is best
tackled by directly considering the ratios of the various fluxes
measured in the different filters.
We selected the F22 band as a reference since it recorded the largest
signals (largest signal-over-noise ratios) and since these measurements
were roughly performed near the midpoint of each sequence.
Incidentally, during a sequence lasting 23.5mn, the asteroid rotates by
![]() which is acceptable for this kind of analysis.
We calculated the ratios of the F22 fluxes to those of the six other
filters and display them folded with the rotational period of Lutetia
thus representing color variations as a function of rotational phase
(Fig. 8).
The regions of overlap allow to assess the consistency of the
measurements as the flux ratios shifted by one rotation always agree
within the
which is acceptable for this kind of analysis.
We calculated the ratios of the F22 fluxes to those of the six other
filters and display them folded with the rotational period of Lutetia
thus representing color variations as a function of rotational phase
(Fig. 8).
The regions of overlap allow to assess the consistency of the
measurements as the flux ratios shifted by one rotation always agree
within the ![]() uncertainty. With the exception of the F22/F16 ratio, all other ratios
pertaining to the 480-880nm spectral range remained constant, the
observed fluctuations never departing from the mean values by more than
uncertainty. With the exception of the F22/F16 ratio, all other ratios
pertaining to the 480-880nm spectral range remained constant, the
observed fluctuations never departing from the mean values by more than
![]() .
The F22/F16 ratio which involves the ultra violet filter centered at
368nm exhibits more conspicuous variations than the other ratios,
slightly exceeding the
.
The F22/F16 ratio which involves the ultra violet filter centered at
368nm exhibits more conspicuous variations than the other ratios,
slightly exceeding the ![]() bar over the mean value.
To further ascertain these variations, we introduced the ratio F41/F16
which therefore involves the largest wavelength range available in our
data.
Variations similar to that of the F22/F16 ratio are observed but still
barely exceeding
bar over the mean value.
To further ascertain these variations, we introduced the ratio F41/F16
which therefore involves the largest wavelength range available in our
data.
Variations similar to that of the F22/F16 ratio are observed but still
barely exceeding ![]() for the largest ones.
These conclusions can be quantified by considering the upper limits of
the variations (i.e., the ratio of the maximum to minimum values)
together with their uncertainities as given in each panel of Fig. 8.
These upper limits are typically 3%, reaching 5% for the F22/F16 ratio and up to 6.5% for the F41/F16 ratio, with however
for the largest ones.
These conclusions can be quantified by considering the upper limits of
the variations (i.e., the ratio of the maximum to minimum values)
together with their uncertainities as given in each panel of Fig. 8.
These upper limits are typically 3%, reaching 5% for the F22/F16 ratio and up to 6.5% for the F41/F16 ratio, with however ![]() uncertainties of
uncertainties of ![]() 2.5%.
We may tentatively conclude for marginal evidence of compositional
variations of the surface of Lutetia, which could then involve minerals
having signature(s) in the ultraviolet such as electronic charge
transfer bands.
When comparing with reports of variations in the shape of visible
spectra (the so-called spectral slope) with rotational phase, the
aspects of the observations must be taken into account: south polar
view for Prokof'eva-Mikhailovskaya et al. (2007), for Belskaya et al. (2010) and for Perna et al. (2010), equatorial view for Busarev (2008).
Note that the above aspects have been recalculated on the basis of our
solution for the pole direction and that they may differ from those
quoted by the respective authors based on different solutions.
Variations in the shape of near-infrared spectra have also been
reported by Nedelcu et al. (2007),
here again at equatorial aspect.
Our conclusion of the absence of spectral variations in the visible and
marginal evidence in the ultraviolet at mid-northern latitudes
therefore do not contradict the above reports and further indicate
marked compositional variegation across the surface of Lutetia.
Forthcoming spatially-resolved measurements expected from the Rosetta
instruments will hopefully shed new light on this question.
2.5%.
We may tentatively conclude for marginal evidence of compositional
variations of the surface of Lutetia, which could then involve minerals
having signature(s) in the ultraviolet such as electronic charge
transfer bands.
When comparing with reports of variations in the shape of visible
spectra (the so-called spectral slope) with rotational phase, the
aspects of the observations must be taken into account: south polar
view for Prokof'eva-Mikhailovskaya et al. (2007), for Belskaya et al. (2010) and for Perna et al. (2010), equatorial view for Busarev (2008).
Note that the above aspects have been recalculated on the basis of our
solution for the pole direction and that they may differ from those
quoted by the respective authors based on different solutions.
Variations in the shape of near-infrared spectra have also been
reported by Nedelcu et al. (2007),
here again at equatorial aspect.
Our conclusion of the absence of spectral variations in the visible and
marginal evidence in the ultraviolet at mid-northern latitudes
therefore do not contradict the above reports and further indicate
marked compositional variegation across the surface of Lutetia.
Forthcoming spatially-resolved measurements expected from the Rosetta
instruments will hopefully shed new light on this question.
![\begin{figure}
\par\includegraphics[width=9cm,clip]{aa14452-fig7.eps}
\end{figure}](/articles/aa/full_html/2010/13/aa14452-10/img44.png)
|
Figure 7: Three-dimensional views of asteroid 21 Lutetia as seen by the OSIRIS/NAC at four different rotational phases corresponding to the extrema of the light curve. Left column: the present shape model, right column: ellipsoid model from Drummond et al. (2010). |
| Open with DEXTER | |
![\begin{figure}
\par\includegraphics[width=9cm,clip]{aa14452-fig8.eps}
\end{figure}](/articles/aa/full_html/2010/13/aa14452-10/img45.png)
|
Figure 8: Ratios of the fluxes obtained with the reference F22 filter to those obtained with the other filters and the F41/F16 ratio ( bottom panel). The fluxes are plotted versus rotational phase and the black/red symbols distinguish the two successive rotations of Lutetia. The dashed lines correspond to the mean values of the respective data sets. Upper limits of the variations are given in each panel. |
| Open with DEXTER | |
4.2 The albedo of asteroid 21 Lutetia
To determine the albedo of Lutetia, we considered the elaborated shape
model introduced above and exploited the fact that the AO images yield
the absolute size of the body.
We calculated the maximum cross-section that would have been seen by
the NAC at zero phase angle,
![]() .
Our magnitude corresponding to the maximum of the V light curves must
be corrected to zero phase angle and we relied on the phase functions
constructed by Belskaya et al. (2010) from a large set of data (Fig. 9).
Their H-G solution (Bowell et al. 1989) at near polar aspect angles is characterized by
.
Our magnitude corresponding to the maximum of the V light curves must
be corrected to zero phase angle and we relied on the phase functions
constructed by Belskaya et al. (2010) from a large set of data (Fig. 9).
Their H-G solution (Bowell et al. 1989) at near polar aspect angles is characterized by
![]() and leads to
and leads to
![]() .
Their linear phase function, which removes the opposition effect has a phase coefficient
.
Their linear phase function, which removes the opposition effect has a phase coefficient
![]() mag deg-1, and leads to
mag deg-1, and leads to
![]() .
The above uncertainties on V(1,1,0) were obtained by propagating the errors affecting our measurement and the G and
.
The above uncertainties on V(1,1,0) were obtained by propagating the errors affecting our measurement and the G and ![]() parameters.
It should be noted that the coincidence between our results and those of Belskaya et al. (2010, their Fig. 3) is totally fortuitous because the respective observations were obtained at different aspect angles.
The standard formula relating magnitudes to cross-sections, originally devised by Russell (1916) for asteroids observed at large phase angles and conveniently reformulated by Jewitt (1991), allowed us to calculate the geometric albedo p in a given photometric band.
Following our analysis of asteroid 2867 Steins (Jorda et al. 2008), we considered two cases:
parameters.
It should be noted that the coincidence between our results and those of Belskaya et al. (2010, their Fig. 3) is totally fortuitous because the respective observations were obtained at different aspect angles.
The standard formula relating magnitudes to cross-sections, originally devised by Russell (1916) for asteroids observed at large phase angles and conveniently reformulated by Jewitt (1991), allowed us to calculate the geometric albedo p in a given photometric band.
Following our analysis of asteroid 2867 Steins (Jorda et al. 2008), we considered two cases:
- 1.
- the linear phase function yields an albedo representative of the global photometric properties of the asteroid
 ,
consistent with the definition of the geometric albedo, which relies on
the comparison with a Lambertian diffuser (Hanner et al. 1981);
,
consistent with the definition of the geometric albedo, which relies on
the comparison with a Lambertian diffuser (Hanner et al. 1981);
- 2.
- the (H-G) phase function incorporates the opposition effect so that the albedo is artificially enhanced:
 .
While this albedo is of standard use for classifying asteroids, we
emphasize that it is irrelevant when solving for the thermal emission
of the asteroid.
.
While this albedo is of standard use for classifying asteroids, we
emphasize that it is irrelevant when solving for the thermal emission
of the asteroid.
![\begin{figure}
\par\includegraphics[width=9cm,clip]{aa14452-fig9.eps}
\end{figure}](/articles/aa/full_html/2010/13/aa14452-10/img54.png)
|
Figure 9:
Phase function
|
| Open with DEXTER | |
Table 2: Determinations of the geometric albedo of 21 Lutetia.
Various methods have been applied to determine the albedo of Lutetia, and the results are summarized in Table 2.
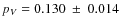
The radar albedo values range from 0.19 (Magri et al. 1999) to 0.24 (Shepard et al. 2008), both values affected by the same large uncertainty of ![]() ;
consequently, the radar albedo is not strongly constrained and may be as low as 0.12 at the
;
consequently, the radar albedo is not strongly constrained and may be as low as 0.12 at the ![]() level.
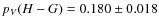
The thermal albedo values range from 0.13 (Carvano et al. 2008) to 0.21-0.22 (Tedesco & Veeder 1992; Mueller et al. 2006) with error bars of 0.02 to 0.03.
The determination of Carvano et al. (2008)
is identical to our value obtained without the opposition surge that is
relevant to thermal modeling as argued above (see also Lamy et al.
2008b).
We show in a separate article that this value is further compatible
with extended, rotationally-resolved thermal measurements of Lutetia
performed with the Spitzer space telescope (Lamy et al. 2010).
The value of 0.22
level.
The thermal albedo values range from 0.13 (Carvano et al. 2008) to 0.21-0.22 (Tedesco & Veeder 1992; Mueller et al. 2006) with error bars of 0.02 to 0.03.
The determination of Carvano et al. (2008)
is identical to our value obtained without the opposition surge that is
relevant to thermal modeling as argued above (see also Lamy et al.
2008b).
We show in a separate article that this value is further compatible
with extended, rotationally-resolved thermal measurements of Lutetia
performed with the Spitzer space telescope (Lamy et al. 2010).
The value of 0.22 ![]() 0.02 by Tedesco & Veeder (1992) was determined at zero phase angle using absolute magnitudes H, so it should be compared to our value pV = 0.18
0.02 by Tedesco & Veeder (1992) was determined at zero phase angle using absolute magnitudes H, so it should be compared to our value pV = 0.18 ![]() 0.02, leading to an agreement within the error bars.
A closer look at the article by Mueller et al. (2006)
reveals that their result is an average of 5 determinations obtained
with different models and different data sets and that the individual
determinations range from 0.19 to 0.24 with errors ranging from 0.04 to
0.06 making a couple of them fully compatible with our two
determinations.
All authors who performed polarization measurements of Lutetia
emphasize the peculiar behavior of the negative branch of polarization
so that applying the empirical calibrations relating albedo to either
0.02, leading to an agreement within the error bars.
A closer look at the article by Mueller et al. (2006)
reveals that their result is an average of 5 determinations obtained
with different models and different data sets and that the individual
determinations range from 0.19 to 0.24 with errors ranging from 0.04 to
0.06 making a couple of them fully compatible with our two
determinations.
All authors who performed polarization measurements of Lutetia
emphasize the peculiar behavior of the negative branch of polarization
so that applying the empirical calibrations relating albedo to either
![]() or h remains problematic.
However, the most recent results by Belskaya et al. (2010) are very encouraging.
or h remains problematic.
However, the most recent results by Belskaya et al. (2010) are very encouraging.
- Their value pV = 0.13
 0.02 is obtained by applying the empirical h-albedo relationship
calibrated with albedos of meteorites measured in laboratory at a phase
angle of
0.02 is obtained by applying the empirical h-albedo relationship
calibrated with albedos of meteorites measured in laboratory at a phase
angle of  (Zellner & Gradie 1976) i.e., almost without opposition effect. It is identical to our determination obtained under the same assumption.
- Their value pV = 0.16
0.02 is obtained by applying the calibration based on IRAS albedos
determined at zero phase angle using the absolute magnitude H (Cellino
et al. 1999). It should be compared to our determination using the H-G phase function pV = 0.18
0.02, and both determinations agree within their error bars.
In conclusion, it appears that the reality of the discrepancies between various determination of the albedo of Lutetia has been exaggerated. Taking the various uncertainties in the measurements into account, in the models (and assumed parameters), in the empirical calibrations, and of paramount importance, distinguishing between albedos with and without opposition effect, most if not all reported values can be reconciled. We are confident that our determinations based on accurate space photometry and on the most advanced shape model, and which further agree with the recent results of Belskaya et al. (2010) and of Weaver et al. (2010), reflect the real properties of the surface of Lutetia.
Several groups (e.g., Magri et al. 1999; Shepard et al. 2008; Belskaya et al. 2010)
have concluded that an albedo in the range 0.13-0.18 excludes a
metallic surface composition and is consistent with particular types of
carbonaceous chondrites and enstatite chondrites.
On the other hand, Belskaya & Shevchenko (2000)
derive a linear relationship between the phase coefficient (or slope)
of the linear part (denoted ``b'') and the logarithm of the visible
albedo pV.
With a slope
![]() mag/deg and
mag/deg and
![]() ,
Lutetia lies close to this linear relationship and clearly stands
outside the group of C-type objects and well within the M-type group.
This is one piece of evidence of the puzzling nature of Lutetia.
,
Lutetia lies close to this linear relationship and clearly stands
outside the group of C-type objects and well within the M-type group.
This is one piece of evidence of the puzzling nature of Lutetia.
4.3 The color of asteroid 21 Lutetia
We derived the color indices of Lutetia from the mean values of the UBVRI magnitudes and display our results separately for the various filter combinations in Table 3,
showing the excellent consistency of these different determinations,
hence demonstrating the quality of the photometric analysis.
We finally averaged the corresponding determinations and obtained
![]() ,
,
![]() ,
,
![]() ,
and
,
and
![]() .
.
It is interesting to recall the implications of these color indices, in particular those involving the UBV bands, for classifying Lutetia (e.g., Zellner et al. 1975). In the color-color diagram (U-V) versus (B-V), Lutetia strikingly lies well inside the taxonomy group M and completely outside the C group. While it is not possible to classify an object only with photometric colors, this result adds more evidence of the puzzling nature of this asteroid.
Table 3: Color indices of asteroid 21 Lutetia.
4.4 Spectral reflectance and albedo of asteroid 21 Lutetia
Lutetia was observed with 12 different filters covering the spectral range 271 to 986nm in two consecutive identical sequences, each lasting 45mn. As the overall duration reached 1.5h, a significant fraction of the rotational period, and as the observations further corresponded to a rising branch of the light curve, it was not possible to average the pairs of measurements and readily construct the spectral reflectance. In addition, the first of the two observations taken with the F15 filter was unfortunately unusable as the image of the asteroid significantly departed from the point spread function of the NAC (a faint cosmic ray impact was suspected) leading to an incoherent flux. A linear interpolation was constructed from each pair of flux measurements and sampled at the time of the second F15 observation, thus insuring the simultaneity of the multispectral data.
![\begin{figure}
\par\includegraphics[width=8.5cm,clip]{aa14452-fig10.eps}
\end{figure}](/articles/aa/full_html/2010/13/aa14452-10/img65.png)
|
Figure 10: Relative spectral reflectance of asteroid 21 Lutetia. Our results (data points) are compared with the spectra of Barucci et al. (2005) and of Perna et al. (2010). |
| Open with DEXTER | |
The solar spectral analog 16 Cyg B was observed with the same filters
so that the relative reflectance of Lutetia was obtained simply by
taking the ratios of the corresponding fluxes.
Our results, together with the spectrum of Barucci et al. (2005) obtained on 16 November 2004
and that of Perna et al. (2010) obtained on 28.1 November 2008, are displayed in Fig. 10.
The overall agreement is excellent.
We note a slight anomaly of the measurement with the F58 filter as the suggested absorption band is not present in the spectra.
It may result from a calibration problem, but it disappears at the ![]() level.
level.
We next generated the spectral geometric albedo of Lutetia by scaling the reflectance data to pV(H-G) = 0.18 at the central wavelength of the V band (540nm) as shown in Fig. 11. We superimposed:
- the original IUE data reproduced from Table II of Roettger & Buratti (1994);
- the IUE data point at 267nm recently corrected by Weaver et al. (2010) using a different phase function and a new effective diameter;
- the HST results from Weaver et al. (2010).
![\begin{figure}
\par\includegraphics[width=8.5cm,clip]{aa14452-fig11.eps}
\end{figure}](/articles/aa/full_html/2010/13/aa14452-10/img66.png)
|
Figure 11: Spectral albedo of asteroid 21 Lutetia. The IUE data points correspond to the original data from Roettger & Buratti (1994) and appear as open circles, while the one at 267nm has been corrected by Weaver et al. (2010) and appears as a filled circle. The curve going through the NAC data points corresponds to the spectrum of Barucci et al. (2005), while the curve going through the HST data points corresponds to the best estimate by Weaver et al. (2010). |
| Open with DEXTER | |
For those data, we introduced a (systematic) uncertainty of 10% to
account for the error on the asteroid cross-section in addition to the
quoted photometric uncertainties.
As already discussed above, the NAC and HST albedo values in the
visible agree within their ![]() error bars, which amount to
error bars, which amount to ![]() 0.02.
The situation is more problematic in the ultraviolet.
The HST data suggest a sharp drop in the spectral range 300-330nm, while our data together with the corrected IUE data point at
0.02.
The situation is more problematic in the ultraviolet.
The HST data suggest a sharp drop in the spectral range 300-330nm, while our data together with the corrected IUE data point at
![]() nm
support a more gentle decrease as the wavelength decreases. New
observational data, in particular from the Rosetta instruments, are
needed to clarify these contradictory results and to establish the
true albedo of Lutetia in the ultraviolet.
nm
support a more gentle decrease as the wavelength decreases. New
observational data, in particular from the Rosetta instruments, are
needed to clarify these contradictory results and to establish the
true albedo of Lutetia in the ultraviolet.
5 Summary and conclusions
We have presented an in-depth photometric analysis of the observations of the Rosetta mission flyby target asteroid 21 Lutetia obtained with the OSIRIS narrow angle camera onboard the Rosetta spacecraft. Our analysis includes an accurate absolute calibration using a solar analog star. Our main findings are summarized below.
- 1.
- The photometric data obtained with 7 different filters ranging
from 368 to 880nm and regularly sampling 1.65 rotational period yielded
consistent light curves in the UBVRI bands of the Johnson-Kron-Cousins photometric system.
Merging with a large set of light curves obtained over some 45 years, the sidereal period was accurately determined as
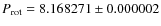 h.
h.
- 2.
- Color variations with rotational phase were marginally detected with the ultraviolet filter centered at 368nm but were absent in the other visible and near-infrared filters, a result that strictly applies to mid-northern latitutes. It therefore does not contradict variations reported for south polar and equatorial views, and it further suggests marked compositional variegation across the surface of Lutetia.
- 3.
- The spectral variation of the reflectance in the domain 271-986nm obtained thanks to including 5 additional filters indicates a progressive decrease with decreasing wavelength rather than a sharp fall-off as reported by Weaver et al. (2010). This would, to some extent, alleviate the difficulty pointed out by these authors in finding a reasonable analog among measured samples.
- 4.
- The albedo was directly determined from the observed maximum cross-section obtained from an elaborated shape model.
We found geometric albedos
 when using the linear phase function and
when using the (H-G) phase function that incorporates the opposition effect.
These values are much higher than those typical of common C-type asteroids (
when using the linear phase function and
when using the (H-G) phase function that incorporates the opposition effect.
These values are much higher than those typical of common C-type asteroids ( 0.06)
and are best compatible with either some types of carbonaceous
chondrites (prominently enstatite chondrites and marginally CO) or
M-type asteroids.
0.06)
and are best compatible with either some types of carbonaceous
chondrites (prominently enstatite chondrites and marginally CO) or
M-type asteroids.
- 5.
- The (U-B) and (B-V) color indices show that Lutetia lies well inside the taxonomy group M and completely outside the C group.
In addition, the mass estimates of
![]() kg by Baer et al. (2008) and of
kg by Baer et al. (2008) and of
![]() kg
by Fienga et al. (2009), combined with a volume of
kg
by Fienga et al. (2009), combined with a volume of
![]() m3 resulting from our shape model, leads to bulk
densities of
m3 resulting from our shape model, leads to bulk
densities of
![]() and
and
![]() g cm-3, respectively, that is an overall range from 2.6 to 6.1 g cm-3.
These are extraordinarily large values for asteroids based on current
data.
In the present view where asteroids are thought to have large
macroporosity, this would require that the component material has even
a higher density, henceforth a substantial metallic content.
An alternative interpretation excludes significant porosity and
probably a rubble-pile internal structure for Lutetia.
In this context, we can directly compare the above result with the
grain densities of meteorites:
g cm-3, respectively, that is an overall range from 2.6 to 6.1 g cm-3.
These are extraordinarily large values for asteroids based on current
data.
In the present view where asteroids are thought to have large
macroporosity, this would require that the component material has even
a higher density, henceforth a substantial metallic content.
An alternative interpretation excludes significant porosity and
probably a rubble-pile internal structure for Lutetia.
In this context, we can directly compare the above result with the
grain densities of meteorites:
![]() 2.3 g cm-3 for CI and CM,
2.3 g cm-3 for CI and CM,
![]() 3.5 g cm-3 for CO and CV,
3.6 to 3.7 g cm-3 for CH, and
4.4 to 4.6 g cm-3 for stony-iron meteorites
(Britt & Consolmagno 2003; Consolmagno et al. 2008; Macke et al. 2009).
Excluding the CI and CM, they are all compatible with the present uncertainty range of the density of Lutetia.
3.5 g cm-3 for CO and CV,
3.6 to 3.7 g cm-3 for CH, and
4.4 to 4.6 g cm-3 for stony-iron meteorites
(Britt & Consolmagno 2003; Consolmagno et al. 2008; Macke et al. 2009).
Excluding the CI and CM, they are all compatible with the present uncertainty range of the density of Lutetia.
As summarized by Belskaya et al. (2010), several lines of independent evidence suggest a similarity of the properties
of the surface of Lutetia with those of particular types of carbonaceous chondrites (e.g., CO3, CV3, CH):
i) minor features in its visible spectra indicative of aqueous alteration (Lazzarin et al. 2004, 2009; Busarev 2004);
ii) the 3![]() m feature indicative of hydrated silicates (Rivkin et al. 2000; Birlan et al. 2006);
iii) its overall thermal 5.2-32
m feature indicative of hydrated silicates (Rivkin et al. 2000; Birlan et al. 2006);
iii) its overall thermal 5.2-32![]() m emissivity spectrum and the presence of Christiansen, Reststrahlen and Transparency features
(Barucci et al. 2008); iv) its particular polarization properties as already mentioned in Sect. 4.2.
In addition, Barucci et al. (2008)
have emphasized the similarity of the visible and near-infrared spectra
of Lutetia with
those of the CO3 (e.g., Ornans) or CV3 (e.g., Vigarano) type
meteorites, contrary to that of Odessa, an iron meteorite that contains
some
silicate inclusions, while Vernazza et al. (2009) favor enstatite
chondrites.
m emissivity spectrum and the presence of Christiansen, Reststrahlen and Transparency features
(Barucci et al. 2008); iv) its particular polarization properties as already mentioned in Sect. 4.2.
In addition, Barucci et al. (2008)
have emphasized the similarity of the visible and near-infrared spectra
of Lutetia with
those of the CO3 (e.g., Ornans) or CV3 (e.g., Vigarano) type
meteorites, contrary to that of Odessa, an iron meteorite that contains
some
silicate inclusions, while Vernazza et al. (2009) favor enstatite
chondrites.
However, if forthcoming measurements lead to a large bulk density, then a more complex internal structure would have to be considered for Lutetia; for instance, the (oversimplified) picture of a monolithic, prominently metallic body with a thick regolith layer with small grain size that underwent some aqueous alteration could partly reconcile the current observational evidence. In particular, this would explain the very low thermal inertia (Mueller et al. 2006; Carvano et al. 2008; Lamy et al. 2010), but the composition of the regolith would have to be consistent with the constraints listed above.
Further requirements would come from the near and far ultraviolet spectra.
Ultimately, the problem probably lies in understanding the peculiar physical properties of Lutetia and how such an object can form, either primordially or by subsequent evolution. Rather than speculating further on these questions, we prefer to wait for the vast crop of data expected from the forthcoming flyby that hopefully will shed some new light on these puzzling properties.
AcknowledgementsOSIRIS was built by a consortium of the Max-Planck-Institut für Sonnensystemforschung, Lindau, Germany, the Laboratoire d'Astrophysique de Marseille, France, the Centro Interdipartimentale Studi e Attivita' Spaziali, University of Padova, Italy, the Instituto de Astrofisica de Andalucia, Granada, Spain, the Research and Scientific Support Department of the European Space Agency (ESA/ESTEC), Noordwijk, The Netherlands, the Instituto Nacional de Tecnica Aerospacial, Madrid, Spain, the Institut für Datentechnik und Kommunikationsnetze der Technischen Universitat, Braunschweig and the Department of Astronomy and Space Physics of Uppsala University, Sweden. The support of the national funding agencies DLR, CNES, ASI, MEC, NASA, and SNSB is gratefully acknowledged. We thank the personnel of the Rosetta Science Operations Center at ESA/ESTEC and of the Rosetta Mission Operations Center at ESA/ESOC for their prompt and efficient scheduling of the observations. We are grateful to I. Belskaya, D. Perna and H. Weaver for making their results available to us in advance of publication, to S. Croft for providing us with the color indices of asteroids, and to P. Vernazza for an enlightning discussion. This research made use of JPL's online ephemeris generator (horizons).
References
- Baer, J., Milani, A., Chesley, S., & Matson, R. D. 2008, Bul. Am. Astron. Soc. 40, 493 [Google Scholar]
- Barucci, M. A., Capria, M. T., Coradini, A., & Fulchignoni, M. 1987, Icarus, 72, 304 [NASA ADS] [CrossRef] [Google Scholar]
- Barucci, M. A., Fulchignoni, M., Fornasier, S., et al. 2005, A&A, 430, 313 [NASA ADS] [CrossRef] [EDP Sciences] [Google Scholar]
- Barucci, M. A., Fornasier, S., Dotto, E., et al. 2008, A&A, 477, 665 [NASA ADS] [CrossRef] [EDP Sciences] [Google Scholar]
- Belskaya, I. N., & Shevchenko, V. G. 2000, Icarus, 147, 94 [NASA ADS] [CrossRef] [Google Scholar]
- Belskaya, I. N., Fornasier, S., Krugly, et al. 2010, A&A, 515, A29 [NASA ADS] [CrossRef] [EDP Sciences] [Google Scholar]
- Birlan, M., Vernazza, P., Fulchignoni, M., et al. 2006, A&A, 454, 677 [NASA ADS] [CrossRef] [EDP Sciences] [Google Scholar]
- Bohlin, R. C., Dickinson, M. E., & Calzetti, D. 2001, AJ, 122, 2118 [NASA ADS] [CrossRef] [Google Scholar]
- Bowell, E., Hapke, B., Domingue, D. et al., 1989, in Asteroids II (Univ. of Arizona Press), 524 [Google Scholar]
- Britt, D. T., & Consolmagno, G. J. 2003, Meteorit. Planet. Sci., 38, 1161 [NASA ADS] [CrossRef] [Google Scholar]
- Busarev, V. V. 2004, Lunar and Planetary Institute Science Conference Abstracts, 35, 1026 [NASA ADS] [Google Scholar]
- Busarev, V. V. 2008, LPI Contributions, 1405, 8010 [NASA ADS] [Google Scholar]
- Calvel, B., Castel, D., Lamy, P. L., Dohlen, K., & Bougoin, M. 1999, Advanced Telescope Design. Proc. SPIE, 3785, 56 [NASA ADS] [CrossRef] [Google Scholar]
- Carry, B., Kaasalainen, M., Leyrat, C., et al. 2010, A&A, in press[arXiv:1005.5356] [Google Scholar]
- Carvano, J. M., Barucci, M. A., Delbó, M., et al. 2008, A&A, 479, 241 [NASA ADS] [CrossRef] [EDP Sciences] [Google Scholar]
- Cellino, A., Hutton, R. G., Tedesco, E. F., di Martino, M., & Brunini, A. 1999, Icarus, 138, 129 [NASA ADS] [CrossRef] [Google Scholar]
- Colina, L., Bohlin, R. C., & Castelli, F. 1996, AJ, 112, 307 [NASA ADS] [CrossRef] [Google Scholar]
- Consolmagno, G. J., Britt, D. T., & Macke, R. J. 2008, Lunar and Planetary Institute Science Conference Abstracts, 39, 1582 [NASA ADS] [Google Scholar]
- DeMeo, F. E., Binzel, R. P., Slivan, S. M., & Bus, S. J. 2009, Icarus, 202, 160 [NASA ADS] [CrossRef] [Google Scholar]
- Denchev, P. 2000, Planet. Space Sci., 48, 987 [NASA ADS] [CrossRef] [Google Scholar]
- Dohlen, K., Saisse, M., Claeysen, G., Lamy, P. L., & Boit, J.-L. 1996, Optic. Engi. 35, 1150 [Google Scholar]
- Dollfus, A. & Geake, J. E. 1975, Proceedings of the 6th Lunar Science Conference, Houston, Texas, March 17-21, 3, 2749 [NASA ADS] [Google Scholar]
- Drummond, J. D., Conrad, A., Merline, W., et al. 2010, A&A, in press[arXiv:1005.5353] [Google Scholar]
- Feierberg, M. A., Witteborn, F. C., & Lebofsky, L. A. 1983, Icarus, 56, 393 [NASA ADS] [CrossRef] [Google Scholar]
- Fienga, A., Laskar, J., Morley, T., et al. 2009, A&A, 507, 1675 [NASA ADS] [CrossRef] [EDP Sciences] [Google Scholar]
- Gil-Hutton, R. 2007, A&A, 464, 1127 [NASA ADS] [CrossRef] [EDP Sciences] [Google Scholar]
- Hanner, M. S., Giese, R. H., Weiss, K., & Zerull, R. 1981, A&A, 104, 42 [Google Scholar]
- Jewitt, D. 1991, Comets in the post-Halley era, 167, IAU Colloq, 116 19 [Google Scholar]
- Jorda, L., Lamy, P. L., Faury, G., et al. 2008, A&A, 487, 1171 [Google Scholar]
- Jorda, L., Lamy, P. L., Groussin, O., et al. 2010, Icarus, to be submitted [Google Scholar]
- Keller, H. U., Barbieri, C., Lamy. P. L., et al. 2007 Space Sci. Rev., 128, 26 [Google Scholar]
- Keller, H. U., Barbieri, C., Koschny, D., et al. 2010, Science, 327, 190 [NASA ADS] [CrossRef] [PubMed] [Google Scholar]
- Lamy, P. L., Toth, I., Weaver, H. A., et al. 2006, A&A, 458, 669 [NASA ADS] [CrossRef] [EDP Sciences] [Google Scholar]
- Lamy, P. L., Kaasalainen, M., Lowry, S. et al. 2008a, A&A, 487, 1179 [NASA ADS] [CrossRef] [EDP Sciences] [Google Scholar]
- Lamy, P. L., Jorda, L., Fornasier, S., et al. 2008b, A&A, 487, 1187 [NASA ADS] [CrossRef] [EDP Sciences] [Google Scholar]
- Lamy, P. L., Groussin, O., Fornasier, S., et al., 2010, A&A, 516, A74 [NASA ADS] [CrossRef] [EDP Sciences] [Google Scholar]
- Landolt, A. U. 1992, AJ, 104, 340 [NASA ADS] [CrossRef] [Google Scholar]
- Lazzarin, M., Marchi, S., Magrin, S., Barbieri, & C.Lazzarin, M. 2004, A&A, 425, L25 [Google Scholar]
- Lazzarin, M., Marchi, S., Moroz, L. V., & Magrin, S. 2009, A&A, 498, 307 [NASA ADS] [CrossRef] [EDP Sciences] [Google Scholar]
- Lee, W., & Wdowiak, T. J. 1993, ApJ, 417, L49 [NASA ADS] [CrossRef] [PubMed] [Google Scholar]
- Lupishko, D. F., & Mohamed, R. A. 1996, Icarus, 119, 209 [NASA ADS] [CrossRef] [Google Scholar]
- Lupishko, D. F., Belskaya, I. N., & Tupieva, F. A. 1983, Pis'ma Astron. Zh., 9, 691 [Google Scholar]
- Macke, R. J., Britt, D. T., & Consolmagno, G. J. 2009, Lunar and Planetary Institute Science Conference Abstracts, 40, 1598 [NASA ADS] [Google Scholar]
- Magri, C., Ostro, S. J., Rosema, K. D., et al. 1999, Icarus, 140, 379 [NASA ADS] [CrossRef] [Google Scholar]
- Merline, W., Drummond, J., Conrad, A., et al. 2010, A&A, to be submitted [Google Scholar]
- Mueller, M., Harris, A. W., Bus, S. J., et al. 2006, A&A, 447, 1153 [NASA ADS] [CrossRef] [EDP Sciences] [Google Scholar]
- Nedelcu, D. A., Birlan, M., Vernazza, et al. 2007, A&A, 470, 1157 [NASA ADS] [CrossRef] [EDP Sciences] [Google Scholar]
- Perna, D., Dotto, E., Lazzarin, M., et al. 2010, A&A, 513, L4 [NASA ADS] [CrossRef] [EDP Sciences] [Google Scholar]
- Prokof'eva-Mikhailovskaya, V. V., Batrakov, Y. V., Bochkov, V. V., Busarev, V. V., & Karachkina, L. G. 2007, Solar Syst. Res., 41, 307 [NASA ADS] [CrossRef] [Google Scholar]
- Rivkin, A. S., Howell, E. S., Lebofsky, L. A., Clark, B. E., & Britt, D. T. 2000, Icarus, 145, 351 [NASA ADS] [CrossRef] [Google Scholar]
- Roettger, E. E., & Buratti, B. J. 1994, Icarus, 112, 496 [NASA ADS] [CrossRef] [Google Scholar]
- Russell, H. N. 1916, ApJ, 43, 173 [NASA ADS] [CrossRef] [Google Scholar]
- Shepard, M. K.; Clark, B. E., Nolan, M. C., et al. 2008, Icarus, 195, 184 [NASA ADS] [CrossRef] [Google Scholar]
- Spjuth, S., Jorda, L., Lamy, P. L., et al. 2010, Icarus, submitted [Google Scholar]
- Tedesco & Veeder, 1992, in The IRAS Minor planet Survey, Tech. Rep. PL-TR-92-2049, Phillips Laboratory, Hanscom Air Force Base, Massachusetts [Google Scholar]
- Tholen, D. J. 1989, in Asteroids II (Univ. of Arizona Press), 1139 [Google Scholar]
- Torppa, J., Kaasalainen, M., Michalowski, T., et al. 2003, Icarus, 164, 346 [NASA ADS] [CrossRef] [Google Scholar]
- Vernazza, P., Brunetto, R., Binzel, R. P., et al. 2009, Icarus, 202, 477 [NASA ADS] [CrossRef] [Google Scholar]
- Weaver, H. A., Feldman, P. D., Merline, W. J., et al. 2010, A&A, 518, A4 [NASA ADS] [CrossRef] [EDP Sciences] [Google Scholar]
- Zellner, B., & Gradie, J. 1976, AJ, 81, 262 [NASA ADS] [CrossRef] [Google Scholar]
- Zellner, B., Wisniewski, W. Z., Andersson, L., & Bowell, E. 1975, AJ, 80, 986 [NASA ADS] [CrossRef] [Google Scholar]
Footnotes
- ... observations
- Photometric tables (Tables 4 to 8) are only available in electronic form at
the CDS via anonymous ftp to cdsarc.u-strasbg.fr (130.79.128.5) or via
http://cdsarc.u-strasbg.fr/viz-bin/qcat?J/A+A/521/A19
All Tables
Table 1: Summary of the observations of 21 Lutetia obtained with the OSIRIS-NAC using 12 filters.
Table 2: Determinations of the geometric albedo of 21 Lutetia.
Table 3: Color indices of asteroid 21 Lutetia.
All Figures
|
|
Figure 1: Spectral transmissions of the 12 OSIRIS-NAC filters normalized to their peak values. Standard Johnson-Kron-Cousins UBVRI bands are overplotted using different dashed/dotted lines for comparison. |
| Open with DEXTER | |
| In the text | |
|
|
Figure 2: Enlarged subframe images of asteroid 21 Lutetia obtained with the 12 OSIRIS-NAC filters. Each one is centered on Lutetia highlighted by a circle. Note the excellent tracking by the spacecraft. |
| Open with DEXTER | |
| In the text | |
|
|
Figure 3: Left panel: image of the sum of the individual 26 co-registered images obtained with the F22 filter where the asteroid appears as a bright linear track. Right panel: image of the reference background for the F22 filter. |
| Open with DEXTER | |
| In the text | |
|
|
Figure 4: Relative spectral reflectivity of asteroid 21 Lutetia used for calculating the color corrections applied to the zero points of the photometric transformation formulae. |
| Open with DEXTER | |
| In the text | |
|
|
Figure 5: Light curves of asteroid 21 Lutetia. The UBVRI reduced magnitudes are plotted as function of the MJD. |
| Open with DEXTER | |
| In the text | |
|
|
Figure 6:
Folded V band light curve of asteroid 21 Lutetia. The
|
| Open with DEXTER | |
| In the text | |
|
|
Figure 7: Three-dimensional views of asteroid 21 Lutetia as seen by the OSIRIS/NAC at four different rotational phases corresponding to the extrema of the light curve. Left column: the present shape model, right column: ellipsoid model from Drummond et al. (2010). |
| Open with DEXTER | |
| In the text | |
|
|
Figure 8: Ratios of the fluxes obtained with the reference F22 filter to those obtained with the other filters and the F41/F16 ratio ( bottom panel). The fluxes are plotted versus rotational phase and the black/red symbols distinguish the two successive rotations of Lutetia. The dashed lines correspond to the mean values of the respective data sets. Upper limits of the variations are given in each panel. |
| Open with DEXTER | |
| In the text | |
|
|
Figure 9:
Phase function
|
| Open with DEXTER | |
| In the text | |
|
|
Figure 10: Relative spectral reflectance of asteroid 21 Lutetia. Our results (data points) are compared with the spectra of Barucci et al. (2005) and of Perna et al. (2010). |
| Open with DEXTER | |
| In the text | |
|
|
Figure 11: Spectral albedo of asteroid 21 Lutetia. The IUE data points correspond to the original data from Roettger & Buratti (1994) and appear as open circles, while the one at 267nm has been corrected by Weaver et al. (2010) and appears as a filled circle. The curve going through the NAC data points corresponds to the spectrum of Barucci et al. (2005), while the curve going through the HST data points corresponds to the best estimate by Weaver et al. (2010). |
| Open with DEXTER | |
| In the text | |
Copyright ESO 2010
Current usage metrics show cumulative count of Article Views (full-text article views including HTML views, PDF and ePub downloads, according to the available data) and Abstracts Views on Vision4Press platform.
Data correspond to usage on the plateform after 2015. The current usage metrics is available 48-96 hours after online publication and is updated daily on week days.
Initial download of the metrics may take a while.