| Issue |
A&A
Volume 520, September-October 2010
|
|
|---|---|---|
| Article Number | A40 | |
| Number of page(s) | 15 | |
| Section | Planets and planetary systems | |
| DOI | https://doi.org/10.1051/0004-6361/201014296 | |
| Published online | 28 September 2010 | |
Methane, ammonia, and their irradiation products at the surface of an intermediate-size KBO?
A portrait of Plutino (90482) Orcus
A. Delsanti1,2 - F. Merlin3 - A. Guilbert-Lepoutre4 - J. Bauer5 - B. Yang6 - K. J. Meech6
1 - Laboratoire d'Astrophysique de Marseille, Université de Provence,
CNRS, 38 rue Frédéric Joliot-Curie, 13388 Marseille Cedex 13, France
2 - Observatoire de Paris, Site de Meudon, 5 place Jules Janssen, 92190
Meudon, France
3 - University of Maryland, Department of Astronomy, College Park MD
20742, USA
4 - UCLA, Earth and Space Sciences department, 595 Charles E. Young
Drive East, Los Angeles CA 90095, USA
5 - Jet Propulsion Laboratory, M/S 183-501, 4800 Oak Grove Drive,
Pasadena, CA 91109, USA
6 - NASA Astrobiology Institute at Manoa, Institute for Astronomy, 2680
Woodlawn Drive, Honolulu, Hawaii 96822-1839, USA
Received 20 February 2010 / Accepted 31 May 2010
Abstract
Orcus is an intermediate-size 1000 km-scale Kuiper belt object
(KBO) in 3:2 mean-motion resonance with Neptune, in an orbit very
similar to that of Pluto. It has a water-ice dominated surface with
solar-like visible colors. We present visible and near-infrared
photometry and spectroscopy obtained with the Keck
10 m-telescope (optical) and the Gemini 8 m-telescope
(near-infrared). We confirm the unambiguous detection of crystalline
water ice as well as absorption in the 2.2 ![]() region. These spectral properties are close to those observed for
Pluto's larger satellite Charon, and for Plutino (208996)
2003 AZ84. Both in the visible and
near-infrared Orcus' spectral properties appear to be homogeneous over
time (and probably rotation) at the resolution available. From Hapke
radiative transfer models involving intimate mixtures of various ices
we find for the first time that ammonium (NH4+)
and traces of ethane (C2H6),
which are most probably solar irradiation products of ammonia and
methane, and a mixture of methane and ammonia
(diluted or not) are the best candidates to improve the description of
the data with respect to a simple water ice mixture (Haumea type
surface). The possible more subtle structure of the 2.2
region. These spectral properties are close to those observed for
Pluto's larger satellite Charon, and for Plutino (208996)
2003 AZ84. Both in the visible and
near-infrared Orcus' spectral properties appear to be homogeneous over
time (and probably rotation) at the resolution available. From Hapke
radiative transfer models involving intimate mixtures of various ices
we find for the first time that ammonium (NH4+)
and traces of ethane (C2H6),
which are most probably solar irradiation products of ammonia and
methane, and a mixture of methane and ammonia
(diluted or not) are the best candidates to improve the description of
the data with respect to a simple water ice mixture (Haumea type
surface). The possible more subtle structure of the 2.2 ![]() band(s) should be investigated thoroughly in the future for Orcus and
other intermediate size Plutinos to better understand the methane and
ammonia chemistry at work, if any. We investigated the thermal history
of Orcus with a new 3D thermal evolution model. Simulations over
band(s) should be investigated thoroughly in the future for Orcus and
other intermediate size Plutinos to better understand the methane and
ammonia chemistry at work, if any. We investigated the thermal history
of Orcus with a new 3D thermal evolution model. Simulations over ![]() 109 yr
with an input 10% porosity, bulk composition of 23% amorphous
water ice and 77% dust (mass fraction), and cold accretion
show that even with the action of long-lived radiogenic elements only,
Orcus should have a melted core and most probably suffered a
cryovolcanic event in its history which brought large amounts of
crystalline ice to the surface. The presence of ammonia in the interior
would strengthen the melting process. A surface layer of a few hundred
meters to a few tens of kilometers of amorphous water ice survives,
while most of the remaining volume underneath contains crystalline ice.
The crystalline water ice possibly brought to the surface by a past
cryovolcanic event should still be detectable after several billion
years despite the irradiation effects, as demonstrated by recent
laboratory experiments.
109 yr
with an input 10% porosity, bulk composition of 23% amorphous
water ice and 77% dust (mass fraction), and cold accretion
show that even with the action of long-lived radiogenic elements only,
Orcus should have a melted core and most probably suffered a
cryovolcanic event in its history which brought large amounts of
crystalline ice to the surface. The presence of ammonia in the interior
would strengthen the melting process. A surface layer of a few hundred
meters to a few tens of kilometers of amorphous water ice survives,
while most of the remaining volume underneath contains crystalline ice.
The crystalline water ice possibly brought to the surface by a past
cryovolcanic event should still be detectable after several billion
years despite the irradiation effects, as demonstrated by recent
laboratory experiments.
Key words: Kuiper belt objects: individual: (90482) Orcus - methods: observational - methods: numerical - techniques: photometric - techniques: spectroscopic - radiative transfer
1 Introduction
In the past decade, several large Kuiper belt objects (KBOs) have been discovered, unveiling the upper part of the size distribution of these outer Solar System minor bodies. Eris, discovered in 2003 (Brown et al. 2005), is the largest object known to date, and its diameter in the 2500-3000 km range, exceeding that of Pluto, motivated the discussion and the creation of a new class of objects in 2006: the dwarf planets. Several other large objects were discovered since 2003 (Sedna, Makemake, Haumea, etc.) and focused the interest of scientists: the largest of them soon revealed a volatile-rich surface, dominated by methane, as for Pluto.
Orcus was discovered in 2004 as one of the largest known KBOs
(Brown et al. 2004)
and is a peculiar object from several aspects. It
revolves around the Sun in a Pluto-like orbit, in 3:2 mean
motion
resonance with Neptune (with a semi-major axis of 39.16 AU, an
inclination of 20.6![]() ,
an eccentricity 0.23, a perihelion of
30.26 AU and an aphelion at 48.06 AU). It is currently
outbound, very
close to aphelion. With its
,
an eccentricity 0.23, a perihelion of
30.26 AU and an aphelion at 48.06 AU). It is currently
outbound, very
close to aphelion. With its ![]() 950 km
diameter
(Brown
et al. 2010; Stansberry et al. 2008),
it is now part of the
intermediate-size objects, and is probably in a transition regime with
respect to volatile surface content. Indeed, smaller KBOs with mostly
featureless near-IR reflectance spectra seem to be totally depleted in
volatiles (see Guilbert
et al. 2009, and references therein), while the
largest KBOs show evidence for the presence of volatile ices such as
methane and sometimes molecular nitrogen (like Eris, Sedna and
Makemake, cf. Brown
et al. 2007a; Merlin et al. 2009; Barucci
et al. 2005, and references
therein). A simple model of atmospheric
escape of volatiles dedicated to the Kuiper belt region was computed
by Schaller & Brown (2007b)
and showed that the objects that are too small
and too hot will most probably lose their pristine volatile surface
inventory (such as CO, CH4 and N2)
over the age of the Solar
System, while large and cold objects could have retained these
volatiles to the present day. Objects in an intermediate regime could
have lost some volatiles but retained others, following the different
loss rates at work for the various species. According to this model,
Orcus should have lost all its volatile content. However, traces of
methane (to be confirmed) could explain the near-infrared spectrum of
Orcus (Barucci et al. 2008).
This object can therefore provide key
constraints on the current surface volatile inventory of
intermediate-size KBOs.
950 km
diameter
(Brown
et al. 2010; Stansberry et al. 2008),
it is now part of the
intermediate-size objects, and is probably in a transition regime with
respect to volatile surface content. Indeed, smaller KBOs with mostly
featureless near-IR reflectance spectra seem to be totally depleted in
volatiles (see Guilbert
et al. 2009, and references therein), while the
largest KBOs show evidence for the presence of volatile ices such as
methane and sometimes molecular nitrogen (like Eris, Sedna and
Makemake, cf. Brown
et al. 2007a; Merlin et al. 2009; Barucci
et al. 2005, and references
therein). A simple model of atmospheric
escape of volatiles dedicated to the Kuiper belt region was computed
by Schaller & Brown (2007b)
and showed that the objects that are too small
and too hot will most probably lose their pristine volatile surface
inventory (such as CO, CH4 and N2)
over the age of the Solar
System, while large and cold objects could have retained these
volatiles to the present day. Objects in an intermediate regime could
have lost some volatiles but retained others, following the different
loss rates at work for the various species. According to this model,
Orcus should have lost all its volatile content. However, traces of
methane (to be confirmed) could explain the near-infrared spectrum of
Orcus (Barucci et al. 2008).
This object can therefore provide key
constraints on the current surface volatile inventory of
intermediate-size KBOs.
So far, Orcus' rotation properties are not uniquely defined:
0.03 to
0.18 mag amplitude variations are measured over a period
ranging
from ![]() 7 to 21h (Duffard et al. 2009,
and references therein),
although Sheppard (2007)
finds no lightcurve variations within the
photometric uncertainties of his measurements. Such a flat lightcurve
could be diagnostic of a very slow rotation rate, a small peak-to-peak
lightcurve variation or a nearly pole-on geometric aspect. Also, given
the size of Orcus and the relatively slow rotation rate, we can most
probably expect a circular shape from the relaxation of a fluid body
in hydrostatic equilibrium.
7 to 21h (Duffard et al. 2009,
and references therein),
although Sheppard (2007)
finds no lightcurve variations within the
photometric uncertainties of his measurements. Such a flat lightcurve
could be diagnostic of a very slow rotation rate, a small peak-to-peak
lightcurve variation or a nearly pole-on geometric aspect. Also, given
the size of Orcus and the relatively slow rotation rate, we can most
probably expect a circular shape from the relaxation of a fluid body
in hydrostatic equilibrium.
Table 1: Summarized properties of the Orcus/Vanth binary system.
To date, Orcus is known to have a single relatively large companion, Vanth, in a close circular orbit (see details in Table 1). According to Brown et al. (2010), the satellite is on a nearly face-on orbit (with respect to the Sun). Again, Orcus seems to be a unique case in an intermediate regime: larger KBOs have relatively small satellites in circular orbits, while small KBOs have very large satellites (Noll et al. 2008). As described by Brown et al. (2010), two scenarios could be invoked to explain the creation of the Orcus binary system which we will summarize below. In any case, because the orbit is circular, tidal evolution was at work at some point of the system's history. First, a catastrophic collision could be at the origin of the formation of Vanth, as hypothesized for Pluto-Charon (Canup 2005). Because of the large inclination of Vanth's orbit, Kozai cycling (Perets & Naoz 2009) could also have occurred. A second scenario would then be an initial capture of Vanth, followed by large oscillations of eccentricity an inclination (Kozai cycling), and when the pericenter drops to a low enough value, tidal evolution can finally lead the orbit to its current circular shape. As noted by Brown et al. (2010), a future discovery of any Orcus coplanar satellite would rule out this possibility (as for the Pluto-Charon system). Relative color measurements by the same team indicate that Vanth is significantly redder than Orcus (another unique property among KBO binaries), a characteristic that is currently difficult to understand in the framework of a formation by a giant impact.
In this work, we review the existing spectroscopic
investigations of
Orcus and objects with similar spectral and physical properties and
search for additional constraints on the presence of volatiles (and
maybe their irradiation products) on an object that might have
retained some of its original content. We first report additional
0.4-2.5 ![]() photometry and spectroscopy obtained from the Mauna
Kea large telescopes. We present Hapke radiative transfer modeling of
the spectral data, the testing for the presence of water ice, methane
and ammonia ices (and their irradiation products, ethane and ammonium
resp.) at the surface and discuss the results. Finally, we use a new
3D thermal evolution model dedicated to the interiors of KBOs
(Guilbert-Lepoutre et al.
2010) to describe Orcus' thermal history over the age of
the Solar System and the observable consequences of this history on
the current surface.
photometry and spectroscopy obtained from the Mauna
Kea large telescopes. We present Hapke radiative transfer modeling of
the spectral data, the testing for the presence of water ice, methane
and ammonia ices (and their irradiation products, ethane and ammonium
resp.) at the surface and discuss the results. Finally, we use a new
3D thermal evolution model dedicated to the interiors of KBOs
(Guilbert-Lepoutre et al.
2010) to describe Orcus' thermal history over the age of
the Solar System and the observable consequences of this history on
the current surface.
2 Observations and data reduction
2.1 Visible data
Table 2:
Comparison of the visible spectral slope S (in %/100 nm) as computed
from linear regression using the same algorithm on published data and
our work over the common spectral range (0.51-0.76 ![]() m).
m).
Table 3: Near-infrared photometry from Gemini+NIRI (this work) and near-infrared published colors from Orcus.
Visible spectra of Orcus were acquired in visitor mode on 2005
April 9, at the Keck-1 telescope with the LRIS-RB (Low
Resolution Imaging Spectrometer, Oke
et al. 1995) instrument mounted at the Cassegrain
focus. Beam-splitters separate the light between two arms, red and
blue. The field of view (FOV) of both arms is ![]() 7
7![]()
![]() 6.8
6.8![]() .
The blue side is equipped with a mosaic of two 2 K
.
The blue side is equipped with a mosaic of two 2 K ![]() 4 K
Marconi (E2V) CCDs with a plate scale of 0.135
4 K
Marconi (E2V) CCDs with a plate scale of 0.135
![]() /pixel. The red arm has a
Tektronik 2048 K
/pixel. The red arm has a
Tektronik 2048 K ![]() 2048 K
detector with a scale of 0.211
2048 K
detector with a scale of 0.211
![]() /pixel. We used the gratings
400/3400 on the blue side and 400/8500 on the red side with dichroic
560. The resulting wavelength coverage is 0.37-0.83
/pixel. We used the gratings
400/3400 on the blue side and 400/8500 on the red side with dichroic
560. The resulting wavelength coverage is 0.37-0.83 ![]() with a resolution of
with a resolution of ![]() 350.
We used a long slit of one arcsec width that we maintained along the
parallactic angle during all the observations to minimize the loss of
flux due to the atmospheric refraction. Arc images were obtained from
Hg/Ne/Cd/Zn lamp frames on the blue side and Ne/Ar lamp frames on the
red side. To avoid additional known distortion effects due to the
telescope flexure, we acquired spectral flat-field and arc frames for
each science telescope position.
350.
We used a long slit of one arcsec width that we maintained along the
parallactic angle during all the observations to minimize the loss of
flux due to the atmospheric refraction. Arc images were obtained from
Hg/Ne/Cd/Zn lamp frames on the blue side and Ne/Ar lamp frames on the
red side. To avoid additional known distortion effects due to the
telescope flexure, we acquired spectral flat-field and arc frames for
each science telescope position.
We corrected the spectral images for bias, flat-field and
cosmic rays with the IRAF (Tody 1986)
spectroscopy pack, which we also used to calibrate the wavelength. For
each instrument arm, we extracted the spectra using IRAF/APEXTRACT
APALL task and merged them into a single 1D spectrum. It was corrected
by a solar analog (HD 126053) observed close in airmass and
time and normalized to unity around 0.55 ![]() m. The resulting 2700 s spectrum (which
is a combination of three individual spectra, 900 s each) is
presented in Fig. 1.
We do not believe that the slight turn-off at 0.42
m. The resulting 2700 s spectrum (which
is a combination of three individual spectra, 900 s each) is
presented in Fig. 1.
We do not believe that the slight turn-off at 0.42 ![]() m is real.
We inspected the three individual spectra and found that although the
overall spectral slope remains consistent from spectrum to spectrum,
small variations were observed near the blue end of the individual
spectra, which may be caused by the poor CCD sensitivity in this
wavelength region. Therefore, we concluded that the slight turn-down
feature that appears at 0.42
m is real.
We inspected the three individual spectra and found that although the
overall spectral slope remains consistent from spectrum to spectrum,
small variations were observed near the blue end of the individual
spectra, which may be caused by the poor CCD sensitivity in this
wavelength region. Therefore, we concluded that the slight turn-down
feature that appears at 0.42 ![]() m in the combined spectrum of Orcus is not real,
but an artifact.
m in the combined spectrum of Orcus is not real,
but an artifact.
We also acquired a series of V band images (through the
broadband filter centered at 5437 ![]() and with a FWHM of 922
and with a FWHM of 922 ![]() )
to monitor the photometry over the course of the spectroscopy
observations. Data reduction, photometric calibration and measurements
were applied following a method described in Delsanti
et al. (2001). We found an average value of
)
to monitor the photometry over the course of the spectroscopy
observations. Data reduction, photometric calibration and measurements
were applied following a method described in Delsanti
et al. (2001). We found an average value of
![]() ,
which
corresponds to
,
which
corresponds to
![]() (with r
and
(with r
and ![]() the helio- and geocentric distance respectively in AU). Rabinowitz et al. (2007)
found a value of
the helio- and geocentric distance respectively in AU). Rabinowitz et al. (2007)
found a value of ![]() from their solar phase curve study. They published a phase correction
coefficient for Orcus of
from their solar phase curve study. They published a phase correction
coefficient for Orcus of ![]() mag deg-1
in V. As we observed with a phase angle of
0.99
mag deg-1
in V. As we observed with a phase angle of
0.99![]() ,
our phase-corrected absolute magnitude is therefore
,
our phase-corrected absolute magnitude is therefore
![]() .
.
![\begin{figure}
\par\includegraphics[width=8.7cm]{14296fg01.eps}
\end{figure}](/articles/aa/full_html/2010/12/aa14296-10/img33.png)
|
Figure 1:
A compilation of available visible spectra of Orcus, presented at a
resolution of |
| Open with DEXTER | |
2.2 Near-infrared data
Data were acquired in queue mode at the Gemini North Telescope with
the NIRI (Near InfraRed Imager) instrument on UT 2005 February 20-22
and UT March 1, (see Table 4). The
detector is a
![]() ALADDIN InSb array. We used
the f/6 camera, which gives a
FOV of 120
ALADDIN InSb array. We used
the f/6 camera, which gives a
FOV of 120![]()
![]() 120
120![]() and a pixel scale of 0.117 arcsec/pixel in
imaging. Photometry was acquired through the broadband filters J,
H, Kshort, centered
at 1.25, 1.65, 2.15
and a pixel scale of 0.117 arcsec/pixel in
imaging. Photometry was acquired through the broadband filters J,
H, Kshort, centered
at 1.25, 1.65, 2.15 ![]() m respectively. We used the
GEMINI NIRI package to produce the master dark and flat-field
frames. To correct for the sky background contribution and recombine
the sub-frames into the final image, we used the IRAF/XDIMSUM
package. We measured the object flux using an aperture correction
method (see Delsanti
et al. 2004, for details on the complete
procedure). Photometric coefficients (zero-point,
extinction) were obtained from a least-square fit for the standard
star flux measurements. Results are presented in Table 3. Our
near-infrared colors are compatible with
those of de Bergh et al.
(2005).
m respectively. We used the
GEMINI NIRI package to produce the master dark and flat-field
frames. To correct for the sky background contribution and recombine
the sub-frames into the final image, we used the IRAF/XDIMSUM
package. We measured the object flux using an aperture correction
method (see Delsanti
et al. 2004, for details on the complete
procedure). Photometric coefficients (zero-point,
extinction) were obtained from a least-square fit for the standard
star flux measurements. Results are presented in Table 3. Our
near-infrared colors are compatible with
those of de Bergh et al.
(2005).
We acquired the spectra through the 6-pixel wide slit and the
f/6 J grism (1.00-1.36 ![]() m useful range with the ``blue'' slit,
resolution of
m useful range with the ``blue'' slit,
resolution of ![]() 480),
H grism (1.43-1.96
480),
H grism (1.43-1.96 ![]() m,
m,
![]() ), and
K grism (1.90-2.49
), and
K grism (1.90-2.49 ![]() m,
m, ![]() ). Circumstances are detailed
in
Table 4.
We used the usual AB nodding technique to
acquire the sub-frames of a cube of data (the telescope was dithered
by
). Circumstances are detailed
in
Table 4.
We used the usual AB nodding technique to
acquire the sub-frames of a cube of data (the telescope was dithered
by ![]() 20
20
![]() in between sub-images). Solar
analogs were observed to
correct science spectra from the telluric lines and the contribution
from the Sun's spectrum. We used the GEMINI GNIRS package to produce
the ancillary frames (dark, flatfield, arc). Cubes of dithered spectra
were corrected from the dark current, flatfield, and the distortion
effects. The AB pairs were subtracted (A-B and B-A) to correct from
the sky contribution and were re-aligned into a final composite 2D
image. The 1D spectrum was extracted with the IRAF/APEXTRACT APALL
task. Wavelength calibration was performed with IRAF/ONEDSPEC package.
in between sub-images). Solar
analogs were observed to
correct science spectra from the telluric lines and the contribution
from the Sun's spectrum. We used the GEMINI GNIRS package to produce
the ancillary frames (dark, flatfield, arc). Cubes of dithered spectra
were corrected from the dark current, flatfield, and the distortion
effects. The AB pairs were subtracted (A-B and B-A) to correct from
the sky contribution and were re-aligned into a final composite 2D
image. The 1D spectrum was extracted with the IRAF/APEXTRACT APALL
task. Wavelength calibration was performed with IRAF/ONEDSPEC package.
3 Results
3.1 A featureless neutral visible spectrum
Orcus shows a linear and featureless spectrum (within the noise level)
over the visible range, which is compatible with previously published
data. Figure 1
shows the spectra available in the
literature, presented at a resolution of ![]() (data from
this work and Fornasier
et al. 2004, were degraded to match the
(data from
this work and Fornasier
et al. 2004, were degraded to match the ![]() resolution of the
FORS2 data). We computed a linear regression using the
same algorithm for all published spectra and our work (on the
original, non-degraded data), over the wavelength range that is common
to all spectra (0.51-0.76
resolution of the
FORS2 data). We computed a linear regression using the
same algorithm for all published spectra and our work (on the
original, non-degraded data), over the wavelength range that is common
to all spectra (0.51-0.76 ![]() m) in order to compare the results:
values of the spectral slope in %/100 nm are reported in
Table 2.
They are compatible at one sigma level and are
characteristic of a quasi-neutral surface with solar colors. We do not
believe the slight turn-off at 0.4 micron is real as explained
in
Sect. 2.1.
Orcus shows very consistent visible spectral
properties over time, which strongly points to a homogeneous surface,
at least in the optical.
m) in order to compare the results:
values of the spectral slope in %/100 nm are reported in
Table 2.
They are compatible at one sigma level and are
characteristic of a quasi-neutral surface with solar colors. We do not
believe the slight turn-off at 0.4 micron is real as explained
in
Sect. 2.1.
Orcus shows very consistent visible spectral
properties over time, which strongly points to a homogeneous surface,
at least in the optical.
Table 4: List of near-infrared Gemini+NIRI spectroscopy observations.
3.2 Crystalline water ice, ammonia, and methane?
![\begin{figure}
\par\includegraphics[width=9cm]{14296fg02.eps}
\end{figure}](/articles/aa/full_html/2010/12/aa14296-10/img37.png)
|
Figure 2:
Orcus spectra taken with the K grism on 2005-02-22. Top and
bottom spectra were shifted by +0.6 and -0.6 resp. in reflectance for
clarity. The solid line is a running mean to guide the eye (smooth box
with a width of |
| Open with DEXTER | |
We adjusted the visible and near-infrared parts of the spectrum in
reflectance using the V magnitude computed
in Sect. 2.1
and near-infrared photometry from 2005 February 20, (see
Table 3
i.e. photometry that was observed simultaneously with the J band
spectrum). In the K band, we obtained two
consecutive spectra on 2005 February 22, which are plotted at
the resolution of the instrument in Fig. 2 along with the
average spectrum. The complete reconstructed spectrum at the instrument
resolutions from 0.40 to 2.35 ![]() m is presented in Fig. 4 (using the
average of K-band spectral data).
m is presented in Fig. 4 (using the
average of K-band spectral data).
In the near-infrared, the spectrum of Orcus shows deep
absorption bands centered at 1.5 ![]() m, 1.65
m, 1.65 ![]() m, 2.05
m, 2.05 ![]() m (attributed to the presence of crystalline
water ice) and smaller features around 2.2
m (attributed to the presence of crystalline
water ice) and smaller features around 2.2 ![]() m. Measured
water ice band depths and positions (using a continuum removal plus
Gaussian fitting method) are reported in Table 5. Figure 3 shows a
close-up of the data in the 1.4-2.4
m. Measured
water ice band depths and positions (using a continuum removal plus
Gaussian fitting method) are reported in Table 5. Figure 3 shows a
close-up of the data in the 1.4-2.4 ![]() m range, the synthetic reflectance spectrum of
different pure and hydrated ices, and some of their irradiation
products (with 10
m range, the synthetic reflectance spectrum of
different pure and hydrated ices, and some of their irradiation
products (with 10 ![]() m
size grains). From these, we can unambiguously identify crystalline
water ice (with the broad 1.5
m
size grains). From these, we can unambiguously identify crystalline
water ice (with the broad 1.5 ![]() m and 2.0
m and 2.0 ![]() m features and the 1.65
m features and the 1.65 ![]() m absorption
band). Methane or ammonia ices may account for the 2.2
m absorption
band). Methane or ammonia ices may account for the 2.2 ![]() m absorption
band as surmised also by Barucci
et al. (2008). However, hydrated and pure ammonia
ices do not share the same features around 2.2
m absorption
band as surmised also by Barucci
et al. (2008). However, hydrated and pure ammonia
ices do not share the same features around 2.2 ![]() m. The Orcus
spectral shape beyond 2.23
m. The Orcus
spectral shape beyond 2.23 ![]() m may also suggest the presence of methane ice.
Ethane ice is also surmised, as it is an irradiation product from
methane (Baratta et al. 2003):
both components best described the near-infrared spectral behavior of
Quaoar (Schaller &
Brown 2007a), which is very similar to that of Orcus. We also
show a spectrum of ammonium (NH4+),
as it is an irradiation product of ammonia and helped to reproduce the
2.2
m may also suggest the presence of methane ice.
Ethane ice is also surmised, as it is an irradiation product from
methane (Baratta et al. 2003):
both components best described the near-infrared spectral behavior of
Quaoar (Schaller &
Brown 2007a), which is very similar to that of Orcus. We also
show a spectrum of ammonium (NH4+),
as it is an irradiation product of ammonia and helped to reproduce the
2.2 ![]() m
features in the spectrum of Pluto's satellite Charon (Cook et al. 2009).
m
features in the spectrum of Pluto's satellite Charon (Cook et al. 2009).
Table 5: Water ice near-infrared absorption band depths and central positions for Orcus.
![\begin{figure}
\par\includegraphics[width=12cm]{14296fg03.eps}
\end{figure}](/articles/aa/full_html/2010/12/aa14296-10/img39.png)
|
Figure 3:
A close up of Orcus spectrum in H and K
bands (top, grey line) and the reflectance of, from top to
bottom: pure ammonia and, shifted by several units for
clarity, pure methane ice, amorphous water ice, crystalline water ice,
hydrated ammonia (H2O:NH3,
99:1), ammonium and ethane. Synthetic ice spectra were obtained using
Hapke theory (Hapke
1993,1981)
with the optical constants quoted in this paper and a particle size of
10 |
| Open with DEXTER | |
4 Radiative transfer modeling of the surface composition
4.1 Algorithm and parameters
To better investigate the surface properties of Orcus, we ran a radiative transfer model following the theory of Hapke (1993,1981) over the complete wavelength range available. This algorithm fits a synthetic reflectance spectrum to the data, using reflectance properties (optical constants) from a user-defined input list of chemical components, their relative amounts, and a grain size. When applying this method, one has to keep in mind that the best-fit synthetic spectrum obtained is not a unique solution to describe the object's surface composition and that some parameter values might lead to the best fit, although with no physical meaning. A detailed description of this model and its limits are presented in Merlin et al. (2010b).
We chose a symmetry parameter of v = -0.4
and a back-scattering
parameter B = 0.5. These values are close to those
computed by
Verbiscer & Helfenstein
(1998) to describe the surfaces of the icy satellites of
the giant planets. Finally, we computed the geometric albedo at zero
phase angle from Eq. (44) of Hapke
(1981). We used the
Marqvardt-Levenberg algorithm to obtain the lower reduced ![]() value for
the fit of the synthetic spectra to our data. Each synthetic
spectrum is obtained using an intimate mixture of different compounds
(from a user-defined input list). The free parameters are the grain
size and the relative amount of each chemical compound. We emphasize
that the results presented here are not unique and only show a
possible surface composition.
value for
the fit of the synthetic spectra to our data. Each synthetic
spectrum is obtained using an intimate mixture of different compounds
(from a user-defined input list). The free parameters are the grain
size and the relative amount of each chemical compound. We emphasize
that the results presented here are not unique and only show a
possible surface composition.
4.2 The choice of the chemical components
As input to the radiative transfer model, we used optical constants of
several ices at low temperature (close to 40 K) that are
likely to be
present on the surface of an icy body located at ![]() 50 AU such as:
50 AU such as:
- water ice (Grundy & Schmitt 1998);
- pure methane ice (Quirico & Schmitt 1997);
- pure ammonia ice (Schmitt et al. 1998);
- diluted ammonia ice (Ted Roush, personal comm.);
- pure methanol ice (Quirico & Schmitt, personal comm.).
Additional spectroscopic observations of Orcus in the near
infrared
(H+K band only, from Barucci et al. 2008)
showed deep absorption
features at 1.5 and 2.0 ![]() m and shallow bands at 1.65
m and shallow bands at 1.65 ![]() m and
close to 2.2
m and
close to 2.2 ![]() m.
The presence of crystalline water ice is evident
in the 1.65
m.
The presence of crystalline water ice is evident
in the 1.65 ![]() m
feature. The weak 2.2
m
feature. The weak 2.2 ![]() m feature is much more
difficult to interpret (owing to the detection level and multiple
candidate components). These authors tested Hapke models of ammonia
hydrate or pure methane ices (separately): none of these attempts
could satisfactorily reproduce the shape of the 2.2
m feature is much more
difficult to interpret (owing to the detection level and multiple
candidate components). These authors tested Hapke models of ammonia
hydrate or pure methane ices (separately): none of these attempts
could satisfactorily reproduce the shape of the 2.2 ![]() m feature,
although ammonia hydrate was the favored explanation. In this work, we
will try to better reproduce the general shape of our spectrum on the
full 0.4-2.4
m feature,
although ammonia hydrate was the favored explanation. In this work, we
will try to better reproduce the general shape of our spectrum on the
full 0.4-2.4 ![]() m
range with the help of the Hapke modeling of
mixtures of ices listed above, assuming an albedo of 0.2
(Stansberry et al. 2008).
Below, we will not discuss in detail the
various relative quantities listed in Table 6,
because we consider Hapke model results as only qualitatively
indicative of the possible candidate components. The reasons are that:
(i) synthetic models, even when accurately fitted to the data, do not
provide a unique, definitive solution; (ii) the SNR of the data
currently available for Orcus do not allow this detailed
interpretation; (iii) the optical constants from materials used here
where measured in conditions close to those that should prevail on
Orcus, but some of them are missing and approximations were used.
m
range with the help of the Hapke modeling of
mixtures of ices listed above, assuming an albedo of 0.2
(Stansberry et al. 2008).
Below, we will not discuss in detail the
various relative quantities listed in Table 6,
because we consider Hapke model results as only qualitatively
indicative of the possible candidate components. The reasons are that:
(i) synthetic models, even when accurately fitted to the data, do not
provide a unique, definitive solution; (ii) the SNR of the data
currently available for Orcus do not allow this detailed
interpretation; (iii) the optical constants from materials used here
where measured in conditions close to those that should prevail on
Orcus, but some of them are missing and approximations were used.
4.3 A simple water ice mixture
![\begin{figure}
\par\includegraphics[width=14.2cm]{14296fg04.eps}
\end{figure}](/articles/aa/full_html/2010/12/aa14296-10/img41.png)
|
Figure 4:
Visible and near-infrared spectrum of Orcus (grey line) with synthetic
spectra superimposed (solid black line). Spectra are shifted in albedo
for clarity from -0.1 to about +0.5 (except model 2). Quantitative
description of the models and reduced |
| Open with DEXTER | |
Table 6: Quantitative description of the chemical composition models with the relative percentage of each component.
Given the obvious features of water ice in its crystalline
state in
our data, our first attempt was to use a simple mixture of amorphous
and crystalline water ice at ![]() 40 K. Again, Titan
tholins were used
only to reproduce the spectral shape in the optical range (as in all
models of this work): this compound is certainly not present as such
at the surface of Orcus. Similarly, amorphous black carbon was only
used as a mean to match the low measured albedo. The corresponding
best-fit model is plotted in the bottom of Fig. 4, the
quantities are tabulated in Table 6
(model 1).
40 K. Again, Titan
tholins were used
only to reproduce the spectral shape in the optical range (as in all
models of this work): this compound is certainly not present as such
at the surface of Orcus. Similarly, amorphous black carbon was only
used as a mean to match the low measured albedo. The corresponding
best-fit model is plotted in the bottom of Fig. 4, the
quantities are tabulated in Table 6
(model 1).
The large path lengths of amorphous water ice should be taken
with
great care. Indeed, when alternatively using a blue component to fit
the continuum (using for instance the reflectance properties of
kaolinite from the ASTER database,
http://speclib.jpl.nasa.gov/search-1/mineral), the path lengths
and the proportions of amorphous water ice in the
final model
drastically drop. This indicates that crystalline water ice is most
probably dominating the mixture. All previous work on Orcus reports
the presence of water ice (Fornasier et al. 2004;
de Bergh
et al. 2005; Trujillo et al. 2005),
and the most recent higher SNR data show the presence of crystalline
water ice (Barucci et al.
2008, and this work). The crystalline water
ice fraction for this model is comparable to the one reported in
Barucci et al. (2008)
(about 15![]() ).
The depth of the absorption feature
at 1.65
).
The depth of the absorption feature
at 1.65 ![]() m
depends on the crystalline water ice abundance and
temperature of the surface. At low temperature (close to that of
Orcus,
m
depends on the crystalline water ice abundance and
temperature of the surface. At low temperature (close to that of
Orcus, ![]() 40 K),
a deep absorption feature as observed in our
spectrum (or in previous works) suggests a high
crystalline-to-amorphous water ice ratio.
40 K),
a deep absorption feature as observed in our
spectrum (or in previous works) suggests a high
crystalline-to-amorphous water ice ratio.
This first attempt shows that a simple mixture of water ice
approximately reproduces the general spectral behavior of Orcus in the
near-infrared, but fails to describe the more subtle features (at
1.65 ![]() m
and around 2.2
m
and around 2.2 ![]() m).
Orcus therefore has a water
dominated surface, but most probably hosts additional absorbing
substances, such as volatiles, in smaller amounts.
m).
Orcus therefore has a water
dominated surface, but most probably hosts additional absorbing
substances, such as volatiles, in smaller amounts.
4.4 Adding methane and ammonia ices
For this second step, we tested various ices that could absorb around
2.2 ![]() m,
contribute to the blue slope long-ward 2.3
m,
contribute to the blue slope long-ward 2.3 ![]() m and could
possibly be present on a
m and could
possibly be present on a ![]() 40 K
KBO (see also
Fig. 3
and Sect. 3.2).
In particular, ammonia
hydrate has an absorption feature around 2.21
40 K
KBO (see also
Fig. 3
and Sect. 3.2).
In particular, ammonia
hydrate has an absorption feature around 2.21 ![]() m: it was
detected
on Uranus' satellite Miranda (Bauer
et al. 2002) and possibly identified
on Quaoar (Jewitt & Luu 2004)
and Orcus (previous work
by Barucci et al. 2008).
Methane (dominating the surface composition of
large KBOs, such as Pluto, Eris or Makemake) is also an interesting
candidate, with its absorption feature around 2.2
m: it was
detected
on Uranus' satellite Miranda (Bauer
et al. 2002) and possibly identified
on Quaoar (Jewitt & Luu 2004)
and Orcus (previous work
by Barucci et al. 2008).
Methane (dominating the surface composition of
large KBOs, such as Pluto, Eris or Makemake) is also an interesting
candidate, with its absorption feature around 2.2 ![]() m and blue
reflectance in the 2.3-2.4
m and blue
reflectance in the 2.3-2.4 ![]() m range. We also included methanol in
our tests (pure CH3OH from Quirico &
Schmitt, priv. comm.)
m range. We also included methanol in
our tests (pure CH3OH from Quirico &
Schmitt, priv. comm.)
At this stage, best-fit results were obtained using a mixture
of water
ice (amorphous and crystalline), methane and
ammonia (pure or
diluted). The resulting models 2 and 3 are plotted in
Fig. 4
(see also Table 6).
They have
an equivalent reduced ![]() and reproduce almost equally the
general shape of the near infrared spectrum. The agreement of the
synthetic spectra to our data is however not totally satisfactory
around 1.65
and reproduce almost equally the
general shape of the near infrared spectrum. The agreement of the
synthetic spectra to our data is however not totally satisfactory
around 1.65 ![]() m
and 2.2
m
and 2.2 ![]() m,
although the slope beyond 2.3
m,
although the slope beyond 2.3 ![]() m
is now correctly mimicked. Only traces of methane and ammonia are
sufficient to significantly improve the fit with respect to a simple
water ice mixture. We tested the mixtures used by Barucci et al. (2008)
against our data, i.e. trying separately methane, then
ammonia hydrate (respectively mixed with water ice) but obtained a
worse fit than models 2 and 3. In particular, the
2.2
m
is now correctly mimicked. Only traces of methane and ammonia are
sufficient to significantly improve the fit with respect to a simple
water ice mixture. We tested the mixtures used by Barucci et al. (2008)
against our data, i.e. trying separately methane, then
ammonia hydrate (respectively mixed with water ice) but obtained a
worse fit than models 2 and 3. In particular, the
2.2 ![]() m
band was
poorly reproduced in both cases, and for the ammonia hydrate model,
the synthetic spectrum had a reflectance that was too high beyond
2.3
m
band was
poorly reproduced in both cases, and for the ammonia hydrate model,
the synthetic spectrum had a reflectance that was too high beyond
2.3 ![]() m.
m.
From a theoretical point of view, ammonia and methane could be major volatiles in the solar nebula at the distance where Orcus might have formed (Lewis 1972). Ammonia on one hand is known to lower the temperature of the melting point when mixed with water ice. Methane on the other hand is almost insoluble in aqueous liquids at low pressures (no electric dipole moment). At the central pressure of Orcus (few kilo-bars), its solubility should nonetheless reach about 1%. Methane could therefore trigger so-called explosive aqueous cryovolcanism in the presence of ammonia and water (Kargel 1992,1995). This process has been introduced to explain the cryovolcanism observed on Triton (Kargel & Strom 1990). Indeed, the bubble content of liquid melts would increase as they propagate toward the surface through cracks: the solubility of methane in these melts depend on the pressure, which decreases as the melts reach the surface. If the bubble content becomes sufficient, the melts would eventually disintegrate into a gas-driven spray producing the explosive cryovolcanism.
4.5 Search for daughter species of methane and ammonia
Ethane is an irradiation product (from UV photolysis) of solid ethane
(Baratta et al. 2003),
and is expected to be involatile at
![]() 40 K.
Therefore, once produced by solar irradiation, it should
remain at the surface of the object and still be
observable. Moore & Hudson
(2003) report that the production of C2H6is
more efficient when CH4 is pure. C2H6
was suggested at the
surface of Quaoar (Schaller
& Brown 2007a) and detected on dwarf
planet Makemake (Brown et al.
2007a). Since our data could be compatible
with traces of methane at the surface of Orcus, we decided to further
investigate the contribution of C2H6.
We used the optical
constants from Quirico &
Schmitt (1997). Following a similar reasoning, we
decided to test the presence of ammonium (NH4+),
which can be
produced for instance by irradiation of pure NH3
or mixtures of
water and ammonia as experienced by (Moore
et al. 2007). Other species
can be produced from the irradiation of NH3 or NH3:H2O,
such
as hydroxylamine (NH2OH); unfortunately, the
corresponding weak
infrared features are not easily detectable. In this test, we used
optical constants of NH4+
derived by Cook (priv. comm.) from
the studies by Moore et al.
40 K.
Therefore, once produced by solar irradiation, it should
remain at the surface of the object and still be
observable. Moore & Hudson
(2003) report that the production of C2H6is
more efficient when CH4 is pure. C2H6
was suggested at the
surface of Quaoar (Schaller
& Brown 2007a) and detected on dwarf
planet Makemake (Brown et al.
2007a). Since our data could be compatible
with traces of methane at the surface of Orcus, we decided to further
investigate the contribution of C2H6.
We used the optical
constants from Quirico &
Schmitt (1997). Following a similar reasoning, we
decided to test the presence of ammonium (NH4+),
which can be
produced for instance by irradiation of pure NH3
or mixtures of
water and ammonia as experienced by (Moore
et al. 2007). Other species
can be produced from the irradiation of NH3 or NH3:H2O,
such
as hydroxylamine (NH2OH); unfortunately, the
corresponding weak
infrared features are not easily detectable. In this test, we used
optical constants of NH4+
derived by Cook (priv. comm.) from
the studies by Moore et al.
We therefore tested ammonia and methane separately along with
their
respective irradiation products. Model 4 (middle quadrant of
Fig. 4)
shows a mixture of water ice, methane, and ethane,
while model 5 includes water ice, ammonia hydrate, and
ammonium. The
methane option (model 4) gives a lower reduced ![]() and overall
better fit than model 5, and is visually and statistically
equivalent
to models 2 and 3. However, ethane is finally found
not to contribute
to the final mixture (0%) when mixed with only CH4
and water ice,
which tells us that methane is itself an interesting component to
describe the H and K band
data. The ammonia and ammonium mixture model
is not satisfactory to improve the overall fit of Orcus spectrum (with
respect to other models), but the structure of the 2.2
and overall
better fit than model 5, and is visually and statistically
equivalent
to models 2 and 3. However, ethane is finally found
not to contribute
to the final mixture (0%) when mixed with only CH4
and water ice,
which tells us that methane is itself an interesting component to
describe the H and K band
data. The ammonia and ammonium mixture model
is not satisfactory to improve the overall fit of Orcus spectrum (with
respect to other models), but the structure of the 2.2 ![]() m band is
worth of interest.
m band is
worth of interest.
Table 7: Comparison of orbital and physical properties of some intermediate-large size water-bearing objects of interest.
4.6 Best-fit results and conclusions
For this last step we aimed at better describing the data overall, in
particular in the 2.2 ![]() m region, using results (and possible
candidates) derived from the previous investigation steps. Our
best-fit result overall is displayed as model 6 (top of
Fig. 4)
and includes a mixture of water ice mostly in
its crystalline state (
m region, using results (and possible
candidates) derived from the previous investigation steps. Our
best-fit result overall is displayed as model 6 (top of
Fig. 4)
and includes a mixture of water ice mostly in
its crystalline state (![]() 20%),
ammonium (
20%),
ammonium (![]() 13%)
and traces
of ethane (
13%)
and traces
of ethane (![]() 7%).
The overall shape of the Orcus spectrum is
correctly reproduced, in particular in the K band
with both the
2.05
7%).
The overall shape of the Orcus spectrum is
correctly reproduced, in particular in the K band
with both the
2.05 ![]() m
large water ice band and the 2.2
m
large water ice band and the 2.2 ![]() m region more
correctly fitted. The presence of ammonium also better reproduces the
visible slope. The 1.65
m region more
correctly fitted. The presence of ammonium also better reproduces the
visible slope. The 1.65 ![]() m feature was never completely correctly
reproduced, which could be related to the SNR of the data. Our
conclusion is that the irradiation products NH4+
and C2H6greatly helps to
describe the data in the 1.4-2.4
m feature was never completely correctly
reproduced, which could be related to the SNR of the data. Our
conclusion is that the irradiation products NH4+
and C2H6greatly helps to
describe the data in the 1.4-2.4 ![]() m region,
although both parent species, as a mixture of ammonia (pure or
diluted) and methane cannot be firmly excluded (model 2
and 3 of
equivalent statistical level). We believe that the four species are
probably present as traces at the surface of Orcus. Therefore, further
spectroscopic studies of Orcus with significanlty higher SNR
(especially in the 2.2
m region,
although both parent species, as a mixture of ammonia (pure or
diluted) and methane cannot be firmly excluded (model 2
and 3 of
equivalent statistical level). We believe that the four species are
probably present as traces at the surface of Orcus. Therefore, further
spectroscopic studies of Orcus with significanlty higher SNR
(especially in the 2.2 ![]() m region) would improve our knowledge about
the presence of the various ices (such as methane and ammonia) and
related chemical products and processes on the surface of this object.
m region) would improve our knowledge about
the presence of the various ices (such as methane and ammonia) and
related chemical products and processes on the surface of this object.
4.7 Surface composition variations over time?
We saw that the neutral, featureless (within the noise level) visible
spectral properties are consistent over a timespan of about
4 years. It is almost impossible to phase the different
spectra with the
rotational ligthcurves available because they were not observed close
enough in time. However, as Orcus does not show dramatic lightcurve
effects (see Sect. 1)
and is expected to be a spherical
object, it is reasonable to think that the surface properties are
rather homogeneous over the surface in the optical. In the
near-infrared, according to the most recent, higher SNR data
(Barucci et al. 2008,
and this work), crystalline water ice was always
present (and in the same roughly proportions as in the indicative
Hapke modeling). A 2.2 ![]() m feature was also systematically shown to
be there in the most recent works, with slightly different structures,
although we believe they are roughly consistent within the
noise. Until significantly higher SNR data are available and show more
subtle changes (as for instance Charon), we can conclude that Orcus'
spectral properties are rather homogeneous over its surface in the
near-infrared at the currently available resolution.
m feature was also systematically shown to
be there in the most recent works, with slightly different structures,
although we believe they are roughly consistent within the
noise. Until significantly higher SNR data are available and show more
subtle changes (as for instance Charon), we can conclude that Orcus'
spectral properties are rather homogeneous over its surface in the
near-infrared at the currently available resolution.
4.8 Contribution of the satellite
The known properties of the Orcus binary system are summarized in
Table 1.
Because of the small separation of the pair
(0.26
![]() Noll et al. 2008),
it is impossible to separate the
contribution of both components in our ground-based observations. The
color measurements performed with the Hubble Space Telescope
(from which the binary system can be resolved) by Brown et al. (2010) show
that Vanth displays significantly redder visible and
near-infrared colors than Orcus. The contribution of the satellite to
the total flux is 8% in the visible and a bit more in the
near-infrared. Thus, we do not expect large variations in the water
ice content of the main body. Ammonia, methane, and their irradiation
products, if confirmed, should be present at the surface of the
primary object only, as Vanth is probably too small to have retained
volatile ices at its surface. Given that the satellite's near-infrared
color index is redder than that of Orcus (as measured
by Brown et al. 2010),
we can expect that the satellite will have a lower
water ice content, if any.
Noll et al. 2008),
it is impossible to separate the
contribution of both components in our ground-based observations. The
color measurements performed with the Hubble Space Telescope
(from which the binary system can be resolved) by Brown et al. (2010) show
that Vanth displays significantly redder visible and
near-infrared colors than Orcus. The contribution of the satellite to
the total flux is 8% in the visible and a bit more in the
near-infrared. Thus, we do not expect large variations in the water
ice content of the main body. Ammonia, methane, and their irradiation
products, if confirmed, should be present at the surface of the
primary object only, as Vanth is probably too small to have retained
volatile ices at its surface. Given that the satellite's near-infrared
color index is redder than that of Orcus (as measured
by Brown et al. 2010),
we can expect that the satellite will have a lower
water ice content, if any.
5 Comparison with other water-bearing KBOs of interest
In this section we look at the surface expression of water (more specifically in its crystalline form) and additional traces of volatiles on some other large-intermediate water bearing objects. We try to point out common properties and differences, and in the case of Quaoar, infer general clues about its possible history and interior. The compared properties are summarized in Table 7.
5.1 (50000) Quaoar
The KBOs (90482) Orcus and (50000) Quaoar seem to share the same type
of near-infrared spectrum: dominated by crystalline water ice, with
small amounts of volatiles (Schaller
& Brown 2007a). Besides, they
are both intermediate-size KBOs with similar albedo
(Stansberry et al. 2008):
their study could thus shed light on the
possible transition between large methane-dominated objects (like
Pluto, Eris, Sedna and Makemake) and smaller water-ice-dominated
ones. Nonetheless, these two objects might be very different when it
comes to their thermal and dynamical history. Moreover, their visible
spectral properties differ: Quaoar, with its ![]() 28%/100 nm slope,
is part of the objects hosting ultra-red material
(>25%/100 nm, Jewitt
2002) on its surface. Tables 7
and 8
show a comparison between
various physical and dynamical properties of Orcus and Quaoar.
28%/100 nm slope,
is part of the objects hosting ultra-red material
(>25%/100 nm, Jewitt
2002) on its surface. Tables 7
and 8
show a comparison between
various physical and dynamical properties of Orcus and Quaoar.
In this table, the maximum surface temperature is computed
from a
thermal balance for the whole surface including different energy
inputs such as: the incoming solar energy,
|
(1) |
(with
|
(2) |
with
Table 8: Comparison of Orcus and Quaoar additional parameters.
Quaoar is a classical KBO and as such should have been formed in situ, or was moderately pushed outward during Neptune's migration (Gomes 2003). Therefore, it should have been formed on a larger timescale than Orcus, implying potentially less accretional heating. Orcus is a Plutino and might have been formed closer to the Sun than its current location (Malhotra 1995,1993). We can thus suspect that its accretion was faster and involved more heat. The early thermal history of both objects in this sense might be quite different. Nonetheless, because of their rather large sizes and densities, they could have both reached temperatures sufficient to melt water ice and produce a differentiated internal structure (i.e. after heating by short-lived radiogenic elements, the interior should be stratified, with a differentiated core and layers enriched/impoverished in volatile ices closer from the surface).
The abundance of radiogenic elements is directly related to the dust mass fraction within the body: the denser an icy body is, the more heat will be released upon the decay of these radiogenic elements. Considering Quaoar's high density, we can assess that it might have suffered from severe thermal modifications due to the decay of long-lived radiogenic elements such as 40K, 232Th, 235U, 238U. Therefore, the methane observed at its surface could have been placed there in a quite recent past, although the object should be geologically dead for millions years. The subsequent surface evolution should have been dominated by space-weathering processes. Orcus is less dense than Quaoar: a thermal evolution model is applied to test if long-lived radiogenic elements could have heated the object in the last million years, so that the effects on the surface would still be observable today (see Sect. 6).
5.2 The Haumea collisional family
(136108) Haumea is a 2000 km-class fast-rotating elongated dwarf planet from the classical Kuiper belt with the highest water ice surface content currently known among KBOs and a neutral visible spectrum (see Pinilla-Alonso et al. 2009; Merlin et al. 2007, and references therein). Brown et al. (2007b) identified several objects with similar spectral properties in a dynamical area that is close to Haumea. Because Haumea's unusual rotational properties are compatible with a giant impact, it was soon suggested that these objects are members of the first collisional family identified in the Kuiper belt. Repeated spectral and photometric studies (Snodgrass et al. 2009; Barkume et al. 2008; Schaller & Brown 2007b; Pinilla-Alonso et al. 2007; Rabinowitz et al. 2008; Pinilla-Alonso et al. 2008) aimed at refining the family properties and members list.
From these studies, we see that despite the presence of water ice and the neutral visible spectrum, the other properties of the Haumea collisional family differ from those of Orcus. Haumea itself has a much higher albedo (0.6-0.84 Rabinowitz et al. 2006; Stansberry et al. 2008), and density (2600-3340 kg m-3 Rabinowitz et al. 2006) and much deeper water ice absorption bands. Pinilla-Alonso et al. (2009) showed that it has a spectrally homogeneous surface best described by a simple intimate mixture of amorphous and crystalline water ice and that it is probably depleted of any other ices. As a consequence, cryovolcanism cannot be invoked as possible a re-surfacing process, whereas it might play a role in Orcus' evolution. In this work, we also showed that a simple water ice mixture (Haumea-type surface) fails to completely reproduce Orcus' spectral behavior in the near-infrared (see model 1).
5.3 Charon
Pluto's larger satellite Charon is a ![]() 1200 km size body
with a
water ice dominated surface. Charon and Orcus are of similar size and
density (1.5-1.9 g cm-1), on a
similar orbit, and share common
spectral properties. However, their albedos are quite different, as
Charon was measured to have a visible geometric albedo of
1200 km size body
with a
water ice dominated surface. Charon and Orcus are of similar size and
density (1.5-1.9 g cm-1), on a
similar orbit, and share common
spectral properties. However, their albedos are quite different, as
Charon was measured to have a visible geometric albedo of ![]() 0.40
(computed from Buie et al.
2010). Crystalline water ice is
unambiguously detected and leads to a surface temperature estimate of
40-50 K (Cook et al.
2007), which is in the same range as that of Orcus
(44 K from Barucci
et al. 2008). Another component absorbing at
2.21
0.40
(computed from Buie et al.
2010). Crystalline water ice is
unambiguously detected and leads to a surface temperature estimate of
40-50 K (Cook et al.
2007), which is in the same range as that of Orcus
(44 K from Barucci
et al. 2008). Another component absorbing at
2.21 ![]() m
is preferably attributed to ammonia-type ices from detailed
Hapke modeling (Merlin
et al. 2010a, and references therein), and
it seems that the surface is variegated (differences between the Pluto
and anti-Pluto hemispheres). Recent high SNR K-band
spectral studies
(Cook et al. 2009)
suggested for the first time that ammonium could be
present at the surface of Charon, as it helps to better model the
absorption features they detected around 2.21 and
2.24
m
is preferably attributed to ammonia-type ices from detailed
Hapke modeling (Merlin
et al. 2010a, and references therein), and
it seems that the surface is variegated (differences between the Pluto
and anti-Pluto hemispheres). Recent high SNR K-band
spectral studies
(Cook et al. 2009)
suggested for the first time that ammonium could be
present at the surface of Charon, as it helps to better model the
absorption features they detected around 2.21 and
2.24 ![]() m.
Their
best-fit Hapke model includes a mixture of water, ammonium, methane,
and ammonia hydrate. In this work, we tried to fit to our data a
similar synthetic spectrum: we obtained a reduced
m.
Their
best-fit Hapke model includes a mixture of water, ammonium, methane,
and ammonia hydrate. In this work, we tried to fit to our data a
similar synthetic spectrum: we obtained a reduced ![]() of 1.68 (e.g. of lower quality than our best-fit options),
although
the general spectral features of Orcus were correctly reproduced. This
confirms the similarities of Orcus and Charon bulk surface
properties. Also, Desch
et al. (2009) identified from their 1D-spherical
thermal model of Charon that cryovolcanism is the most probable
mechanism to provide fresh ices on the surface. From our own thermal
model (see Sect. 6),
we draw a similar conclusion
for the case of Orcus.
of 1.68 (e.g. of lower quality than our best-fit options),
although
the general spectral features of Orcus were correctly reproduced. This
confirms the similarities of Orcus and Charon bulk surface
properties. Also, Desch
et al. (2009) identified from their 1D-spherical
thermal model of Charon that cryovolcanism is the most probable
mechanism to provide fresh ices on the surface. From our own thermal
model (see Sect. 6),
we draw a similar conclusion
for the case of Orcus.
5.4 Plutino (208996) 2003 AZ84
(208996) 2003 AZ84 is, like Orcus, a
binary Plutino wandering in a
30-50 AU heliocentric region. It is presently located at a similar
heliocentric distance, ![]() 46 AU
(wrt
46 AU
(wrt ![]() 48 AU
for
Orcus). (208996) has a quasi-neutral featureless spectrum in the
optical, with a spectral slope of 1.6
48 AU
for
Orcus). (208996) has a quasi-neutral featureless spectrum in the
optical, with a spectral slope of 1.6 ![]() 0.6%/100 nm (Fornasier et al. 2009,
and
references therein). Guilbert
et al. (2009) confirmed the
presence of water ice (Barkume
et al. 2008) in its crystalline phase from
near-infrared spectroscopy, and noted a possible absorption feature
around 2.3
0.6%/100 nm (Fornasier et al. 2009,
and
references therein). Guilbert
et al. (2009) confirmed the
presence of water ice (Barkume
et al. 2008) in its crystalline phase from
near-infrared spectroscopy, and noted a possible absorption feature
around 2.3 ![]() m.
The SNR of the data is not sufficient to identify
the corresponding absorbing substance. However, the general spectral
behavior of Plutino (208996) is close to that of Orcus, and joint
studies deserve to be conducted in the future.
m.
The SNR of the data is not sufficient to identify
the corresponding absorbing substance. However, the general spectral
behavior of Plutino (208996) is close to that of Orcus, and joint
studies deserve to be conducted in the future.
6 A thermal-evolution model of Orcus
6.1 The model
We used a thermal-evolution model in order to evaluate the possibility for Orcus to undergo some internal activity events such as cryovolcanism in a recent past, so that the effects might still be observable at the surface. From input orbit, size, albedo, density, porosity, formation delay and type of radiogenic elements, we simulated the evolution of temperature over the age of the Solar System for the whole object. In this model, the heat diffusion equation (Eq. (3)) is solved using a fully 3D scheme, considering internal heating due to the crystallization of amorphous water ice, as well as heating due to the decay of several short- and long-lived radiogenic elements. We therefore need to solve the equation
where T is the temperature distribution we need to determine,
|
(4) |
with
Table 9: Physical parameters of various short-period (SP) and long-period (LP) radiogenic elements considered in the model.
The heat source due to the crystallization of amorphous water
ice is
described by
|
(5) |
with
|
(6) |
The heat diffusion equation is then expanded on the real spherical harmonics basis. The resulting equation is numerically solved using an implicit stable Crank Nicolson scheme. A full description of this model can be found in Guilbert-Lepoutre et al. (2010).
Several physical parameters have to be initialized before
simulating
the thermal evolution of Orcus. We first assume that the object is on
its current orbit for the whole simulation and is placed there right
after its formation time. This does not reflect the true dynamical
evolution of Orcus, but might not strongly affect the resulting
general thermal behavior (as detailed in the next paragraphs). Orcus
is then assumed to have a 475 km radius, a 19.9% albedo
(Stansberry et al. 2008),
and a bulk density of 1900 kg m-3(Brown 2008). By assuming a
residual porosity of 10%
(Durham et al. 2005),
this density leads to a mixture made of 77% of
dust and 23% of water ice (mass fractions), the dust being
homogeneously distributed within the ice matrix. The resulting thermal
properties are: the thermal conductivity
![]() Wm-1 K-1,
the heat capacity
c = 103 Jkg-1 K-1.
Wm-1 K-1,
the heat capacity
c = 103 Jkg-1 K-1.
Since heating due to the accumulation of gravitational potential energy is usually not important, even for large KBOs such as Pluto (McKinnon et al. 1997), we neglect this heat source in this model. We also assume that the objects undergo a cold accretion: the accretional heating is thus neglected, although it could be a very important heat source in the case of Orcus.
6.2 Results
6.2.1 Effect of short-lived radiogenic elements
The formation time of KBOs is of critical importance when it comes to
the study of their differentiation due to heating by short-lived
radiogenic elements. These elements indeed decay during the accretion
period, thus providing much less potential heat when the bodies are
formed (and our simulations start). There is still a wide range of
available values for this formation time, depending on models. For
example, Weidenschilling (2004)
suggested that 50 km-radius objects could be
formed in less than one million years inside 30 AU. Recent
simulations
performed by Kenyon et al.
(2008) show that 1000 km-radius bodies could
be formed in 5-10 ![]() 106 yr
within the 20-25 AU region.
106 yr
within the 20-25 AU region.
With the aim of constraining Orcus' state of differentiation
(primordial
and during its lifetime), we applied the model considering various
formation delays as input. The initial temperature is 30 K
(cold
accretion), and the radiogenic elements initial mass fraction is
calculated using the following formula, to account for their decay
during accretion
|
(7) |
with tF the considered formation delay, and
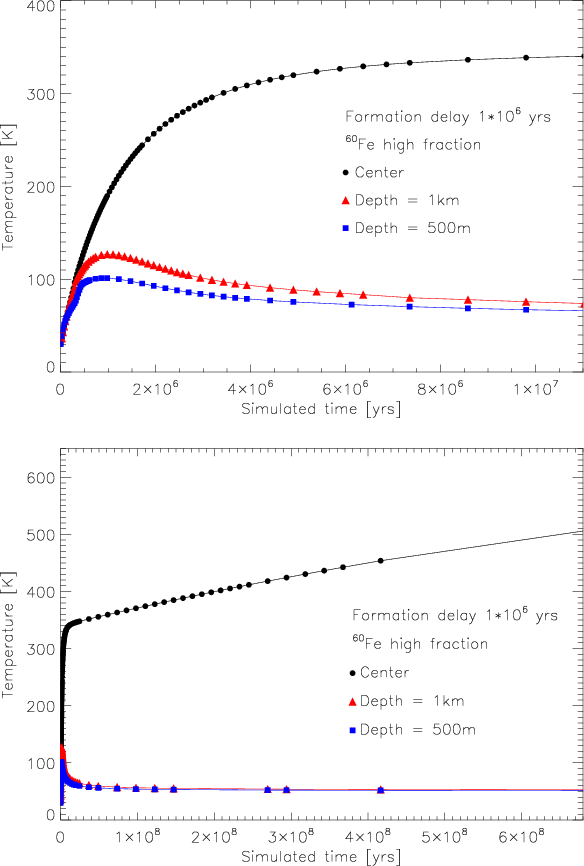
|
Figure 5:
Evolution of Orcus' central temperature (black circles) as a function
of the simulated time in the case of a formation delay of
1 million years and a high mass fraction of radiogenic element
60Fe. Triangles and square curves
correspond to the temperature at a depth of 1 km and
500 m resp. Top graph zooms on the first |
| Open with DEXTER | |
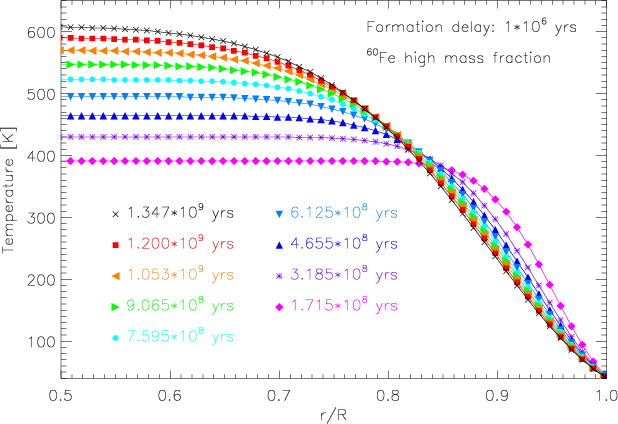
Figure 5 shows the temperature evolution inside Orcus at various depths (center, 1 km-deep, 500 m-deep) considering the highest mass fraction of short-lived 60Fe and a formation delay of 1 Myr. Although this formation delay might seem too short for such a large object, the corresponding results show the greatest temperature variations and the steepest thermal gradients expected, to put an upper limit to all thermal processes. The radiogenic heating is homogeneous inside the body, but the surface is in thermal equilibrium with the external medium. This results in the propagation of a cold wave from the surface toward deeper layers. As a consequence, the curves corresponding to the 1 km-depth and 500 m-depth show a maximum temperature after a few millions years of the simulations: the body then starts to cool slowly.
|
Figure 6: Temperature (K) as a function of the object's depth for various evolution times. This plot illustrates how the outside medium cools the surface layers deeper with time (for SP and LP radiogenic elements, high 60Fe mass fraction.) |
| Open with DEXTER | |
Another consequence is that a layer of amorphous water ice is
maintained at the surface of the object: the 1 m-deep layer
temperature reaches the water crystallization threshold at some point,
while the 500 m-deep layer does not complete the
crystallization
process. The propagation of the cold wave from the surface to the
interior is illustrated by Fig. 6, which shows
the
radial temperature profile across the body for different simulated
times. The thickness of this pristine material layer depends on the
formation delay that we consider: the shorter the delay, the thinner
the layer. We find that the thickness could be as low as several
hundreds of meters (![]() 500 m
for the 1 Myr delay) or as thick as a
few tens of kilometers (
500 m
for the 1 Myr delay) or as thick as a
few tens of kilometers (![]() 10 km
for the 10 Myr delay). Most of the
volume is therefore made of crystalline water ice. Our simulations
also show that the threshold for the solid-liquid phase transition of
water is reached within most of the volume (if formed fast enough):
the high temperatures needed to keep liquid water inside Orcus are
moreover maintained for long periods such as
10 km
for the 10 Myr delay). Most of the
volume is therefore made of crystalline water ice. Our simulations
also show that the threshold for the solid-liquid phase transition of
water is reached within most of the volume (if formed fast enough):
the high temperatures needed to keep liquid water inside Orcus are
moreover maintained for long periods such as
![]() years.
years.
6.2.2 Effect of long-lived radiogenic elements
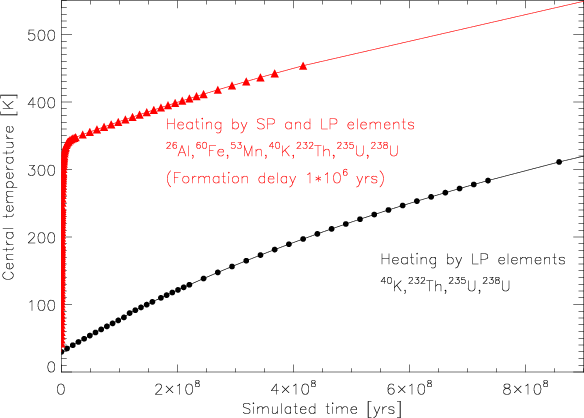
|
Figure 7: Central temperature (K) as a function of the simulated time, showing the different contributions from SP+LP radiogenic elements, and LP only. |
| Open with DEXTER | |
What would happen if Orcus was formed in more than
10 Myr? In this
case, the effect of short-lived radiogenic elements would be
nonexistent. However, radiogenic heating due to the decay of
40K, 232Th, 235U,
and 238U would still be
inevitable. This would even be of the greatest importance for Orcus,
whose thermal timescale,

|
(8) |
exceeds the age of the Solar System (assuming the previous thermal physical parameters). Nonetheless, the value of the thermal conductivity is critical for this calculation, and a variation of one magnitude could reduce the cooling time to less than 109 years.
We therefore applied our model including only the long-lived radiogenic elements 40K, 232Th, 235U, and 238U. The evolution of the body's central temperature is shown on Fig. 7, compared to the evolution under the effect of both long- and short-lived elements. Even without the high heating power of short-lived elements, the internal temperature increases, reaching the melting point of water ice within the first billion years. Please keep in mind that our mixture contains a high fraction of dust that might not reflect the true composition of Orcus. In this case Orcus suffers from considerable heating, while it could actually be much more moderate. Our simulations show that in the case of an important heating by long-lived radiogenic elements, the melting point of water ice could be reached within about 60% of the body, while the melting point of an ammonia-water mixture would be reached within 80% of the body. This is illustrated in Fig. 8, which shows radial temperature profiles for different simulated times. As in the cases considered in the previous section, a layer of amorphous water ice is maintained at the surface of Orcus. Its thickness is about 5-6 km.
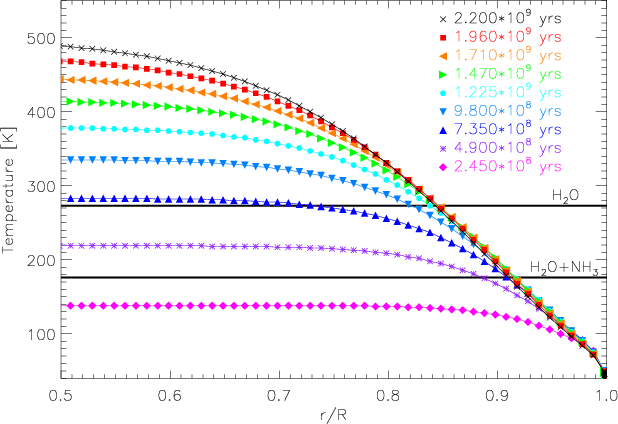
|
Figure 8: Temperature (K) as a function of the object's depth for various evolution times (the lower limit is the case of radiogenic heat source from long-lived elements only). Horizontal lines show the temperature above which H2O or H2O+NH3 are in the liquid phase. |
| Open with DEXTER | |
6.3 Implications
6.3.1 Limitations
Our model has several limitations that need to be kept in mind when interpreting the results. The main issue is that the liquid phase or differentiation is not accounted for: the model is not suitable anymore when the temperature threshold for solid-liquid phase transition is reached. The results we provide should therefore be regarded as qualitative evolutionary trends rather than a quantitative description of Orcus' thermal evolution. Accounting for sources of substantial cooling such as convection movements would probably induce moderate or even low temperature at the present time. Moreover, we considered a water ice and dust mixture which contains a high fraction of dust, which in turn induces a high heating power by radiogenic elements. This dust fraction might actually be lower, and some thermal properties such as the thermal conductivity might also be reduced by a large factor in reality. However, even when considering low heating, our simulations show that Orcus should have experienced a cryovolcanism episode in its life, especially if ammonia is present in its bulk composition.
We did not take into account the possible contribution from the satellite in our simulations, as it is currently not possible to constrain it. However, if the binary system was created by a giant impact, we can expect that a large fraction of the main body's surface layers was removed, thus exposing interior material. Furthermore, the heat from the impact should contribute to a temporal increasing of Orcus' upper layers temperature. Tidal heating was not accounted for either, and might play a role in Orcus thermal evolution if the satellite is found to be large enough (current rough estimates from Brown et al. 2010, give a size of the satellite of 1/3 to half the primary).
6.3.2 A past cryovolcanic event
Under the effect of an efficient heating due to radiogenic elements, a liquid phase (water+ammonia, if ammonia is present) is produced, and could have reached layers close to the surface, eventually freezing, and/or even propagating through cracks within the ice matrix, thus erupting at the surface (Stevenson 1982). This process could be even more efficient with methane, which can trigger explosive cryovolcanism (Kargel 1992,1995). Our spectral data show a compatibility with traces of ammonia and methane at the surface of Orcus, which means that the interior of the object most probably contains ammonia. There is nonetheless no easy way to infer the internal abundance of ammonia from the surface composition, since the latter would not reflect the internal composition, due to the chemical modifications induced by space weathering processes. As described by Desch et al. (2009), the presence of only a few percent of ammonia in the interior (by weight, relative to water) can efficiently lower the viscosity of the ammonia-water mixture once is has melted. Please note however that large amounts of ammonia might be incompatible with a high dust/ice ratio such as the one used on our model (Wong et al. 2008). Our simulations show that we cannot rule out a cryovolcanic episode in Orcus' past life, which probably supplied most of the observed crystalline water ice of the surface. Surface erosion with impact cratering could also contribute to bring to the surface some fresh material, including crystalline water ice, ammonia, and methane, refrozen in subsurface layers, but to a much lesser extent (as computed by Cook et al. 2007, for Charon).
6.3.3 Origin and surviving of crystalline water ice
The initial state of water ice in the Solar System is still a matter of debate:
- if water ice was initially crystalline when Orcus formed, then it could have stayed so over the age of the Solar System in the object's interior. Space weathering processes would have induced its progressive amorphization at the surface (partial, as we will see below, or complete);
- if water ice was initially amorphous when Orcus formed (as we assumed), then our simulations show that it would have been rapidly crystallized compared to the age of the Solar System for most of the objects' volume. A layer of pristine amorphous ice (a few kilometers thick in the canonical case) would have been maintained at the surface. In this case, the crystalline water ice would only appear at the surface if a supply mechanism was at work at some point of the history, or if the erosion by impacts removed the amorphous ice over few kilometers (which is currently believed to be an inefficient process to explain the detectable quantities of crystalline water ice on Orcus, other KBOs and giant planets' satellites, as computed by Cook et al. 2007, for Charon). However, a more detailed modeling of the impact environment of Orcus needs to be conducted before completely ruling out the resurfacing effects of impacts.
7 Summary
We provided new 0.4-2.35 ![]() m reflectance spectra and near-infrared
photometry of Plutino (90482) Orcus. Our visible spectrum is
featureless (within the SNR of the data) with a neutral slope
(
m reflectance spectra and near-infrared
photometry of Plutino (90482) Orcus. Our visible spectrum is
featureless (within the SNR of the data) with a neutral slope
(![]() 2%/100 nm).
These results are consistent with previously
published works and point (within the noise level) to a homogeneous
surface at least in the optical. Our near-infrared spectra confirm the
presence of water ice in its crystalline state (thanks to the
1.65
2%/100 nm).
These results are consistent with previously
published works and point (within the noise level) to a homogeneous
surface at least in the optical. Our near-infrared spectra confirm the
presence of water ice in its crystalline state (thanks to the
1.65 ![]() m
absorption band) at the surface of Orcus, as well as the
presence of a 2.2
m
absorption band) at the surface of Orcus, as well as the
presence of a 2.2 ![]() m
feature, which cannot be readily identified
owing to both the detection level and the multiple candidates. This
band might show a double structure, which deserves to be further
investigated from significantly higher SNR studies than currently
available. These general spectral properties are shared with Pluto's
satellite Charon and Plutino (208996) 2003 AZ84.
m
feature, which cannot be readily identified
owing to both the detection level and the multiple candidates. This
band might show a double structure, which deserves to be further
investigated from significantly higher SNR studies than currently
available. These general spectral properties are shared with Pluto's
satellite Charon and Plutino (208996) 2003 AZ84.
Radiative transfer Hapke models show that a simple mixture of
water
ice (amorphous and crystalline) is not sufficient to properly describe
the data in the H and K band.
Orcus therefore does not have a
Haumea-type surface, although H2O should be the
dominant
ice. Additional absorbents should be invoked, which may be volatiles
and their possible irradiation products. Further Hapke modeling shows
that the 2.2 ![]() m
region and overall spectrum from 0.4 to 2.35
m
region and overall spectrum from 0.4 to 2.35 ![]() m
are best described by an intimate mixture of ammonium (NH4+)
and
traces of ethane (C2H6),
which are most probably solar
irradiation products, in addition to water ice (mostly in its
crystalline state). The presence of ammonium even helps to better
reproduce the visible spectrum, an effect which was not expected
a priori. We find also that our data are compatible with
Hapke models of an equivalent (slightly lower) statistical level
including a mixture of water ice, methane, and ammonia (pure of
diluted); the latter are the parent species of ethane and
ammonium. Methane is particularly interesting to reproduce the blue
slope longward
m
are best described by an intimate mixture of ammonium (NH4+)
and
traces of ethane (C2H6),
which are most probably solar
irradiation products, in addition to water ice (mostly in its
crystalline state). The presence of ammonium even helps to better
reproduce the visible spectrum, an effect which was not expected
a priori. We find also that our data are compatible with
Hapke models of an equivalent (slightly lower) statistical level
including a mixture of water ice, methane, and ammonia (pure of
diluted); the latter are the parent species of ethane and
ammonium. Methane is particularly interesting to reproduce the blue
slope longward ![]() 2.3
2.3 ![]() m, which
might also be the shortward
wing of an additional absorption feature. Focused studies should be
conducted in close connection with laboratory investigations to better
understand the methane and ammonia chemistry.
m, which
might also be the shortward
wing of an additional absorption feature. Focused studies should be
conducted in close connection with laboratory investigations to better
understand the methane and ammonia chemistry.
In this work, we showed that the Orcus spectrum could be
compatible
with the presence of volatile ices on its surface (as also
hypothesized by Barucci
et al. 2008), and their involatile irradiation
products (first invoked here). Our findings merits confirmation by
higher SNR data, and we believe that Plutino (208996) 2003 AZ84and
Orcus deserve joint detailed studies, to be also connected with
Charon properties, as they share common spectral
properties. Schaller &
Brown (2007b) developed a simple model of atmospheric
escape to predict how a given KBO can preserve a primordial surface
inventory of CO, N2 and CH4.
Orcus, Charon and Quaoar are
located in a relative narrow region in their Fig. 1, showing the
equivalent temperature (K) as a function of the object's diameter
(km). Orcus is located in the ``all volatiles lost'' region, where
methane and nitrogen ices in particular should have completely escaped
from the surface. That our Orcus data could be compatible with the
presence of volatiles (here CH4) would imply
that (i) such an
atmospheric model is too simple to describe the actual volatile
content of a particular object (as it was emphasized by the authors in
their conclusions); (ii) Orcus might be larger than the size we
currently know from far-IR data (and Herschel Space
Observatory observations might allow us to answer this
question,
although from the Schaller and Brown model, a factor of ![]() 1.7
would be needed); (iii) there is a supply of volatile ices from the
interior of the object; (iv) the actual situation is a combination of
the previous points.
1.7
would be needed); (iii) there is a supply of volatile ices from the
interior of the object; (iv) the actual situation is a combination of
the previous points.
We investigated the thermal properties of Orcus over its lifetime to understand how crystalline water ice can be produced and test if geological events such as cryovolcanism can be possible and provide fresh ices to the surface. We used a 3D thermal evolution model by Guilbert-Lepoutre et al. (2010) that simulates the temperature of the whole object as a function of its size, density, porosity, orbit, formation delay and radiogenic elements primordial inventory (26Al, 60Fe, 53Mn, 40K, 232Th, 235U, 238U). The bulk assumed composition is dust (77%) plus amorphous water ice (23%), the relative mass fractions being derived from the input 10% porosity. Various initial configurations have been simulated with different formation delays (from 1 to over 10 Myr) including different amounts of short-lived radiogenic elements (with the case no short-lived elements at all) to evaluate the differentiation state of Orcus. Our simulations show that a layer of amorphous water ice of a few kilometers thick would be maintained at the surface of the body, while the remaining of the volume is occupied by crystalline water ice. For all cases we considered, the heating induced by radiogenic elements leads to the melting of the core. This effect is strengthened if ammonia is present inside the body, because it reduces the melting point temperature of the mixture and allows for the production of a liquid phase even under moderate heating. This liquid phase could easily reach layers close to the surface through cracks in the ice matrix (if not directly produced in subsurface layers in the more extreme cases), and therefore make Orcus and intermediate to large water-bearing KBOs the subject of potential astrobiological interest.
As a consequence, even if it is premature to suggest that
Orcus did
undergo a recent event of cryovolcanism, our
results show
that this event did take place at some point of Orcus' history and
most probably supplied crystalline water ice to the surface. Recent
laboratory experiments by Zheng
et al. (2009) show that the
ion-irradiation-induced amorphization of crystalline water ice on a
KBO at ![]() 40 K
can be incomplete and be efficiently balanced by
re-crystallisation (starting at 50 K), so that crystalline
water ice
can survive and still be detectable at the surface over timescales
longer than the Solar System age. Both from the latter results and our
model, we can envision that some of the crystalline ice we currently
observe at the surface of Orcus is actually the remnant of a past
cryovolcanic event. In addition, in the most probable case of our
simulations, a large volume of volatiles are currently present in
Orcus subsurface layer, awaiting to be revealed by future surface
alterations.
40 K
can be incomplete and be efficiently balanced by
re-crystallisation (starting at 50 K), so that crystalline
water ice
can survive and still be detectable at the surface over timescales
longer than the Solar System age. Both from the latter results and our
model, we can envision that some of the crystalline ice we currently
observe at the surface of Orcus is actually the remnant of a past
cryovolcanic event. In addition, in the most probable case of our
simulations, a large volume of volatiles are currently present in
Orcus subsurface layer, awaiting to be revealed by future surface
alterations.
We thank D. Jewitt for fruitful suggestions and are grateful to J.C. Cook for kindly sharing with us estimated optical constants of ammonium, to S. Fornasier et al. for providing us with their Orcus visible spectra, and to S. Spjuth for the computation of the visible geometric albedo of Charon. This material is based upon work supported by the National Aeronautics and Space Administration through the NASA Astrobiology Institute under Cooperative Agreement No. NNA04CC08A issued through the Office of Space Science. B. Yang acknowledges support from a NASA Origins grant and A. Guilbert-Lepoutre from a NASA Herschel grant, both to D. Jewitt. Part of the data presented here were obtained at the W.M. Keck Observatory, which is operated as a scientific partnership among the California Institute of Technology, the University of California and NASA. Based on observations obtained at the Gemini Observatory, which is operated by the Association of Universities for Research in Astronomy, Inc., under a cooperative agreement with the NSF on behalf of the Gemini partnership. The authors wish to recognize and acknowledge the very significant cultural role and reverence that the summit of Mauna Kea has always had within the indigenous Hawaiian community.
References
- Baratta, G. A., Domingo, M., Ferini, G., et al. 2003, Nuclear Instruments and Methods in Physics Research B, 209, 283 [NASA ADS] [CrossRef] [Google Scholar]
- Barkume, K. M., Brown, M. E., & Schaller, E. L. 2008, AJ, 135, 55 [NASA ADS] [CrossRef] [Google Scholar]
- Barucci, M. A., Cruikshank, D. P., Dotto, E., et al. 2005, A&A, 439, L1 [NASA ADS] [CrossRef] [EDP Sciences] [Google Scholar]
- Barucci, M. A., Merlin, F., Guilbert, A., et al. 2008, A&A, 479, L13 [NASA ADS] [CrossRef] [EDP Sciences] [Google Scholar]
- Bauer, J. M., Roush, T. L., Geballe, T. R., et al. 2002, Icarus, 158, 178 [NASA ADS] [CrossRef] [Google Scholar]
- Brown, M., Ragozzine, D., Stansberry, J., & Fraser, W. 2010, AJ, submitted [Google Scholar]
- Brown, M. E. 2008, The Largest Kuiper Belt Objects, ed. M. A. Barucci, H. Boehnhardt, D. P. Cruikshank, & A. Morbidelli, 335 [Google Scholar]
- Brown, M. E., Barkume, K. M., Blake, G. A., et al. 2007a, AJ, 133, 284 [NASA ADS] [CrossRef] [Google Scholar]
- Brown, M. E., Barkume, K. M., Ragozzine, D., & Schaller, E. L. 2007b, Nature, 446, 294 [NASA ADS] [CrossRef] [PubMed] [Google Scholar]
- Brown, M. E., Rabinowitz, D. L., Trujillo, C. A., et al. 2004, IAU Circ., 8291, 1 [NASA ADS] [Google Scholar]
- Brown, M. E., & Trujillo, C. A. 2004, AJ, 127, 2413 [NASA ADS] [CrossRef] [Google Scholar]
- Brown, M. E., Trujillo, C. A., & Rabinowitz, D. L. 2005, ApJ, 635, L97 [NASA ADS] [CrossRef] [Google Scholar]
- Brucker, M. J., Grundy, W. M., Stansberry, J. A., et al. 2009, Icarus, 201, 284 [NASA ADS] [CrossRef] [Google Scholar]
- Brunetto, R., Barucci, M. A., Dotto, E., & Strazzulla, G. 2006, ApJ, 644, 646 [NASA ADS] [CrossRef] [Google Scholar]
- Buie, M. W., Grundy, W. M., Young, E. F., Young, L. A., & Stern, S. A. 2010, AJ, 139, 1117 [NASA ADS] [CrossRef] [Google Scholar]
- Canup, R. M. 2005, Science, 307, 546 [NASA ADS] [CrossRef] [PubMed] [Google Scholar]
- Castillo-Rogez, J. C., Matson, D. L., Sotin, C., et al. 2007, Icarus, 190, 179 [NASA ADS] [CrossRef] [Google Scholar]
- Cook, J. C., Desch, S. J., Roush, T. L., Trujillo, C. A., & Geballe, T. R. 2007, ApJ, 663, 1406 [NASA ADS] [CrossRef] [Google Scholar]
- Cook, J. C., Olkin, C. B., Desch, S. J., et al. 2009, in Lunar and Planetary Inst. Technical Report, Lunar and Planetary Institute Science Conference Abstracts, 40, 2222 [Google Scholar]
- Cooper, J. F., Christian, E. R., Richardson, J. D., & Wang, C. 2003, Earth Moon and Planets, 92, 261 [Google Scholar]
- Dalle Ore, C. M., Barucci, M. A., Emery, J. P., et al. 2009, A&A, 501, 349 [NASA ADS] [CrossRef] [EDP Sciences] [Google Scholar]
- de Bergh, C., Delsanti, A., Tozzi, G. P., et al. 2005, A&A, 437, 1115 [NASA ADS] [CrossRef] [EDP Sciences] [Google Scholar]
- Delsanti, A., Hainaut, O., Jourdeuil, E., et al. 2004, A&A, 417, 1145 [NASA ADS] [CrossRef] [EDP Sciences] [Google Scholar]
- Delsanti, A. C., Boehnhardt, H., Barrera, L., et al. 2001, A&A, 380, 347 [NASA ADS] [CrossRef] [EDP Sciences] [Google Scholar]
- Desch, S. J., Cook, J. C., Doggett, T. C., & Porter, S. B. 2009, Icarus, 202, 694 [NASA ADS] [CrossRef] [Google Scholar]
- Duffard, R., Ortiz, J. L., Thirouin, A., Santos-Sanz, P., & Morales, N. 2009, A&A, 505, 1283 [NASA ADS] [CrossRef] [EDP Sciences] [Google Scholar]
- Durham, W. B., McKinnon, W. B., & Stern, L. A. 2005, Geophys. Res. Lett., 32, 18202 [NASA ADS] [CrossRef] [Google Scholar]
- Fornasier, S., Barucci, M. A., de Bergh, C., et al. 2009, A&A, 508, 457 [NASA ADS] [CrossRef] [EDP Sciences] [Google Scholar]
- Fornasier, S., Dotto, E., Barucci, M. A., & Barbieri, C. 2004, A&A, 422, L43 [NASA ADS] [CrossRef] [EDP Sciences] [Google Scholar]
- Fraser, W., & Brown, M. E. 2009, in AAS/Division for Planetary Sciences Meeting Abstracts, AAS/Division for Planetary Sciences Meeting Abstracts, 41, 65.03 [Google Scholar]
- Gladman, B., Marsden, B. G., & Vanlaerhoven, C. 2008, Nomenclature in the Outer Solar System, ed. M. A. Barucci, H. Boehnhardt, D. P. Cruikshank, & A. Morbidelli, 43 [Google Scholar]
- Gomes, R. S. 2003, Icarus, 161, 404 [Google Scholar]
- Grundy, W. M., & Schmitt, B. 1998, J. Geophys. Res., 103, 25809 [NASA ADS] [CrossRef] [Google Scholar]
- Guilbert, A., Alvarez-Candal, A., Merlin, F., et al. 2009, Icarus, 201, 272 [NASA ADS] [CrossRef] [Google Scholar]
- Guilbert-Lepoutre, A., Lasue, J., Federico, C., Coradini, A., & Orosei, R. 2010, New 3D Thermal Evolution Model for Small Icy Bodies. Application to Trans-Neptunian Objects, under revision for A&A [Google Scholar]
- Hapke, B. 1981, J. Geophys. Res., 86, 4571 [NASA ADS] [Google Scholar]
- Hapke, B. 1993, Theory of reflectance and emittance spectroscopy, ed. B. Hapke [Google Scholar]
- Jewitt, D. C. 2002, AJ, 123, 1039 [NASA ADS] [CrossRef] [Google Scholar]
- Jewitt, D. C., & Luu, J. 2004, Nature, 432, 731 [NASA ADS] [CrossRef] [PubMed] [Google Scholar]
- Kargel, J. S. 1992, Icarus, 100, 556 [NASA ADS] [CrossRef] [Google Scholar]
- Kargel, J. S. 1995, Earth Moon and Planets, 67, 101 [NASA ADS] [CrossRef] [Google Scholar]
- Kargel, J. S., & Strom, R. G. 1990, in Lunar and Planetary Inst. Technical Report, Lunar and Planetary Institute Science Conference Abstracts, 21, 599 [Google Scholar]
- Kenyon, S. J., Bromley, B. C., O'Brien, D. P., & Davis, D. R. 2008, Formation and Collisional Evolution of Kuiper Belt Objects, ed. M. A. Barucci, H. Boehnhardt, D. P. Cruikshank, & A. Morbidelli, 293 [Google Scholar]
- Khare, B. N., Sagan, C., Arakawa, E. T., et al. 1984, Icarus, 60, 127 [NASA ADS] [CrossRef] [Google Scholar]
- Klinger, J. 1981, Icarus, 47, 320 [NASA ADS] [CrossRef] [Google Scholar]
- Lewis, J. S. 1972, Icarus, 16, 241 [NASA ADS] [CrossRef] [Google Scholar]
- Malhotra, R. 1993, Nature, 365, 819 [CrossRef] [Google Scholar]
- Malhotra, R. 1995, AJ, 110, 420 [NASA ADS] [CrossRef] [Google Scholar]
- McKinnon, W. B., Simonelli, D. P., & Schubert, G. 1997, Composition, Internal Structure, and Thermal Evolution of Pluto and Charon, ed. Stern, S. A., & Tholen, D. J., 295 [Google Scholar]
- Merlin, F., Guilbert, A., Dumas, C., et al. 2007, A&A, 466, 1185 [NASA ADS] [CrossRef] [EDP Sciences] [Google Scholar]
- Merlin, F., Alvarez-Candal, A., Delsanti, A., et al. 2009, AJ, 137, 315 [NASA ADS] [CrossRef] [Google Scholar]
- Merlin, F., Barucci, M., de Bergh, C., et al. 2010a, Chemical and physical properties of the variegated Pluto and Charon surfaces, Icarus, in Press [Google Scholar]
- Merlin, F., Barucci, M., de Bergh, C., et al. 2010b, Icarus, 208, 945 [NASA ADS] [CrossRef] [Google Scholar]
- Moore, M. H., Ferrante, R. F., Hudson, R. L., & Stone, J. N. 2007, Icarus, 190, 260 [NASA ADS] [CrossRef] [Google Scholar]
- Moore, M. H., & Hudson, R. L. 2003, Icarus, 161, 486 [NASA ADS] [CrossRef] [Google Scholar]
- Noll, K. S., Grundy, W. M., Chiang, E. I., Margot, J., & Kern, S. D. 2008, Binaries in the Kuiper Belt, ed. M. A. Barucci, H. Boehnhardt, D. P. Cruikshank, & A. Morbidelli, 345 [Google Scholar]
- Oke, J. B., Cohen, J. G., Carr, M., et al. 1995, PASP, 107, 375 [NASA ADS] [CrossRef] [Google Scholar]
- Perets, H. B., & Naoz, S. 2009, ApJ, 699, L17 [NASA ADS] [CrossRef] [Google Scholar]
- Pinilla-Alonso, N., Licandro, J., Gil-Hutton, R., & Brunetto, R. 2007, A&A, 468, L25 [NASA ADS] [CrossRef] [EDP Sciences] [Google Scholar]
- Pinilla-Alonso, N., Licandro, J., & Lorenzi, V. 2008, A&A, 489, 455 [NASA ADS] [CrossRef] [EDP Sciences] [Google Scholar]
- Pinilla-Alonso, N., Brunetto, R., Licandro, J., et al. 2009, A&A, 496, 547 [NASA ADS] [CrossRef] [EDP Sciences] [Google Scholar]
- Prialnik, D., Benkhoff, J., & Podolak, M. 2004, Modeling the structure and activity of comet nuclei, ed. M. C. Festou, H. U. Keller, & H. A. Weaver, 359 [Google Scholar]
- Quirico, E., & Schmitt, B. 1997, Icarus, 127, 354 [NASA ADS] [CrossRef] [Google Scholar]
- Rabinowitz, D. L., Barkume, K., Brown, M. E., et al. 2006, ApJ, 639, 1238 [NASA ADS] [CrossRef] [Google Scholar]
- Rabinowitz, D. L., Schaefer, B. E., & Tourtellotte, S. W. 2007, AJ, 133, 26 [NASA ADS] [CrossRef] [Google Scholar]
- Rabinowitz, D. L., Schaefer, B. E., Schaefer, M., & Tourtellotte, S. W. 2008, AJ, 136, 1502 [NASA ADS] [CrossRef] [Google Scholar]
- Schaller, E. L., & Brown, M. E. 2007a, ApJ, 670, L49 [NASA ADS] [CrossRef] [Google Scholar]
- Schaller, E. L., & Brown, M. E. 2007b, ApJ, 659, L61 [NASA ADS] [CrossRef] [Google Scholar]
- Schmitt, B., Espinasse, S., Grim, J. A., Greenberg, J. M., & Klinger, J. 1989, in ESA SP-302: Physics and Mechanics of Cometary Materials, ed. I. J. J. Hunt, & E. T. D. Guyenne, 65 [Google Scholar]
- Schmitt, B., de Bergh, C., & Festou, M. 1998, The Observatory, 118, 312 [NASA ADS] [Google Scholar]
- Sheppard, S. S. 2007, AJ, 134, 787 [NASA ADS] [CrossRef] [Google Scholar]
- Sicardy, B., Bellucci, A., Gendron, E., et al. 2006, Nature, 439, 52 [NASA ADS] [CrossRef] [PubMed] [Google Scholar]
- Snodgrass, C., Carry, B., Dumas, C., & Hainaut, O. 2009, 2010, A&A, 511, A72 [NASA ADS] [CrossRef] [EDP Sciences] [Google Scholar]
- Stansberry, J., Grundy, W., Brown, M., et al. 2008, Physical Properties of Kuiper Belt and Centaur Objects: Constraints from the Spitzer Space Telescope, ed. M. A. Barucci, H. Boehnhardt, D. P. Cruikshank, & A. Morbidelli (Tucson: University of Arizona Press), 161 [Google Scholar]
- Stevenson, D. J. 1982, Nature, 298, 142 [NASA ADS] [CrossRef] [Google Scholar]
- Strazzulla, G., Leto, G., Baratta, G. A., & Spinella, F. 1991, J. Geophys. Res., 96, 17547 [NASA ADS] [CrossRef] [Google Scholar]
- Tody, D. 1986, in SPIE Conf. Ser., ed. D. L. Crawford, 627, 733 [Google Scholar]
- Trujillo, C. A., Brown, M. E., Rabinowitz, D. L., & Geballe, T. R. 2005, ApJ, 627, 1057 [NASA ADS] [CrossRef] [Google Scholar]
- Verbiscer, A., & Helfenstein, P. 1998, in Solar System Ices, ed. B. Schmitt, C. de Bergh, & M. Festou, A&SS Library, 227, 157 [Google Scholar]
- Weidenschilling, S. J. 2004, From icy grains to comets, ed. M. C. Festou, H. U. Keller, & Weaver, H. A., 97 [Google Scholar]
- Wong, M. H., Lunine, J. I., Atreya, S. K., et al. 2008, Reviews in Mineralogy and Geochemistry, 68, 219 [CrossRef] [Google Scholar]
- Zheng, W., Jewitt, D., & Kaiser, R. 2009, J. Phys. Chem A, 113, 11174 [Google Scholar]
- Zubko, V. G., Mennella, V., Colangeli, L., & Bussoletti, E. 1996, MNRAS, 282, 1321 [NASA ADS] [CrossRef] [Google Scholar]
All Tables
Table 1: Summarized properties of the Orcus/Vanth binary system.
Table 2:
Comparison of the visible spectral slope S (in %/100 nm) as computed
from linear regression using the same algorithm on published data and
our work over the common spectral range (0.51-0.76 ![]() m).
m).
Table 3: Near-infrared photometry from Gemini+NIRI (this work) and near-infrared published colors from Orcus.
Table 4: List of near-infrared Gemini+NIRI spectroscopy observations.
Table 5: Water ice near-infrared absorption band depths and central positions for Orcus.
Table 6: Quantitative description of the chemical composition models with the relative percentage of each component.
Table 7: Comparison of orbital and physical properties of some intermediate-large size water-bearing objects of interest.
Table 8: Comparison of Orcus and Quaoar additional parameters.
Table 9: Physical parameters of various short-period (SP) and long-period (LP) radiogenic elements considered in the model.
All Figures
|
|
Figure 1:
A compilation of available visible spectra of Orcus, presented at a
resolution of |
| Open with DEXTER | |
| In the text | |
|
|
Figure 2:
Orcus spectra taken with the K grism on 2005-02-22. Top and
bottom spectra were shifted by +0.6 and -0.6 resp. in reflectance for
clarity. The solid line is a running mean to guide the eye (smooth box
with a width of |
| Open with DEXTER | |
| In the text | |
|
|
Figure 3:
A close up of Orcus spectrum in H and K
bands (top, grey line) and the reflectance of, from top to
bottom: pure ammonia and, shifted by several units for
clarity, pure methane ice, amorphous water ice, crystalline water ice,
hydrated ammonia (H2O:NH3,
99:1), ammonium and ethane. Synthetic ice spectra were obtained using
Hapke theory (Hapke
1993,1981)
with the optical constants quoted in this paper and a particle size of
10 |
| Open with DEXTER | |
| In the text | |
|
|
Figure 4:
Visible and near-infrared spectrum of Orcus (grey line) with synthetic
spectra superimposed (solid black line). Spectra are shifted in albedo
for clarity from -0.1 to about +0.5 (except model 2). Quantitative
description of the models and reduced |
| Open with DEXTER | |
| In the text | |
|
|
Figure 5:
Evolution of Orcus' central temperature (black circles) as a function
of the simulated time in the case of a formation delay of
1 million years and a high mass fraction of radiogenic element
60Fe. Triangles and square curves
correspond to the temperature at a depth of 1 km and
500 m resp. Top graph zooms on the first |
| Open with DEXTER | |
| In the text | |
|
|
Figure 6: Temperature (K) as a function of the object's depth for various evolution times. This plot illustrates how the outside medium cools the surface layers deeper with time (for SP and LP radiogenic elements, high 60Fe mass fraction.) |
| Open with DEXTER | |
| In the text | |
|
|
Figure 7: Central temperature (K) as a function of the simulated time, showing the different contributions from SP+LP radiogenic elements, and LP only. |
| Open with DEXTER | |
| In the text | |
|
|
Figure 8: Temperature (K) as a function of the object's depth for various evolution times (the lower limit is the case of radiogenic heat source from long-lived elements only). Horizontal lines show the temperature above which H2O or H2O+NH3 are in the liquid phase. |
| Open with DEXTER | |
| In the text | |
Copyright ESO 2010
Current usage metrics show cumulative count of Article Views (full-text article views including HTML views, PDF and ePub downloads, according to the available data) and Abstracts Views on Vision4Press platform.
Data correspond to usage on the plateform after 2015. The current usage metrics is available 48-96 hours after online publication and is updated daily on week days.
Initial download of the metrics may take a while.