| Issue |
A&A
Volume 519, September 2010
|
|
|---|---|---|
| Article Number | A53 | |
| Number of page(s) | 16 | |
| Section | Extragalactic astronomy | |
| DOI | https://doi.org/10.1051/0004-6361/201014506 | |
| Published online | 10 September 2010 | |
Near-infrared and optical observations of galactic warps: a common, unexplained feature of most discs
A. Guijarro1,2 - R. F. Peletier3 - E. Battaner1 - J. Jiménez-Vicente1 - R. de Grijs4,5 - E. Florido1
1 - Dpto. Física Teórica y del Cosmos, Universidad de Granada, Granada, Spain
2 - Centro Astronómico Hispano Alemán, Almería, Spain
3 - Kapteyn Astronomical Institute, Groningen, The Netherlands
4 - Kavli Institute for Astronomy and Astrophysics and Department of Astronomy, Peking University, Beijing, PR China
5 - Department of Physics & Astronomy, The University of Sheffield, UK
Received 26 March 2010 / Accepted 10 June 2010
Abstract
Context. Warps occurring in galactic discs have been studied
extensively in HI and in the optical, but rarely in the near-infrared
(NIR) bands that trace the older stellar populations.
Aims. We provide NIR data of nearby edge-on galaxies, combined
with optical observations, for direct comparison of the properties of
galactic warps as a function of wavelength, and calculate warp curves
for each galaxy and obtain the characteristic warp parameters. We
discuss these properties as possible constraints to the different
mechanisms that have been proposed for the development and persistence
of galactic warps.
Methods. We observed 20 galaxies that were selected from a
statistically complete diameter-limited subsample of edge-on disc
galaxies. We used the Cerro Tololo Infrared Imager (CIRIM) at the CTIO
1.5 m Ritchey-Chretien telescope to acquire the NIR data. We used
the 1.54 m Danish and 0.92 m Dutch telescopes at the European
Southern Observatory's La Silla site for our optical observations.
Results. Our results show that 13 of our 20 sample galaxies are
warped, with the warp more pronounced in the optical than at NIR
wavelengths. In the remaining seven galaxies, no warp is apparent
within the limitations of our automated detection method. The
transition between the unperturbed inner disc and the outer, warped
region is rather abrupt. S0 galaxies exhibit very small or no warps.
The magnetic model remains one of a number of interesting formation
scenarios.
Key words: galaxies: general - galaxies: photometry - galaxies: structure
1 Introduction
Most spiral galaxies, including our own, exhibit warped discs. This
has long been known based on observations of both the extended
neutral-gas (HI) component (Sancisi 1976; Bosma 1981; Briggs 1990; García-Ruiz et al. 2002b) and optical starlight
(Sánchez-Saavedra et al. 1990; Florido et al. 1991; Reshetnikov & Combes 1998; Ann & Park 2006). The first detections of warped discs came from 21 cm line observations of our own Galaxy (Burke 1957;
Kerr 1957; Burton 1988). Based on a sky survey covering the Northern
Hemisphere, Sánchez-Saavedra et al. (1990) first reported the high
frequency of optical warps in disc galaxies, which they later
confirmed in Sánchez-Saavedra et al. (2003) based on an extended
catalogue that also included the Southern Hemisphere. These studies
took into account that warps can only be detected when their
orientation (projection) is favourable (i.e., not in the line of
sight). A noteworthy and important result, established in the later
paper, is that they did not find any warped S0 galaxies. Here, we
therefore pay special attention to S0 galaxies. Reshetnikov et al. (2002) find that warps were also common in the past, with even
greater magnitudes at
![]() .
.
Edge-on galaxies are usually chosen to study warps, although dynamical warps in the HI distribution of galaxies of intermediate inclination have also been reported, e.g., in M 83 (Rogstad et al. 1974), NGC 5033, NGC 5055, NGC 2841, and NGC 7331 (Bosma 1978), M 31 (Brinks & Burton 1984), and M 33 (Corbelli et al. 1989). García-Ruiz et al. (2002b) analysed HI observations and find that all edge-on galaxies that have an extended HI disc (with respect to the optical component) are warped.
Ann & Park (2006) find that 73% of the
325 galaxies in their well-defined sample of almost perfectly edge-on
galaxies (a/b > 9.5, where a/b is the major-to-minor axis ratio at
![]() mag arcsec-2) exhibit optical warps. Recently, Reylé et al. (2009) have found
that a warp is present in the stellar, dust, and gas discs of the
Milky Way, which are all asymmetric and characterised by a similar
line of nodes. The Milky Way's HI gas warp is the strongest, followed
by the dust warp, while the stellar warp is significantly smaller (by
a factor of approximately two). They conclude that this comparison
shows that the different components react differently to the forces
responsible for the origin of the warp. The most important additional
information that we provide here (not yet been discussed
by other authors) is a multiwavelength study of galactic warps in one
NIR and three optical filters.
mag arcsec-2) exhibit optical warps. Recently, Reylé et al. (2009) have found
that a warp is present in the stellar, dust, and gas discs of the
Milky Way, which are all asymmetric and characterised by a similar
line of nodes. The Milky Way's HI gas warp is the strongest, followed
by the dust warp, while the stellar warp is significantly smaller (by
a factor of approximately two). They conclude that this comparison
shows that the different components react differently to the forces
responsible for the origin of the warp. The most important additional
information that we provide here (not yet been discussed
by other authors) is a multiwavelength study of galactic warps in one
NIR and three optical filters.
Considerable effort has gone into establishing the physical origin and stability of warps. Numerous mechanisms have been proposed and explored, but they have thus far not provided a definitive and satisfactory physical explanation (see, e.g., the reviews by Binney 1992; Battaner et al. 1997; van der Kruit 2007). Kerr (1957), Hunter & Toomre (1969), Weinberg (1998), Weinberg & Blitz (2006), and others have suggested that warps can result from tidal interactions with a satellite or neighbouring galaxy. This hypothesis can explain warps neither in isolated galaxies (Sancisi 1976; Tubbs & Sanders 1979; Sparke 1984) nor in the Milky Way, if the latter was produced by an interaction with the Large Magellanic Cloud (see García-Ruiz et al. 2002a). Hunter & Toomre (1969) and Dekel & Shlosman (1983) proposed that the Galactic warp is a result of oscillations in the disc, either triggered by an interaction with another galaxy in the past or caused by the disc being embedded in a nonspherical halo of dark matter. Sparke & Casertano (1988) showed that some discrete oscillation modes can survive. This theory is not without problems, however; for instance, Binney (1991) showed that the halo should then respond to its misalignment with the disc, thus destroying the warp in a few orbital periods. Alternatively, a nonlinear coupling between a spiral wave and two warp waves could create a warp (Masset & Tagger 1997). The efficiency of this mechanism is too low in the stellar disc except at its outer edge (near a Lindblad resonance), where the spiral wave slows down and is coupled efficiently to the warp waves. At those radii, the energy of the spiral arm can almost be completely converted into transmitted and reflected warp waves, which can be observed as corrugations in the disc.
Warping could thus be a natural response of the outer disc to a series of stimulations, and it seems that the responsible mechanism does not necessarily have to be the same in each galaxy. In any case, observations of large edge-on galaxies could contribute to the definitive determination of the dominant scenario. The intergalactic medium could also play an important role by accretion of matter as galaxies move along their paths (Kahn & Woltjer 1959; López-Corredoira et al. 2002; Sánchez-Salcedo 2006). Battaner et al. (1990) explained warps by intergalactic magnetic fields, which would produce a direct distortion in the distribution of the gas. The stellar system would also indirectly reach a warped distribution because stars are formed from gas, but this would result in a difference between young and old stars. Colour gradients in warps can thus provide an important clue. Based on this model, gas-poor S0 galaxies should not exhibit warps.
In this paper, we present new, deep NIR and optical observations of 20
edge-on galaxies. NIR wavelengths have rarely been used to date to
study warps. They are, however, essential for better tracing the stellar
mass distribution, because at infrared (IR) wavelengths (
![]() )
dust extinction is minimised (the absorption, in
magnitudes, in the K filter is 10% of that in the V band,
)
dust extinction is minimised (the absorption, in
magnitudes, in the K filter is 10% of that in the V band,
![]() ). NIR emission is also a better tracer of old
stellar populations, one of our major
objectives in this study. Therefore, these wavelengths provide essential
complementary information for studying stellar warps.
). NIR emission is also a better tracer of old
stellar populations, one of our major
objectives in this study. Therefore, these wavelengths provide essential
complementary information for studying stellar warps.
2 Sample
Our sample was selected by de Grijs (1997, 1998) from the Surface
Photometry Catalogue of the ESO-Uppsala Galaxies (ESO-LV; Lauberts &
Valentijn 1989). This catalogue contains large numbers of galaxies
that have been selected and parameterised uniformly. The galaxies were
originally selected on ESO-Schmidt survey plates covering declinations
![]() ,
excluding the area within
,
excluding the area within ![]() of the
Galactic Equator, at Galactic latitudes
of the
Galactic Equator, at Galactic latitudes
![]() .
We selected
20 candidate galaxies from a statistically complete diameter-limited
subsample of edge-on disc galaxies (de Grijs 1997, 1998), with the
following characteristics (see Table 1):
.
We selected
20 candidate galaxies from a statistically complete diameter-limited
subsample of edge-on disc galaxies (de Grijs 1997, 1998), with the
following characteristics (see Table 1):
-
 ,
i.e., with optical diameters (at a
surface brightness level of
,
i.e., with optical diameters (at a
surface brightness level of
 mag arcsec-2) larger
than 2.2';
mag arcsec-2) larger
than 2.2';
- isolated galaxies, i.e., without significant neighbours within a distance greater than or equal to five times their optical diameters. They should be classified as noninteracting and undisturbed;
- inclination,
 ;
;
- morphological type range from S0 to Sd, i.e., revised Hubble types later than T = -2 (spiral and lenticular galaxies).
Table 1: Global galaxy parameters from the ESO-LV Catalogue (Lauberts & Valentijn 1989).
3 Observations and data reduction
The sample was observed at
- near-infrared wavelengths, with the Cerro
Tololo Infrared IMager (CIRIM) at the 1.5 m Ritchey-Chretien
Telescope of the Cerro Tololo Inter-American Observatory (CTIO) on October 22-27, 1998 (Prop0020). CIRIM is equipped with a
 -pixel HgCdTe NICMOS3 array (Rockwell
Science) with a pixel scale of
-pixel HgCdTe NICMOS3 array (Rockwell
Science) with a pixel scale of
 .
We
observed our sample galaxies through the
.
We
observed our sample galaxies through the
 filter
(
filter
(
 ), characterised by an effective wavelength
 m (Wainscoat & Cowie 1992). We opted
for this filter instead of the longer-wavelength K filter
(
m (Wainscoat & Cowie 1992). We opted
for this filter instead of the longer-wavelength K filter
(
 m) because the sky brightness in
is lower than in the K band (for instance, at
UKIRT, Hawaii, the sky brightness is 13.5 and 13.0 mag arcsec-2in
and K, respectively
m) because the sky brightness in
is lower than in the K band (for instance, at
UKIRT, Hawaii, the sky brightness is 13.5 and 13.0 mag arcsec-2in
and K, respectively![[*]](/icons/foot_motif.png) ) and
is almost as little affected by
dust as the K band,
) and
is almost as little affected by
dust as the K band,
 mag airmass-1; and
- optical wavelengths. We obtained our observations using
two telescopes of the European Southern Observatory (ESO) at La Silla,
Chile, including the 1.54 m Danish telescope (equipped with a
 -pixel TEK CCD with
 pixel-1) and
the 0.92 m Dutch telescope (equipped with a
pixel-1) and
the 0.92 m Dutch telescope (equipped with a
 -pixel TEK
CCD with
-pixel TEK
CCD with
 pixel-1), both in the standard Johnson
B and V and Thuan & Gunn (1976) i filters.
pixel-1), both in the standard Johnson
B and V and Thuan & Gunn (1976) i filters.
To study stellar warps in disc galaxies, we need to obtain reliable
data at the very low surface brightnesses in their outermost
regions. Our observational data reached surface brightnesses fainter
than 26 mag arcsec-2 in the B band. This is only 6% of the sky
brightness (
![]() mag arcsec-2), so that we had
to be particularly careful in measuring the sky brightness. The sky
background in NIR passbands is much higher than in the optical
(
mag arcsec-2), so that we had
to be particularly careful in measuring the sky brightness. The sky
background in NIR passbands is much higher than in the optical
(
![]() mag arcsec-2) and can change
significantly on temporal and spatial scales the order of two
minutes and two arcmin, respectively. It was therefore necessary to
obtain as many sky frames as object frames to perform sky subtraction with
sufficiently high accuracy. We took sky and object frames alternately,
using the same exposure time for each individual frame (60 s) and
employing interframe shifts of
mag arcsec-2) and can change
significantly on temporal and spatial scales the order of two
minutes and two arcmin, respectively. It was therefore necessary to
obtain as many sky frames as object frames to perform sky subtraction with
sufficiently high accuracy. We took sky and object frames alternately,
using the same exposure time for each individual frame (60 s) and
employing interframe shifts of ![]() 2 arcmin. An additional reason
we needed to obtain separate sky frames is that the IR
arrays used were not large enough to properly sample the sky on the
science frames. Incorrect background subtraction can cause the sky
level to be either underestimated (so that sky flux will contribute to
the surface brightness at large galactic radii) or overestimated
(resulting in a fictitious radial cut-off). Figure 1
illustrates the importance of careful background subtraction in the
2 arcmin. An additional reason
we needed to obtain separate sky frames is that the IR
arrays used were not large enough to properly sample the sky on the
science frames. Incorrect background subtraction can cause the sky
level to be either underestimated (so that sky flux will contribute to
the surface brightness at large galactic radii) or overestimated
(resulting in a fictitious radial cut-off). Figure 1
illustrates the importance of careful background subtraction in the
![]() band, where the sky contribution is greater than in
optical passbands. The figure shows the major- and the minor-axis
(vertical, z) surface brightness profiles of four galaxies, binned
radially. The effects of oversubtraction can be seen clearly in the
minor-axis surface brightness profiles: they show artificial cut-offs,
and the negative background values result in undefined surface
brightnesses at these z heights.
band, where the sky contribution is greater than in
optical passbands. The figure shows the major- and the minor-axis
(vertical, z) surface brightness profiles of four galaxies, binned
radially. The effects of oversubtraction can be seen clearly in the
minor-axis surface brightness profiles: they show artificial cut-offs,
and the negative background values result in undefined surface
brightnesses at these z heights.
![\begin{figure}
\par\includegraphics[width=16.55cm]{14506fg1.ps}
\end{figure}](/articles/aa/full_html/2010/11/aa14506-10/img80.png)
|
Figure 1:
|
| Open with DEXTER | |
We used a special software package for our NIR data reduction,
customised to reduce and analyse very deep data of extended objects
observed in the IR, as a set of IRAF![]() tasks. The program removes spurious stars in sky
frames, subtracts cleaned, scaled sky frames from object frames taken
immediately prior to or after the relevant object frame, and
flatfields the differences. It uses a median sky frame to detect and
remove stars in the sky frames.
tasks. The program removes spurious stars in sky
frames, subtracts cleaned, scaled sky frames from object frames taken
immediately prior to or after the relevant object frame, and
flatfields the differences. It uses a median sky frame to detect and
remove stars in the sky frames.
We observed several standard stars from the SAAO/ESO/ISO Faint
Standard Stars Catalogue (Carter & Meadows 1995) to calibrate our
targets and used the Wainscoat & Cowie (1992) correction to convert
![]() to K magnitudes. These stars were observed at least
three times per night, at different airmasses, to calculate the
prevailing atmospheric extinction with sufficient accuracy. We
observed a total of 21 standard stars. These observations reached a
surface brightness of approximately 23 mag arcsec-2 in
to K magnitudes. These stars were observed at least
three times per night, at different airmasses, to calculate the
prevailing atmospheric extinction with sufficient accuracy. We
observed a total of 21 standard stars. These observations reached a
surface brightness of approximately 23 mag arcsec-2 in ![]() .
.
4 Data analysis
First, we aligned the images in all of the B, V, I, and ![]() filters. We took special care to subtract foreground stars. This is
necessary and important because foreground stars projected close to a
galaxy can contaminate the galaxy's luminosity distribution and lead
to erroneous results. We used a master mask constructed by adding the
individual masks for each of the passbands. In each mask, the stars
were marked with circles of radius around twice the FWHM to avoid
contributions from any residual starlight. In some galaxies observed
near the Galactic plane, this meant that a large number of pixels had
to be masked.
filters. We took special care to subtract foreground stars. This is
necessary and important because foreground stars projected close to a
galaxy can contaminate the galaxy's luminosity distribution and lead
to erroneous results. We used a master mask constructed by adding the
individual masks for each of the passbands. In each mask, the stars
were marked with circles of radius around twice the FWHM to avoid
contributions from any residual starlight. In some galaxies observed
near the Galactic plane, this meant that a large number of pixels had
to be masked.
To determine the warp curve (tracing the position of the intensity maxima as a function of radius), we employed three different methods.
- 1.
- First, we calculated the intensity maxima using vertical cuts (perpendicular to the galactic plane). This resulted in very noisy profiles for the optical data and also sometimes for the NIR data, because the presence of a dust lane frequently resulted in a double-peaked luminosity distribution.
- 2.
- Second, we calculated the luminosity distribution's first moment, with which we obtained reliable results (although it also depended on the position of the dust lane). This method was applied mainly at blue wavelengths to compensate for background stars.
- 3.
- Third, we fitted Gaussian profiles. We fitted each vertical trace (parallel to the minor axis of the galaxy) in the selected zone to a Gaussian function. We considered this the best approach, because the contribution of the dust lane is less important in optical data than when using the other two methods. Gaussians can be matched to vertical profiles that contain a dip caused by a dust lane without problems in almost perfectly edge-on galaxies.
4.1 Warp curves from the Gaussian fit
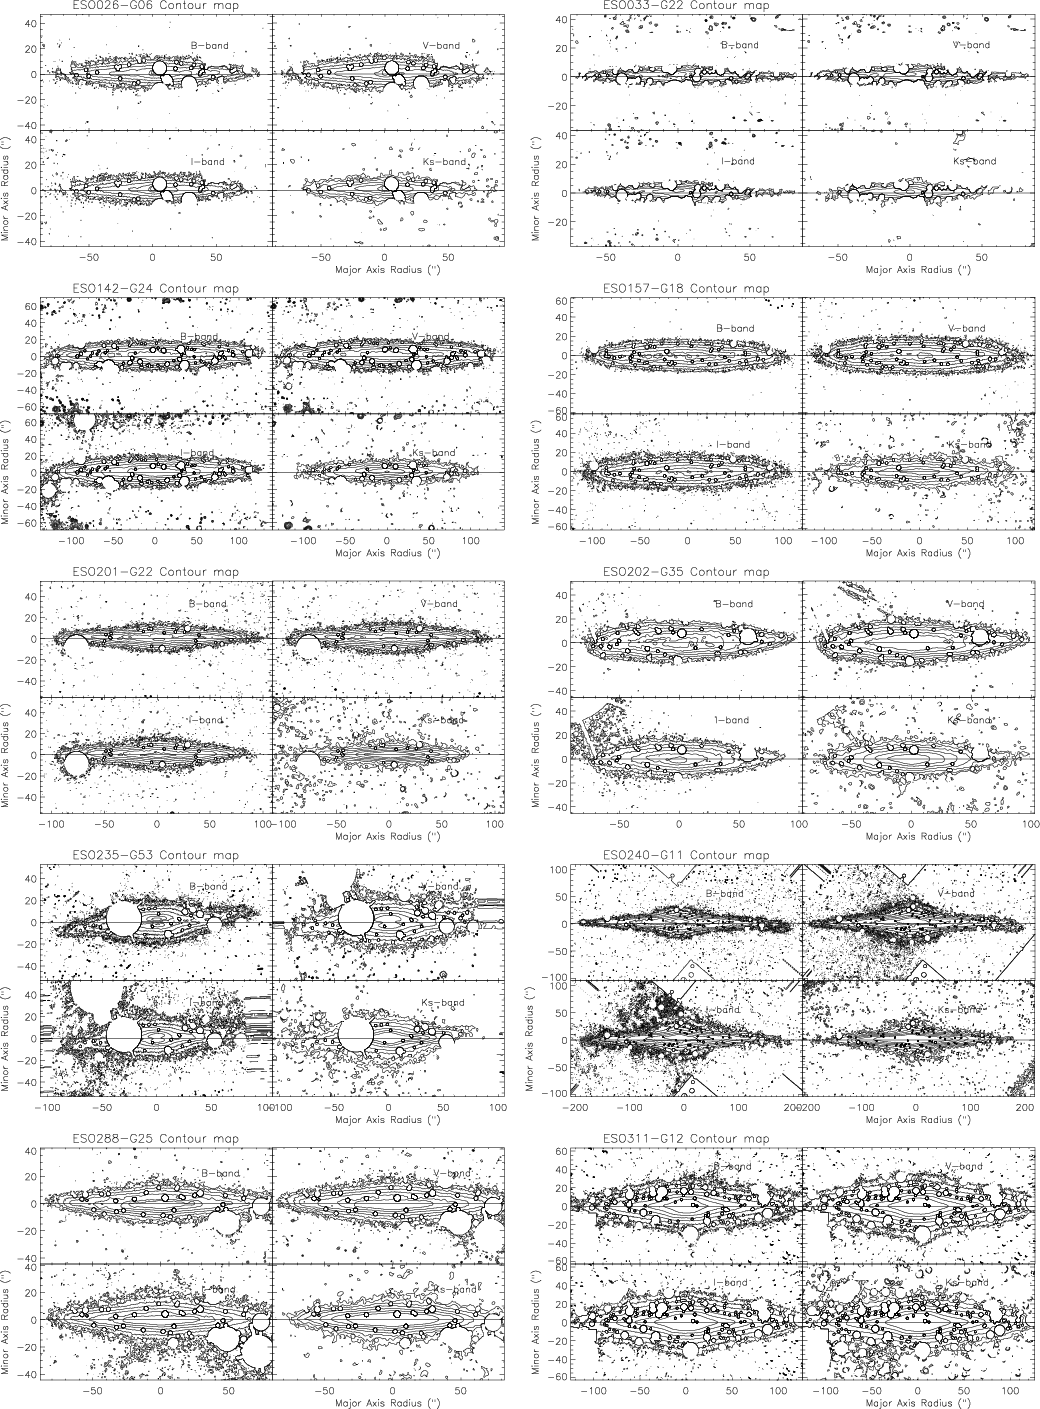
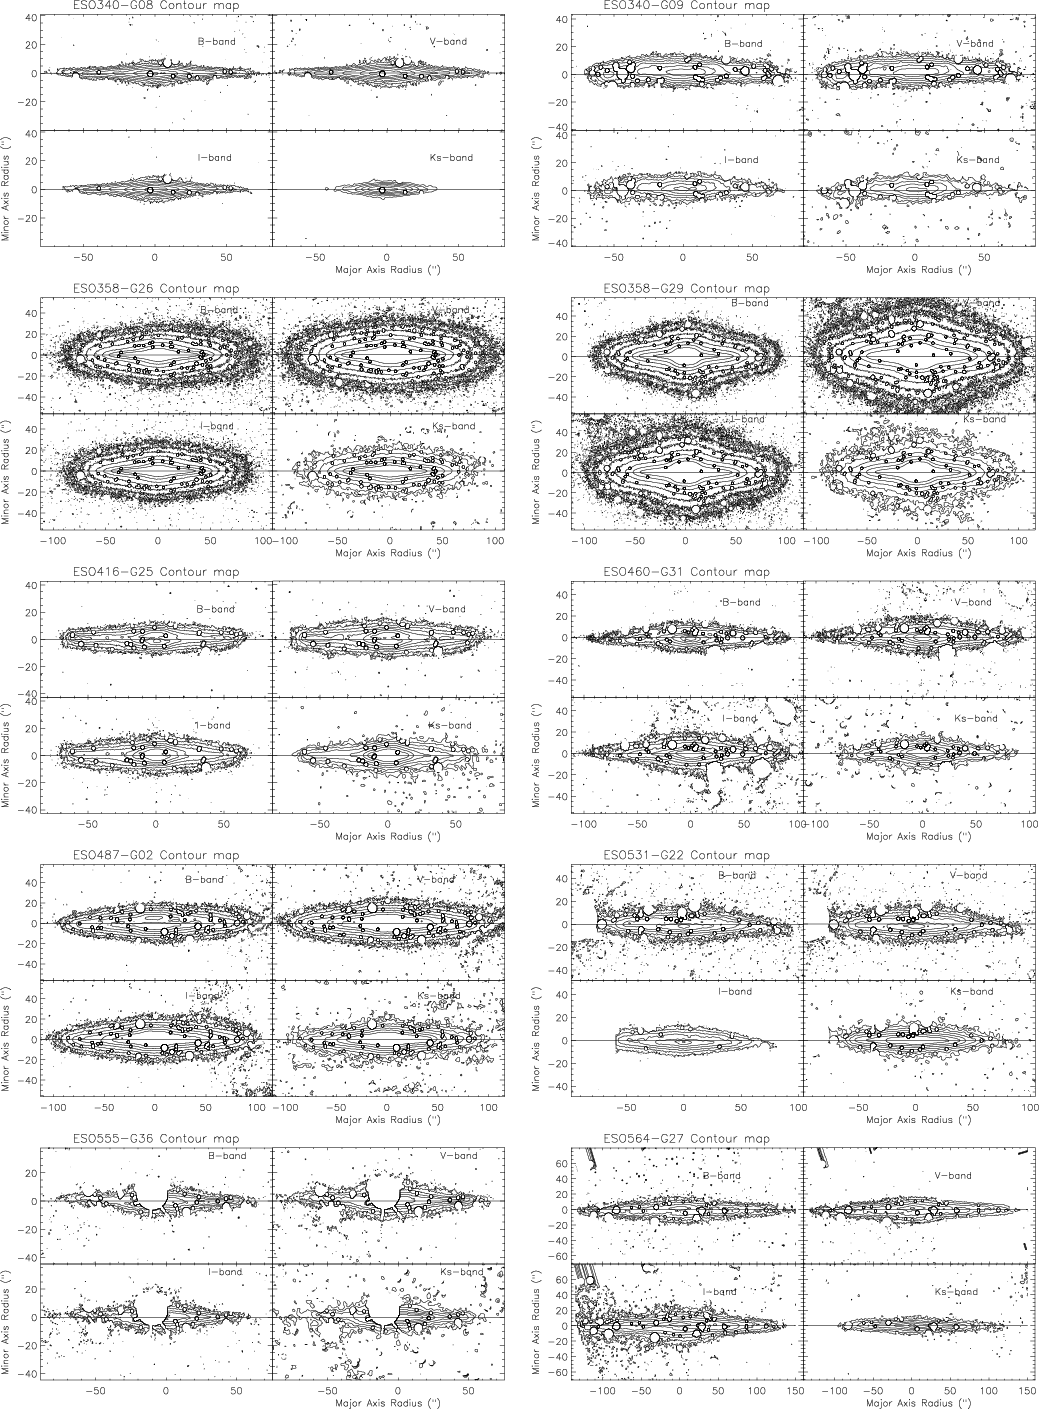
As a first step, we rotated our galaxies (to align their major axes with the horizontal axis) using an iterative method until the position angle (PA) had been determined to an accuracy of approximately 0.05 degrees. We used the PA from the ESO-LV Catalogue as a starting point; we then iteratively fitted a straight line to the central region of the galaxy. Our results are shown in Fig. 2 as isophote maps of our 20 galaxies.
|
Figure 2:
Contour maps of our 20 galaxies in the four filters
analysed. The isophotes are equidistant (in units of
|
| Open with DEXTER | |
|
Figure 2: continued. |
| Open with DEXTER | |
|
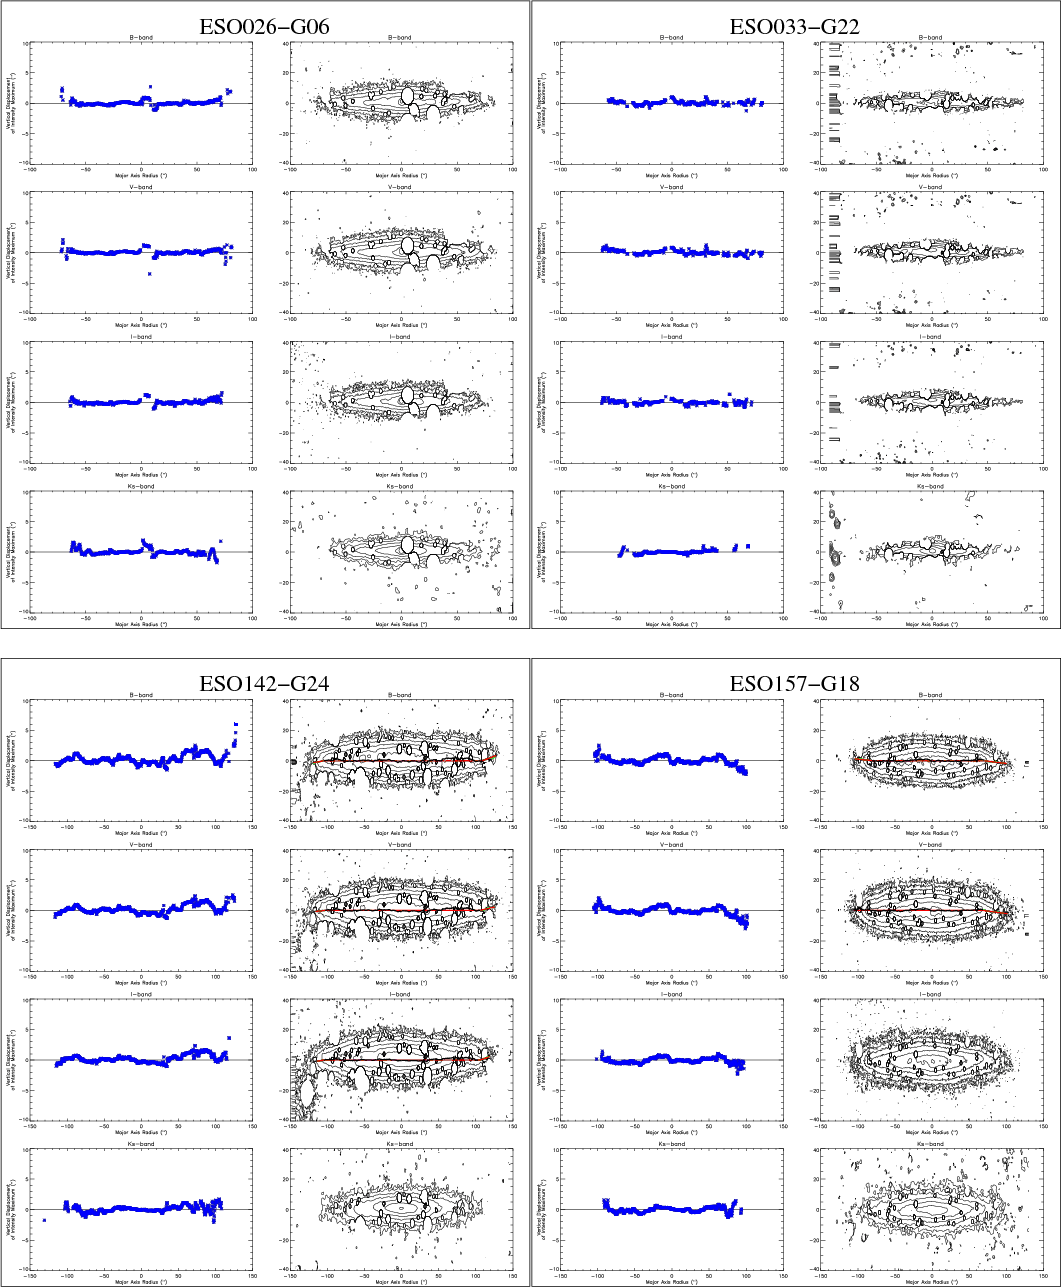
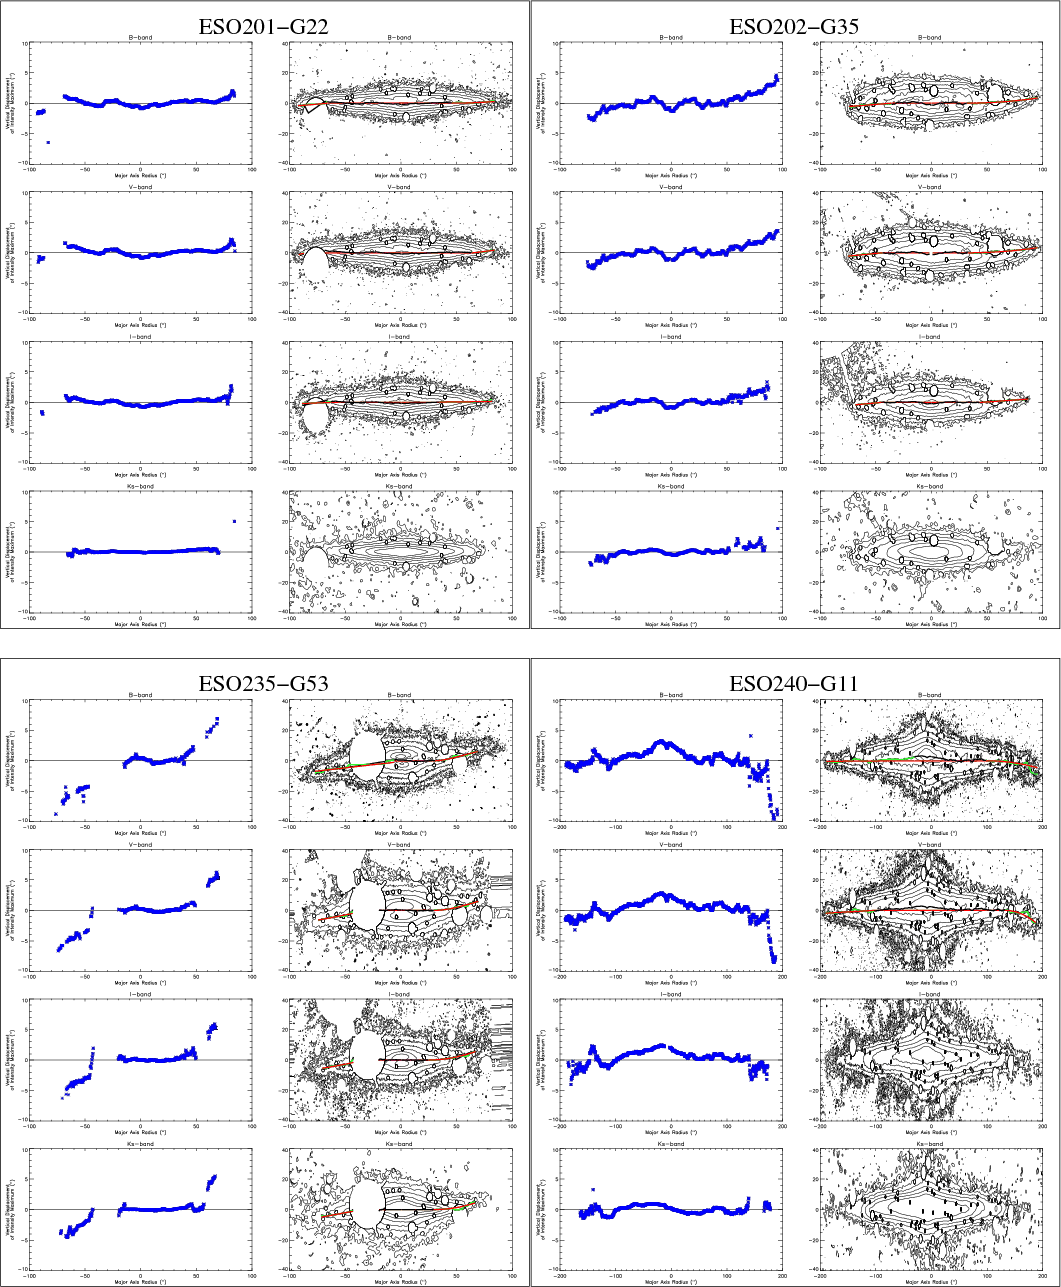
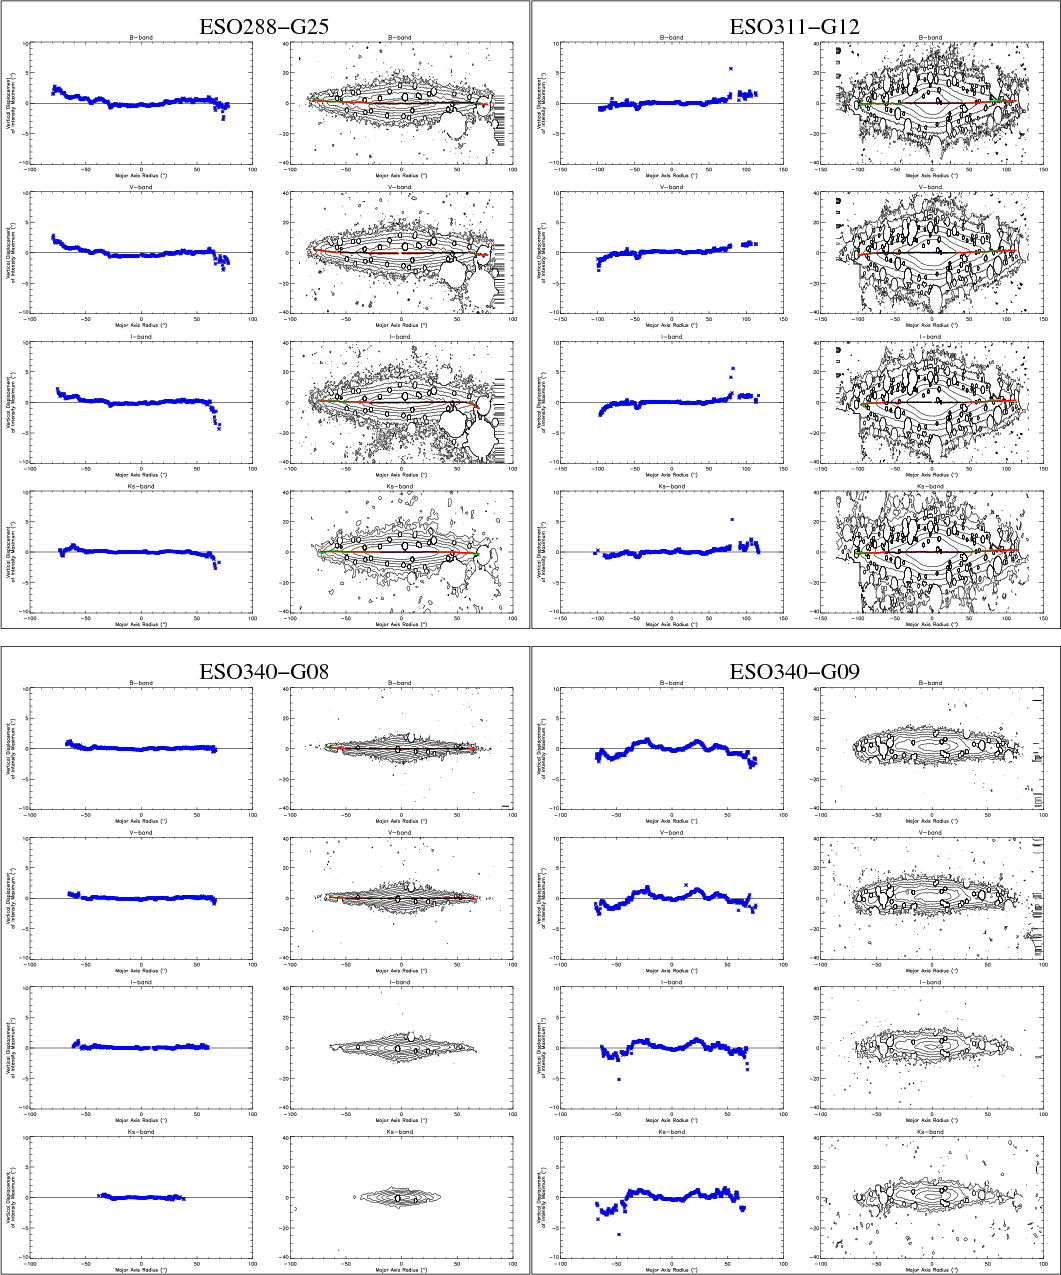
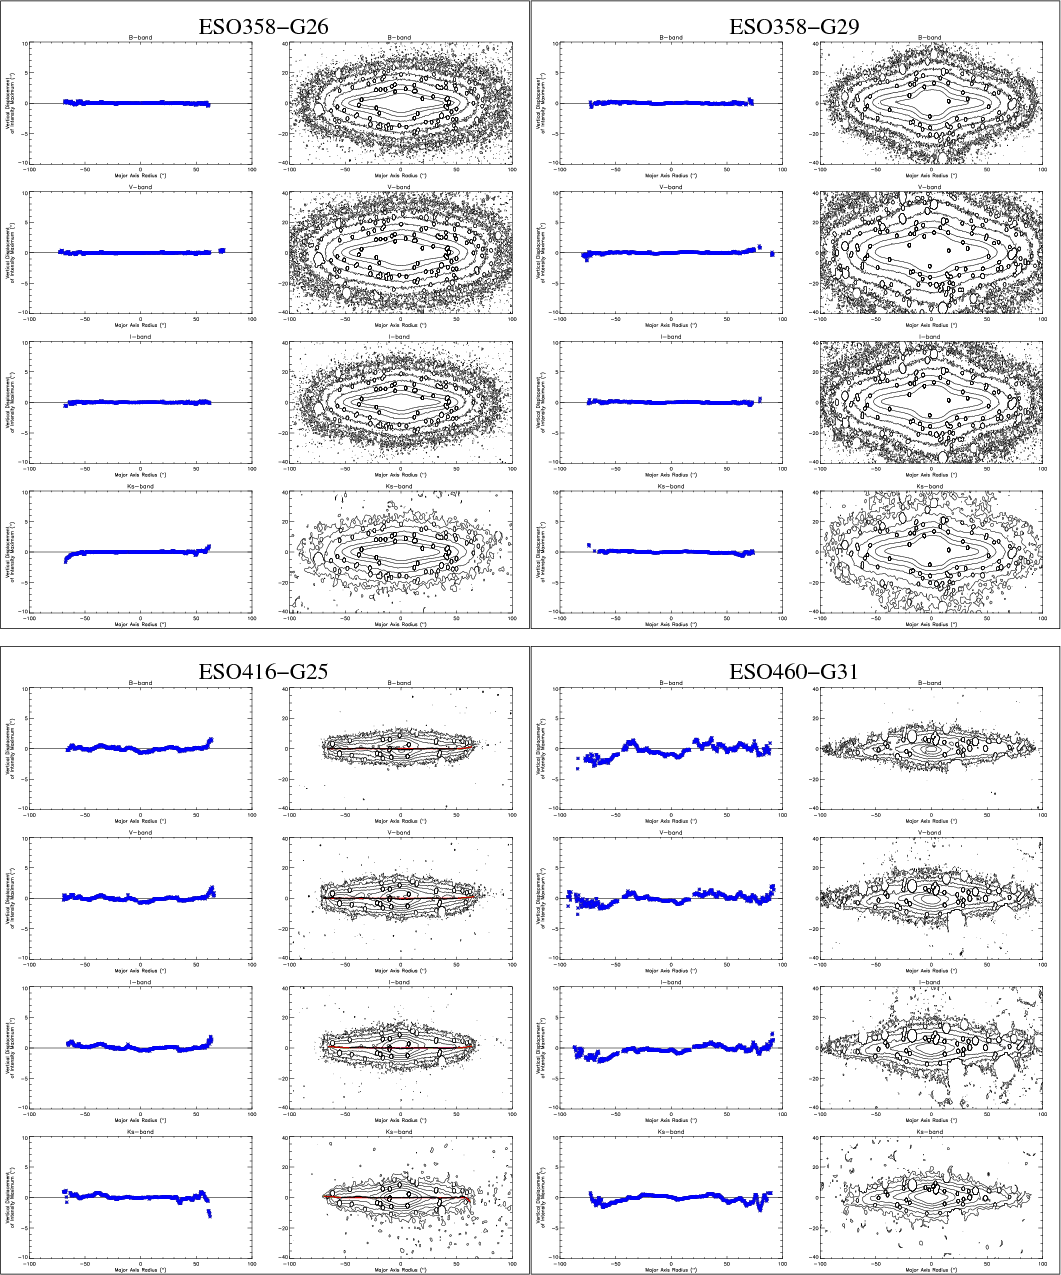
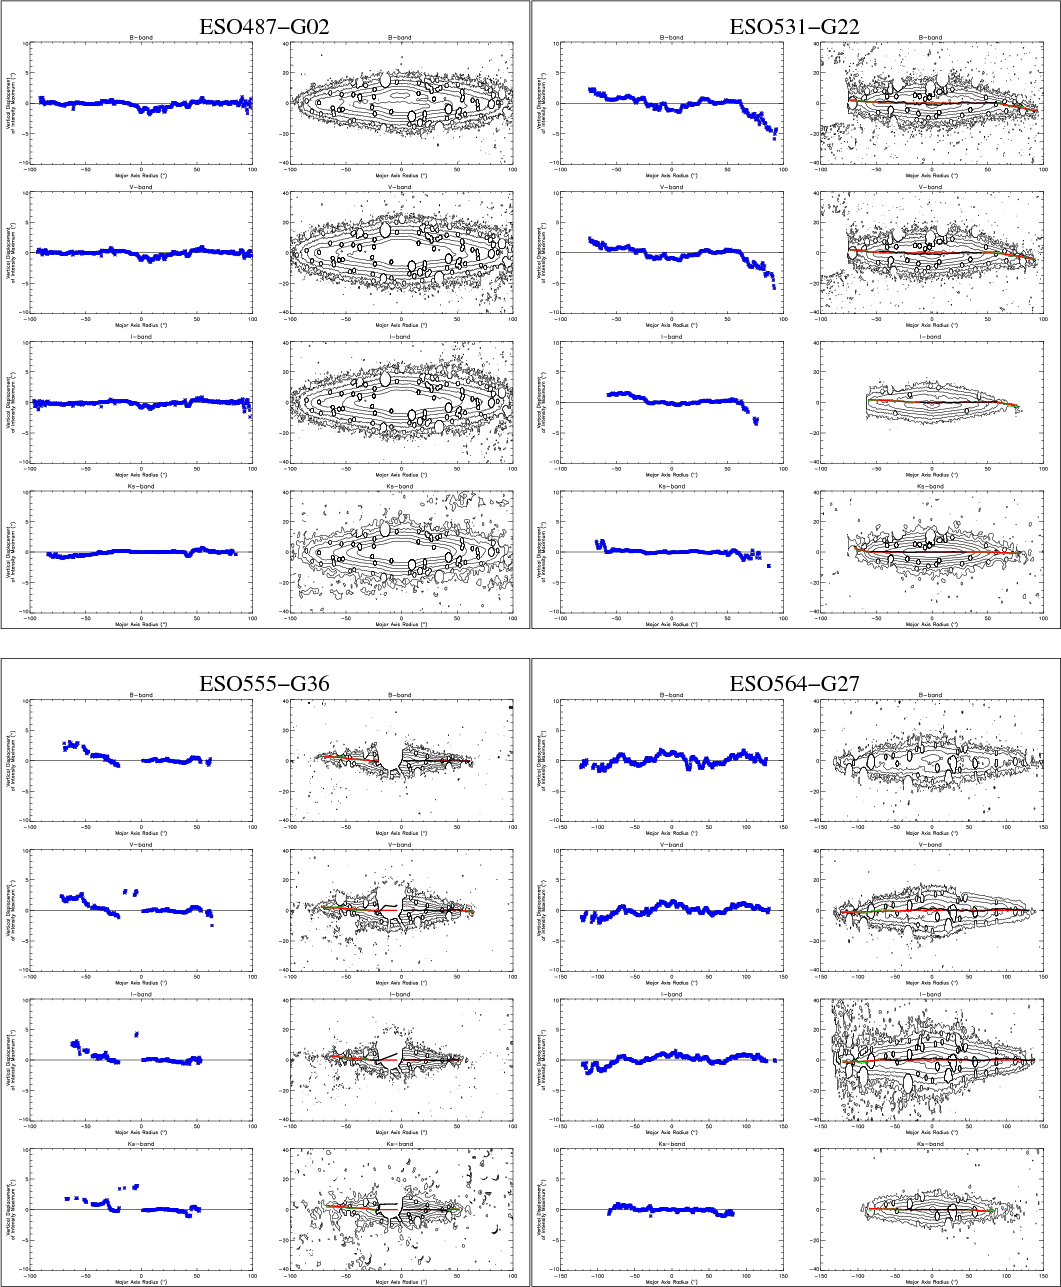
Figure 3:
Left: warp curves and right: contour maps, for the different filters
of our 20 galaxies. The warp curve (green line) is put on top only for those
values with an error bar less than 0.5
|
| Open with DEXTER | |
|
Figure 3: continued. |
| Open with DEXTER | |
|
Figure 3: continued. |
| Open with DEXTER | |
|
Figure 3: continued. |
| Open with DEXTER | |
|
Figure 3: continued. |
| Open with DEXTER | |
To calculate the warp curves, we fitted Gaussians to the vertical
profiles of the galaxies in each filter. We only considered data with
a signal-to-noise ratio greater than 3 (
![]() ,
where
,
where
![]() is the systematic error associated with the random
background noise and
is the systematic error associated with the random
background noise and
![]() the standard deviation),
and with the FWHM of the peak smaller than 100 pixels. The results of
our analysis are presented in Fig. 3, where the warp
curves are shown only for those values with error bars smaller than
0.5
the standard deviation),
and with the FWHM of the peak smaller than 100 pixels. The results of
our analysis are presented in Fig. 3, where the warp
curves are shown only for those values with error bars smaller than
0.5
![]() .
This estimated error bar can be computed by scaling the
standard deviation (
.
This estimated error bar can be computed by scaling the
standard deviation (![]() error) by the measured
error) by the measured ![]() value.
value.
4.2 Warp parameters
It is convenient to use a geometric definition of a warp, e.g., for statistical studies. For an edge-on galaxy, the suitable coordinates correspond to the two directions contained in the plane of the sky: the direction defined by the major axis of the galaxy, x, and the direction of the rotation axis of the galaxy, y. The centre of the galaxy is the origin of coordinates. A warp curve is defined as the locus of points (xi, yi) tracing the distribution of the highest intensities, where yi is the position of the centre of the best-fitting Gaussian at a given xi.
We derived the parameter ![]() (defined in Jiménez-Vicente et al. 1997),
(defined in Jiménez-Vicente et al. 1997),
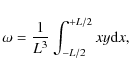
|
(1) |
where L is the full size of the edge-on galaxy (the diameter at 3
|
(2) |
We can also define this parameter for both sides of our galaxies:
With this parameter we can, for example, objectively compare the
appearance of a galaxy at several wavelengths to determine whether a
colour gradient exists within the warp. We can also detect warps
that would otherwise not have been found. Warps are not always
completely symmetric, in which case this parameter would hide the
information of the clearly warped side of the galaxy. To avoid this
problem, we calculated the warp parameters on either side of our
galaxies independently, along with
![]() ,
the degree of
asymmetry (Sánchez-Saavedra et al. 2003),
,
the degree of
asymmetry (Sánchez-Saavedra et al. 2003),
|
(3) |
One of the most important errors in estimating
|
(4) |
As
For those galaxies showing an appreciably warped disc, we fitted a
number of additional parameters to the warp curves. We tried to use the function proposed by Jiménez-Vicente et al. (1997), but it had too many fitting parameters so the fits were resticted to the simple description:
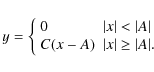
|
(5) |
This function reproduces the warp's shape as a first approximation; i.e., it is flat up to a point and then deviates from the symmetry plane until it asymptotically reaches a new direction. The interpretation of the parameters A and C is as follows,
- A is the starting point of the warp. It has dimensions of length;
- C is the (nondimensional) value of the asymptotic slope.
| Figure 4: Definitions of angles, parameters, and types of warps. |
|
| Open with DEXTER | |
We obtained the same result for the warp parameter ![]() ,
whether it
was calculated starting from the galaxy centre or from the starting
point of the warp, A. This confirms that it is not critical to have
a precise estimate of the position of the galaxy centre because of the
radial flattening in the inner regions of our galaxies. In some
galaxies, such as ESO142-G24 or ESO157-G18, the warp sets off in one
direction, turns back to the mean plane, and ends in the opposite
hemisphere. The Milky Way's warp in the Southern Hemisphere is an
example of this type of behaviour (Porcel et al. 1997). Florido et al. (1991) also report such ``elbow''-type warps. This effect may come from the presence of a more strongly warped dust lane (than
the stellar disc) or be an intrinsic effect associated with warps. For
such galaxies, a four-parameter fit would have provided a better
description. However, since an excessive number of fit parameters
renders any interpretation of simple warps unclear, we prefer to use
three-parameter fits.
,
whether it
was calculated starting from the galaxy centre or from the starting
point of the warp, A. This confirms that it is not critical to have
a precise estimate of the position of the galaxy centre because of the
radial flattening in the inner regions of our galaxies. In some
galaxies, such as ESO142-G24 or ESO157-G18, the warp sets off in one
direction, turns back to the mean plane, and ends in the opposite
hemisphere. The Milky Way's warp in the Southern Hemisphere is an
example of this type of behaviour (Porcel et al. 1997). Florido et al. (1991) also report such ``elbow''-type warps. This effect may come from the presence of a more strongly warped dust lane (than
the stellar disc) or be an intrinsic effect associated with warps. For
such galaxies, a four-parameter fit would have provided a better
description. However, since an excessive number of fit parameters
renders any interpretation of simple warps unclear, we prefer to use
three-parameter fits.
Table 2:
Warp parameters for our four filters (
![]() )
and degree of asymmetry for each warped galaxy, with warp values listed in boldface.
)
and degree of asymmetry for each warped galaxy, with warp values listed in boldface.
Table 3: Warp parameters as a function of passband.
5 Analysis
We consider a galaxy as warped if it is warped (according to the definition in Sect. 4.2) in any of the four observed bands. Based on this assumption, we find that 13 of our 20 sample galaxies (65%) are warped. This fraction supports previous results based on larger galaxy samples with similar optical characteristics to our sample (Sánchez-Saavedra et al. 1990, 2003; Reshetnikov & Combes 1999). Given the difficulties of observing warps with their line of nodes perpendicular to the line of sight, this high fraction of warped discs indicates that essentially all spirals are warped. Optical warps are less perceptible than HI warps, but at both wavelengths the frequency of warps is the same, i.e., close to 100% (Sancisi 1976; García-Ruiz 2001; García-Ruiz et al. 2002b; van der Kruit 2007).
As expected, the N- and S-like warp frequencies are similar, since these characteristics depend on the observer rather than the galaxy. We observe six galaxies with N-like and four galaxies with S-like warps. The frequency of asymmetric warps is lower: ESO416-G25 exhibits a U-like warp, while ESO240-G11 and ESO555-G36 show L-like warps. Therefore, the most frequent warp morphologies are N- and S-like warps (see also Ann & Park 2006).
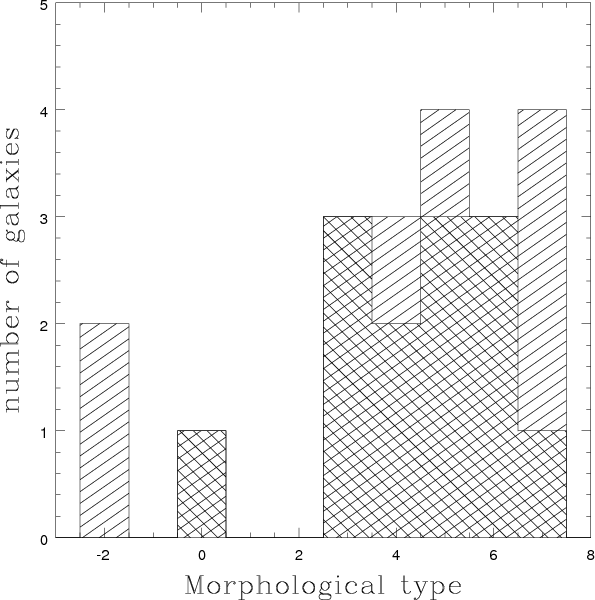
The distribution of warped galaxies as a function of morphological type is shown in Fig. 5, where the hatched area shows all galaxies and the cross-hatched area covers warped galaxies. The warp frequency does not seem to depend significantly on galaxy morphology, except for S0 and very-late-type galaxies, which both yield lower frequencies.
|
Figure 5: Morphological-type distribution of our warped galaxies. Hatched area: all galaxies. Cross-hatched area: Warped galaxies. |
| Open with DEXTER | |
A noticeable result from Sánchez-Saavedra et al. (2003) was that S0 galaxies are generally not warped. This places strong constraints on any hypothesis proposed to explain warps. Among our sample galaxies, ESO311-G12 has a small warp in both the optical and the NIR, but both of the other S0 sample galaxies, ESO358-G26 and ESO358-G29, do not exhibit any detectable warps. Although our sample only contains three S0 galaxies, so that we cannot draw any statistical conclusions on that basis, our results are not in contradiction to previously published results.
Since we have data in both optical and NIR bands, we can compare both,
enabling us to either detect or reject colour dependences in the
warps. This comparison is difficult, however, because of inherent
uncertainties and because the differences as a function of wavelength
are not very large. Five of our galaxies (ESO235-G53, ESO288-G25,
ESO311-G12, ESO416-G25, and ESO555-G36) show similar warp curves in
all four observed bands, one galaxy (ESO531-G22) is warped in all four
filters but exhibits a clearly weaker IR warp, one galaxy (ESO564-G27)
is warped in the V, I, and ![]() filters, and six galaxies
(ESO142-G24, ESO157-G18, ESO201-G22, ESO202-G35, ESO240-G11, and
ESO340-G08) are warped in the optical bands but not in the IR.
filters, and six galaxies
(ESO142-G24, ESO157-G18, ESO201-G22, ESO202-G35, ESO240-G11, and
ESO340-G08) are warped in the optical bands but not in the IR.
Since NIR profiles reach, in general, smaller radii than their optical
counterparts, it is not straightforward to compare the warp distortion
at different wavelengths. To do so, we compared the value of the fitted warp curve's yat the same radial distance in each band, for which we
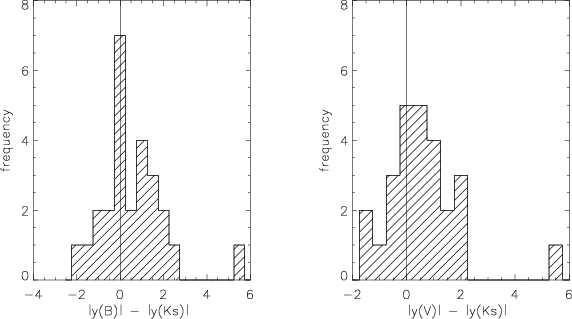
adopted the last measured point in ![]() (i.e., the hparameter of Ann & Park 2006): see Table 3, Col.3. Based on this
table, we appreciate that the optical B and V bands do not exhibit
significant differences. However, we find a difference between V and
(i.e., the hparameter of Ann & Park 2006): see Table 3, Col.3. Based on this
table, we appreciate that the optical B and V bands do not exhibit
significant differences. However, we find a difference between V and
![]() :
y(V) is usually greater than
:
y(V) is usually greater than
![]() )
(in 14 of
22 cases; see Fig. 6). On the other hand,
)
(in 14 of
22 cases; see Fig. 6). On the other hand,
![]() )
is
greater than y(V) for only six of the 22 cases. This difference can
be quite large. The most extreme case is ESO240-G11 (right-hand side),
where the
)
is
greater than y(V) for only six of the 22 cases. This difference can
be quite large. The most extreme case is ESO240-G11 (right-hand side),
where the
![]() .
We find a marginal
tendency for NIR warps to have lower absolute values of the fit
parameter C. Our attempts at statistically detecting a colour
dependence of the observed warps are, therefore, inconclusive. A
better understanding would require more studies of this type. If the
colour dependence were eventually confirmed, mechanisms acting
directly on the gas as the perturbing agent should be favoured. A
colour difference has already been found by Florido et al. (1991). They
also noticed that the dust lane in NGC 4013 is much more strongly
warped than its optical disc. Recently, a study of 2MASS star counts
in the Milky Way (Reylé et al. 2009) confirmed that the Galactic
warp is less obvious in stars than in the gas and that the disc's
shape is different at negative and positive longitudes. However, other
authors have not been able to confirm such a difference (e.g., Momany
et al. 2006, for the Milky Way).
.
We find a marginal
tendency for NIR warps to have lower absolute values of the fit
parameter C. Our attempts at statistically detecting a colour
dependence of the observed warps are, therefore, inconclusive. A
better understanding would require more studies of this type. If the
colour dependence were eventually confirmed, mechanisms acting
directly on the gas as the perturbing agent should be favoured. A
colour difference has already been found by Florido et al. (1991). They
also noticed that the dust lane in NGC 4013 is much more strongly
warped than its optical disc. Recently, a study of 2MASS star counts
in the Milky Way (Reylé et al. 2009) confirmed that the Galactic
warp is less obvious in stars than in the gas and that the disc's
shape is different at negative and positive longitudes. However, other
authors have not been able to confirm such a difference (e.g., Momany
et al. 2006, for the Milky Way).
|
Figure 6:
Histogram of
|
| Open with DEXTER | |
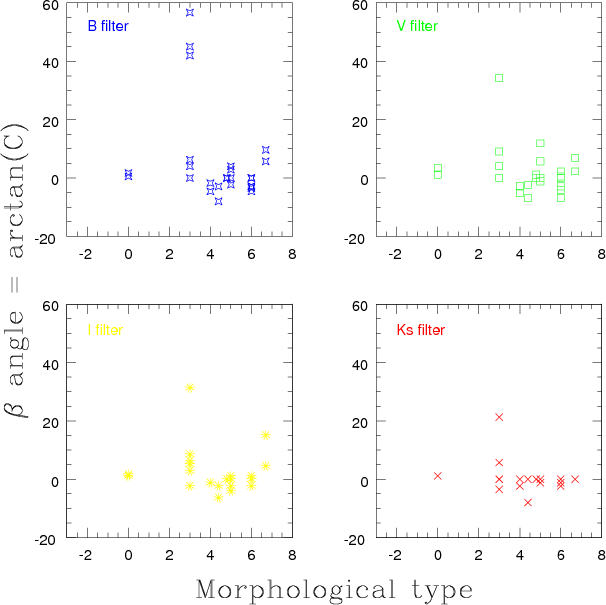
Figure 7 shows the behaviour of the warp angle ![]() as a
function of passband. This angle represents the strength of the warp, i.e.
how much the outer disc deviates from the plane defined by the inner (unwarped) disc. Its
highest value is obtained for galaxies with revised Hubble type T=3, corresponding to Sb. For these galaxy types, a tendency exists
toward lower values of
as a
function of passband. This angle represents the strength of the warp, i.e.
how much the outer disc deviates from the plane defined by the inner (unwarped) disc. Its
highest value is obtained for galaxies with revised Hubble type T=3, corresponding to Sb. For these galaxy types, a tendency exists
toward lower values of ![]() in the NIR filter than in the B band.
The starting point of the warp, A, does not appear to be a function
of wavelength.
in the NIR filter than in the B band.
The starting point of the warp, A, does not appear to be a function
of wavelength.
|
Figure 7: Distribution of warp angle as a function of revised Hubble type. |
| Open with DEXTER | |
Kregel et al. (2002) analysed and used the same optical observations
discussed here to study the flattening and truncation of the stellar
discs. We take their measurements of the truncation radius (see van der Kruit 2007, for definition),
![]() ,
in the I band for 11 of our warped galaxies. It would be very useful to
compare this truncation radius with the starting radius of the warp (A),
because the relation between warps and disc truncations in edge-on
galaxies (van der Kruit 2007), if any, is unclear. Obviously we obtain
from this comparison that the warp radius, A, is approximately equal to 0.8
,
in the I band for 11 of our warped galaxies. It would be very useful to
compare this truncation radius with the starting radius of the warp (A),
because the relation between warps and disc truncations in edge-on
galaxies (van der Kruit 2007), if any, is unclear. Obviously we obtain
from this comparison that the warp radius, A, is approximately equal to 0.8
![]() .
Van der Kruit (2007) concludes that when an HI warp is present, it starts at
approximately
.
Van der Kruit (2007) concludes that when an HI warp is present, it starts at
approximately
![]() .
Therefore it appears that optical
warps always start earlier than HI warps (HI warps start at
approximately 1.4 A), although we note that the low resolution of
the HI data makes it difficult to detect low-amplitude warps.
.
Therefore it appears that optical
warps always start earlier than HI warps (HI warps start at
approximately 1.4 A), although we note that the low resolution of
the HI data makes it difficult to detect low-amplitude warps.
Kregel et al. (2004) also presented HI synthesis observations of 15
edge-on galaxies. They have seven galaxies in common with our sample,
of which ESO487-G02 was observed with insufficient sensitivity, and
five galaxies are found to have a warped HI disc. We now analyse
the objects in common with Kregel et al. (2004) for which warps have
been detected either by them, by us, or by both. They find that the
neutral hydrogen distribution in ESO142-G24 appears warped on both
sides of the galaxy, following a similar pattern to the
stellar disc. In our optical observations, the warp starts at
![]() in the south and
in the south and
![]() in the north, but on the
basis of our NIR observations, we could not detect the same
behaviour. Instead, we observe a corrugated disc.
in the north, but on the
basis of our NIR observations, we could not detect the same
behaviour. Instead, we observe a corrugated disc.
Kregel et al. (2004) find that ESO157-G18 is lopsided, which may be related to the small companion, APMBGC157+052+052, although this galaxy had no previously determined redshift. They did not detect any clear HI warp. We also detected some differences between both sides of this galaxy. Our warp curves exhibit a similar behaviour in all optical bands, while in the NIR the warp is not clear.
ESO201-G22 shows a similar warp curve in HI and in all optical bands,
but it is uncertain in the NIR, where the data are not as deep as in
the optical. The ![]() -band warp curve finishes at a smaller
radius than in the optical bands. The bright star on the eastern
(left-hand) side of the galaxy hinders our analysis of this region.
-band warp curve finishes at a smaller
radius than in the optical bands. The bright star on the eastern
(left-hand) side of the galaxy hinders our analysis of this region.
ESO240-G11 is very interesting because a region in the galaxy's northwest
(right) is clearly warped in the B and V bands, but the warp is not as
marked in the NIR. Kregel et al. (2004) detected warping
of the HI layer and they point out that the HI warp can be traced by faint emission in the
I-band image. In the optical bands, the dust
lane is not completely coincident with the galactic plane, which means
that this galaxy is either not perfectly edge-on or that it has a
warped or asymmetric bulge, which also results in a rather large error
bar. On the southeastern (left-hand) side, the warp radius is
![]() with
with
![]() ,
and on the
northwestern side this radius is
,
and on the
northwestern side this radius is
![]() and
and
![]() ,
so this galaxy exhibits an L-like warp. The ``elbow''
where the warp begins in a given direction turns back to the mean
plane and ends in the opposite hemisphere should show the beginning
of the spiral arms. A more detailed study of corrugations in the
galaxy's stellar and dust discs would also be very interesting.
,
so this galaxy exhibits an L-like warp. The ``elbow''
where the warp begins in a given direction turns back to the mean
plane and ends in the opposite hemisphere should show the beginning
of the spiral arms. A more detailed study of corrugations in the
galaxy's stellar and dust discs would also be very interesting.
The U-like type galaxy ESO416-G25 shows a similar warp curve in all bands, including in HI and the NIR.
The final galaxy also studied by Kregel et al. (2004) is ESO564-G27. This is a clearly corrugated Sc galaxy with some bright foreground stars projected onto the major axis, so it is very difficult to obtain robust conclusions about the stellar warp. Kregel et al. (2004) find that the neutral hydrogen is rather symmetric and extends further than the stellar disc. It is warped on both sides, with the warp apparently starting beyond the stellar disc. We cannot compare this with our results because of the large uncertainties.
Then we can conclude from this comparative study that 5 out of 6 galaxies have an HI warp (only ESO157-G18 does not show any clear HI warp), and these 5 galaxies have an optical warp, while in the NIR the presence of a warp is unclear or absent in all of them. This would indicate that the old star population is less warped than the gas and the more recently born stars.
We calculated
![]() - see Eq. (3) - for all warped
galaxies, and the results are shown in Table 2. The asymmetry in the warp angles seems related to the warp's intrinsic properties. García-Ruiz et al. (2002b) show that the
largest asymmetries are observed in galaxies that display obvious
tidal features. We can only show, based on our sample, that the three
galaxies that exhibit asymmetries, ESO235-G53, ESO311-G12, and
ESO531-G22, all show a large warp amplitude, which supports the
positive correlation found by García-Ruiz et al. (2002b). However,
none of the galaxies in our sample are involved in strong tidal
interactions.
- see Eq. (3) - for all warped
galaxies, and the results are shown in Table 2. The asymmetry in the warp angles seems related to the warp's intrinsic properties. García-Ruiz et al. (2002b) show that the
largest asymmetries are observed in galaxies that display obvious
tidal features. We can only show, based on our sample, that the three
galaxies that exhibit asymmetries, ESO235-G53, ESO311-G12, and
ESO531-G22, all show a large warp amplitude, which supports the
positive correlation found by García-Ruiz et al. (2002b). However,
none of the galaxies in our sample are involved in strong tidal
interactions.
6 Discussion and conclusions
Are all warps produced by the same mechanism? For example, gravitationally driven warps should exhibit no differences between gaseous and stellar morphologies, as opposed to mechanisms acting on the gas (e.g., magnetically or accretion-driven warps). Are the warp curves the same for different colours; i.e., is there any difference in shape and magnitude at different wavelengths?
The present study suggests that, in some of the observed galaxies, the warp is smaller at NIR wavelengths than in the optical. This - combined with the important result of Sánchez-Saavedra et al. (2003) that lenticulars do not exhibit warps (which is also compatible with the results in this paper) - suggests that gas seems to be a necessary ingredient in the development of warps. We have not been able to robustly confirm the absence of warps in S0-type galaxies because our sample only contains three S0s. Therefore, we cannot draw any statistical conclusions on that basis, but our results (at least) do not contradict previously published results that most (if not all) lenticulars are not warped. This must be explained by some theoretical model. Models based on gravity alone might have significant difficulties to explain these observations. A recent study using 2MASS star counts in the Milky Way (Reylé et al. 2009) shows that the warp is less pronounced in stars than in the gas, and it also shows different disc shapes at negative and positive longitudes. The magnetic model of Battaner et al. (1990) is consistent with all of these observations.
Our results show that NIR warps exist with a frequency that is nearly the same as that of optical warps. This suggests that warps are long-lived structures that were formed in the early stages of the evolution of most galaxies. Since warps can be dissipated on a time scale close to the galaxy's rotation period, this indicates that the responsible mechanism, whatever it may be, seems to be acting permanently. The intergalactic magnetic-field model remains an interesting possibility. It is well-known that a warp will disappear on a time scale of approximately 2 Gyr (Binney 1992). However, in the magnetic model of warps, the field configuration is not an initial condition but extragalactic fields act permanently. The extragalactic magnetic-field lines could be frozen in in the intergalactic medium, therefore corotating with galaxy clusters and presenting a relatively stable configuration of the field with respect to the warped galaxy.
The magnetic model was designed to explain N- and S-like warps (m=1modes), the most frequently occurring type (51% out of 73% of warped discs in the large sample of 325 edge-on galaxies of Ann & Park 2006). This model does not manage to explain m=0 warps (U-shaped profiles). They should be interpreted as coming from gradients in the extragalactic field, with characteristic lengths close to a galaxy's size. Generations of asymmetric warps through other mechanisms have been considered by Saha & Jog (2006) and López-Corredoira et al. (2002). Other mechanisms have been proposed to induce warping. In fact, the variety of warp morphologies could come from different causes that may act differently from galaxy to galaxy. However, observations of NIR warps and direct comparison with their optical counterparts could provide some constraints.
The frequency of warped discs in our sample is very high (65%). Given the difficulty of detecting warps with their lines of nodes in the plane of the sky, this suggests a fraction of nearly 100% for the frequency of warps in spirals. We have also been able to confirm the finding by Reshetnikov & Combes (1999) that warps are equally present in all types of spirals, T>0.
The abrupt break between the undisturbed inner disc and the warped
region (with a roughly constant slope) suggests that these two regions
have different formation and evolutionary histories (e.g., van der
Kruit 2007). However, van der Kruit concludes that HI warps start at
![]() .
If this were the case, optical and NIR warps could
not be observed. That they are indeed observed allows us to conclude
that
.
If this were the case, optical and NIR warps could
not be observed. That they are indeed observed allows us to conclude
that
![]() .
Nevertheless, we cannot discard a possible
relationship between truncations and warps. It appears that optical
warps always start closer in than HI warps, although we note that the
low resolution of the HI data makes it difficult to detect
low-amplitude warps.
.
Nevertheless, we cannot discard a possible
relationship between truncations and warps. It appears that optical
warps always start closer in than HI warps, although we note that the
low resolution of the HI data makes it difficult to detect
low-amplitude warps.
We are grateful for the helpful cooperation of the Ursuline Mothers during the period of this work. This paper has been supported by the ``Plan Andaluz de Investigación'' (FQM-108) and by the ``Secretaría de Estado de Política Científica y Tecnológica'' (AYA2000-1574).
References
- Ann, H. B., & Park, J.-C. 2006, NewA, 11, 293 [Google Scholar]
- Battaner, E. 1996, Astrophysical Fluid Dynamics (Cambridge University Press) [Google Scholar]
- Battaner, E., Florido, E., & Sánchez-Saavedra, M. L. 1990, A&A, 236, 1 [NASA ADS] [Google Scholar]
- Battaner, E., Garrido, J. L., Sánchez-Saavedra, M. L., & Florido, E. 1991, A&A, 251, 402 [NASA ADS] [Google Scholar]
- Battaner, E., Florido, E., Jiménez-Vicente, J., Porcel, C., & Sánchez-Saavedra, M. L. 1997, The Impact of Large Scale Near-IR Sky Surveys, ed. F. Garzón et al. (Dordrecht: Kluwer Academic Publishers), Series Astrophysics and Space Science, 210, 49 [Google Scholar]
- Binney, J. 1991, Dynamics of Disk Galaxies, ed. B. Sundelius, Goteborg, Sweden, 297 [Google Scholar]
- Binney, J. 1992, ARA&A, 30, 51 [NASA ADS] [CrossRef] [Google Scholar]
- Bosma, A. 1978, Ph.D. Thesis, Rijksuniversiteit Groningen, Netherlands, http://nedwww.ipac.caltech.edu/level5/March05/ Bosma/frames.html [Google Scholar]
- Bosma, A. 1981, AJ, 86, 1791 [NASA ADS] [CrossRef] [Google Scholar]
- Briggs, F. H. 1990, ApJ, 352, 15 [NASA ADS] [CrossRef] [Google Scholar]
- Brinks, E., & Burton, W.B. 1984, A&A, 141, 195 [NASA ADS] [Google Scholar]
- Burke, B. F. 1957, AJ, 62, 90 [NASA ADS] [CrossRef] [Google Scholar]
- Burton, W. B. 1988, Galactic and Extragalactic Radio Astronomy, ed. G. L. Verschuur, & K. I. Kellerman (Berlin and New York: Springer-Verlag), 295 [Google Scholar]
- Carter, B. S., & Meadows, V. S. 1995, MNRAS, 276, 734 [NASA ADS] [Google Scholar]
- Corbelli, E., Schneider, S. E., & Salpeter, E. E. 1989, AJ, 97, 390 [NASA ADS] [CrossRef] [Google Scholar]
- Dekel, A., & Shlosman, I. 1983, in Internal Kinematic & Dynamics of Galaxies, ed. E. Athanassoula (Dordrecht: Reidel), IAU SYMP., 100, 187 [Google Scholar]
- de Grijs, R. 1997, Ph.D. Thesis, Rijksuniversiteit Groningen, Netherlands, http://dissertations.ub.rug.nl/faculties/science/1997/r.de.grijs/ [Google Scholar]
- de Grijs, R. 1998, MNRAS, 299, 595 [NASA ADS] [CrossRef] [Google Scholar]
- Florido, E., Prieto, M., Battaner, E., Mediavilla, E., & Sanchez-Saavedra, M. L. 1991, A&A, 242, 301 [NASA ADS] [Google Scholar]
- García-Ruiz, I. 2001, Ph.D. Thesis, Rijksuniversiteit Groningen, Netherlands, http://dissertations.ub.rug.nl/faculties/science/2001/i.garcia-ruiz/ [Google Scholar]
- García-Ruiz, I., Kuijken, K., & Dubinski, J. 2002a, MNRAS, 337, 459 [NASA ADS] [CrossRef] [Google Scholar]
- García-Ruiz, I., Sancisi, R., & Kuijken, K. 2002b, A&A, 394, 769 [NASA ADS] [CrossRef] [EDP Sciences] [Google Scholar]
- Hunter, C., & Toomre, A. 1969, ApJ, 155, 747 [NASA ADS] [CrossRef] [Google Scholar]
- Jiménez-Vicente, J., Porcel, C., Sánchez-Saavedra, M. L., & Battaner, E. 1997, Ap&SS, 253, 225 [Google Scholar]
- Kahn, F. D., & Woltjer, L. 1959, ApJ, 130, 705 [NASA ADS] [CrossRef] [Google Scholar]
- Karachentseva, V. E., & Karachentsev, I. D., 2000, Astron. Rep., 44, 501 [Google Scholar]
- Kerr, F. J. 1957, AJ, 62, 93 [NASA ADS] [CrossRef] [Google Scholar]
- Kregel, M., van der Kruit, P. C., & de Grijs, R. 2002, MNRAS, 334, 646 [NASA ADS] [CrossRef] [Google Scholar]
- Kregel, M., van der Kruit, P. C., & de Blok, W. J. G. 2004, MNRAS, 352, 768 [NASA ADS] [CrossRef] [Google Scholar]
- Lauberts, A., & Valentijn, E. A. 1989, The Surface Photometry Catalogue of the ESO-Uppsala Galaxies, ESO (ESO-LV) [Google Scholar]
- López-Corredoira, M., Betancort-Rijo, J., & Beckman, J. E. 2002, A&A, 386, 169 [NASA ADS] [CrossRef] [EDP Sciences] [Google Scholar]
- López-Corredoira, M., Florido, E., Betancort-Rijo, J., et al. 2008, A&A, 488, 511 [NASA ADS] [CrossRef] [EDP Sciences] [Google Scholar]
- Masset, F., & Tagger, M. 1997, A&A, 318, 747 [NASA ADS] [Google Scholar]
- Mathewson, D. S., Ford, V. L., & Buchhorn, M. 1992, ApJS, 81, 413 [NASA ADS] [CrossRef] [Google Scholar]
- Momany, Y., Zaggia, S., Gilmore, G., et al. 2006, A&A, 451, 515 [NASA ADS] [CrossRef] [EDP Sciences] [Google Scholar]
- Porcel, C., Battaner, E., & Jiménez-Vicente, J. 1997, A&A, 322, 103 [NASA ADS] [Google Scholar]
- Reshetnikov, V., & Combes, F. 1998, A&A, 337, 9 [NASA ADS] [Google Scholar]
- Reshetnikov, V., & Combes, F. 1999, A&AS, 138, 101 [Google Scholar]
- Reshetnikov, V., Battaner, E., Combes, F., & Jiménez-Vicente, J. 2002, A&A, 382, 513 [NASA ADS] [CrossRef] [EDP Sciences] [Google Scholar]
- Reylé, C., Marshall, D. J., Robin, A. C., & Schultheis, M. 2009, A&A, 495, 819 [NASA ADS] [CrossRef] [EDP Sciences] [Google Scholar]
- Rogstad, D. H., Lockhart, I. A., & Wright, M. C. H. 1974, ApJ, 193, 309 [NASA ADS] [CrossRef] [Google Scholar]
- Saha, K., & Jog, C. J. 2006, A&A, 446, 897 [NASA ADS] [CrossRef] [EDP Sciences] [Google Scholar]
- Sánchez-Saavedra, M. L., Battaner, E., & Florido, E. 1990, MNRAS, 246, 458 [NASA ADS] [Google Scholar]
- Sánchez-Saavedra, M. L., Battaner, E., Guijarro, A., López-Corredoira, M., & Castro-Rodríguez, N. 2003, A&A, 399, 457 [NASA ADS] [CrossRef] [EDP Sciences] [Google Scholar]
- Sánchez-Salcedo, F. J. 2006, MNRAS, 365, 555 [NASA ADS] [CrossRef] [Google Scholar]
- Sancisi, R. 1976, A&A, 53, 159 [NASA ADS] [Google Scholar]
- Sparke, L. S. 1984, ApJ, 280, 117 [NASA ADS] [CrossRef] [Google Scholar]
- Sparke, L. S., & Casertano, S. 1988, MNRAS, 234, 873 [NASA ADS] [CrossRef] [Google Scholar]
- Thuan, T. X., & Gunn, J. E. 1979, PASP, 88, 543 [Google Scholar]
- Tubbs, A. D., & Sanders, R. H. 1979, ApJ, 230, 736 [NASA ADS] [CrossRef] [Google Scholar]
- van der Kruit, P. C. 2007, A&A, 466, 883 [NASA ADS] [CrossRef] [EDP Sciences] [Google Scholar]
- Wainscoat, R. J., & Cowie, L. L. 1992, AJ, 103, 33 [Google Scholar]
- Weinberg, M. D. 1998, MNRAS, 299, 499 [NASA ADS] [CrossRef] [Google Scholar]
- Weinberg, M. D., & Blitz, L. 2006, ApJ, 641, L33 [NASA ADS] [CrossRef] [Google Scholar]
Footnotes
- ... respectively
- http://www.jach.hawaii.edu/UKIRT/instruments/uist/imaging/imaging.html
- ...IRAF
- IRAF is distributed by the National Optical Astronomy Observatories, which are operated by the Association of Universities for Research in Astronomy, Inc., under cooperative agreement with the US National Science Foundation.
All Tables
Table 1: Global galaxy parameters from the ESO-LV Catalogue (Lauberts & Valentijn 1989).
Table 2:
Warp parameters for our four filters (
![]() )
and degree of asymmetry for each warped galaxy, with warp values listed in boldface.
)
and degree of asymmetry for each warped galaxy, with warp values listed in boldface.
Table 3: Warp parameters as a function of passband.
All Figures
|
|
Figure 1:
|
| Open with DEXTER | |
| In the text | |
|
|
Figure 2:
Contour maps of our 20 galaxies in the four filters
analysed. The isophotes are equidistant (in units of
|
| Open with DEXTER | |
| In the text | |
|
|
Figure 2: continued. |
| Open with DEXTER | |
| In the text | |
|
|
Figure 3:
Left: warp curves and right: contour maps, for the different filters
of our 20 galaxies. The warp curve (green line) is put on top only for those
values with an error bar less than 0.5
|
| Open with DEXTER | |
| In the text | |
|
|
Figure 3: continued. |
| Open with DEXTER | |
| In the text | |
|
|
Figure 3: continued. |
| Open with DEXTER | |
| In the text | |
|
|
Figure 3: continued. |
| Open with DEXTER | |
| In the text | |
|
|
Figure 3: continued. |
| Open with DEXTER | |
| In the text | |
| |
Figure 4: Definitions of angles, parameters, and types of warps. |
| Open with DEXTER | |
| In the text | |
|
|
Figure 5: Morphological-type distribution of our warped galaxies. Hatched area: all galaxies. Cross-hatched area: Warped galaxies. |
| Open with DEXTER | |
| In the text | |
|
|
Figure 6:
Histogram of
|
| Open with DEXTER | |
| In the text | |
|
|
Figure 7: Distribution of warp angle as a function of revised Hubble type. |
| Open with DEXTER | |
| In the text | |
Copyright ESO 2010
Current usage metrics show cumulative count of Article Views (full-text article views including HTML views, PDF and ePub downloads, according to the available data) and Abstracts Views on Vision4Press platform.
Data correspond to usage on the plateform after 2015. The current usage metrics is available 48-96 hours after online publication and is updated daily on week days.
Initial download of the metrics may take a while.