| Issue |
A&A
Volume 519, September 2010
|
|
|---|---|---|
| Article Number | A64 | |
| Number of page(s) | 12 | |
| Section | Stellar atmospheres | |
| DOI | https://doi.org/10.1051/0004-6361/201014471 | |
| Published online | 14 September 2010 | |
An in-depth spectroscopic analysis of the Blazhko star RR Lyrae![[*]](/icons/foot_motif.png)
I. Characterisation of the star: abundance analysis and fundamental parameters
K. Kolenberg1 - L. Fossati2 - D. Shulyak3 - H. Pikall1 - T. G. Barnes4 - O. Kochukhov5 - V. Tsymbal6
1 - Institut für Astronomie, Universität Wien,
Türkenschanzstrasse 17, 1180 Wien, Austria
2 -
Department of Physics and Astronomy, Open University, Walton Hall,
Milton Keynes, MK7 6AA, UK
3 -
Institute of Astrophysics, Georg-August-University,
Friedrich-Hund-Platz 1, 37077 Göttingen, Germany
4 -
The University of Texas at Austin, McDonald Observatory, 1
University Station, C1402, Austin, Texas, 78712-0259, USA
5 -
Department of Astronomy and Space Physics, Uppsala University,
751 20 Uppsala, Sweden
6 -
Tavrian National University, Vernadskiy's Avenue 4, Simferopol,
Crimea 95007, Ukraine
Received 19 March 2010 / Accepted 19 April 2010
Abstract
Context. The knowledge of accurate stellar parameters is a
keystone in several fields of stellar astrophysics, such as
asteroseismology and stellar evolution. Although the fundamental
parameters can be derived from both spectroscopy and multicolour
photometry, the results obtained are sometimes affected by systematic
uncertainties. Stellar pulsation reaches high amplitudes in
RR Lyrae stars, and as a consequence the stellar parameters vary
significantly over the pulsation cycle. The abundances of the star,
however, are not expected to change.
Aims. We present a self-consistent spectral analysis of the
pulsating star RR Lyr, which is the primary target of our study of
the Blazhko effect.
Methods. We used high-resolution and high signal-to-noise ratio
spectra to carry out a consistent parameter determination and abundance
analysis for RR Lyr. The LL MODELS code was employed for model atmosphere calculations, while the SYNTH3 and WIDTH9
codes were used for line profile calculations and LTE abundance
analysis. We describe in detail the methodology adopted to derive the
fundamental parameters and the abundances. From a set of available
high-resolution spectra of RR Lyr, we selected the phase of
maximum radius at which the spectra are least disturbed by the
pulsation. Using the abundances determined at this phase as a starting
point, we expect to be able to determine the fundamental parameters
determined at other phases more accurately.
Results. The set of fundamental parameters obtained in this work
fits the observed spectrum accurately. From the abundance analysis, we
find clear indications of a depth-dependent microturbulent velocity,
that we quantify.
Conclusions. We confirm the importance of a consistent analysis
of relevant spectroscopic features, the application of advanced model
atmospheres, and the use of up-to-date atomic line data for determining
stellar parameters. These results are crucial for further studies,
e.g., detailed theoretical modelling of the observed pulsations.
Key words: stars: fundamental parameters - stars: individual: RR Lyr - stars: oscillations - stars: variables: RR Lyrae - stars: abundances
1 Introduction
The modelling of pulsational signals requires the knowledge of stellar parameters and primarily accurate values of the effective temperature (RR Lyr is the prototype and eponym of its class of pulsating stars. RR Lyrae stars play a crucial role as distance indicators. Their evolutionary stage (He burning in core, H burning in shell) makes them useful tracers of Galactic history. These classical pulsators display radial oscillations (the simplest type of pulsation) with large amplitudes that make them useful touchstones for theoretical modelling. RR Lyr is one of the most well-studied stars of its class. Nearly a century ago, Shapley (1916) discovered that it exhibits a strong Blazhko effect, i.e., a (quasi-)periodic modulation of its light curve shape in amplitude and phase. The Blazhko effect in RR Lyr has been closely followed over the past century, and changes have been reported in both the strength and the duration of its Blazhko cycle (Szeidl 1988; Kolenberg et al. 2006). Some well-studied stars even exhibit multiple (variable) modulation periods (see, e.g., LaCluyzé et al. 2004). Despite numerous attempts to model the phenomenon, the Blazhko effect has eluded a satisfactory explanation so far. High-precision photometry from ground-based or space-borne precise instruments also indicate that Blazhko modulation may be a far more common phenomenon than initially thought: as many as half of the Galactic RRab stars may be modulated (Jurcsik et al. 2009; Szabo et al. 2009; Kolenberg et al. 2010).
To constrain the viable models for the Blazhko effect, it is vital to obtain accurate values for the fundamental parameters (and their variations) of modulated and non-modulated RR Lyrae stars. This has been the main motivation of the study presented in this article.
RR Lyr is the only star of its class to have a directly determined
parallax, measured with the HST/FGS, by Benedict et al. (2002), to be ![]() (FGS
(FGS
![]() mas (
mas (
![]() pc). When a small ISM correction of
Av = 0.07 is applied, this distance results in an
pc). When a small ISM correction of
Av = 0.07 is applied, this distance results in an
![]() mag, which corresponds to
mag, which corresponds to ![]()
![]() .
.
Table 1: Basic data of the observations of RR Lyr.
Fundamental parameters of RR Lyr have been obtained by several
authors with a variety of methods (e.g., Lambert et al. 1996; Manduca et al. 1981; Siegel 1982; for a summary see Kolenberg 2002). The published fundamental
parameters of RR Lyr display a considerable range in both
![]() and
and
![]() because of the large pulsation amplitudes.
According to these analyses, RR Lyr's
because of the large pulsation amplitudes.
According to these analyses, RR Lyr's
![]() varies over its 13h36min pulsation cycle between approximately 6250 and 8000 K and its
varies over its 13h36min pulsation cycle between approximately 6250 and 8000 K and its
![]() between 2.5 and 3.8 (extreme values).
Superimposed on the large variation, the Blazhko cycle leads to an additional variation
in the fundamental parameters. Jurcsik et al. (2008) showed also that the mean properties of modulated RR Lyrae stars change over the Blazhko cycle.
Element abundances of RR Lyr were obtained previously by, e.g., Clementini et al. (1996), Lambert et al. (1996), and Takeda et al. (2006).
between 2.5 and 3.8 (extreme values).
Superimposed on the large variation, the Blazhko cycle leads to an additional variation
in the fundamental parameters. Jurcsik et al. (2008) showed also that the mean properties of modulated RR Lyrae stars change over the Blazhko cycle.
Element abundances of RR Lyr were obtained previously by, e.g., Clementini et al. (1996), Lambert et al. (1996), and Takeda et al. (2006).
The main goal of the present work is to perform a self-consistent atmospheric and abundance analysis of RR Lyr that reproduces all of its photometric and spectroscopic data. Furthermore, we investigate the degree to which the derived fundamental parameters depend on the applied methods. Considering the structure of the available models, especially the position of the convective zones and the zones of nuclear fusion, the measured abundances of the star are not expected to change over the pulsation (and the Blazhko) cycle. Hence, if the abundances are accurately determined at one phase in the pulsation cycle, they can be of help in determining (or at least constraining) the fundamental parameters at other phases. In this paper, we select the optimal phase for determining the abundances of the star. This is the first of a series of papers that will be devoted to a detailed spectroscopic study of RR Lyr. In forthcoming papers, we will discuss the spectral variations over the pulsation and Blazhko cycle of the star.
2 Observations and spectral data reduction
A total of 64 spectra of RR Lyr were obtained between
June 26th and August 27th, 2004 with the Robert G. Tull Coudé
Spectrograph on the 2.7-m telescope of McDonald Observatory. This
is a cross-dispersed échelle spectrograph yielding a two-pixel
resolving power
![]() for the configuration used here.
Table 1 lists the observing time, exposure time, the signal-to-noise ratio (SNR)
per resolution element for each acquired spectrum, and the phases
in the pulsation and Blazhko cycles. For the determination of the
phases we used the ephemerides derived by Kolenberg et al. (2006).
To minimize smearing of the spectral features by pulsation, each
spectrum was limited to an exposure time of 960 s. Two
spectra have shorter exposures as a result of being stopped due
to cloud. The SNR per resolution element
of the obtained spectra varies according to the brightness of the
star (given the fixed integration time) and the weather conditions
during the observation. Spectra ID319-328 were inadvertently
taken at the wrong blaze angle and thus have a low SNR.
for the configuration used here.
Table 1 lists the observing time, exposure time, the signal-to-noise ratio (SNR)
per resolution element for each acquired spectrum, and the phases
in the pulsation and Blazhko cycles. For the determination of the
phases we used the ephemerides derived by Kolenberg et al. (2006).
To minimize smearing of the spectral features by pulsation, each
spectrum was limited to an exposure time of 960 s. Two
spectra have shorter exposures as a result of being stopped due
to cloud. The SNR per resolution element
of the obtained spectra varies according to the brightness of the
star (given the fixed integration time) and the weather conditions
during the observation. Spectra ID319-328 were inadvertently
taken at the wrong blaze angle and thus have a low SNR.
Bias frames and flat-field frames were obtained at the
start of each night, and Th-Ar spectra were observed frequently
during each night for calibration purposes. The spectra were
reduced using the Image Reduction and Analysis Facility
(IRAF![]() ,
Tody 1993). Each spectrum, normalised by fitting a low order
polynomial to carefully selected continuum points, covers the
wavelength range 3633-10 849 Å, with several gaps between the
orders at wavelengths greater than 5880 Å.
,
Tody 1993). Each spectrum, normalised by fitting a low order
polynomial to carefully selected continuum points, covers the
wavelength range 3633-10 849 Å, with several gaps between the
orders at wavelengths greater than 5880 Å.
The normalisation of the hydrogen lines was important because we used them
to derive
![]() .
The H
.
The H![]() absorption line was not covered by our spectra, and the orders adjacent to H
absorption line was not covered by our spectra, and the orders adjacent to H![]() were
affected by a spectrograph defect that prevented a proper
normalization. We were able to perform a reliable normalisation of the H
were
affected by a spectrograph defect that prevented a proper
normalization. We were able to perform a reliable normalisation of the H![]() line using the artificial flat-fielding technique described by Barklem et al. (2002).
This approach assumes that the relation between the blaze shapes of the
different échelle orders is a smoothly changing function of the order
number. On this basis, one can establish the apparent blaze shapes by
fitting polynomials to continuum points in several orders above and
below the hydrogen line. In a subsequent step, a 2-D polynomial surface
was fitted to these empirical blaze functions, and the continuum in the
orders containing the H
line using the artificial flat-fielding technique described by Barklem et al. (2002).
This approach assumes that the relation between the blaze shapes of the
different échelle orders is a smoothly changing function of the order
number. On this basis, one can establish the apparent blaze shapes by
fitting polynomials to continuum points in several orders above and
below the hydrogen line. In a subsequent step, a 2-D polynomial surface
was fitted to these empirical blaze functions, and the continuum in the
orders containing the H![]() line
was determined by interpolation.
line
was determined by interpolation.
This normalisation procedure was performed on two spectra taken close to the optimal phase.
We used a surface fit to 3-4 orders on both sides
of the broad hydrogen line to determine the continuum in the H![]() spectral orders. The accuracy of this normalisation technique is attested
by both a close agreement between the normalised overlapping H
spectral orders. The accuracy of this normalisation technique is attested
by both a close agreement between the normalised overlapping H![]() profiles and the lack of discrepancy between observations of RR Lyr
obtained at similar pulsation phases.
profiles and the lack of discrepancy between observations of RR Lyr
obtained at similar pulsation phases.
Simultaneously with the spectroscopic campaign, we obtained photometric data in Johnson V by means of a multi-site campaign. The photometric data were published by Kolenberg et al. (2006). They were used for accurate determination of the pulsation frequencies and phases in the pulsation and Blazhko cycle.
3 The models
3.1 The pulsation model
To determine the dynamical properties of the atmosphere at the most
quiescent phases theoretically, we used the so-called Vienna
Nonlinear Pulsation Code (Feuchtinger 1999).
For the unperturbed starting model, we assumed the parameter values of
![]() ,
,
![]() ,
,
![]() K, and
a typical Pop II chemical composition of Y=0.239 and Z=0.001,
which collectively correspond to a limit cycle with the observed period
of pulsation. The kinetic energy of the atmosphere (defined as the part
of the photosphere where
K, and
a typical Pop II chemical composition of Y=0.239 and Z=0.001,
which collectively correspond to a limit cycle with the observed period
of pulsation. The kinetic energy of the atmosphere (defined as the part
of the photosphere where
![]() to the outer
boundary of our model, see Fig. 1)
shows 2 local minima, where the first - roughly at phase 0.35 -
corresponds to the phase of maximum photospheric radius. The flow
ceases and the whole envelope starts to contract again to reach its
minimal radius shortly after minimum light. Although the velocities in
the atmosphere are
low, we are aware that the atmosphere is not static at any point
during the stellar pulsation, which conflicts with what is assumed in
most
model atmosphere codes. But there are phases during which the dynamical
effects are smaller, which are those we are interested in for abundance
analysis.
We note that the pulsation model does not take into account the Blazhko
modulation in the star.
to the outer
boundary of our model, see Fig. 1)
shows 2 local minima, where the first - roughly at phase 0.35 -
corresponds to the phase of maximum photospheric radius. The flow
ceases and the whole envelope starts to contract again to reach its
minimal radius shortly after minimum light. Although the velocities in
the atmosphere are
low, we are aware that the atmosphere is not static at any point
during the stellar pulsation, which conflicts with what is assumed in
most
model atmosphere codes. But there are phases during which the dynamical
effects are smaller, which are those we are interested in for abundance
analysis.
We note that the pulsation model does not take into account the Blazhko
modulation in the star.
![\begin{figure}
\par\includegraphics[width=8cm,clip]{figures/14471fg1.ps}
\end{figure}](/articles/aa/full_html/2010/11/aa14471-10/img21.png)
|
Figure 1: RR Lyr model bolometric luminosity ( upper panel), photospheric radius ( middle panel), and atmospheric kinetic energy ( lower panel) as a function of the pulsational phase. By convention, phase 0 corresponds to the maximum of the luminosity. The two full vertical lines correspond to the phases of both maximum radius (the phase we declare as most quiescent) and minimum light (usually adopted for the spectroscopic analysis). |
| Open with DEXTER | |
3.2 The model atmosphere
To compute model atmospheres of RR Lyr, we employed the LL MODELS stellar model atmosphere code (Shulyak et al. 2004). For all the calculations, local thermodynamical equilibrium (LTE) and plane-parallel geometry were assumed. Both of these assumptions need to be evaluated in our particular case.
The LTE assumption may be questionable because of the low plasma density and shock waves in the RR Lyr atmosphere. To reduce the uncertainties in the spectroscopic analysis, we implement our model atmospheres at phases where the dynamical effects in the star's atmosphere are expected to be small. We refer the reader to the next section for more explanation. Ignoring LTE may also lead to systematic errors in the abundance analysis. However, a detailed non-LTE analysis is beyond the scope of the present paper.
The atmospheres of giants are extended because of their large radii, and sphericity
effects may thus become important for the stellar atmosphere modelling. For instance,
based on a detailed model atmosphere analysis, Heiter & Eriksson (2006) recommended
using spherically symmetric models for abundance analysis of stars with
![]() and 4000 K
and 4000 K
![]() K.
Taking into account the estimated gravitational acceleration of RR Lyr of
K.
Taking into account the estimated gravitational acceleration of RR Lyr of
![]() (see next section), one can expect the sphericity effects
to be small enough not to
significantly influence the abundance analysis. The estimated
errors in the Fe abundance based on theoretical Fe I lines presented in
Heiter & Eriksson (2006) indeed do not exceed 0.1 dex for the model with
(see next section), one can expect the sphericity effects
to be small enough not to
significantly influence the abundance analysis. The estimated
errors in the Fe abundance based on theoretical Fe I lines presented in
Heiter & Eriksson (2006) indeed do not exceed 0.1 dex for the model with
![]() and
and ![]() .
A
.
A
![]() value for RR Lyr thus
justifies the use of plane-parallel model atmospheres for abundance analysis.
value for RR Lyr thus
justifies the use of plane-parallel model atmospheres for abundance analysis.
We used the VALD database (Piskunov et al. 1995; Kupka et al. 1999; Ryabchikova et al. 1999) as a source of atomic line parameters for opacity calculations with the LL MODELS code. Finally, convection was implemented according to the Canuto & Mazzitelli (1991a,b) model of convection (see Heiter et al. 2002, for more details).
4 The optimal phase
During the pulsation cycle, the spectral lines of RR Lyr change dramatically. In particular, when a shock wave passes through the atmosphere, it is possible to observe line broadening, line doubling, line disappearance, and sometimes even line emission (Preston et al. 1965; Chadid & Gillet 1996; Chadid et al. 2008; Preston 2009). This is obviously the sign of a very non-quiescent atmosphere, which in principle cannot be modelled with a static model atmosphere, such as ATLAS and LL MODELS. In practice, a model atmosphere code that is able to realistically model the atmosphere of a variable star such as RR Lyr, given both its chemical and pulsational peculiarity, does not yet exist. Therefore we are forced to use a static model atmosphere. To analyse the star in the most consistent way, we decided to study RR Lyr when its atmosphere is as close as possible to that of a non-variable star.
In the past, RR Lyrae stars were always analysed by studying spectra obtained close to the phase of minimum light because it was believed that this was the phase at which the star's atmosphere is ``at its quietest''. The adoption of static model atmospheres for the analysis of RR Lyrae stars was then justified by demonstrating that the results obtained at different phases were all in agreement with each other. At the ``quiescent phase'', we generally suppose that a) there are no shock-waves or any other fast plasma motions in the atmosphere that distort the line profiles and b) pressure stratification is as close as possible to its hydrostatic analog.
Picturing a homogeneously pulsating sphere, the most quiescent phase is associated with both phases of minimum and maximum radius. In the case of an oversimplified pulsation model, these also correspond to the minimum and maximum light in the star's luminosity variation. At these extreme positions in the pulsation, the atmosphere comes to a halt and, due to zero gas velocity, the pressure stratification at these phases is closest to the hydrostatic case (but not necessarily the same!). Furthermore, since the plasma velocities are negligible, the kinetic energy should be zero as well. For RR Lyrae stars, and especially those of type RRab (fundamental mode pulsators) with strongly nonlinear light curves (resembling a saw-tooth function), the phase of maximum light is short-lived and known to be accompanied by shock-waves. Thus, in previous works the quiescent phase was associated with the phase of minimum light. However, the assumption that all atmospheric layers move synchronously because they are rigidly bound to each other is wrong. Realistic models show that at minimum radius, radiation is blocked in deeper layers and ready to migrate into the outer layers and accelerate both the photosphere and the atmosphere.
![\begin{figure}
\par\includegraphics[width=8.5cm,clip]{figures/14471fg2.ps}
\end{figure}](/articles/aa/full_html/2010/11/aa14471-10/img27.png)
|
Figure 2: Radial plots showing gas velocity u in units of the sound speed (the so-called Mach number) shown for the phase of maximum radius (left) and minimum light (right). |
| Open with DEXTER | |
Minimum light is a less fortunate choice for obtaining undistorted line profiles, as parts of the atmosphere still move with supersonic speed (e.g., Mach 3 in Fig. 2). Figure 2 shows radial plots covering approximately the outer 270 (of 400 total) radial mesh points in the Vienna pulsation model. For the phases of both maximum radius and minimum light, the gas velocity u (in units of the local sound) speed is plotted. At maximum radius (left panel in Fig. 2), the photosphere starts to move towards the model's center, while parts of the envelope still move outwards. All velocities are below sound speed. At minimum light (right panel in Fig. 2) - which occurs before minimum radius - we see the transition between super- and subsonic inflow, sometimes called a shock, at the photosphere. This distorts the spectra and makes them less suited to our detailed analysis.
We note that the most quiescent phase, i.e., the phase of maximum radius, is actually very short-lived. A spectroscopic observation has to be well-timed (within, say, half an hour) to catch the spectral lines without distortion. The integration times also cannot exceed a few percent of the pulsation period, to avoid smearing of the spectra due to a pulsation-induced Doppler effect. Integration times not much longer than 15 min taken within the appropriate (narrow) phase interval are recommended. This places constraints on the obtained SNR, and therefore, this study could only be performed with telescopes larger than 2-m. At minimum light, the star is not at its quietest, and the shock wave associated with the bump phase (Gillet & Crowe 1988) close to minimum light will also distort the spectral line profiles in RRab stars.
Figure 1 clearly shows that the phase corresponding to minimum light occurs before a local minimum of the atmospheric kinetic energy, while at the phase of maximum radius the stellar atmosphere is very close to the other local minimum of kinetic energy.
This picture is also confirmed by the observations. Figure 3 compares the line profile of RR Lyr in the region around
4500 Å and the bisector of the Ti II line at ![]() 4501 Å
as
observed at the phases close to both maximum radius and minimum light.
The main difference between the two line profiles is given by the line
broadening, which is an indicator of the atmospheric activity:
to a quiet phase correspond narrow spectral lines.
4501 Å
as
observed at the phases close to both maximum radius and minimum light.
The main difference between the two line profiles is given by the line
broadening, which is an indicator of the atmospheric activity:
to a quiet phase correspond narrow spectral lines.
The spectral line broadening as a function of phase is shown in
Fig. 4. This figure displays the full width at half maximum
(FWHM) measured for four strong spectral features as a function of the
pulsational phase. For each of the four lines, we obtained a clear
minimum close to the phase of maximum radius (between 0.2 and 0.3).
This plot also shows the rapid changes in the FWHM caused by the shock waves.
The observed peaks in FWHM close to the pulsation phases ![]() 0.65 and
0.65 and ![]() 0.9
have been interpreted as arising from two shocks, a weaker and a
stronger shock, respectively, propagating through the star's atmosphere
and compressing the turbulent gas (Fokin et al. 1999). Fokin & Gillet (1997) and Fokin et al. (1999) showed that their RR Lyr models exhibit
very strong shocks
0.9
have been interpreted as arising from two shocks, a weaker and a
stronger shock, respectively, propagating through the star's atmosphere
and compressing the turbulent gas (Fokin et al. 1999). Fokin & Gillet (1997) and Fokin et al. (1999) showed that their RR Lyr models exhibit
very strong shocks![]() up to Mach 25 in the highest part of the star's atmosphere
(see Fig. 3 in Fokin et al. 1999).
up to Mach 25 in the highest part of the star's atmosphere
(see Fig. 3 in Fokin et al. 1999).
![\begin{figure}
\par\includegraphics[width=8.8cm,clip]{figures/14471fg3.ps}
\end{figure}](/articles/aa/full_html/2010/11/aa14471-10/img33.png)
|
Figure 3:
Left panel: comparison between a part of the RR Lyr spectrum as
observed close to the phase of maximum radius (full line) and close to the phase of minimum light
(dashed line). Right panel: comparison between the bisectors of the
Ti II line at |
| Open with DEXTER | |
![\begin{figure}
\par\includegraphics[width=8.8cm,clip]{figures/14471fg4.ps}
\vspace*{-2mm}
\end{figure}](/articles/aa/full_html/2010/11/aa14471-10/img34.png)
|
Figure 4:
Full width at half maximum (FWHM) in Å as a function of pulsational
phase measured for three Fe II lines and one Ti II line. The
minimum is in correspondance with the phase of maximum radius. The typical
uncertainty in the FWHM is of |
| Open with DEXTER | |
The line bisectors, shown in Fig. 3, also illustrate that the line asymmetry changes with the pulsational phase, according to a trend similar to that exhibited by the FWHM. This point will be described in more detail in the next paper.
In practice, it is not trivial to predict exactly when
the star will be at maximum radius, because of the Blazhko effect and
other (possibly longer) periodicities involved in the pulsation. To
find the appropriate spectrum for analysis, we investigated all the
available spectra obtained close to the phase of maximum radius
(determined with the simultaneous photometry) and selected those of the
minimum FWHM and line asymmetry. In the end,
the two spectra with numbers 258 and 260 were obtained very close to the phase of maximum radius and
showed a comparable line broadening and a very small line asymmetry.
We decided to perform a detailed
analysis of spectrum number 260 because of its
higher SNR. Our simultaneous photometry (Kolenberg et al. 2006)
confirmed that this spectrum was recorded around pulsation phase
![]() .
.
5 Fundamental parameters and abundance analysis
In general, a fundamental parameter determination begins from a derivation of
![]() and
and
![]() from photometric indices. For RR Lyr, this operation is not trivial.
In Sect. 4,
we assumed that the atmosphere of RR Lyr
can be at best simplified as ``static'' only at the phase of maximum
radius.
It is therefore at this phase that we made use of the photometric
indices and the static model atmosphere grids to determine the
fundamental parameters.
from photometric indices. For RR Lyr, this operation is not trivial.
In Sect. 4,
we assumed that the atmosphere of RR Lyr
can be at best simplified as ``static'' only at the phase of maximum
radius.
It is therefore at this phase that we made use of the photometric
indices and the static model atmosphere grids to determine the
fundamental parameters.
As a starting point of our analysis, we decided to take the parameters derived
by other authors who analysed spectra of RR Lyr obtained at a similar phase.
In particular, Takeda et al. (2006)
derived the fundamental parameters
spectroscopically from high resolution spectra of RR Lyr, one of
them obtained
not far from the phase of maximum radius. These parameters can be taken
only as a starting point because the star was observed at a different
Blazhko phase![]() . We explore the effect of Blazhko modulation on the spectra of RR Lyr in a
forthcoming paper.
. We explore the effect of Blazhko modulation on the spectra of RR Lyr in a
forthcoming paper.
We used the parameters given by Takeda et al. (2006) for their spectrum taken at pulsation phase
![]() (
(
![]() =
= ![]() K,
K,
![]() =
=
![]() dex)
as our starting point. We performed an iterative process to improve
and test the parameters as described in the following. In our analysis, every time any of the parameters
dex)
as our starting point. We performed an iterative process to improve
and test the parameters as described in the following. In our analysis, every time any of the parameters
![]() ,
,
![]() ,
,
![]() ,
or abundances changed during the iteration process, we calculated a new
model by implementing the most recently determined quantities. We did
the same for the abundances. While the results of the abundance
analysis depend upon the assumed model atmosphere, the atmospheric
temperature-pressure structure itself depends upon the adopted
abundances.
We therefore recalculated the model atmosphere every time the
abundances had been changed, even if the other model parameters
remained unchanged. This procedure ensured that the model structure was
consistent with the assumed abundances.
,
or abundances changed during the iteration process, we calculated a new
model by implementing the most recently determined quantities. We did
the same for the abundances. While the results of the abundance
analysis depend upon the assumed model atmosphere, the atmospheric
temperature-pressure structure itself depends upon the adopted
abundances.
We therefore recalculated the model atmosphere every time the
abundances had been changed, even if the other model parameters
remained unchanged. This procedure ensured that the model structure was
consistent with the assumed abundances.
5.1 The effective temperature
We performed the
![]() determination by fitting synthetic line profiles,
calculated with SYNTH3 (Kochukhov 2007), to the observed profile of the
H
determination by fitting synthetic line profiles,
calculated with SYNTH3 (Kochukhov 2007), to the observed profile of the
H![]() line, the only hydrogen line for which it was possible to make a reliable
normalisation. In the temperature range expected for RR Lyr, hydrogen lines
are very sensitive to temperature variations and depend very little on
line, the only hydrogen line for which it was possible to make a reliable
normalisation. In the temperature range expected for RR Lyr, hydrogen lines
are very sensitive to temperature variations and depend very little on
![]() variations. In particular, this is expected when the stellar
variations. In particular, this is expected when the stellar
![]() is close
to its minimum. In the case of RR Lyr the use of hydrogen lines as
is close
to its minimum. In the case of RR Lyr the use of hydrogen lines as
![]() indicators is very important because these lines describe the stellar structure
more effectively than any other line, being formed in a wide region of the stellar
atmosphere, and the line wings are free from non-LTE effects. The
indicators is very important because these lines describe the stellar structure
more effectively than any other line, being formed in a wide region of the stellar
atmosphere, and the line wings are free from non-LTE effects. The
![]() obtained with this procedure is
obtained with this procedure is
![]() =
=
![]() K.
We note that these error bars are what we obtain from the fitting of
the hydrogen line profile.
Since there are model uncertainties that are not taken into account in
this fitting procedure, these error bars are probably underestimated.
Figure 5 shows the comparison between the observed H
K.
We note that these error bars are what we obtain from the fitting of
the hydrogen line profile.
Since there are model uncertainties that are not taken into account in
this fitting procedure, these error bars are probably underestimated.
Figure 5 shows the comparison between the observed H![]() line profile and the synthetic profiles calculated with the adopted stellar
parameters, as well as the synthetic profiles obtained by either increasing or decreasing
line profile and the synthetic profiles calculated with the adopted stellar
parameters, as well as the synthetic profiles obtained by either increasing or decreasing
![]() by 50 K.
by 50 K.
![\begin{figure}
\par\includegraphics[width=8.8cm,clip]{figures/14471fg5.ps}
\end{figure}](/articles/aa/full_html/2010/11/aa14471-10/img40.png)
|
Figure 5:
Comparison between the observed H |
| Open with DEXTER | |
Figure 5 shows a clear wavelength shift in the observed H![]() core
relative to its wings and to the metal lines formed in deeper layers.
This is caused by a velocity gradient in the outer layers of the star
(Van Hoof & Struve 1953; Mathias et al. 1995 for RR Lyr).
core
relative to its wings and to the metal lines formed in deeper layers.
This is caused by a velocity gradient in the outer layers of the star
(Van Hoof & Struve 1953; Mathias et al. 1995 for RR Lyr).
Another spectroscopic indicator for
![]() is provided by the analysis of metallic
lines. In particular,
is provided by the analysis of metallic
lines. In particular,
![]() is determined by eliminating the correlation
between line abundance and line excitation potential (
is determined by eliminating the correlation
between line abundance and line excitation potential (
![]() )
for a given
ion/element. This procedure can lead to erroneous parameters, in particular for
stars such as RR Lyr where non-LTE effects could be large and the
)
for a given
ion/element. This procedure can lead to erroneous parameters, in particular for
stars such as RR Lyr where non-LTE effects could be large and the
![]() determination is complicated by the pulsation (see Sect. 6.1). For this reason, we decided not to take this indicator into account in our analysis, but to use it just as a check of
the adopted
determination is complicated by the pulsation (see Sect. 6.1). For this reason, we decided not to take this indicator into account in our analysis, but to use it just as a check of
the adopted
![]() value. This check pointed towards values comparable to the one we found from the H
value. This check pointed towards values comparable to the one we found from the H![]() line profile fitting.
line profile fitting.
5.2 The surface gravity
The surface gravity can be derived using two independent methods:
based on line profile fitting of gravity-sensitive
metal lines with developed wings, and based on
the ionisation balance of several elements.
For RR Lyrae stars, the Mg I lines are the most suitable lines for the first method. Described in Fuhrmann et al. (1997), the
first method assumes that the wings of the Mg I lines at
![]() 5167, 5172, and 5183 Å are very sensitive to
5167, 5172, and 5183 Å are very sensitive to
![]() variations.
We decided to use this method only as a check of
variations.
We decided to use this method only as a check of
![]() and not of the parameter determination.
The first reason for doing this is the large uncertainty
in the
and not of the parameter determination.
The first reason for doing this is the large uncertainty
in the
![]() and
and
![]() values that, given the available spectral
resolution and SNR, could not be precisely determined. Another
reason is the slight line asymmetry (clearly visible for the
strong lines, such as Mg I), which makes precise line profile fitting impossible.
A third reason is the uncertainty in the
values that, given the available spectral
resolution and SNR, could not be precisely determined. Another
reason is the slight line asymmetry (clearly visible for the
strong lines, such as Mg I), which makes precise line profile fitting impossible.
A third reason is the uncertainty in the
![]() value, which will be discussed in
detail in Sect. 6.1.
The comparison is particularly difficult because the Mg abundance is
about 1 dex below solar, which ensures that the wings of these
lines are not very pronounced.
value, which will be discussed in
detail in Sect. 6.1.
The comparison is particularly difficult because the Mg abundance is
about 1 dex below solar, which ensures that the wings of these
lines are not very pronounced.
The second method for surface gravity determination assumes
ionisation equilibrium, but this method is extremely sensitive to the
non-LTE effects present for each ion/element. Since we are unable to
apply the line profile fitting to the Mg I lines with developed wings, we assume ionisation equilibrium to determine
![]() ,
comparing the result with that obtained for the Mg I lines. In adopting the ionisation equilibrium, for
some elements we also took into account the non-LTE corrections predicted by
various authors for some specific elements in solar-type metal-poor stars. From the
ionisation equilibrium, we obtained
,
comparing the result with that obtained for the Mg I lines. In adopting the ionisation equilibrium, for
some elements we also took into account the non-LTE corrections predicted by
various authors for some specific elements in solar-type metal-poor stars. From the
ionisation equilibrium, we obtained
![]() =
= ![]() .
This value was derived using only the lines with an equivalent width
smaller than 75 mÅ, to minimise both the non-LTE effects and the
uncertainty in the
.
This value was derived using only the lines with an equivalent width
smaller than 75 mÅ, to minimise both the non-LTE effects and the
uncertainty in the
![]() (both
being more pronounced for the strong lines), and to assure a large enough number
of lines, in particular for iron. We compared this value with those for the observed
profiles of the Mg I lines with developed wings and obtained a good
agreement, in particular when we adopt a depth-dependent
(both
being more pronounced for the strong lines), and to assure a large enough number
of lines, in particular for iron. We compared this value with those for the observed
profiles of the Mg I lines with developed wings and obtained a good
agreement, in particular when we adopt a depth-dependent
![]() (see Sect. 6.1). For this comparison, we used the line
parameters of the Mg I lines adopted by Ryabchikova et al. (2009).
(see Sect. 6.1). For this comparison, we used the line
parameters of the Mg I lines adopted by Ryabchikova et al. (2009).
Our value for the surface gravity is consistent with the ionisation equilibrium
of Fe I/Fe II and a few other elements, such as
Si I/Si II and Ti I/Ti II.
For Ca and V, we do not infer ionisation equilibrium, even within the error
bars, but we measured only one line for both Ca II and V I.
Taking into account the non-LTE corrections for Ca I
(![]() +0.1-0.2) and Ca II (almost in LTE) given by
Mashonkina et al. (2006), ionisation equilibrium is indeed then found for that element. In the case of chromium, several Cr I and Cr II lines have theoretically calculated oscillator
strengths, which may influence the final abundance results.
+0.1-0.2) and Ca II (almost in LTE) given by
Mashonkina et al. (2006), ionisation equilibrium is indeed then found for that element. In the case of chromium, several Cr I and Cr II lines have theoretically calculated oscillator
strengths, which may influence the final abundance results.
Since RR Lyr's effective temperature is too low for it to exhibit
a sufficient number of He lines (though they are detected - see
Preston 2009), we are unable to measure the atmospheric He abundance.
Ryabchikova et al. (2009) tested the effect of a strong He depletion in the atmosphere of
the solar-type star HD 49933, concluding that a depleted He abundance would
affect only the
![]() determination and leave
determination and leave
![]() unchanged within the error bars of
0.2 dex. We also tested the effect of a He overabundance for RR Lyr. If we assume X=0.5 and Y=0.49,
we find a general abundance decrease, e.g., Fe decreases
0.3 dex. In addition, we observe a variation in the
pressure-sensitive lines such as the Mg I lines with extended wings leading to changes in
unchanged within the error bars of
0.2 dex. We also tested the effect of a He overabundance for RR Lyr. If we assume X=0.5 and Y=0.49,
we find a general abundance decrease, e.g., Fe decreases
0.3 dex. In addition, we observe a variation in the
pressure-sensitive lines such as the Mg I lines with extended wings leading to changes in
![]() that do not exceed our error bars.
that do not exceed our error bars.
5.3 LTE abundance analysis
Our main source of the atomic parameters of spectral lines is the VALD database. The LTE abundance analysis was based on equivalent widths, analysed with a modified version (Tsymbal 1996) of the WIDTH9 code (Kurucz 1993). We opted for equivalent widths because of the small line asymmetry and the uncertainty about the form of the microturbulent velocity, making the synthetic line profile fitting more uncertain. We intend to analyse in the same consistent way the other collected spectra of RR Lyr, which exhibit a far more pronounced line asymmetry, and therefore will be analysed mostly using equivalent widths.
In total, about 700 lines were measured with equivalent widths, but after a check against both the solar spectrum
and the spectrum of HD 49933
(Ryabchikova et al. 2009),
we chose to keep 617 lines of
26 different elements and 32 different ions. We also tried to keep a set of
lines uniformly distributed over the range of equivalent widths, wavelength,
and excitation potentials, in particular for important ions such as Fe I,
for which we kept 284 lines. We used nearly all unblended spectral lines with accurate
atomic parameters, except lines in spectral regions where the
continuum normalisation
was too uncertain. RR Lyr shows a strong underabundance for almost every measured
ion/element. For this reason, it was possible to infer only approximate abundance values or
upper limits to the abundance of some ions whose lines were too weak to measure equivalent widths.
For these measurements, we used synthetic line profile fitting, since these lines
were too shallow to manifest both any visible line asymmetry and
![]() dependence.
dependence.
Microturbulence was determined by minimizing the correlation between
equivalent width and abundance for several ions. We used mainly
Fe I lines since this is the ion that provides the largest number
of lines within a wide range in equivalent widths, but the
correlations obtained with Ti I, Ti II, Cr I,
Cr II, Fe II, and Ni I were also taken into
account. Using all the available lines, we could not find a unique
value for the
![]() able to completely remove the correlation between
equivalent width and abundance. In particular, it was possible to effectively remove
this correlation using only the lines with an equivalent width
smaller than 75 mÅ, while the stronger lines exhibited a steep abundance
increase with increasing equivalent width. Using only the lines with an
equivalent width of less than 75 mÅ we obtained a
able to completely remove the correlation between
equivalent width and abundance. In particular, it was possible to effectively remove
this correlation using only the lines with an equivalent width
smaller than 75 mÅ, while the stronger lines exhibited a steep abundance
increase with increasing equivalent width. Using only the lines with an
equivalent width of less than 75 mÅ we obtained a
![]() of
of
![]()
![]() ,
while using all available lines we obtained a value of
,
while using all available lines we obtained a value of
![]()
![]() .
In this last case, the plot shows that
the correlation is only statistically minimised, as it yields an
underestimated abundance for the medium-strength lines and an
overestimated abundance for the strong lines (see lower plot
of Fig. 6).
.
In this last case, the plot shows that
the correlation is only statistically minimised, as it yields an
underestimated abundance for the medium-strength lines and an
overestimated abundance for the strong lines (see lower plot
of Fig. 6).
In the literature, several authors mentioned the
possibility of a depth-dependent
![]() for RR Lyrae stars (Clementini et al. 1996; Takeda et al. 2006). Therefore, given the
impossibility of finding a clear
for RR Lyrae stars (Clementini et al. 1996; Takeda et al. 2006). Therefore, given the
impossibility of finding a clear
![]() value, we decided to derive the
profile of a depth-dependent
value, we decided to derive the
profile of a depth-dependent
![]() using the available measured lines.
This part of the work is discussed in Sect. 6.1.
using the available measured lines.
This part of the work is discussed in Sect. 6.1.
The full set of derived abundances, adopting both a constant and a depth
dependent
![]() ,
is shown in Table 2. The last column of
Table 2 indicates the solar abundances by
Asplund et al. (2005)
for comparison.
,
is shown in Table 2. The last column of
Table 2 indicates the solar abundances by
Asplund et al. (2005)
for comparison.
![\begin{figure}
\par\includegraphics[width=8.4cm,clip]{figures/14471fg6.ps}
\end{figure}](/articles/aa/full_html/2010/11/aa14471-10/img49.png)
|
Figure 6:
Plots of individual abundances for 284 Fe I lines versus the
measured equivalent width for RR Lyr, adopting a constant (open circles) and
depth-dependent (open squares)
|
| Open with DEXTER | |
Table 2: LTE atmospheric abundances for RR Lyr.
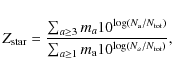
The stellar metallicity (Z) is defined as follows
where a is the atomic number of an element with atomic mass ma. Making use of the abundances obtained from the performed analysis and assuming the depth-dependent
We used spectral synthesis with SYNTH3 to check the hyperfine structure (hfs) effects on the abundance determination of Mn, Cu, Zn, Ba, and Pr. For each measured line of these elements, hfs effects are smaller than 0.01 dex, except for the Ba II line at
![]() 6141 Å for which the hfs correction is -0.1 dex, bringing the line abundance closer to the mean Ba abundance. The hfs calculations for barium were taken from McWilliam (1998), who does not list the parameters for the Ba line at
6141 Å for which the hfs correction is -0.1 dex, bringing the line abundance closer to the mean Ba abundance. The hfs calculations for barium were taken from McWilliam (1998), who does not list the parameters for the Ba line at ![]() 6496 Å, for which, however, we do not expect any significant hfs effect (Mashonkina & Zhai 2006).
6496 Å, for which, however, we do not expect any significant hfs effect (Mashonkina & Zhai 2006).
The abundance uncertainties given in Table 2 are the standard
deviation from the mean abundance (hence no uncertainties are given if the abundances were derived from a single line).
More realistic error bars for each
element/ion can be found in Ryabchikova et al. (2009) where a rigorous derivation of the
abundance uncertainties is given on the basis of the adopted uncertainties in
the stellar parameters. This direct comparison is possible because RR Lyr and
HD 49933 have a similar
![]() and in particular similar values of the
uncertainties in both
and in particular similar values of the
uncertainties in both
![]() and
and
![]() .
.
Given the quality of the data and the slight line asymmetry, it was not possible
to obtain definite values for both
![]() and
and
![]() ,
but just to constrain
their values. We found that
,
but just to constrain
their values. We found that
![]() lies between 0 and 9
lies between 0 and 9
![]() ,
and
,
and
![]() between 6 and 11
between 6 and 11
![]() .
In particular, for the minimum given
.
In particular, for the minimum given
![]() we
obtained the maximum
we
obtained the maximum
![]() and vice versa, as both effects contribute to line broadening. We note that the
spectral lines cannot be explained by only the effects of rotational broadening (
and vice versa, as both effects contribute to line broadening. We note that the
spectral lines cannot be explained by only the effects of rotational broadening (
![]() ).
The constraints on
).
The constraints on
![]() that we obtained are in good agreement with those obtained by Kolenberg (2002)
through analysis of the line profile variations of the star. They are
also in accord with the findings by Peterson et al. (1996),
who measured the line widths for 27 RR Lyrae (of which 8 are RRab)
variables via cross-correlation analysis. They estimated an upper limit
of 10 km s-1 to
that we obtained are in good agreement with those obtained by Kolenberg (2002)
through analysis of the line profile variations of the star. They are
also in accord with the findings by Peterson et al. (1996),
who measured the line widths for 27 RR Lyrae (of which 8 are RRab)
variables via cross-correlation analysis. They estimated an upper limit
of 10 km s-1 to
![]() in all cases.
in all cases.
6 Discussion
6.1 A depth-dependent microturbulent velocity
As previously mentioned, we calculated the profile of a depth-dependent
![]() on the basis of the available equivalent widths obtained for several Fe I lines spanning a large range of values. A depth-dependent
on the basis of the available equivalent widths obtained for several Fe I lines spanning a large range of values. A depth-dependent
![]() was previously
suggested by several authors, such as
Takeda et al. (2006),
who found evidence that ``strongly suggest that the
microturbulence increases with height in the atmosphere of RR Lyrae stars, and
that a simple application of the
was previously
suggested by several authors, such as
Takeda et al. (2006),
who found evidence that ``strongly suggest that the
microturbulence increases with height in the atmosphere of RR Lyrae stars, and
that a simple application of the
![]() value derived from weak/medium-strength
lines to stronger lines may result in an overestimation of the abundances''.
value derived from weak/medium-strength
lines to stronger lines may result in an overestimation of the abundances''.
Figure 6 displays the line abundance as a function of the measured
equivalent width for all the measured Fe I lines in the spectrum of
RR Lyr, calculated by assuming constant (bottom) and depth-dependent
(middle)
![]() .
It is clear that the use of a constant
.
It is clear that the use of a constant
![]() leads to an
underestimation of the abundance of the medium-strength lines and an
overestimation for the strong lines. In Fig. 6, we included as
comparison the line abundance as a function of the measured equivalent width
in HD 49933 for the set of common Fe I lines. This demonstrates that
the observed behaviour does not depend on the set of adopted lines.
leads to an
underestimation of the abundance of the medium-strength lines and an
overestimation for the strong lines. In Fig. 6, we included as
comparison the line abundance as a function of the measured equivalent width
in HD 49933 for the set of common Fe I lines. This demonstrates that
the observed behaviour does not depend on the set of adopted lines.
We believe that this phenomenon could be explained by both strong non-LTE
effects and a depth-dependent
![]() .
Generally speaking, non-LTE effects
are stronger for deep lines than for shallow lines, and
adopting line formation in LTE would lead to a higher abundance, in
agreement with what we observe here. Gehren et al. (2001) showed that for
solar-type stars there is a substantial Fe I underpopulation leading
to stronger Fe line wings when LTE is assumed, while Fe II is in
LTE, but Gehren et al. (2001) adopted a model atom for Fe that did not include
high-excitation levels.
Mashonkina et al. (2009)
analysed the
Fe I/Fe II ionisation equilibrium in four solar-type stars
and in the Sun concluding that the inclusion of the high-excitation levels
in the Fe I model atom substantially reduced the non-LTE effects. RR Lyr
is a metal-poor giant for which non-LTE effects are expected to be stronger
than in solar-type stars. If the deviation we measure were caused by
non-LTE effects, it should only produce a deviation of about 0.5 dex
for the stronger lines. We believe that the non-LTE effects are only
partially responsible for the obtained deviation, because we observe it
in all measured ions with a similar magnitude and always in the same
direction. These ions include those for which non-LTE effects are supposed to
be weak, such as Fe II, which shows deviations even stronger than those
registered for Fe I. We note that non-LTE effects work differently for different
ions, leading to deviations in both directions and with a wide range of
magnitudes. For this reason, we believe that a depth-dependent
.
Generally speaking, non-LTE effects
are stronger for deep lines than for shallow lines, and
adopting line formation in LTE would lead to a higher abundance, in
agreement with what we observe here. Gehren et al. (2001) showed that for
solar-type stars there is a substantial Fe I underpopulation leading
to stronger Fe line wings when LTE is assumed, while Fe II is in
LTE, but Gehren et al. (2001) adopted a model atom for Fe that did not include
high-excitation levels.
Mashonkina et al. (2009)
analysed the
Fe I/Fe II ionisation equilibrium in four solar-type stars
and in the Sun concluding that the inclusion of the high-excitation levels
in the Fe I model atom substantially reduced the non-LTE effects. RR Lyr
is a metal-poor giant for which non-LTE effects are expected to be stronger
than in solar-type stars. If the deviation we measure were caused by
non-LTE effects, it should only produce a deviation of about 0.5 dex
for the stronger lines. We believe that the non-LTE effects are only
partially responsible for the obtained deviation, because we observe it
in all measured ions with a similar magnitude and always in the same
direction. These ions include those for which non-LTE effects are supposed to
be weak, such as Fe II, which shows deviations even stronger than those
registered for Fe I. We note that non-LTE effects work differently for different
ions, leading to deviations in both directions and with a wide range of
magnitudes. For this reason, we believe that a depth-dependent
![]() is mostly
responsible for the observed deviations. A depth-dependent
is mostly
responsible for the observed deviations. A depth-dependent
![]() is also
supported by modelling RR Lyr stars as shown by
Fokin et al. (1999), who observed pulsation-dependent variations in the microturbulent velocity
(see their Fig. 3).
is also
supported by modelling RR Lyr stars as shown by
Fokin et al. (1999), who observed pulsation-dependent variations in the microturbulent velocity
(see their Fig. 3).
The depth-dependent
![]() profile was obtained by fitting
profile was obtained by fitting![]() the line abundance in the plane equivalent
width versus line abundance. We performed this procedure for Fe I, given
its large number of measured lines, and then tested the solution with the other
ions. For each line, the code searches the most likely
individual line abundance, assuming a certain dependence of the
microturbulent velocity on the atmospheric depth. This dependence is varied
to minimise the dispersion between the observed and the theoretical line
widths over the whole set of measured spectral lines. Since the equivalent
widths are of lines that formed in a small fraction of the stellar
atmosphere, it is impossible to obtain a
the line abundance in the plane equivalent
width versus line abundance. We performed this procedure for Fe I, given
its large number of measured lines, and then tested the solution with the other
ions. For each line, the code searches the most likely
individual line abundance, assuming a certain dependence of the
microturbulent velocity on the atmospheric depth. This dependence is varied
to minimise the dispersion between the observed and the theoretical line
widths over the whole set of measured spectral lines. Since the equivalent
widths are of lines that formed in a small fraction of the stellar
atmosphere, it is impossible to obtain a
![]() value at each atmospheric
depth. For this reason, it was necessary to speculate about the analytic form
of the
value at each atmospheric
depth. For this reason, it was necessary to speculate about the analytic form
of the
![]() dependence on the atmospheric depth. We tested both a step-like
function and a low-degree polynomial function. We chose the latter
because of the unrealistically steep and large step needed for the
step-like function.
dependence on the atmospheric depth. We tested both a step-like
function and a low-degree polynomial function. We chose the latter
because of the unrealistically steep and large step needed for the
step-like function.
Figure 7 shows the profile obtained for the depth-dependent
![]() in comparison with the sound speed calculated by LL MODELS. According to the
results of Fokin et al. (1999),
the
in comparison with the sound speed calculated by LL MODELS. According to the
results of Fokin et al. (1999),
the
![]() should always be subsonic due to strong dissipation effects. In Fig. 7 this is the case, except for the region between
should always be subsonic due to strong dissipation effects. In Fig. 7 this is the case, except for the region between
![]() equal to -3.5 and -5.5
equal to -3.5 and -5.5
![]() ,
where
,
where
![]() becomes supersonic. This, however, should be interpreted with caution since
the numerical calculation of the sound speed with the LL MODELS code may be affected by accuracy loss in the
uppermost layers where the thermodynamic variables (such as pressure and density)
are slowly changing functions of atmospheric depth. We also note that our
empirical estimation of the
becomes supersonic. This, however, should be interpreted with caution since
the numerical calculation of the sound speed with the LL MODELS code may be affected by accuracy loss in the
uppermost layers where the thermodynamic variables (such as pressure and density)
are slowly changing functions of atmospheric depth. We also note that our
empirical estimation of the
![]() may contain systematic
uncertainties, and thus the supersonic regime shown in Fig. 7
may have little to do with reality. Nevertheless, the general behaviour of
may contain systematic
uncertainties, and thus the supersonic regime shown in Fig. 7
may have little to do with reality. Nevertheless, the general behaviour of
![]() with depth (i.e., strong increase in superficial layers)
plausibly reflects a real physical phenomenon.
with depth (i.e., strong increase in superficial layers)
plausibly reflects a real physical phenomenon.
![\begin{figure}
\par\includegraphics[width=8.8cm,clip]{figures/14471fg7.ps}
\end{figure}](/articles/aa/full_html/2010/11/aa14471-10/img57.png)
|
Figure 7: Comparison between the profile of the microturbulent velocity (full line) and of the sound speed (dashed line) as a function of atmospheric depth. |
| Open with DEXTER | |
Assuming a depth-dependent
![]() ,
the abundances of most ions change, in
particular those with a large number of strong lines. As expected, for most of the
ions the abundance increases instead of
decreasing. This phenomenon is explained by our
adopted value of constant
,
the abundances of most ions change, in
particular those with a large number of strong lines. As expected, for most of the
ions the abundance increases instead of
decreasing. This phenomenon is explained by our
adopted value of constant
![]() being overestimated because it was obtained by
statistically minimising the correlation abundance versus equivalent width.
Because we have a large number of middle-strength lines, a small number of
strong lines and an overestimated
being overestimated because it was obtained by
statistically minimising the correlation abundance versus equivalent width.
Because we have a large number of middle-strength lines, a small number of
strong lines and an overestimated
![]() we obtained an
underestimated abundance (see
the bottom plot of Fig. 6). When applying the
depth-dependent
we obtained an
underestimated abundance (see
the bottom plot of Fig. 6). When applying the
depth-dependent
![]() ,
the middle-strength lines (responsible for
the underestimated abundance) yield an abundance similar to the shallow
and strong lines, thus leading to a higher final abundance.
This effect is visible for ions with a large number of
lines, such as Fe I.
For elements with a few lines and some of them very strong, such as Ba II,
the final abundance instead decreases, with a considerable decrease also in the standard
deviation.
,
the middle-strength lines (responsible for
the underestimated abundance) yield an abundance similar to the shallow
and strong lines, thus leading to a higher final abundance.
This effect is visible for ions with a large number of
lines, such as Fe I.
For elements with a few lines and some of them very strong, such as Ba II,
the final abundance instead decreases, with a considerable decrease also in the standard
deviation.
6.2 Comparison with previous determinations
Since we propose a different approach to the analysis of RR Lyrae stars to determine their physical parameters, it is important to compare our results with those previously obtained by other authors. The main publications on this topic containing an abundance analysis and parameter determination of RR Lyr itself are Clementini et al. (1995), Lambert et al. (1996), and Takeda et al. (2006).
Clementini et al. (1995)
analysed several field RR Lyrae stars to derive broad band
photometric calibrations for both fundamental parameters and metallicity. Their
spectra of RR Lyr covered a large wavelength range with a moderate resolution
(
![]() )
and a high SNR (probably assumed per pixel) of about 460. They
observed RR Lyr at pulsational phases of 0.70 and 0.73, around minimum
light. Since they did not identify any systematic difference between the two spectra,
they summed them to obtain one high-SNR spectrum. They compared the
)
and a high SNR (probably assumed per pixel) of about 460. They
observed RR Lyr at pulsational phases of 0.70 and 0.73, around minimum
light. Since they did not identify any systematic difference between the two spectra,
they summed them to obtain one high-SNR spectrum. They compared the
![]() value
obtained from broad band photometry by several other authors between 1975
and 1994, and, taking into account these comparisons, they built their own
calibration leading to a
value
obtained from broad band photometry by several other authors between 1975
and 1994, and, taking into account these comparisons, they built their own
calibration leading to a
![]() value of
value of
![]() K. They derived the
surface gravity from the stellar mass and radius, obtaining a
K. They derived the
surface gravity from the stellar mass and radius, obtaining a
![]() value of
value of
![]() dex. The microturbulent velocity was derived in the usual way
(minimisation of the correlation between line abundance and equivalent widths)
obtaining a value of 4.2
dex. The microturbulent velocity was derived in the usual way
(minimisation of the correlation between line abundance and equivalent widths)
obtaining a value of 4.2 ![]() 0.2
0.2
![]() .
Clementini et al. (1995) also mentioned the
possibility of a depth-dependent
.
Clementini et al. (1995) also mentioned the
possibility of a depth-dependent
![]() ,
but
they concluded that, if it were present, a
,
but
they concluded that, if it were present, a
![]() depth-dependency would only be small
and affect the abundances by just 0.1 dex (0.2 dex for the elements with
a large number of strong lines). We confirm this estimate in our present work (see Table 2).
Most of their abundances are for LTE, except for
oxygen and sodium that were analysed assuming non-LTE. Table 3
shows a comparison between the abundances obtained by Clementini et al. (1995) and
those derived in this work. The comparison shows a rather close agreement between the two sets of
abundances, where for only Al I, Sc II, Mn I, and Zn I we find a small disagreement.
depth-dependency would only be small
and affect the abundances by just 0.1 dex (0.2 dex for the elements with
a large number of strong lines). We confirm this estimate in our present work (see Table 2).
Most of their abundances are for LTE, except for
oxygen and sodium that were analysed assuming non-LTE. Table 3
shows a comparison between the abundances obtained by Clementini et al. (1995) and
those derived in this work. The comparison shows a rather close agreement between the two sets of
abundances, where for only Al I, Sc II, Mn I, and Zn I we find a small disagreement.
Table 3: Comparison between the atmospheric ion abundances relative to the Sun obtained by Clementini et al. (1995) and in this work.
Lambert et al. (1996)
observed a set of RR Lyrae stars with a spectral resolution of
23 000 to obtain narrow and broad band photometric calibrations for
fundamental parameters and metallicity. RR Lyr was observed at eight different
phases, one of them close to the phase of minimum light and one close to the phase
of maximum radius. The spectrum obtained close to the phase of maximum radius
has a SNR (assumed per pixel) of ![]() 100. For each phase, they derived the
fundamental parameters from both photometry (adopting previously existing
calibrations) and spectroscopy. From the photometric calibration that they
obtained, for the spectrum at a phase close to maximum radius,
100. For each phase, they derived the
fundamental parameters from both photometry (adopting previously existing
calibrations) and spectroscopy. From the photometric calibration that they
obtained, for the spectrum at a phase close to maximum radius,
![]() = 6350
= 6350 ![]() 200 K and
200 K and
![]() = 2.6
= 2.6 ![]() 0.2 dex, while from spectroscopy
they derived
0.2 dex, while from spectroscopy
they derived
![]() = 6200
= 6200 ![]() 200 K and
200 K and
![]() = 2.3
= 2.3 ![]() 0.2 dex. Lambert et al. (1996)
found a constant
0.2 dex. Lambert et al. (1996)
found a constant
![]() throughout the stellar atmosphere, but they also obtained a rather constant
throughout the stellar atmosphere, but they also obtained a rather constant
![]() throughout the pulsation cycle
(between 3.6
throughout the pulsation cycle
(between 3.6 ![]() 0.3
0.3
![]() and 4.4
and 4.4 ![]() 0.5
0.5
![]() ). This
result is surprising because several pulsation models of RR Lyrae
stars exhibit large variations in the
). This
result is surprising because several pulsation models of RR Lyrae
stars exhibit large variations in the
![]() during the pulsational cycle.
We will study this issue in detail in the forthcoming work. In general, the high value obtained
by Lambert et al. (1996) shows the turbulent motions present in the atmosphere
and agrees with the large value we also obtained when a constant
during the pulsational cycle.
We will study this issue in detail in the forthcoming work. In general, the high value obtained
by Lambert et al. (1996) shows the turbulent motions present in the atmosphere
and agrees with the large value we also obtained when a constant
![]() is assumed. Lambert et al. (1996) derived the Ca and Fe abundance for both LTE
and non-LTE, adopting only the lines that are not deeper than 100 mÅ. In LTE, they obtained
is assumed. Lambert et al. (1996) derived the Ca and Fe abundance for both LTE
and non-LTE, adopting only the lines that are not deeper than 100 mÅ. In LTE, they obtained
![]() dex and
dex and
![]() dex. In non-LTE, they obtained a
correction of about 0.2 dex for Fe I and no correction for
Fe II, but, as mentioned in Sect. 6.1, we believe that the
non-LTE correction for Fe I is much smaller. The non-LTE correction they
obtained for Ca I was
dex. In non-LTE, they obtained a
correction of about 0.2 dex for Fe I and no correction for
Fe II, but, as mentioned in Sect. 6.1, we believe that the
non-LTE correction for Fe I is much smaller. The non-LTE correction they
obtained for Ca I was ![]() 0.05 dex. Both the Fe and Ca
abundances presented by Lambert et al. (1996) are in good agreement with what we
obtained. There is the possibility that the higher
0.05 dex. Both the Fe and Ca
abundances presented by Lambert et al. (1996) are in good agreement with what we
obtained. There is the possibility that the higher
![]() and
and
![]() relative
to what we adopted compensate each other leading to values very close to
those obtained with a lower
relative
to what we adopted compensate each other leading to values very close to
those obtained with a lower
![]() and
and
![]() .
.
Takeda et al. (2006) analysed five spectra of RR Lyr to derive
spectroscopically the fundamental parameters and the abundances of O, Si, and
Fe. The spectra were obtained at high resolution (
![]() )
with a rather
high SNR (
)
with a rather
high SNR (![]() 350-400), but for a very limited wavelength range intended to
cover mainly the oxygen triplet at
350-400), but for a very limited wavelength range intended to
cover mainly the oxygen triplet at
![]() Å. One of these
five spectra was obtained at a pulsational phase close to the phase of maximum
radius. The fundamental parameters were derived by minimising the correlations
of line abundance with both excitation potential (
Å. One of these
five spectra was obtained at a pulsational phase close to the phase of maximum
radius. The fundamental parameters were derived by minimising the correlations
of line abundance with both excitation potential (
![]() )
and ionisation
equilibrium (
)
and ionisation
equilibrium (
![]() ). The hydrogen line wings were used as check of
the parameters determined, the inverse of the strategy we applied. For this phase,
they obtained
). The hydrogen line wings were used as check of
the parameters determined, the inverse of the strategy we applied. For this phase,
they obtained
![]() = 6040
= 6040 ![]() 40 K,
40 K,
![]() = 2.09
= 2.09 ![]() 0.1 dex, and
0.1 dex, and
![]() = 3.0
= 3.0 ![]() 0.1
0.1
![]() .
The
.
The
![]() value obtained by Takeda et al. (2006) is in
very good agreement with what we have found using a constant
value obtained by Takeda et al. (2006) is in
very good agreement with what we have found using a constant
![]() .
They
also strongly suggest the presence of a depth-dependent
.
They
also strongly suggest the presence of a depth-dependent
![]() for RR Lyrae
stars. Takeda et al. (2006) analysed two sets of oxygen lines in non-LTE obtaining two values
for the O abundance of -4.11 dex and -4.00 dex.
We believe that the difference between their two obtained values is due to their adopting a constant
for RR Lyrae
stars. Takeda et al. (2006) analysed two sets of oxygen lines in non-LTE obtaining two values
for the O abundance of -4.11 dex and -4.00 dex.
We believe that the difference between their two obtained values is due to their adopting a constant
![]() .
The strong infrared oxygen triplet is very sensitive to the adopted
.
The strong infrared oxygen triplet is very sensitive to the adopted
![]() .
The O abundance we obtained
is very close to -4.00 dex assuming both a constant and a depth-dependent
.
The O abundance we obtained
is very close to -4.00 dex assuming both a constant and a depth-dependent
![]() .
Takeda et al. (2006)
also derived the Si and Fe abundance in LTE, obtaining
respectively -5.93 dex and -5.82 dex. These two values
do not match our results very well (we obtain a higher Si abundance and
a lower Fe abundance). We
are not able to explain this difference since it cannot be due to the
small differences in the adopted stellar parameters.
.
Takeda et al. (2006)
also derived the Si and Fe abundance in LTE, obtaining
respectively -5.93 dex and -5.82 dex. These two values
do not match our results very well (we obtain a higher Si abundance and
a lower Fe abundance). We
are not able to explain this difference since it cannot be due to the
small differences in the adopted stellar parameters.
The effective temperatures determined in these studies may not be directly comparable because the analysed spectra were obtained at different Blazhko phases. A more reasonable comparison can be done for the surface gravity because it is supposed to change less during the pulsation cycle.
What clearly emerges is a systematic
difference between the
![]() inferred from both stellar mass and radius and from the
ionisation equilibrium. The ionisation equilibrium leads to a lower
inferred from both stellar mass and radius and from the
ionisation equilibrium. The ionisation equilibrium leads to a lower
![]() than that derived by the assumed stellar mass and radius. Our
than that derived by the assumed stellar mass and radius. Our
![]() value lies in-between and is well validated by the fit of the magnesium
lines with developed wings. This method is independent of both the ionisation
equilibrium and the assumed stellar mass and radius.
value lies in-between and is well validated by the fit of the magnesium
lines with developed wings. This method is independent of both the ionisation
equilibrium and the assumed stellar mass and radius.
The other parameters that can be directly compared are the elemental abundances. We do not expect these to vary within the pulsation cycle, unless the pulsation is able to bring material from the inner core up to the stellar atmosphere, a possibility that we deem unlikely. Comparing the abundances obtained in the three aforementioned studies and in our work, we note good agreement but for a few exceptions. This means that if static models could be applied to RR Lyrae stars, they may be applicable to many phases (not all!), but we will tackle this issue in our forthcoming work on the analysis of the other acquired spectra of RR Lyr.
From the point of view of the atmospheric modelling, the main
difference between earlier work and ours is the adoption of an
abundance-dependent model atmosphere for an RR Lyrae type star.
The impact of depth-dependent microturbulent velocity
and individual chemistry is shown in Fig. 8. As expected, strong
underabundance makes the temperature in the surface layers higher
compared to solar or scaled solar models. Introduction of the depth-dependent
![]() affects the strongest spectral features, leading to weaker absorption
at their line centre. This, in turn, decreases the line absorption
coefficient and thus leads to a further increase
in the temperature. For instance, the temperature difference between
models computed with constant and depth-dependent
microturbulent velocities (see Fig. 7) can amount to as much as 300 K.
On the other hand, only the strongest lines are affected by this modification in model temperature structure
and thus the statistical results of abundance analysis are not affected that much, as shown in Table 2.
affects the strongest spectral features, leading to weaker absorption
at their line centre. This, in turn, decreases the line absorption
coefficient and thus leads to a further increase
in the temperature. For instance, the temperature difference between
models computed with constant and depth-dependent
microturbulent velocities (see Fig. 7) can amount to as much as 300 K.
On the other hand, only the strongest lines are affected by this modification in model temperature structure
and thus the statistical results of abundance analysis are not affected that much, as shown in Table 2.
In contrast, line profile analysis of strong lines must be performed with appropriate models that account for the effect of depth-dependent microturbulence. Finally, we do not find any noticeable difference in temperature structure between the scaled-solar model ([M/H]=-1.5), which corresponds to the mean underabundance we found for Fe, and individual abundance models. This allows us to use scaled abundance models to mimic the temperature structure of the star as a first guess. We note, however, that the metallicity is the result of an abundance analysis, which is not known in the beginning. This methodological difficulty is automatically removed using an iterative procedure of abundance analysis as applied in this study.
![\begin{figure}
\par\includegraphics[width=8.8cm,clip]{figures/14471fg8.eps}
\end{figure}](/articles/aa/full_html/2010/11/aa14471-10/img67.png)
|
Figure 8:
Comparison of temperature structures of models computed under
different assumptions about microturbulent velocity
|
| Open with DEXTER | |
7 Conclusions
Fundamental-mode RR Lyrae (RRab) stars pulsate with high
velocities, which, in certain phases, leads to a distortion of their
spectral features.
The aim of this study has been to determine a set of self-consistent
and accurate parameters and abundances for RR Lyr, the prototype
and brightest member of its class.
To achieve this, we collected a set of high-resolution
spectroscopic data at our disposal, obtained with the Robert G. Tull
Coudé
Spectrograph on the 2.7-m telescope of McDonald Observatory.
To derive the most reliable abundances for the star, we determined the
phase in RR Lyr's pulsation cycle at which the atmosphere is ``at
its most quiescent'', the phase of maximum radius. Our assumptions were
strengthened by the Vienna Nonlinear Pulsation Code.
With observations taken at the phase of maximum radius, the fundamental
parameters and the element abundances of RR Lyr were determined by
means of an iterative process. For the determination of the effective
temperature, we used synthetic line profile fitting to the H![]() line and obtained
line and obtained
![]() =
=
![]() K (error bars from the fitting procedure only). For the
K (error bars from the fitting procedure only). For the
![]() determination, we used the condition of ionisation equilibrium and obtained a
determination, we used the condition of ionisation equilibrium and obtained a
![]() value of
value of
![]() at the phase of maximum radius. The LTE abundance analysis based on
element abundances versus equivalent widths could not fit the element
abundances with a single microturbulent velocity (
at the phase of maximum radius. The LTE abundance analysis based on
element abundances versus equivalent widths could not fit the element
abundances with a single microturbulent velocity (
![]() )
value. A depth-dependent
)
value. A depth-dependent
![]() is
physically plausible for RR Lyrae atmospheres and was previously
suggested (but never derived or quantified) by several authors.
In this work, we have derived, for the first time, the depth-dependent
is
physically plausible for RR Lyrae atmospheres and was previously
suggested (but never derived or quantified) by several authors.
In this work, we have derived, for the first time, the depth-dependent
![]() profile and
quantified the expected abundance variation. By assuming a depth-dependent
profile and
quantified the expected abundance variation. By assuming a depth-dependent
![]() ,
we obtained closer agreement between the element abundances and equivalent widths. In general, the adoption of a fixed
,
we obtained closer agreement between the element abundances and equivalent widths. In general, the adoption of a fixed
![]() value (which is too high) leads to an underestimation of the element
abundances by 0.06 dex (maximum value). Nevertheless, RR Lyr
is shown to be underabundant in all heavy elements, in agreement with
previous studies.
value (which is too high) leads to an underestimation of the element
abundances by 0.06 dex (maximum value). Nevertheless, RR Lyr
is shown to be underabundant in all heavy elements, in agreement with
previous studies.
RR Lyr, the eponym of its class, is one of the most
well-studied RR Lyrae stars. However, many intricacies of its
pulsation remain poorly understood, and to accurately model the star,
we have to take into account complex physics that we are only beginning
to uncover. The star is an asteroseismic target of the Kepler Mission (Borucki et al. 2009) through the Kepler Asteroseismic Science Consortium (KASC, see also Gilliland et al. 2010). Besides finding that the star exhibits amplitude and phase modulation (the so-called Blazhko effect),
Kolenberg et al. (2010) detected, for the first time, the occurrence of half-integer frequencies in the star, i.e., peaks at
![]() etc., with f0
the main pulsation frequency. This phenomenon (``period doubling'') may
be caused by instabilities in the star and connected to the mysterious
Blazhko effect (see Szabó et al. 2010,
in preparation).
To further explore theoretical models of RR Lyr, it is necessary
to know the physical parameters of the star with the highest accuracy
possible.
etc., with f0
the main pulsation frequency. This phenomenon (``period doubling'') may
be caused by instabilities in the star and connected to the mysterious
Blazhko effect (see Szabó et al. 2010,
in preparation).
To further explore theoretical models of RR Lyr, it is necessary
to know the physical parameters of the star with the highest accuracy
possible.
For this reason, an in-depth analysis of the star's atmospheric motions is very timely. We intend to expand this analysis in our forthcoming publications of the star. Our study clearly illustrates that it is crucial to use the appropriate models to correctly interpret the spectral data of RR Lyrae stars, and that high-quality observations can contribute to improving those models.
AcknowledgementsWe kindly thank the referee of this paper, Dr. George Preston, for constructive comments. K.K. is a Hertha Firnberg Fellow, supported by the Austrian Science Foundation (FWF project T359-N2 and FWF stand-alone project P19962). L.F. has received support from the Austrian Science Foundation (FWF project P19962). His research at the Open University (UK) is funded by an STFC Rolling Grant. D.S. is supported by Deutsche Forschungsgemeinschaft (DFG) Research Grant RE1664/7-1. O.K. is a Royal Swedish Academy of Sciences Research Fellow supported by grants from the Knut and Alice Wallenberg Foundation and the Swedish Research Council. We kindly thank Stefano Bagnulo and John Landstreet for the useful discussions and comments during the preparation of the draft.
References
- Asplund, M., Grevesse, N., & Sauval, A. J. 2005, ASP Conf. Ser., 336, 25 [Google Scholar]
- Barklem, P. S., Stempels, H. C., Allende Prieto, C., et al. 2002, A&A, 385, 951 [NASA ADS] [CrossRef] [EDP Sciences] [Google Scholar]
- Beers, T. C., Chiba, M., Yoshii, Y., et al. 2000, AJ, 119, 2866 [NASA ADS] [CrossRef] [Google Scholar]
- Benedict, G. F., McArthur, B. E., Fredrick, L. W., et al. 2002, AJ, 123, 473 [NASA ADS] [CrossRef] [Google Scholar]
- Borucki, W. J., Koch, D., Basri, G., et al. 2010, Science, 327, 977 [NASA ADS] [CrossRef] [PubMed] [Google Scholar]
- Canuto, V. M., & Mazzitelli, I. 1991, ApJ, 370, 295 [NASA ADS] [CrossRef] [Google Scholar]
- Canuto, V. M., & Mazzitelli, I. 1992, ApJ, 389, 724 [NASA ADS] [CrossRef] [Google Scholar]
- Chadid, M., & Gillet, D. 1996, A&A, 308, 481 [NASA ADS] [Google Scholar]
- Chadid, M., Vernin, J., Gillet, D. 2008, A&A, 491, 537 [NASA ADS] [CrossRef] [EDP Sciences] [Google Scholar]
- Clementini, G., Carretta, E., Gratton, R., et al. 1995, AJ, 110, 2319 [NASA ADS] [CrossRef] [Google Scholar]
- Feuchtinger, M. U. 1999, A&A, 351, 103 [NASA ADS] [Google Scholar]
- Fokin, A. B., & Gillet, D. 1997, A&A, 325, 1013 [NASA ADS] [Google Scholar]
- Fokin, A. B., Gillet, D., & Chadid, M. 1999, A&A, 344, 930 [NASA ADS] [Google Scholar]
- Fossati, L., Ryabchikova, T., Bagnulo, S., et al. 2009, A&A, 503, 945 [NASA ADS] [CrossRef] [EDP Sciences] [Google Scholar]
- Fuhrmann, K., Pfeiffer, M., Frank, C., Reetz, J., & Gehren, T. 1997, A&A, 323, 909 [NASA ADS] [Google Scholar]
- Gehren, T., Butler, K., Mashonkina, L., Reetz, J., & Shi, J. 2001, A&A, 366, 981 [NASA ADS] [CrossRef] [EDP Sciences] [Google Scholar]
- Gillet, D., Crowe, R. A. 1988, A&A, 199, 242 [NASA ADS] [Google Scholar]
- Gilliland, R. L., Brown, T. M., Christensen-Dalsgaard, J., et al. 2010, PASP, 122, 131 [NASA ADS] [CrossRef] [Google Scholar]
- Jurcsik, J., Hurta, Zs., Sódor, Á., et al. 2009, MNRAS, 397, 350 [NASA ADS] [CrossRef] [Google Scholar]
- Heiter, U., & Eriksson, K. 2006, A&A, 452, 1039 [NASA ADS] [CrossRef] [EDP Sciences] [Google Scholar]
- Heiter, U., Kupka, F., van't Veer-Menneret, C., et al. 2002, A&A, 392, 619 [NASA ADS] [CrossRef] [EDP Sciences] [Google Scholar]
- Kochukhov, O. 2007, Spectrum synthesis for magnetic, chemically stratified stellar atmospheres, Physics of Magnetic Stars, 109, 118 [Google Scholar]
- Kolenberg, K. 2002, Ph.D. Thesis, University of Leuven, http://www.ster.kuleuven.be/pub/kolenberg_phd/ [Google Scholar]
- Kolenberg, K., Smith, H. A., Gazeas, K. D., et al. 2006, A&A, 459, L577 [Google Scholar]
- Kolenberg, K., Szábo, R., Kurtz, D. W., et al. 2010, ApJ, 713, 198 [Google Scholar]
- Kupka, F., Piskunov, N., Ryabchikova, T. A., Stempels, H. C., & Weiss, W. W. 1999, A&AS, 138, 119 [NASA ADS] [CrossRef] [EDP Sciences] [MathSciNet] [PubMed] [Google Scholar]
- Kurucz, R. 1993, ATLAS9: Stellar Atmosphere Programs and 2 km s-1 grid. Kurucz CD-ROM No. 13 (Cambridge: Smithsonian Astrophysical Observatory) [Google Scholar]
- LaCluyzé, A., Smith, H. A., Gill, E.-M., et al. 2004, AJ, 127, 1653 [NASA ADS] [CrossRef] [Google Scholar]
- Lambert, D. L., Heath, J. E., Lemke, M., & Drake, J. 1996, ApJS, 103, 183 [NASA ADS] [CrossRef] [Google Scholar]
- Manduca, A., Bell, R. A., Barbes, T. G., et al. 1981, ApJ, 250, 312 [NASA ADS] [CrossRef] [Google Scholar]
- Mashonkina, L., & Zhao, G. 2006, A&A, 456, 313 [NASA ADS] [CrossRef] [EDP Sciences] [Google Scholar]
- Mashonkina, L., Korn, A. J., & Przybilla, N. 2006, A&A, 461, 261 [Google Scholar]
- Mashonkina, L., Gehren, T., Shi, J., Korn, A., & Grupp, F. 2009, Fe I/Fe II ionization equilibrium in cool stars: NLTE versus LTE, Chemical Abundances in the Universe: Connecting First Stars to Planets, ed. K. Cunha, M. Spite, & B. Barbuy, Proc. IAU Symp., 265, 197 [Google Scholar]
- Mathias, P., Gillet, D., Fokin, A. B., & Chadid, M. 1995, A&A, 298, 843 [NASA ADS] [Google Scholar]
- McWilliam, A. 1998, AJ, 115, 1640 [NASA ADS] [CrossRef] [Google Scholar]
- Peterson, R. C., Carney, B. W., & Latham, D. W. 1996, ApJ, 465, 47 [Google Scholar]
- Piskunov, N. E., Kupka, F., Ryabchikova, T. A., Weiss, W. W., & Jeffery, C. S. 1995, A&AS, 112, 525 [Google Scholar]
- Preston, G. W. 2009, A&A, 507, 1621 [NASA ADS] [CrossRef] [EDP Sciences] [Google Scholar]
- Preston, G. W., Smak, J., & Paczynski, B. 1965, ApJS, 12, 99 [NASA ADS] [CrossRef] [Google Scholar]
- Przybilla, N., Butler, K., Becker, S. R., & Kudritzki, R. P. 2006, A&A, 445, 1099 [NASA ADS] [CrossRef] [EDP Sciences] [Google Scholar]
- Ryabchikova, T. A., Piskunov, N. E., Stempels, H. C., Kupka, F., & Weiss, W. W. 1999, Phis. Scr. T, 83, 162 [Google Scholar]
- Ryabchikova, T. A., Fossati, L., & Shulyak, D. 2009, A&A, 506, 203 [NASA ADS] [CrossRef] [EDP Sciences] [Google Scholar]
- Siegel, M. J. 1982, PASP, 94, 122 [NASA ADS] [CrossRef] [Google Scholar]
- Shulyak, D., Tsymbal, V., Ryabchikova, T., Stütz Ch., & Weiss, W. W. 2004, A&A, 428, 993 [NASA ADS] [CrossRef] [EDP Sciences] [Google Scholar]
- Szeidl, B. 1988, in: Multimode Stellar Pulsations, ed. G. Kovacs, L. Szabados, & B. Szeidl, Kultura, 45 [Google Scholar]
- Takeda, Y., Honda, S., Aoki, W., et al. 2006, PASJ, 58, 389 [NASA ADS] [Google Scholar]
- Tody, D. 1993, in Astronomical Data Analysis Software and Systems II, ed. R. J. Hanisch, R. J. V. Brissenden, & J. Barnes (San Francisco: ASP), ASP Conf. Ser., 52, 173 [Google Scholar]
- Tsymbal, V. V. 1996, in Model Atmospheres and Spectral Synthesis, ed. S. J., Adelman, F., Kupka, & W. W., Weiss, ASP Conf. Ser., 108, 198 [Google Scholar]
- Van Hoof, A., & Struve, O. 1953, PASP, 65, 158 [NASA ADS] [CrossRef] [Google Scholar]
Footnotes
- ... RR Lyrae
- Data obtained with the 2.7-m telescope at McDonald Observatory, Texas, US.
- ...
(IRAF
- IRAF (http://iraf.noao.edu/) is distributed by the National Optical Astronomy Observatory, which is operated by the Association of Universities for Research in Astronomy (AURA) under cooperative agreement with the National Science Foundation.
- ... shocks
- Fokin & Gillet (1997)
note that the theoretical velocities and the shock
amplitudes are very sensitive to model parameters. They used parameters different from ours:
 K,
K,
 ,
,
 ,
X = 0.7, and Y = 0.299. The model generated with the Vienna Nonlinear Pulsation Code shows a maximum, during one pulsation cycle,
of 4.7 Mach outward and -3.1 Mach inward,
which corresponds to gas velocities of 35 and -23 km s-1.
Owing to artificial viscosity, we can assume that the star undergoes
stronger shocks than our models. The artificial tensor viscosity used
broadens the shock region and underestimates any possible heating
phenomena. The position of the outer boundary condition is crucial to
the maximum velocity, because shock waves steepen when they run
outwards towards lower density. Fokin's model continues until
,
X = 0.7, and Y = 0.299. The model generated with the Vienna Nonlinear Pulsation Code shows a maximum, during one pulsation cycle,
of 4.7 Mach outward and -3.1 Mach inward,
which corresponds to gas velocities of 35 and -23 km s-1.
Owing to artificial viscosity, we can assume that the star undergoes
stronger shocks than our models. The artificial tensor viscosity used
broadens the shock region and underestimates any possible heating
phenomena. The position of the outer boundary condition is crucial to
the maximum velocity, because shock waves steepen when they run
outwards towards lower density. Fokin's model continues until
 ,
while the Vienna models we used stop at about 10-10.
,
while the Vienna models we used stop at about 10-10.
- ...
phase
- Fundamental parameters obtained at different Blazhko phases are not necessarily equal to one another, although they are obtained at the same pulsation phase.
- ... fitting
- The code adopts an LTE plane-parallel model atmosphere calculated using subroutines of the SynthV code (Tsymbal 1996) and the DUNLSF minimisation procedure of the IMSL numerical libraries package.
All Tables
Table 1: Basic data of the observations of RR Lyr.
Table 2: LTE atmospheric abundances for RR Lyr.
Table 3: Comparison between the atmospheric ion abundances relative to the Sun obtained by Clementini et al. (1995) and in this work.
All Figures
|
|
Figure 1: RR Lyr model bolometric luminosity ( upper panel), photospheric radius ( middle panel), and atmospheric kinetic energy ( lower panel) as a function of the pulsational phase. By convention, phase 0 corresponds to the maximum of the luminosity. The two full vertical lines correspond to the phases of both maximum radius (the phase we declare as most quiescent) and minimum light (usually adopted for the spectroscopic analysis). |
| Open with DEXTER | |
| In the text | |
|
|
Figure 2: Radial plots showing gas velocity u in units of the sound speed (the so-called Mach number) shown for the phase of maximum radius (left) and minimum light (right). |
| Open with DEXTER | |
| In the text | |
|
|
Figure 3:
Left panel: comparison between a part of the RR Lyr spectrum as
observed close to the phase of maximum radius (full line) and close to the phase of minimum light
(dashed line). Right panel: comparison between the bisectors of the
Ti II line at |
| Open with DEXTER | |
| In the text | |
|
|
Figure 4:
Full width at half maximum (FWHM) in Å as a function of pulsational
phase measured for three Fe II lines and one Ti II line. The
minimum is in correspondance with the phase of maximum radius. The typical
uncertainty in the FWHM is of |
| Open with DEXTER | |
| In the text | |
|
|
Figure 5:
Comparison between the observed H |
| Open with DEXTER | |
| In the text | |
|
|
Figure 6:
Plots of individual abundances for 284 Fe I lines versus the
measured equivalent width for RR Lyr, adopting a constant (open circles) and
depth-dependent (open squares)
|
| Open with DEXTER | |
| In the text | |
|
|
Figure 7: Comparison between the profile of the microturbulent velocity (full line) and of the sound speed (dashed line) as a function of atmospheric depth. |
| Open with DEXTER | |
| In the text | |
|
|
Figure 8:
Comparison of temperature structures of models computed under
different assumptions about microturbulent velocity
|
| Open with DEXTER | |
| In the text | |
Copyright ESO 2010
Current usage metrics show cumulative count of Article Views (full-text article views including HTML views, PDF and ePub downloads, according to the available data) and Abstracts Views on Vision4Press platform.
Data correspond to usage on the plateform after 2015. The current usage metrics is available 48-96 hours after online publication and is updated daily on week days.
Initial download of the metrics may take a while.