| Issue |
A&A
Volume 519, September 2010
|
|
|---|---|---|
| Article Number | A45 | |
| Number of page(s) | 25 | |
| Section | Catalogs and data | |
| DOI | https://doi.org/10.1051/0004-6361/200912724 | |
| Published online | 10 September 2010 | |
TANAMI: tracking active galactic nuclei with austral milliarcsecond interferometry
I. First-epoch 8.4 GHz images
R. Ojha1,2 - M. Kadler3,4,5,6 - M. Böck3,4 - R. Booth7 - M. S. Dutka8 - P. G. Edwards9 - A. L. Fey1 - L. Fuhrmann10 - R. A. Gaume1 - H. Hase11 - S. Horiuchi12 - D. L. Jauncey9 - K. J. Johnston1 - U. Katz4 - M. Lister13 - J. E. J. Lovell14 - C. Müller3,4 - C. Plötz15 - J. F. H. Quick7 - E. Ros16,10 - G. B. Taylor17 - D. J. Thompson18 - S. J. Tingay19 - G. Tosti20,21 - A. K. Tzioumis9 - J. Wilms3,4 - J. A. Zensus10
1 - United States Naval Observatory, 3450 Massachusetts Ave., NW,
Washington DC 20392, USA
2 -
NVI, Inc., 7257D Hanover Parkway, Greenbelt, MD 20770, USA
3 -
Dr. Remeis Sternwarte, Astron. Institut der Universität Erlangen-Nürnberg,
Sternwartstrasse 7, 96049 Bamberg, Germany
4 -
Erlangen Centre for Astroparticle Physics, Erwin-Rommel Str. 1, 91058 Erlangen,
Germany
5 -
CRESST/NASA Goddard Space Flight Center, Greenbelt, MD 20771, USA
6 -
Universities Space Research Association, 10211 Wincopin Circle, Suite 500 Columbia, MD
21044, USA
7 -
Hartebeesthoek Radio Astronomy Observatory, PO Box 443, Krugersdorp 1740, South Africa
8 -
The Catholic University of America, 620 Michigan Ave., N.E., Washington, DC 20064, USA
9 -
Australia Telescope National Facility, CSIRO, PO Box 76, Epping, NSW 1710, Australia
10 -
Max-Planck-Institut für Radioastronomie, Auf dem Hügel 69, 53121 Bonn, Germany
11
- Bundesamt fur Kartographie und Geodesie, Germany entrusted with
Transportable Integrated Geodetic Observatory, Universidad de
Concepcion, Casilla 4036, Correo 3, Concepcion, Chile
12 -
Canberra Deep Space Communication Complex, PO Box 1035, Tuggeranong, ACT 2901, Australia
13 -
Department of Physics, Purdue University, 525 Northwestern Avenue, West Lafayette, IN 47907, USA
14 -
School of Mathematics & Physics, Private Bag 37, University of Tasmania, Hobart TAS 7001, Australia
15
- Federal Agency for Cartography and Geodesy (BKG), Geodetic
Observatory Wettzell, Sackenrieder Str. 25, 93444 Bad Kötzting, Germany
16 -
Dept. d'Astronomia i Astrofísica, Universitat de València, 46100 Burjassot, València, Spain
17 -
Department of Physics and Astronomy, University of New Mexico, Albuquerque NM, 87131, USA![]()
18 -
Astrophysics Science Division, NASA Goddard Space Flight Center, Greenbelt, MD 20771, USA
19 -
Curtin Institute of Radio Astronomy, Curtin University of Technology, Bentley, WA, 6102, Australia
20 -
Istituto Nazionale di Fisica Nucleare, Sezione di Perugia, 06123 Perugia, Italy
21 -
Dipartimento di Fisica, Università degli Studi di Perugia, 06123 Perugia, Italy
Received 19 June 2009 / Accepted 12 May 2010
Abstract
Context. A number of theoretical models vie to explain the ![]() -ray
emission from active galactic nuclei (AGN). This was a key discovery of
EGRET. With its broader energy coverage, higher resolution, wider field
of view and greater sensitivity, the Large Area Telescope (LAT) of the Fermi Gamma-ray Space Telescope is dramatically increasing our knowledge of AGN
-ray
emission from active galactic nuclei (AGN). This was a key discovery of
EGRET. With its broader energy coverage, higher resolution, wider field
of view and greater sensitivity, the Large Area Telescope (LAT) of the Fermi Gamma-ray Space Telescope is dramatically increasing our knowledge of AGN ![]() -ray
emission. However, discriminating between competing theoretical models
requires quasi-simultaneous observations across the electromagnetic
spectrum. By resolving the powerful parsec-scale relativistic outflows
in extragalactic jets and thereby allowing us to measure critical
physical properties, Very Long Baseline Interferometry observations are
crucial to understanding the physics of extragalactic
-ray
emission. However, discriminating between competing theoretical models
requires quasi-simultaneous observations across the electromagnetic
spectrum. By resolving the powerful parsec-scale relativistic outflows
in extragalactic jets and thereby allowing us to measure critical
physical properties, Very Long Baseline Interferometry observations are
crucial to understanding the physics of extragalactic ![]() -ray objects.
-ray objects.
Aims. We introduce the TANAMI program (Tracking Active Galactic
Nuclei with Austral Milliarcsecond Interferometry) which is monitoring
an initial sample of 43 extragalactic jets located south of -30 degrees
declination at 8.4 GHz and 22 GHz since 2007. All aspects of
the program are discussed. First epoch results at 8.4 GHz are
presented along with physical parameters derived therefrom.
Methods. These observations were made during 2007/2008 using the
telescopes of the Australian Long Baseline Array in conjunction with
Hartebeesthoek in South Africa. These data were correlated at the
Swinburne University correlator.
Results. We present first epoch images for 43 sources, some
observed for the first time at milliarcsecond resolution. Parameters of
these images as well as physical parameters derived from them are also
presented and discussed. These and subsequent images from the TANAMI
survey are available at http://pulsar.sternwarte.uni-erlangen.de/tanami/.
Conclusions. We obtain reliable, high dynamic range images of
the southern hemisphere AGN. All the quasars and BL Lac objects in
the sample have a single-sided radio morphology. Galaxies are either
double-sided, single-sided or irregular. About ![]() of the TANAMI sample has been detected by LAT during its first three
months of operations. Initial analysis suggests that when galaxies are
excluded, sources detected by LAT have larger opening angles than those
not detected by LAT. Brightness temperatures of LAT detections and
non-detections seem to have similar distributions. The redshift
distributions of the TANAMI sample and sub-samples are similar to those
seen for the bright
of the TANAMI sample has been detected by LAT during its first three
months of operations. Initial analysis suggests that when galaxies are
excluded, sources detected by LAT have larger opening angles than those
not detected by LAT. Brightness temperatures of LAT detections and
non-detections seem to have similar distributions. The redshift
distributions of the TANAMI sample and sub-samples are similar to those
seen for the bright ![]() -ray AGN seen by LAT and EGRET but none of the sources with a redshift above 1.8 have been detected by LAT.
-ray AGN seen by LAT and EGRET but none of the sources with a redshift above 1.8 have been detected by LAT.
Key words: galaxies: active - galaxies: jets - galaxies: nuclei - gamma rays: observations - quasars: general
1 Introduction
Blazars are a radio-loud, violently variable, high-luminosity, high-polarization subset of Active Galactic Nuclei (AGN) that show luminosity variations across the electromagnetic spectrum. They typically exhibit apparent superluminal motion along the innermost parsecs of their radio jets. Their observed behaviour suggests they are very compact objects with parsec-scale jets oriented close to our line of sight. Despite decades of observations and modeling of the powerful relativistic jets of AGN, many fundamental questions about them remain unanswered. Jet composition, formation, and collimation are not well understood. Neither are the mechanisms responsible for their propagation, radiation, and interaction with their ambient medium.
The discovery by the EGRET detector onboard the Compton Gamma Ray
Observatory (CGRO) that blazars can be bright ![]() -ray emitters
(Hartman et al. 1992) was a major breakthrough in the study of AGN. Study
of the
-ray emitters
(Hartman et al. 1992) was a major breakthrough in the study of AGN. Study
of the ![]() -ray blazar population suggested that there is a close
connection between
-ray blazar population suggested that there is a close
connection between ![]() -ray and radio emission, spectral changes,
outbursts and the ejection of parsec-scale jet components
(Dondi & Ghisellini 1995). Many, but not all, of the radio brightest blazars have
been detected at
-ray and radio emission, spectral changes,
outbursts and the ejection of parsec-scale jet components
(Dondi & Ghisellini 1995). Many, but not all, of the radio brightest blazars have
been detected at ![]() -ray energies. On the other hand, a small number
of extragalactic jets which do not belong to the blazar class have been
shown to be bright
-ray energies. On the other hand, a small number
of extragalactic jets which do not belong to the blazar class have been
shown to be bright ![]() -ray sources, as well (e.g., NGC 1275
and Cen A; Abdo et al. 2009b). Currently there are a number of models
attempting to explain the observed
-ray sources, as well (e.g., NGC 1275
and Cen A; Abdo et al. 2009b). Currently there are a number of models
attempting to explain the observed ![]() -ray emission of blazars and
other extragalactic jets (see Böttcher 2007, for a review).
Simultaneous broadband spectral energy distribution (SED) measurements
across the electromagnetic spectrum are required to discriminate between
such models.
-ray emission of blazars and
other extragalactic jets (see Böttcher 2007, for a review).
Simultaneous broadband spectral energy distribution (SED) measurements
across the electromagnetic spectrum are required to discriminate between
such models.
Very Long Baseline Interferometry (VLBI) monitoring of blazars is a crucial component of this multiwavelength suite of observations as it provides the only direct measure of relativistic motion in AGN jets allowing us to calculate intrinsic jet parameters such as jet speed, Doppler factor, opening and inclination angles. They also provide the possibility of identifying the location and extent of emission regions. Thus VLBI observations constrain numerical jet simulations and provide tests of the relativistic-beam model (e.g., Cohen et al. 2007) that are not possible with any other observational technique.
The successful launch of the Fermi Gamma-ray Space Telescope,
formerly known as GLAST (Gamma-ray Large Area Space
Telescope; Gehrels & Michelson 1999), on June 11th, 2008 was a major milestone in
the quest to understand the connection between the low- and high-energy
sections of blazar SEDs. The Large Area Telescope
(LAT; Atwood et al. 2009) instrument on Fermi has broader
energy coverage (20 MeV-300 GeV), higher resolution, wider field of
view (over ![]() of the sky) and a sensitivity
of the sky) and a sensitivity ![]() 30 times greater
than EGRET. The combination of its wide field of view with a scanning
pattern of observation means LAT observes the entire sky every
30 times greater
than EGRET. The combination of its wide field of view with a scanning
pattern of observation means LAT observes the entire sky every ![]() 3 h making LAT capable of monitoring the sky on timescales from hours
to years. Its higher sensitivity at higher energies allows LAT to measure
high energy cutoffs which elucidate acceleration mechanisms, radiation
and magnetic fields at the source.
3 h making LAT capable of monitoring the sky on timescales from hours
to years. Its higher sensitivity at higher energies allows LAT to measure
high energy cutoffs which elucidate acceleration mechanisms, radiation
and magnetic fields at the source.
The Tracking Active Galactic Nuclei with Austral Milliarcsecond Interferometry (TANAMI) program is a parsec-scale radio monitoring program targeting extragalactic jets south of -30 degrees declination. It uses the telescopes of the Australian Long Baseline Array (LBA, e.g., Ojha et al. 2004b), and other telescopes in South Africa, Antarctica and Chile to monitor an initial sample of 43 sources at approximately 2-month intervals. The observations are typically made at two frequencies, 8.4 GHz and 22 GHz, in order to calculate the spectral indices for the core as well as bright jet components. TANAMI began observations in November 2007 before the launch of Fermi so a proper observation cadence for the targets could be determined. To maximize the usage of TANAMI data, images of sources are made available at http://pulsar.sternwarte.uni-erlangen.de/tanami/ as soon as they are available. The current target list of TANAMI is maintained at http://pulsar.sternwarte.uni-erlangen.de/tanami/sample/.
While the immediate driver for TANAMI was the imminent launch of the
Fermi Gamma-ray Space Telescope, these dual-frequency
observations of morphology, motion, and other temporal variations of the
most poorly studied third of the AGN sky have a number of other
applications. One particularly exciting prospect is the possibility of
combining ![]() -ray and radio monitoring of parsec-scale jet
kinematics (and production) with a sensitive neutrino telescope. The
ANTARES neutrino telescope (see http://antares.in2p3.fr), which is
now fully operational and the KM3NeT detector (which has a projected
completion date of 2011, see http://www.km3net.org) are being
designed to detect neutrino point sources
-ray and radio monitoring of parsec-scale jet
kinematics (and production) with a sensitive neutrino telescope. The
ANTARES neutrino telescope (see http://antares.in2p3.fr), which is
now fully operational and the KM3NeT detector (which has a projected
completion date of 2011, see http://www.km3net.org) are being
designed to detect neutrino point sources![]() . Extragalactic jets are
among the most promising candidates to be neutrino point sources
(Waxman 2007). Combined TANAMI, Fermi and ANTARES data will
be used to search for neutrino signals correlated with
. Extragalactic jets are
among the most promising candidates to be neutrino point sources
(Waxman 2007). Combined TANAMI, Fermi and ANTARES data will
be used to search for neutrino signals correlated with ![]() -ray
flares and epochs of jet production.
The results of this work will be the subject of future publications.
-ray
flares and epochs of jet production.
The results of this work will be the subject of future publications.
In this paper, we describe how we selected our initial source sample
(Sect. 2) and explain our observation and data reduction
procedures (Sect. 3). We then present the first
epoch images of 43 target sources at 8.4 GHz in Sect. 4
followed by brief notes on individual sources
(Sect. 5). This is followed by a discussion of our
results (Sect. 6) and we end with our conclusions
(Sect. 7). Throughout the paper we use the
cosmology H0=73 km s-1 Mpc-1,
![]() ,
,
![]() where the symbols have their traditional
meanings.
where the symbols have their traditional
meanings.
2 Definition of the sample
The TANAMI sample
has been defined as a hybrid radio and ![]() -ray selected sample of
AGN south of
-ray selected sample of
AGN south of
![]() .
Its main components are I) a radio
selected flux-density limited subsample and II) a
.
Its main components are I) a radio
selected flux-density limited subsample and II) a ![]() -ray
selected subsample of known and candidate
-ray
selected subsample of known and candidate ![]() -ray sources based on
results of CGRO/EGRET. The radio subsample includes all sources
(within our declination range) from the catalogue of Stickel et al. (1994)
above a limiting radio flux density of
-ray sources based on
results of CGRO/EGRET. The radio subsample includes all sources
(within our declination range) from the catalogue of Stickel et al. (1994)
above a limiting radio flux density of
![]() Jy, which have
a flat radio spectrum (
Jy, which have
a flat radio spectrum (
![]() ,
,
![]() )
between
2.7 GHz and 5 GHz. The 21 sources selected according to this radio
flux-density criterion represent a Southern-hemisphere extension of the
MOJAVE 1 sample (Lister et al. 2009a), which is complete in the declination
range
)
between
2.7 GHz and 5 GHz. The 21 sources selected according to this radio
flux-density criterion represent a Southern-hemisphere extension of the
MOJAVE 1 sample (Lister et al. 2009a), which is complete in the declination
range
![]() down to the same flux-density limit at
15 GHz. The
down to the same flux-density limit at
15 GHz. The ![]() -ray selected subsample includes all known
-ray selected subsample includes all known
![]() -ray blazars detected by EGRET south of
-ray blazars detected by EGRET south of
![]() ,
both
the high-confidence and low-confidence associations made by
Hartman et al. (1999), Tornikoski et al. (2002), Sowards-Emmerd et al. (2004)
and Bignall et al. (2008). In addition, we have also included 4 known
intra-day variable (IDV) sources (0405-385, 1144-379, 1257-326, and
1323-526) and 8 other sources, which either share the radio properties
of EGRET-detected blazars at lower radio flux density or which represent
prototypical examples of other AGN classes such as the bright and nearby
radio galaxy Pictor A (0518-458) or the gigahertz peaked spectrum
(GPS) source NGC 6328 (1718-649). In total, this sample contains 44
objects
,
both
the high-confidence and low-confidence associations made by
Hartman et al. (1999), Tornikoski et al. (2002), Sowards-Emmerd et al. (2004)
and Bignall et al. (2008). In addition, we have also included 4 known
intra-day variable (IDV) sources (0405-385, 1144-379, 1257-326, and
1323-526) and 8 other sources, which either share the radio properties
of EGRET-detected blazars at lower radio flux density or which represent
prototypical examples of other AGN classes such as the bright and nearby
radio galaxy Pictor A (0518-458) or the gigahertz peaked spectrum
(GPS) source NGC 6328 (1718-649). In total, this sample contains 44
objects![]() . Many of the sources in this
sample have been well studied with VLBI in the past (Horiuchi et al. 2004; Shen et al. 1997; Tingay et al. 2002; Scott et al. 2004; Ojha et al. 2004a; Shen et al. 1998b; Ojha et al. 2005; Tingay et al. 1996a; Dodson et al. 2008) but for about
. Many of the sources in this
sample have been well studied with VLBI in the past (Horiuchi et al. 2004; Shen et al. 1997; Tingay et al. 2002; Scott et al. 2004; Ojha et al. 2004a; Shen et al. 1998b; Ojha et al. 2005; Tingay et al. 1996a; Dodson et al. 2008) but for about ![]() only very limited
information at typically much lower resolutions and image fidelity are
available in the literature.
only very limited
information at typically much lower resolutions and image fidelity are
available in the literature.
Table 1: The long baseline array and affiliated telescopes.
Most AGN with bright compact radio emission are strongly variable. This
led the MOJAVE team to define their statistically complete radio-selected
sample based on radio light curve observations of a large sample of
sources over a ten-year time baseline and to include all sources that
exceeded their flux-density limit at any epoch during this period. In
contrast to this, the TANAMI sample is not statistically complete.
However, based on experience from the transition of the original VLBA
2 cm Survey sample into the MOJAVE sample (Lister et al. 2009a), we can
consider the radio-selected subsample of TANAMI as being representative
of a complete sample. In a similar sense, the Fermi LBAS (LAT
bright AGN sample) list is not statistically complete
(Abdo et al. 2009b) and neither is the subsample of LBAS-TANAMI sources.
A few bright ![]() -ray sources have no or only low-confidence
associations
-ray sources have no or only low-confidence
associations![]() and in addition, the presence of known EGRET
sources, which are not in the LBAS
and in addition, the presence of known EGRET
sources, which are not in the LBAS![]() , indicates the effect of long-term variability being also
important in the
, indicates the effect of long-term variability being also
important in the ![]() -ray regime. We are working on improving the
completeness of the
-ray regime. We are working on improving the
completeness of the ![]() -ray selected TANAMI subsample in
collaboration with the Fermi/LAT science team. In addition to
the 44 sources of the initial TANAMI sample, we have begun observations
of 19 additional Fermi sources in November 2008, which will be
reported elsewhere. Most of these sources have not been observed with
VLBI before. We plan to continue adding new Fermi-detected
sources to the TANAMI list through 2009.
-ray selected TANAMI subsample in
collaboration with the Fermi/LAT science team. In addition to
the 44 sources of the initial TANAMI sample, we have begun observations
of 19 additional Fermi sources in November 2008, which will be
reported elsewhere. Most of these sources have not been observed with
VLBI before. We plan to continue adding new Fermi-detected
sources to the TANAMI list through 2009.
The Veron-Veron 12th edition catalog (Veron-Cetty & Veron 2006) was used to obtain optical classifications. The sample contains 24 quasars (optically unresolved broad-emission line objects), 6 BL Lac objects (optically unresolved sources with weak or absent emission lines), and 10 radio galaxies (optical galaxies, which are identified with radio sources). Three sources are unclassified.
After the beginning of Fermi science operations and the
publication of the first list of bright ![]() -ray emitting AGN
detected by Fermi/LAT between August and October 2008
(Abdo et al. 2009b), our sample-selection criteria have proved to be
highly efficient in picking up bright
-ray emitting AGN
detected by Fermi/LAT between August and October 2008
(Abdo et al. 2009b), our sample-selection criteria have proved to be
highly efficient in picking up bright ![]() -ray emitters. Our original
sample contains 10 of the 18 high-confidence associations of the LBAS
sample within our declination range, one out of two lower confidence
association and one additional bright
-ray emitters. Our original
sample contains 10 of the 18 high-confidence associations of the LBAS
sample within our declination range, one out of two lower confidence
association and one additional bright ![]() -ray source association
(1759-396) outside the galactic latitude range considered by
Abdo et al. (2009a). Four of these 12 sources have entered the TANAMI
sample because they belong to both the radio flux-density limited sample
and to the EGRET sample, two and four belong only to the radio or EGRET
sample, respectively, and two belong to the IDV class. Details are given
in Table 3. Notably, one out of only two LBAS radio
galaxies belongs to the TANAMI sample (Cen A), as well as two out of
seven high-frequency peaked BL Lac objects, which are also detected in
the TeV energy range (2005-489 and 2155-304).
-ray source association
(1759-396) outside the galactic latitude range considered by
Abdo et al. (2009a). Four of these 12 sources have entered the TANAMI
sample because they belong to both the radio flux-density limited sample
and to the EGRET sample, two and four belong only to the radio or EGRET
sample, respectively, and two belong to the IDV class. Details are given
in Table 3. Notably, one out of only two LBAS radio
galaxies belongs to the TANAMI sample (Cen A), as well as two out of
seven high-frequency peaked BL Lac objects, which are also detected in
the TeV energy range (2005-489 and 2155-304).
3 Observations and data reduction
Table 2: Summary of observations.
TANAMI observations are made using the five telescopes of the Australian
Long Baseline Array (LBA![]() ) along with other
affiliated telescopes. Within Australia, TANAMI has periodic access to
the 70 m and the 34 m telescopes at NASA's Deep Space Network (DSN)
located at Tidbinbilla, near Canberra in the Australian Capital Territory
(ACT). When available, these telescopes add crucial sensitivity to map
details of the jet structure with higher fidelity, besides improving the
(u,v)-coverage. Through September 2008, the highest resolution,
intercontinental baselines were provided by the 26 m telescope in
Hartbeesthoek, South Africa. However, this telescope experienced a major
failure of a polar shaft bearing in October 2008 and is likely to remain
unavailable for some time (Jonathan Quick, personal communication).
Fortunately, through a successful International VLBI Service (IVS)
proposal we have obtained access to two telescopes, O'Higgins, Antarctica
and TIGO (Transportable Integrated Geodetic Observatory), Chile. Both
these telescopes are operated by the Bundesamt für Kartographie und
Geodäsie (BKG), the federal agency responsible for cartography and
geodesy in Germany. These two telescopes greatly improve our
(u,v)-coverage and partially offset the loss of Hartebeesthoek. Details
of all of these telescopes used in TANAMI observations are summarized in
Table 1. The telescopes participating in the
observations reported in this paper are indicated in
Table 2.
) along with other
affiliated telescopes. Within Australia, TANAMI has periodic access to
the 70 m and the 34 m telescopes at NASA's Deep Space Network (DSN)
located at Tidbinbilla, near Canberra in the Australian Capital Territory
(ACT). When available, these telescopes add crucial sensitivity to map
details of the jet structure with higher fidelity, besides improving the
(u,v)-coverage. Through September 2008, the highest resolution,
intercontinental baselines were provided by the 26 m telescope in
Hartbeesthoek, South Africa. However, this telescope experienced a major
failure of a polar shaft bearing in October 2008 and is likely to remain
unavailable for some time (Jonathan Quick, personal communication).
Fortunately, through a successful International VLBI Service (IVS)
proposal we have obtained access to two telescopes, O'Higgins, Antarctica
and TIGO (Transportable Integrated Geodetic Observatory), Chile. Both
these telescopes are operated by the Bundesamt für Kartographie und
Geodäsie (BKG), the federal agency responsible for cartography and
geodesy in Germany. These two telescopes greatly improve our
(u,v)-coverage and partially offset the loss of Hartebeesthoek. Details
of all of these telescopes used in TANAMI observations are summarized in
Table 1. The telescopes participating in the
observations reported in this paper are indicated in
Table 2.
TANAMI observations are made at two frequencies: 8.4 GHz (X-band) and at 22 GHz (K-band). Imaging observations at 8.4 GHz generally yield the best image fidelity and thus the most detailed structural information with this array as demonstrated, for example, by the US Naval Observatory/ATNF, International Celestial Reference Frame (ICRF) imaging program (Ojha et al. 2004a,2005). This frequency is high enough to provide good resolution and low enough to avoid missing extended structure that typically has a steep spectrum. Atmospheric effects are also negligible at this frequency. Imaging observations at 22 GHz are challenging but feasible (Tingay et al. 2003b). Not only do 22 GHz images show morphology closer to the cores of the AGN, in combination with the 8 GHz images, they yield spectral information on the core and bright jet components. These are a critical component of the broadband SEDs needed to understand the energetics of AGN. One 24-h epoch at each frequency is observed approximately every two months. In this paper, we describe the 8.4 GHz observations. Table 2 summarizes the observations which are reported here.
![\begin{figure}
\par\includegraphics[width=11.7cm,clip]{12724fg1.ps}
\end{figure}](/articles/aa/full_html/2010/11/aa12724-09/img14.png)
|
Figure 1: Contour maps of the 43 TANAMI sources at 8.4 GHz. The scale of each image is in milliarcseconds. The FWHM Gaussian restoring beam applied to the images is shown as a hatched ellipse in the lower left of each panel. Each panel also shows a bar representing a linear scale between 0.1 pc and 100 pc except for the sources without a measured redshift. |
| Open with DEXTER | |
![\begin{figure}
\par\includegraphics[width=12.5cm,clip]{12724f2.eps}
\end{figure}](/articles/aa/full_html/2010/11/aa12724-09/img15.png)
|
Figure 2: Same as Fig. 1. |
| Open with DEXTER | |
![\begin{figure}
\par\includegraphics[width=12.5cm,clip]{12724f3.eps}
\end{figure}](/articles/aa/full_html/2010/11/aa12724-09/img16.png)
|
Figure 3: Same as Fig. 1. |
| Open with DEXTER | |
![\begin{figure}
\par\includegraphics[width=12.3cm,clip]{12724fg4.eps}
\end{figure}](/articles/aa/full_html/2010/11/aa12724-09/img17.png)
|
Figure 4: Same as Fig. 1. |
| Open with DEXTER | |
![\begin{figure}
\par\includegraphics[width=12.4cm,clip]{12724fg5.eps}
\end{figure}](/articles/aa/full_html/2010/11/aa12724-09/img18.png)
|
Figure 5: Same as Fig. 1. |
| Open with DEXTER | |
![\begin{figure}
\par\includegraphics[width=12.2cm,clip]{12724fg6.eps}
\end{figure}](/articles/aa/full_html/2010/11/aa12724-09/img19.png)
|
Figure 6: Same as Fig. 1. |
| Open with DEXTER | |
![\begin{figure}
\par\includegraphics[width=11.8cm,clip]{12724fg7.eps}
\end{figure}](/articles/aa/full_html/2010/11/aa12724-09/img20.png)
|
Figure 7: Same as Fig. 1. |
| Open with DEXTER | |
For the array described above, the
![]() angular resolution
(synthesized beam) achieved by TANAMI is 1.5-4 by 0.5-1.0 mas in size,
with the highest resolution in the east-west direction. Each source was
observed in about 6 scans of approximately 10 min each. The data were
recorded on the LBADRs (Long Baseline Array Disk Recorders) and
correlated on the DiFX software correlator (Deller et al. 2007) at
Swinburne University in Melbourne, Victoria. From November 2008 on, the
data is being correlated at Curtin University in Perth, Western
Australia.
angular resolution
(synthesized beam) achieved by TANAMI is 1.5-4 by 0.5-1.0 mas in size,
with the highest resolution in the east-west direction. Each source was
observed in about 6 scans of approximately 10 min each. The data were
recorded on the LBADRs (Long Baseline Array Disk Recorders) and
correlated on the DiFX software correlator (Deller et al. 2007) at
Swinburne University in Melbourne, Victoria. From November 2008 on, the
data is being correlated at Curtin University in Perth, Western
Australia.
The correlated data were loaded into AIPS using the locally written task
ATLOD which is needed to read the data in the format that the LBA
generates. Thereafter, data inspection, initial editing and fringe
fitting was done in the standard manner using the National Radio
Astronomy Observatory's Astronomical Image Processing System (AIPS)
software (Greisen 1998). Observations of known sources with ![]()
![]() of their correlated flux in a compact core were used to improve
overall amplitude calibration. For each antenna, a single amplitude gain
correction factor was derived based on fitting a simple Gaussian source
model to the visibility data of the respective compact source after
applying only the initial calibration based on the measured system
temperatures and gain curves. Based on the differences between the
observed and model visibilities, gain correction factors were calculated
and the resulting set of amplitude gain correction factors was then
applied to the visibility data of the target sources. The accuracy of the
absolute amplitude calibration is conservatively estimated to be
of their correlated flux in a compact core were used to improve
overall amplitude calibration. For each antenna, a single amplitude gain
correction factor was derived based on fitting a simple Gaussian source
model to the visibility data of the respective compact source after
applying only the initial calibration based on the measured system
temperatures and gain curves. Based on the differences between the
observed and model visibilities, gain correction factors were calculated
and the resulting set of amplitude gain correction factors was then
applied to the visibility data of the target sources. The accuracy of the
absolute amplitude calibration is conservatively estimated to be ![]() .
.
The imaging was performed applying standard methods using the program DIFMAP (Shepherd 1997). Specifically, the data were averaged into 30 s bins and then imaged using the CLEAN algorithm, giving the same weight to all visibility data points (natural weighting) and making use of phase self-calibration. The best model that could be obtained in this initial cycle of the hybrid mapping process was used to self calibrate the visibility amplitudes by applying time-independent gain factors for each antenna in the array. The model was then cleared and the resulting improved data were imaged in additional hybrid-mapping cycles following the same strategy but using time-dependent gain factor functions with subsequently smaller time intervals (180, 60, 20, 5, 2, 1 min). Before beginning a new cycle, the data were examined and edited if necessary. The images shown in Figs. 1 through 8 result from the final hybrid-mapping cycle using natural weighting and a 30 s solution interval. Some sources exhibit diffuse large-scale emission which could only be recovered by down-weighting the data on the longest baselines ((u,v)-tapering). In Figs. 9-11 we show tapered images for 13 sources.
4 Results
Physical characteristics of the TANAMI sources, where available, are
summarized in Table 3. The table lists their IAU
source designation followed by their alternate name (where appropriate)
and their Right Ascension and Declination in J2000.0 coordinates. Their
optical identification, V-magnitude and redshift are listed in
successive columns. The last four columns indicate which sources belong
to the radio and ![]() -ray selected subsamples and whether they were
detected by EGRET and LAT, respectively, where the LAT-detection flag
refers to the bright-source list of Abdo et al. (2009b) based on the
first three months of Fermi observations.
-ray selected subsamples and whether they were
detected by EGRET and LAT, respectively, where the LAT-detection flag
refers to the bright-source list of Abdo et al. (2009b) based on the
first three months of Fermi observations.
Figures 1 through 8 show contour
plots of the 43 sources of the initial TANAMI sample. These images are
made with natural weighting. A subset of the sources that have diffuse
large-scale emission are shown in Figs. 9-11 using
(u,v)-tapering. The scale of each image is in milliarcseconds. The FWHM
Gaussian restoring beam applied to the images is shown as a hatched
ellipse in the lower left of each panel. Each panel also shows a bar
representing a linear scale of 1 pc, 10 pc, or 100 pc depending on the
source extent and distance, except for the sources without a measured
redshift. The average root-mean-square (RMS) noise in the images is
![]() 0.43 mJy beam-1 with a median RMS of
0.43 mJy beam-1 with a median RMS of ![]() 0.33 mJy
beam-1.
0.33 mJy
beam-1.
Image parameters are listed in Table 4.
The first two columns list the IAU source name and the epoch of the image
shown. The lowest contour level is at 3 times the root-mean-square noise
and is listed in Col. (3). The peak flux density in each image and the
total flux are given in Col. (4) and Col. (5). The major axis, minor
axis, and position angle of the restoring beam are in Cols. (6)-(8).
Columns (9) and (10) show the structural classification and the
core brightness temperature respectively. Both of these were evaluated
using criteria described in Sect. 6. The final two
columns describe the core luminosity and total luminosity of each source.
Table 5 summarizes the image parameters
for the 13 sources for which we present tapered images. The first eight
columns are identical to those of Table 4. The
last column indicates the baseline length in ![]() at which the
visibility data were down weighted to
at which the
visibility data were down weighted to ![]() .
.
Adequate (u,v)-coverage is a key consideration for any VLBI survey. It is a particular concern when observing with the LBA since the LBA is an ad hoc array and the locations of its constituent telescopes are not ideal for producing uniform (u,v)-coverage. Representative plots of the (u,v)-coverage for four sources with declinations spanning the range of the TANAMI sample are shown in Fig. 12. The shorter baselines at the center of each plot are those between telescopes within Australia. The long baselines at the periphery of each figure are those to the Hartebeesthoek telescope in South Africa. The absence of intermediate-length baselines between the shorter intra-Australian and the trans-oceanic baselines remains the most important limiting factor on image quality. However, as past imaging programs have found (e.g., Ojha et al. 2005), this constraint does not preclude good images provided special care is taken in both the calibration and imaging process. Each epoch of observation included two sources which are mutually visible to the LBA and VLBA. Our LBA images of these two sources were checked for consistency with near-contemporaneous VLBA images and revealed no problems.
5 Notes on individual sources
In this section we describe the morphology of each source after a brief summary of its background and past observations where present.
0047-579
This source is a bright high-redshift (z=1.8) quasar from the radio-selected subsample, which has not yet been seen by Fermi in its initial bright-source list (Abdo et al. 2009b). The 8.4 GHz VLBI image by Ojha et al. (2005) shows a compact core with a second component located0208-512
This bright and highly polarized quasar (Impey & Tapia 1988,1990) was a known EGRET source (Hartman et al. 1999) with its0332-403
This BL Lac object has not been detected by EGRET but was detected with Fermi between August and October 2008 (Abdo et al. 2009b). The source is very compact (Ojha et al. 2004a) with previous reports of weak and short extensions to the east (Shen et al. 1998b), and to the west (Fomalont et al. 2000), respectively. Our TANAMI image of this source has considerably lower resolution than most of our other images because no trans-oceanic baselines were available and does not resolve the source.0405-385
This source is one of three unusually strong intra-day variable (IDV) sources (Kedziora-Chudczer 2006)0438-436
The VLBI image of this high-redshift quasar by Preston et al. (1989) shows two components, the core and an additional component 35 mas to the southeast. A map with better resolution by Shen et al. (1998b) resolves the component to the southeast of the core and reveals an additional component in between, separated from the core by about 7 mas. Tingay et al. (2002) present a component which is located about 1 mas to the eastsoutheast of the core. Our image has less resolution because only Australian antennas participated in this observation, but it does pick up more extended emission than previous images, revealing an extremely large continuous jet out to more than 50 mas to the south-east.0454-463
This flat spectrum radio source (Kuehr et al. 1981) is a highly polarized quasar. Impey & Tapia (1990) measured a polarization of 7.1% and Wills et al. (1992) even 27.1%. The source was detected with EGRET (Thompson et al. 1993a) but somewhat surprisingly (given that it is a very strong radio source with flux over 3.6 Jy at 8.4 GHz) it has not been detected by the LAT as a bright0506-612
This source has been classified as a low-confidence potential identification of the EGRET source 3EG J0512-6150 by Hartman et al. (1999) and as a plausible identification by Mattox et al. (2001). Ojha et al. (2004a) find an unresolved source. Our image (Fig. 2) reveals a compact jet component at![\begin{figure}
\par\includegraphics[width=8.5cm,clip]{12724fg8.eps}
\end{figure}](/articles/aa/full_html/2010/11/aa12724-09/img28.png)
|
Figure 8: Same as Fig. 1. |
| Open with DEXTER | |
0518-458
Pictor A is one of the closest, powerful FR II type radio galaxies (Fanaroff & Riley 1974). Its strong double-lobed radio structure is oriented along the east-west direction (Christiansen et al. 1977). X-ray emission from the nucleus, the jet to the west of the nucleus, the western radio hot spot, and the eastern radio lobe was detected with Chandra (Wilson et al. 2001). Tingay et al. (2000) found subluminal motions in the western jet. No parsec-scale counterjet has been detected so far. Our image shows emission from the western jet out to about 35 mas from the core, with at least three compact jet components in the inner 15 mas, which may be associated with the components C 2, C 3, and C 4 seen by Tingay et al. (2000), in which case we would derive speeds of0521-365
This source shows one of the best examples of an optical synchrotron jet (Danziger et al. 1979; Boisson et al. 1989; Scarpa et al. 1999). It possesses strong extended radio and X-ray emission in addition to a bright compact radio source and there are broad and variable nuclear optical emission lines (Scarpa et al. 1995; Ulrich 1981). The VLBI map of this source at 5 GHz by Shen et al. (1998b) shows a core jet northwestward consisting of a core and two additional components separated from the core by0537-441
This source has a GPS spectrum peaking at 5 GHz (Tornikoski et al. 2001) and has been a strong variable EGRET gamma-ray source (Hartman et al. 1999; Thompson et al. 1993b). It is known to be a strong source at all wavelengths (Pian et al. 2002). It has been detected by the LAT in a flaring state weeks after the beginning of Fermi science operations (Tosti 2008), and it is one of the two brightest blazars in the southern0625-354
This source exhibits a FR I radio-galaxy morphology but its optical spectrum is more similar to a BL Lac object (Wills et al. 2004). The optical counterpart is a giant elliptical in the center of the cluster Abell 3392 and exhibits a strong point source nucleus (Govoni et al. 2000). The VLBA map of this source by Fomalont et al. (2000) shows a faint component to the southeast of the core, which is consistent with the direction of the larger-scale jet. A 2.3 GHz image obtained by Venturi et al. (2000) shows a diffuse outer jet component at0637-752
Yaqoob et al. (1998) find a peculiar emission line in the X-ray spectrum of this radio-loud quasar with an energy of1104-445
The first southern VLBI Experiment observations (Preston et al. 1989) show a component located about 17 mas to the eastnortheast (position angle1144-379
This source has been classified as a BL Lac object, due to optical, infrared and rapid radio variability, and its featureless powerlaw spectrum (Nicolson et al. 1979) but Veron-Cetty & Veron (2006) list it as a quasar. The VLBI map by Shen et al. (1997) showed an unresolved core. Several RRFID epochs also show an unresolved core at 8.4 GHz but a few show an extension to the southwest. The TANAMI image shows a clear jet in the same direction to about 16 mas along with significant emission at about 30 mas from the core better revealed in the tapered image (Fig. 10). This bright, rapidly variable source was not detected by EGRET but has already been detected by the LAT (Abdo et al. 2009b).1257-326
This source is a flat-spectrum, radio-loud quasar, which shows extreme intra-day variability due to interstellar scintillation (Bignall et al. 2003,2006). No VLBI image of this source has been published so far. The TANAMI image shows a well-collimated but possibly transversally resolved jet out to about 30 mas north-west of the core. Because of its relatively low signal-to-noise ratio, the core appears unresolved but the limit on its brightness temperature is relatively low, only 1011 K.1313-333
The spectrum of this quasar is extremely flat and the source, which is very variable at high radio frequencies, has been associated with the EGRET source 3EG J1313-431 (Tornikoski et al. 2002; Nolan et al. 1996). VLBA images at 2.32 and 8.55 GHz by Fey et al. (1996) show jet components to the west, separated from the core by 4.7 mas at 2.32 GHz, and 0.9 and 4.5 mas at 8.55 GHz, respectively. Our image shows emission in the same direction and on the same scales but at higher resolution than published before.1322-428
Centaurus A is the nearest AGN and is one of only two radio galaxies detected by Fermi in its first three months of observation (Abdo et al. 2009b). This very well studied source was also detected in1323-526
This is a bright but relatively poorly studied optically unclassified object. It shows intra-day variability (McCulloch et al. 2005). Bignall et al. (2008) suggest a tentative association of this flat-spectrum IDV radio source with the unidentified EGRET source 3EG J1316-5244. The TANAMI image shows a continuous jet extending about 8 mas to the south of the core.1333-337
(IC 4296) A symmetric jet and counterjet system is visible in the kpc regime, which is orientated in the northwest-southeast direction. The outer lobes of the jets are separated by about 30 arcmin (Goss et al. 1977; Killeen et al. 1986). The central nuclear luminosity is relatively weak compared to ``normal'' radio-loud AGN (Pellegrini et al. 2003). This galaxy was not detected by EGRET, nor has it been detected by the LAT in its first three months. The TANAMI image shows its parsec-scale structure to have a jet and a counterjet aligned northwest-southeast i.e. the same orientation as its kiloparsec structure.![\begin{figure}
\par\includegraphics[width=11.8cm,clip]{12724fg9.eps}
\end{figure}](/articles/aa/full_html/2010/11/aa12724-09/img31.png)
|
Figure 9: Tapered contour maps of 13 TANAMI sources at 8.4 GHz revealing more extended emission than visible in the naturally-weighted images. The scale of each image is in milliarcseconds. The FWHM Gaussian restoring beam applied to the images is shown as a hatched ellipse in the lower left of each panel. Each panel also shows a bar representing a linear scale of 10 pc or 100 pc except for the sources without a measured redshift. |
| Open with DEXTER | |
1424-418
Previous VLBI images of this highly optically polarized quasar (Impey & Tapia 1988) showed jet components in different directions. Preston et al. (1989) found a component to the northeast separated by 23 mas from the core, while the image by Shen et al. (1998b) showed a component about 3 mas to the northwest of the core. The VSOP image by Tingay et al. (2002) shows a northeastward extension of the core and the one by Ojha et al. (2004a) reveals weak structure in the same direction. Our TANAMI image is in agreement with the results of Ojha et al. (2004a); Tingay et al. (2002); Preston et al. (1989) but reveals substantially more detail than these previous images. The jet extends out to about 40 mas east from the core and is very diffuse and resolved, best revealed in the tapered image in Fig. 10.1454-354
This flat-spectrum radio quasar is not very well studied. This source was included in our initial TANAMI sample as a possible counterpart for the EGRET source 3EG J1500-3509 (with 1501-343 being an alternative association; Sowards-Emmerd et al. 2004; Mattox et al. 2001). This was the first1501-343
Along with 1454-354, this source has been suggested by Sowards-Emmerd et al. (2004) as a possible blazar counterpart for 3EG J1500-3509. The early detection of 1454-354 by the LAT makes 1501-343 the more unlikely association of the 3EG source. Petrov et al. (2007) did not detect this source at 22 GHZ in six observations with a minimum flux density limit of 170 mJy. TANAMI presents the first VLBI image of this source, revealing a very compact structure with only a very weak possible extension to the south. Despite the relatively low core flux density, the brightness temperature exceeds![\begin{figure}
\par\includegraphics[width=12.4cm,clip]{12724fg10.ps}
\vspace*{0.6mm}
\end{figure}](/articles/aa/full_html/2010/11/aa12724-09/img33.png)
|
Figure 10: Same as Fig. 9. |
| Open with DEXTER | |
![\begin{figure}
\par\includegraphics[width=8.8cm,clip]{12724fg11.ps}
\end{figure}](/articles/aa/full_html/2010/11/aa12724-09/img34.png)
|
Figure 11: Same as Fig. 9. |
| Open with DEXTER | |
1549-790
This luminous narrow-line radio galaxy has been suggested to be an object at an early stage of its evolution (Tadhunter et al. 2001) and seems to be accreting at close to the Eddington rate (Holt et al. 2006) possibly related to a recent merger. Previously, a one-sided core-jet type structure has been reported for this source (Holt et al. 2006), which led to difficulties in understanding the absence of broad emission lines and a strong non-stellar optical continuum, as well as the presence of HI absorption (Morganti et al. 2001). The tapered TANAMI image shown in Fig. 10 shows a symmetric inner system with a jet and a pronounced counterjet extending out to about 30 mas east and west of the brightest feature, which we tentatively identify as the core. At larger distances towards the west, there is a very large and diffuse emission region ranging from1610-771
Using data with 22 mas resolution Preston et al. (1989) modeled this source as a 3.8 Jy component 10 mas in extent with a 1.4 Jy halo approximately 50 mas in diameter. The VSOP image by Tingay et al. (2002) revealed the small scale structure within1714-336
This is a possible counterpart of 3EG J1718-3313 (Sowards-Emmerd et al. 2004) that has not yet been detected by the LAT (Abdo et al. 2009b). The TANAMI image of this BL Lac appears to be the first at VLBI resolution and shows a bright core with a jet extending over 20 mas to the northeast. Only Australian antennas participated in this observation so that the image resolution is worse than for most other TANAMI images presented in this paper. The core brightness temperature is unusually low.1716-771
Tornikoski et al. (2002) suggested this unclassified source of undetermined redshift as a possible counterpart for 3EG J1720-7820 but within the first three months of Fermi all-sky observations, it did not show up as a bright1718-649
With a distance of 56 Mpc this is one of the closest and best studied GPS sources (e.g. Tingay et al. 2003a). Its structure strengthens the assumption that GPS sources arise as a consequence of galaxy merger activity (Tingay et al. 1997). Tingay & de Kool (2003) suggest synchrotron self-absorption or free-free absorption are the only possible processes responsible for the gigahertz-peaked spectrum. The maps by Tingay et al. (2002) and Ojha et al. (2004a) show two components separated by about 7 mas. It was not possible to identify which one corresponds to the core. The map by Preston et al. (1989) also showed a double component aligned in the same direction (southeast to northwest). Our TANAMI image shows two bright components with similar alignment and separation but the northwestern component is clearly more ``core-like'' in appearance. There is also a bright extension to the northeast of the ``core''. We classify this source as morphologically irregular.1733-565
This FR II radio galaxy has two extended lobes to the southwest and northeast of the core, which are separated by 4.57 arcmin (Hunstead et al. 1982), in between there is bridge and core emission. Bryant & Hunstead (2002) found rotating emission-line gas extended perpendicular to the radio axis. The VLBI map by Ojha et al. (2004a) shows a compact core, without additional components. The TANAMI image shows a jet as well as a counter jet aligned northeast and southwest i.e. in the same direction as the large scale structure.1759-396
This source is a possible counterpart of 3EG J1800-3955 (Sowards-Emmerd et al. 2004) and is a low confidence detection with the LAT (Abdo et al. 2009b). The TANAMI image shows a fairly typical core jet source with the jet extending northwest to about 10 mas.Table 3: Source list.
Table 4: Source structure.
Table 5: Source structure of tapered images.
![\begin{figure}
\par\includegraphics[angle=-90,width=8.2cm,clip]{12724fg12a.ps}\h...
...degraphics[angle=-90,width=8.2cm,clip]{12724fg12d.ps}
\vspace*{2mm}
\end{figure}](/articles/aa/full_html/2010/11/aa12724-09/img134.png)
|
Figure 12: The (u,v)-plane coverage of four sources chosen to span the declination range of the TANAMI targets and thus representative of them. The short baselines near the center of each plot are produced by the telescopes in Australia. The long baselines are furnished by the Hartebeesthoek telescope in South Africa. The ``hole'' in the (u,v)-plane coverage is a result of the absence of any telescopes between Australia and South Africa. Note that Hartebeesthoek is currently out of service and the long baselines are provided by O'Higgins in Antarctica and TIGO in Chile. |
| Open with DEXTER | |
1804-502
This source is a candidate counterpart for 3EG J1806-5005 (Tornikoski et al. 2002) but it has not been a bright1814-637
This is a compact steep spectrum (CSS) source with three components oriented along a south-southeast to north-northwest axis. Tzioumis et al. (2002) imaged this source at 2.3 GHz and found two strong components separated by more than 200 mas and a weak (151933-400
Based on VLA observations, Perley (1982) found that this source has a diffuse secondary component extending from the core to 3.5 arcsec at a position angle of1954-388
This source has a high optical polarization, up to 11% (Impey & Tapia 1988,1990) and a GPS-type spectrum (Edwards & Tingay 2004; Tornikoski et al. 2001). VLBI observations showed a compact core (Shen et al. 1998b; Preston et al. 1985). Based on VLBA observations, Fomalont et al. (2000) present a elongation of the core to the southsouthwest, whereas Ojha et al. (2004a) found a weak component about 3 mas to the west of the core. Our TANAMI image shows a westward directed jet, extending about 5 mas from the core.2005-489
This is one of the brightest known BL Lac sources (Wall et al. 1986) and it is classified as a high-frequency peaked BL Lac (HBL) due to its X-ray-to-radio flux ratio (Sambruna et al. 1995). It is a TeV source discovered by HESS, which has the softest VHE spectrum (2027-308
There is only very limited information on this source in the literature. Grandi (1983) note that it is probably a member of the class of very-narrow-line emission galaxies. Sowards-Emmerd et al. (2004) listed this source as a likely counterpart of the EGRET source 3EG 2034-3110. Our TANAMI image shows an unresolved core with a jet-like extension to the southwest.2052-474
This source was identified with the EGRET source 3EG J2055-4716 (Hartman et al. 1999). Observations with Chandra did not reveal extended X-ray emission, but there is a two-sided arcsecond-scale radio jet in addition to the bright radio core (Marshall et al. 2005). The VLBI image by Ojha et al. (2004a) shows a compact core. Our image shows a very weak jet to the west.2106-413
The radio core of this quasar is moderately polarized (3.5%, Impey & Tapia 1990). ATCA observations indicate that the radio spectrum peaks near 5 GHz (Kollgaard et al. 1995). The VLBA image by Fomalont et al. (2000) shows a slightly elongated core. Our image shows a bright component about 2-3 mas east of the core, which appears elongated in the north-south direction and additional diffuse jet emission further to the east.2149-306
This is a high-redshift, high-luminosity radio-loud quasar with a strongly blueshifted Fe K2152-699
This FR II radio source has a classic double-lobed structure (Fosbury et al. 1990), and is one of the brightest sources in the sky at 2.3 GHz (Wall 1994). Tadhunter et al. (1988) find that the radio axis and optical emission line features on the kiloparsec-scale are misaligned and suggest interaction between the radio jet and an extra-nuclear cloud of gas. The parsec-scale radio jet aligns strongly with optical emission line features (Tingay et al. 1996b). The VSOP image by Tingay et al. (2002) shows a resolved core and highly linear, narrow jet approximately 6 mas to the northeast. Ojha et al. (2004a) find a similar morphology consisting of the core and jet component to the northeast with separation of a few mas. Our image is in agreement with these previous images of this source, revealing well-collimated but knotty jet emission on intermediate scales out to about 30 mas from the core.2155-304
This is one of the brightest extragalactic X-ray sources in the sky and was detected with most high-energy satellites including EGRET (Vestrand et al. 1995). TeV2204-540
This bright quasar is a member of our radio-selected subsample and has a high polarization of2326-477
Scott et al. (2004) find a compact, unresolved core structure smaller than 0.1 mas2 of 410 mJy and a brightness temperature above2355-534
This is a optically violent and highly polarized source (Impey & Tapia 1988,1990). Shen et al. (1998b) present a VLBI image revealing a component to the southwest of the core with a separation of 4.9 mas. Our image shows at least two distinct jet components along the same position angle, an inner one at6 Discussion
6.1 Redshifts
Figure 13 shows the redshift-distribution of all the TANAMI sources. For galaxies and BL Lac objects the distribution peaks at z<0.4 while for quasars it peaks at![\begin{figure}
\par\includegraphics[angle=-90,width=8.8cm,clip]{12724fg13.eps}
\end{figure}](/articles/aa/full_html/2010/11/aa12724-09/img144.png)
|
Figure 13: Distribution of the redshifts of all TANAMI sources with optical identification shown. |
| Open with DEXTER | |
![\begin{figure}
\par\includegraphics[angle=-90,width=8.8cm,clip]{12724fg14.eps}
\end{figure}](/articles/aa/full_html/2010/11/aa12724-09/img145.png)
|
Figure 14: Distribution of the redshifts of the radio-selected sub-sample of TANAMI sources. |
| Open with DEXTER | |
![\begin{figure}
\par\includegraphics[angle=-90,width=8.8cm,clip]{12724fg15.eps}
\end{figure}](/articles/aa/full_html/2010/11/aa12724-09/img146.png)
|
Figure 15: Distribution of the redshifts of the EGRET-selected sub-sample of TANAMI sources. |
| Open with DEXTER | |
![\begin{figure}
\par\includegraphics[angle=-90,width=8.8cm,clip]{12724fg16.eps}
\end{figure}](/articles/aa/full_html/2010/11/aa12724-09/img147.png)
|
Figure 16: Distribution of the redshifts of all TANAMI sources with LAT detections and non-detections shown. While broadly similar, most galaxies and none of the five most distant sources have been detected yet by the LAT. |
| Open with DEXTER | |
6.2 Luminosities
For all 38 TANAMI sources that have a published redshift, the core and
the total luminosity was calculated assuming isotropic emission.
The results are shown in the final two columns of
Table 4. For both LAT detected and non-detected
sources, the values range from about 1022 to almost 1029
![]() with two thirds of both of these categories of
sources having total luminosity above 1027
with two thirds of both of these categories of
sources having total luminosity above 1027
![]() .
There is a clear difference between the distribution of luminosity of
different optical types with all eight galaxy luminosities below
1026
.
There is a clear difference between the distribution of luminosity of
different optical types with all eight galaxy luminosities below
1026
![]() and all twenty-four quasar luminosities
above 1026
and all twenty-four quasar luminosities
above 1026
![]() (all but one above 1027
(all but one above 1027
![]() ). The five BLLacs in the sample are evenly
distributed between 1024 and 1028
). The five BLLacs in the sample are evenly
distributed between 1024 and 1028
![]() .
.
None of the five most luminous sources (which are also the five most
distant sources, see 6.1) have been detected by the
LAT. More intriguing, none of the nine most luminous jets (obtained by
taking the difference of total and core luminosity) are detected which,
taken at face value, would suggest an unexpected anti-correlation between
jet luminosity and ![]() -ray brightness. More typically, the four most
luminous BLLac sources have been detected by the LAT.
-ray brightness. More typically, the four most
luminous BLLac sources have been detected by the LAT.
6.3 Morphology and connection to Fermi
To discuss the morphology of TANAMI sources we have adopted the classification scheme used by Kellermann et al. (1998) which places objects into four categories. Sources that appear barely resolved are considered ``compact'' (C), those with the most compact component at either end of the image are considered ``single-sided'' (SS) and those with the most compact component in the middle of the image are considered ``double-sided'' (DS). Finally, there is a category of sources with ``irregular'' (Irr) structure which includes sources with morphology that does not fall into the first three categories. This scheme has the virtue of not making any assumptions about the physical nature of the objects under study, separating theThree TANAMI sources, 0332-403, 0405-385, and 1501-343, appear
compact from our images. However, we only classify 1501-343 as
``compact'' since our images for the first two sources have a lower
resolution due to the absence of trans-oceanic baselines and past images
indicate the presence of some weak extended structure. Optically
1501-343 is an ``unclassified'' source. 1322-428, 1333-337,
1549-790, 1733-566 and 1814-637 are double-sided. All five are
galaxies. Another galaxy, 1718-649 is the only ``irregular'' source in
our sample. All of the remaining 36 sources (![]() of the TANAMI
sample) are single-sided (Table 6). These
include all quasars, all BL Lacs, four of the ten galaxies and two of the
three optically unidentified sources in the TANAMI sample.
Characteristics of individual sources are discussed in
Sect. 5.
of the TANAMI
sample) are single-sided (Table 6). These
include all quasars, all BL Lacs, four of the ten galaxies and two of the
three optically unidentified sources in the TANAMI sample.
Characteristics of individual sources are discussed in
Sect. 5.
Since the ![]() -ray emission is likely to be beamed and orientation
dependent, we would expect to find differences in the parsec scale
morphology of
-ray emission is likely to be beamed and orientation
dependent, we would expect to find differences in the parsec scale
morphology of ![]() -loud and
-loud and ![]() -quiet objects. However, past
comparisons of VLBI morphologies of EGRET detected sources with those not
detected by EGRET failed to show any connection between observed
-quiet objects. However, past
comparisons of VLBI morphologies of EGRET detected sources with those not
detected by EGRET failed to show any connection between observed
![]() -ray emission and parsec scale structure (Taylor et al. 2007). This
was attributed to the fact that nearly all EGRET sources were detected
only when flaring and that most sources lay within a factor of 10 of
EGRET's minimum detectable flux. The expectation is that essentially all
bright compact radio sources will be
-ray emission and parsec scale structure (Taylor et al. 2007). This
was attributed to the fact that nearly all EGRET sources were detected
only when flaring and that most sources lay within a factor of 10 of
EGRET's minimum detectable flux. The expectation is that essentially all
bright compact radio sources will be ![]() -ray loud if observed with
significantly better sensitivity than EGRET.
-ray loud if observed with
significantly better sensitivity than EGRET.
Table 6: Distribution of morphology.
After three months of observations Fermi found 12 of our 43 TANAMI sources (Interestingly, two of the four known intraday variable (IDV) sources in our sample (0405-385 and 1144-379) have been detected by Fermi. All four IDV sources have a ``SS'' morphology. This is consistent with our current understanding of IDV sources as being among the most extreme members of the blazar class.
To compare the opening angles of Fermi-detected and non-detected
blazar jets, we fitted circular Gaussian components to the visibility
data and measured the angle at which the innermost jet component appears
from the position of the core of the jet
(Table 7). In two cases (0332-403 and 0405-385)
the lack of long baselines did not allow us to resolve the inner jet
structure and to model-fit any jet components. In one case (0454-463),
the jet was too weak and partially resolved, and in one case (1501-343),
the source was unresolved even on the longest baselines. We excluded all
galaxies from this analysis, first, because we cannot unambiguously
determine the core position in a number of galaxy jet-counterjet systems
and, second, because galaxies are usually not detected by Fermi.
Our initial analysis suggests that 7 out of 9 (![]() )
LBAS sources have
an opening angle >30 degrees while only 4 out of 15 (
)
LBAS sources have
an opening angle >30 degrees while only 4 out of 15 (![]() )
non-LBAS
sources have an opening angle >30 degrees.
This would suggest that
)
non-LBAS
sources have an opening angle >30 degrees.
This would suggest that ![]() -ray bright jets have either smaller
Lorentz factors (the width of the relativistic beaming cone is
-ray bright jets have either smaller
Lorentz factors (the width of the relativistic beaming cone is
![]()
![]() )
or that they are pointed closer to the line of sight
than
)
or that they are pointed closer to the line of sight
than ![]() -ray faint jets. An inverse correlation between
-ray faint jets. An inverse correlation between ![]() -ray
brightness and the beaming seems very unlikely and, in fact, previous
studies have shown that the Lorentz factor of
-ray
brightness and the beaming seems very unlikely and, in fact, previous
studies have shown that the Lorentz factor of ![]() -ray brighter jets
as seen with Fermi are higher than for
-ray brighter jets
as seen with Fermi are higher than for ![]() -ray fainter jets
(e.g., Kovalev et al. 2009; Lister et al. 2009b). If confirmed by future analysis
of larger samples, the result that
-ray fainter jets
(e.g., Kovalev et al. 2009; Lister et al. 2009b). If confirmed by future analysis
of larger samples, the result that ![]() -ray brighter jets have larger
observed opening angles might thus imply that these appear geometrically
increased in projection because of smaller angles to the line of sight (Pushkarev et al. 2009).
-ray brighter jets have larger
observed opening angles might thus imply that these appear geometrically
increased in projection because of smaller angles to the line of sight (Pushkarev et al. 2009).
Table 7: Opening angles of TANAMI sources.
6.4 Brightness temperature
We identified the core component for each source based on its morphology
and, in some cases, past VLBI images and identifications. In all cases,
this approach led to the identification of the core as the brightest and
most compact feature, either at the end of a one-sided jet or at the
center of a double-sided twin-jet. Gaussian models were fitted to the
core visibility data using DIFMAP. We did this by replacing the
CLEAN components from the core region in the final model with an
elliptical Gaussian component. The brightness temperature of the fitted
core component was then calculated in the rest frame of the source using
the expression:
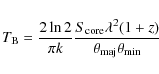
|
(1) |
where
In order to distinguish between cores that were resolved and those that
were not we compared the fitted component sizes
![]() with the
theoretical resolution limit of our array
with the
theoretical resolution limit of our array
![]() .
We
calculated
.
We
calculated
![]() taking into account the synthesized
beamsize,
taking into account the synthesized
beamsize,
![]() (where
(where
![]() is the
geometric mean of the major and minor beam axes) and the signal-to-noise
ratio (SNR) of the core component following Kovalev et al. (2005, Eq. (2)).
Components with fitted sizes
is the
geometric mean of the major and minor beam axes) and the signal-to-noise
ratio (SNR) of the core component following Kovalev et al. (2005, Eq. (2)).
Components with fitted sizes
![]() are considered unresolved and we determine lower limits of their
calculated brightness temperatures by using
are considered unresolved and we determine lower limits of their
calculated brightness temperatures by using
![]() as an
upper limit on their size. It should be noted that all other brightness
temperatures are limits in a similar sense, because VLBI observations at
a given frequency can never rule out the possibility that even smaller
structures inside the cores are dominating the core emission.
as an
upper limit on their size. It should be noted that all other brightness
temperatures are limits in a similar sense, because VLBI observations at
a given frequency can never rule out the possibility that even smaller
structures inside the cores are dominating the core emission.
![\begin{figure}
\par\includegraphics[width=8.8cm,clip]{12724fg17.eps}
\end{figure}](/articles/aa/full_html/2010/11/aa12724-09/img164.png)
|
Figure 17: Distribution of core brightness temperature of all TANAMI sources with optical identification shown. |
| Open with DEXTER | |
![\begin{figure}
\par\includegraphics[width=8.8cm,clip]{12724fg18.eps}
\end{figure}](/articles/aa/full_html/2010/11/aa12724-09/img165.png)
|
Figure 18: Distribution of core brightness temperature of all TANAMI sources with LAT detections and non-detections shown. |
| Open with DEXTER | |
The core brightness temperatures for all sources are listed in
Table 4 and their distribution is shown in
Fig. 17. The higher end of the distribution is
dominated by quasars while the lowest brightness temperatures are those
of BL Lacs and galaxies. We find 2 sources with fully unresolved cores
(1501-343, and 2027-308) and 2 which are unresolved perpendicular to
the jet axis and resolved along it (1313-333 and 1804-502). Fourteen
sources show a maximum brightness temperature below the
equipartition value of 1011 K (Readhead 1994) with thirty
sources having values below the inverse Compton limit of 1012 K
described by Kellermann & Pauliny-Toth (1969). As many as thirteen sources
exceed this limit, one of them substantially (0537-441). This is most
likely a result of Doppler boosting that is commonly seen in blazars.
However, contributions from exotic mechanisms such as coherent emission
and relativistic proton emission and/or non-simple geometries cannot be
ruled out (Kellermann et al. 2004). The median value is near
![]() K with the maximum value exceeding 1014 K. This
is comparable to the results of the MOJAVE sample (Kovalev et al. 2005).
K with the maximum value exceeding 1014 K. This
is comparable to the results of the MOJAVE sample (Kovalev et al. 2005).
Figure 18 shows the core brightness temperatures of LAT detections and non-detections, based on the 3-month LAT list. There does not appear to be any significant difference between LAT detections and non-detections. It is interesting to note that many sources with high brightness temperatures, and thus expected to have high Doppler factors, remain undetected by the LAT. Nine of the thirteen with values above 1012 K remain undetected.
7 Conclusions
Our first epoch 8.4 GHz TANAMI images show that the Australian Long
Baseline Array and associated telescopes provide high quality images of
![]() -ray blazars that can be used to study the physics of blazars. In
many cases these images represent a substantial improvement on published
work. The addition of telescopes in Antarctica and Chile is expected to
compensate for the loss of the Hartebeesthoek telescope in South Africa
and to improve the current (u,v)-coverage.
-ray blazars that can be used to study the physics of blazars. In
many cases these images represent a substantial improvement on published
work. The addition of telescopes in Antarctica and Chile is expected to
compensate for the loss of the Hartebeesthoek telescope in South Africa
and to improve the current (u,v)-coverage.
The TANAMI sample has been defined as a hybrid radio and ![]() -ray
selected sample of AGN south of
-ray
selected sample of AGN south of
![]() .
Of this sample,
.
Of this sample,
![]() of sources show a one-sided morphology,
of sources show a one-sided morphology, ![]() (all galaxies) are
double sided, while one optically unidentified source is compact and one
galaxy has a irregular morphology. Of these quasars and BL Lacs have
similar morphologies, all being single-sided. The ten galaxies in the
sample include five double sided objects, one irregular object and four
single sided objects.
(all galaxies) are
double sided, while one optically unidentified source is compact and one
galaxy has a irregular morphology. Of these quasars and BL Lacs have
similar morphologies, all being single-sided. The ten galaxies in the
sample include five double sided objects, one irregular object and four
single sided objects.
About 28 % of TANAMI sources have been detected by the Fermi
LAT after three months of observations. When galaxies are excluded,
initial analysis shows that ![]() of sources detected by the LAT have
opening angles >30 degrees compared to just
of sources detected by the LAT have
opening angles >30 degrees compared to just ![]() of non-LBAS
sources. This suggests that
of non-LBAS
sources. This suggests that ![]() -ray bright jets are pointed closer
to the line of sight than
-ray bright jets are pointed closer
to the line of sight than ![]() -ray faint jets, with the observed
opening angles appearing geometrically increased. This result should be
regarded as preliminary owing to the modest number of sources available
for analysis at this time.
-ray faint jets, with the observed
opening angles appearing geometrically increased. This result should be
regarded as preliminary owing to the modest number of sources available
for analysis at this time.
The redshift distribution of the BL Lacs and quasars in the TANAMI sample
is similar to the distributions seen for the LBAS and EGRET blazars. No
difference is seen between the radio- and ![]() -ray selected
subsamples. The redshift distributions of EGRET and LAT detected AGN are
also similar. However, most galaxies and none of the five most distant
and most luminous sources have been detected by the LAT. Galaxies have
the lowest luminosities, BLLacs are more luminous (than galaxies) as a
group while quasars dominate the high end of the luminosity distribution.
None of the nine most luminous jets have been detected by the LAT so far.
-ray selected
subsamples. The redshift distributions of EGRET and LAT detected AGN are
also similar. However, most galaxies and none of the five most distant
and most luminous sources have been detected by the LAT. Galaxies have
the lowest luminosities, BLLacs are more luminous (than galaxies) as a
group while quasars dominate the high end of the luminosity distribution.
None of the nine most luminous jets have been detected by the LAT so far.
The high end of the brightness temperature distribution is dominated by
quasars with the lower end composed mostly of BL Lacs and galaxies.
Fourteen sources have a maximum brightness temperature below the
equipartition value, and 30 sources have a value below the inverse
Compton limit putting about a third of the values above this limit. The
median value is near
![]() K with the maximum value exceeding
1014 K. There does not appear to be any significant difference in
the brightness temperature distributions of LAT detections and
non-detections. Many of the sources with very high brightness
temperatures have not yet been detected by the LAT.
K with the maximum value exceeding
1014 K. There does not appear to be any significant difference in
the brightness temperature distributions of LAT detections and
non-detections. Many of the sources with very high brightness
temperatures have not yet been detected by the LAT.
The initial results presented here will be augmented by 22 GHz images as
well as multi-epoch data in future papers to address our scientific
questions including those that require spectral and kinematic
information. Of particular, interest will be TANAMI epochs observed since
the launch of Fermi satellite thus providing near-simultaneous
data at radio, ![]() -ray as well as at intermediate wavelengths from
coordinated observations with other instruments. As discussed in
Sect. 1, TANAMI and Fermi data will also be used
with neutrino data from ANTARES and KM3NET for the identification and
study of neutrino point sources.
-ray as well as at intermediate wavelengths from
coordinated observations with other instruments. As discussed in
Sect. 1, TANAMI and Fermi data will also be used
with neutrino data from ANTARES and KM3NET for the identification and
study of neutrino point sources.
We are grateful to Dirk Behrend, Neil Gehrels, Julie McEnery, David Murphy, and John Reynolds, who contributed in numerous ways to the success of the TANAMI program so far. Furthermore, we thank the Fermi/LAT AGN group for the good collaboration. The Long Baseline Array is part of the Australia Telescope which is funded by the Commonwealth of Australia for operation as a National Facility managed by CSIRO. This work made use of the Swinburne University of Technology software correlator, developed as part of the Australian Major National Research Facilities Programme and operated under licence. M.K. has been supported in part by an appointment to the NASA Postdoctoral Program at the Goddard Space Flight Center, administered by Oak Ridge Associated Universities through a contract with NASA. We would like to thank the staff of the Swinburne correlator for their unflagging support. This research has made use of data from the NASA/IPAC Extragalactic Database (NED, operated by the Jet Propulsion Laboratory, California Institute of Technology, under contract with the National Aeronautics and Space Administration); and the SIMBAD database (operated at CDS, Strasbourg, France). This research has made use of NASA's Astrophysics Data System. This research has made use of the United States Naval Observatory (USNO) Radio Reference Frame Image Database (RRFID).
References
- Abdo, A. A., Ackermann, M., Ajello, M., et al. 2009a, ApJS, 183, 46 [NASA ADS] [CrossRef] [Google Scholar]
- Abdo, A. A., Ackermann, M., Ajello, M., et al. 2009b, ApJ, 700, 597 [NASA ADS] [CrossRef] [Google Scholar]
- Abdo, A. A., Ackermann, M., Atwood, W. B., et al. 2009c, ApJ, 697, 934 [NASA ADS] [CrossRef] [Google Scholar]
- Aharonian, F., Akhperjanian, A. G., Aye, K. M., et al. 2005a, A&A, 436, L17 [NASA ADS] [CrossRef] [EDP Sciences] [Google Scholar]
- Aharonian, F., Akhperjanian, A. G., Aye, K. M., et al. 2005b, A&A, 430, 865 [NASA ADS] [CrossRef] [EDP Sciences] [Google Scholar]
- Aharonian, F., Akhperjanian, A. G., Bazer-Bachi, A. R., et al. 2007, ApJ, 664, L71 [Google Scholar]
- Atwood, W. B., Abdo, A. A., Ackermann, M., et al. 2009, ApJ, 697, 1071 [NASA ADS] [CrossRef] [Google Scholar]
- Bignall, H. E., Jauncey, D. L., Lovell, J. E. J., et al. 2003, ApJ, 585, 653 [NASA ADS] [CrossRef] [Google Scholar]
- Bignall, H. E., Macquart, J. P., Jauncey, D. L., et al. 2006, ApJ, 652, 1050 [NASA ADS] [CrossRef] [Google Scholar]
- Bignall, H., Cimo, G., Jauncey, D., et al. 2008, Proceedings of Science in From Planets to Dark Energy: the Modern Radio Universe PoS (MRU), 084 [Google Scholar]
- Boisson, C., Cayatte, V., & Sol, H. 1989, A&A, 211, 275 [NASA ADS] [Google Scholar]
- Böttcher, M. 2007, Ap&SS, 309, 95 [NASA ADS] [CrossRef] [Google Scholar]
- Browne, I. W. A., Savage, A., & Bolton, J. G. 1975, MNRAS, 173, 87P [NASA ADS] [Google Scholar]
- Bryant, J. J., & Hunstead, R. W. 2002, MNRAS, 337, 861 [NASA ADS] [CrossRef] [Google Scholar]
- Cassaro, P., Stanghellini, C., Bondi, M., et al. 1999, A&AS, 139, 601 [Google Scholar]
- Chartas, G., Worrall, D. M., Birkinshaw, M., et al. 2000, ApJ, 542, 655 [NASA ADS] [CrossRef] [Google Scholar]
- Chiang, J., Fichtel, C. E., von Montigny, C., et al. 1995, ApJ, 452, 156 [NASA ADS] [CrossRef] [Google Scholar]
- Christiansen, W. N., Frater, R. H., Watkinson, A., et al. 1977, MNRAS, 181, 183 [NASA ADS] [Google Scholar]
- Cohen, M. H., Lister, M. L., Homan, D. C., et al. 2007, ApJ, 658, 232 [NASA ADS] [CrossRef] [Google Scholar]
- da Costa, L. N., Pellegrini, P. S., Davis, M., et al. 1991, ApJS, 75, 935 [NASA ADS] [CrossRef] [Google Scholar]
- Danziger, I. J., & Goss, W. M. 1979, MNRAS, 186, 93 [NASA ADS] [Google Scholar]
- Danziger, I. J., Fosbury, R. A. E., Goss, W. M., & Ekers, R. D. 1979, MNRAS, 188, 415 [NASA ADS] [Google Scholar]
- Deller, A. T., Tingay, S. J., Bailes, M., & West, C. 2007, PASP, 119, 318 [NASA ADS] [CrossRef] [Google Scholar]
- Dodson, R., Fomalont, E. B., Wiik, K., et al. 2008, ApJS, 175, 314 [NASA ADS] [CrossRef] [Google Scholar]
- Dondi, L., & Ghisellini, G. 1995, MNRAS, 273, 583 [NASA ADS] [Google Scholar]
- Drinkwater, M. J., Webster, R. L., Francis, P. J., et al. 1997, MNRAS, 284, 85 [NASA ADS] [Google Scholar]
- Edwards, P. G. 2005, Ap&SS, 297, 31 [NASA ADS] [CrossRef] [Google Scholar]
- Edwards, P. G., & Tingay, S. J. 2004, A&A, 424, 91 [NASA ADS] [CrossRef] [EDP Sciences] [Google Scholar]
- Edwards, P. G., Piner, B. G., Tingay, S. J., et al. 2006, PASJ, 58, 233 [NASA ADS] [Google Scholar]
- Falomo, R., Maraschi, L., Treves, A., & Tanzi, E. G. 1987, ApJ, 318, L39 [NASA ADS] [CrossRef] [Google Scholar]
- Falomo, R., Pesce, J. E., & Treves, A. 1993, ApJ, 411, L63 [NASA ADS] [CrossRef] [Google Scholar]
- Fanaroff, B. L., & Riley, J. M. 1974, MNRAS, 167, 31P [Google Scholar]
- Fey, A. L., Clegg, A. W., & Fomalont, E. B. 1996, ApJS, 105, 299 [NASA ADS] [CrossRef] [Google Scholar]
- Fomalont, E. B., Frey, S., Paragi, Z., et al. 2000, ApJS, 131, 95 [NASA ADS] [CrossRef] [Google Scholar]
- Fosbury, R. A. E., di Serego Alighieri, S., Courvoisier, T. J. L., et al. 1990, in ed. E. Rolfe, ESA Spec. Publ., 310, 513 [Google Scholar]
- Gehrels, N., & Michelson, P. 1999, Astrop. Phys., 11, 277 [NASA ADS] [CrossRef] [Google Scholar]
- Goss, W. M., Wellington, K. J., Christiansen, W. N., et al. 1977, MNRAS, 178, 525 [NASA ADS] [Google Scholar]
- Govoni, F., Falomo, R., Fasano, G., & Scarpa, R. 2000, A&AS, 143, 369 [Google Scholar]
- Graham, J. A. 1978, PASP, 90, 237 [NASA ADS] [CrossRef] [Google Scholar]
- Grandi, S. A. 1983, MNRAS, 204, 691 [NASA ADS] [Google Scholar]
- Greisen, E. W. 1998, in Astronomical Data Analysis Software and Systems VII, ed. R. Albrecht, R. N. Hook, & H. A.Bushouse, ASP Conf. Ser., 145, 204 [Google Scholar]
- Hartman, R. C., Bertsch, D. L., Fichtel, C. E., et al. 1992, ApJ, 385, L1 [NASA ADS] [CrossRef] [Google Scholar]
- Hartman, R. C., Bertsch, D. L., Bloom, S. D., et al. 1999, ApJS, 123, 79 [NASA ADS] [CrossRef] [Google Scholar]
- Hewitt, A., & Burbidge, G. 1989, A new optical catalog of QSO [Google Scholar]
- Holt, J., Tadhunter, C., Morganti, R., et al. 2006, MNRAS, 370, 1633 [NASA ADS] [CrossRef] [Google Scholar]
- Horiuchi, S., Fomalont, E. B., Taylor, W. K., et al. 2004, ApJ, 616, 110 [NASA ADS] [CrossRef] [Google Scholar]
- Horiuchi, S., Meier, D. L., Preston, R. A., & Tingay, S. J. 2006, PASJ, 58, 211 [NASA ADS] [Google Scholar]
- Hunstead, R. W., & Murdoch, H. S. 1980, MNRAS, 192, 31P [NASA ADS] [Google Scholar]
- Hunstead, R. W., Murdoch, H. S., & Shobbrook, R. R. 1978, MNRAS, 185, 149 [NASA ADS] [Google Scholar]
- Hunstead, R. W., Durdin, J. M., Little, A. G., et al. 1982, Proc. Astron. Soc. Austr., 4, 447 [NASA ADS] [Google Scholar]
- Impey, C. D., & Tapia, S. 1988, ApJ, 333, 666 [NASA ADS] [CrossRef] [Google Scholar]
- Impey, C. D., & Tapia, S. 1990, ApJ, 354, 124 [NASA ADS] [CrossRef] [Google Scholar]
- Jackson, C. A., Wall, J. V., Shaver, P. A., et al. 2002, A&A, 386, 97 [NASA ADS] [CrossRef] [EDP Sciences] [Google Scholar]
- Jauncey, D. L., Batty, M. J., Gulkis, S., & Savage, A. 1982, AJ, 87, 763 [NASA ADS] [CrossRef] [Google Scholar]
- Jauncey, D. L., Batty, M. J., Wright, A. E., et al. 1984, ApJ, 286, 498 [NASA ADS] [CrossRef] [Google Scholar]
- Kadler, M., Ros, E., Lobanov, A. P., et al. 2004, A&A, 426, 481 [NASA ADS] [CrossRef] [EDP Sciences] [Google Scholar]
- Kedziora-Chudczer, L. 2006, MNRAS, 369, 449 [NASA ADS] [CrossRef] [Google Scholar]
- Keel, W. C. 1985, AJ, 90, 2207 [NASA ADS] [CrossRef] [Google Scholar]
- Kellermann, K. I., & Pauliny-Toth, I. I. K. 1969, ApJ, 155, L71 [NASA ADS] [CrossRef] [Google Scholar]
- Kellermann, K. I., Vermeulen, R. C., Zensus, J. A., & Cohen, M. H. 1998, AJ, 115, 1295 [NASA ADS] [CrossRef] [Google Scholar]
- Kellermann, K. I., Lister, M. L., Homan, D. C., et al. 2004, ApJ, 609, 539 [NASA ADS] [CrossRef] [Google Scholar]
- Killeen, N. E. B., Bicknell, G. V., & Ekers, R. D. 1986, ApJ, 302, 306 [NASA ADS] [CrossRef] [Google Scholar]
- Kollgaard, R. I., Feigelson, E. D., Laurent-Muehleisen, S. A., et al. 1995, ApJ, 449, 61 [NASA ADS] [CrossRef] [Google Scholar]
- Kovalev, Y. Y., Kellermann, K. I., Lister, M. L., et al. 2005, AJ, 130, 2473 [NASA ADS] [CrossRef] [Google Scholar]
- Kovalev, Y. Y., Aller, H. D., Aller, M. F., et al. 2009, ApJ, 696, L17 [NASA ADS] [CrossRef] [Google Scholar]
- Kuehr, H., Witzel, A., Pauliny-Toth, I. I. K., & Nauber, U. 1981, A&AS, 45, 367 [NASA ADS] [Google Scholar]
- Lauberts, A., & Valentijn, E. A., 1989, The Messenger, 56, 31 [NASA ADS] [Google Scholar]
- Liang, E. W., & Liu, H. T. 2003, MNRAS, 340, 632 [NASA ADS] [CrossRef] [Google Scholar]
- Lin, Y. C., Bertsch, D. L., Bloom, S. D., et al. 1997, in Proceedings of the Fourth Compton Symposium, ed. C. D. Dermer, M. S. Strickman, & J. D. Kurfess, Am. Inst. Phys. Conf. Ser., 410, 1371 [Google Scholar]
- Lin, Y. C., Bertsch, D. L., Bloom, S. D., et al. 1999, ApJ, 525, 191 [NASA ADS] [CrossRef] [Google Scholar]
- Lister, M. L., Aller, H. D., Aller, M. F., et al. 2009a, AJ, 137, 3718 [NASA ADS] [CrossRef] [Google Scholar]
- Lister, M. L., Homan, D. C., Kadler, M., et al. 2009b, ApJ, 696, L22 [NASA ADS] [CrossRef] [Google Scholar]
- Marelli, M. 2008, The Astronomer's Telegram, 1701, 1 [NASA ADS] [Google Scholar]
- Marshall, H. L., Schwartz, D. A., Lovell, J. E. J., et al. 2005, ApJS, 156, 13 [NASA ADS] [CrossRef] [Google Scholar]
- Mattox, J. R., Hartman, R. C., & Reimer, O. 2001, ApJS, 135, 155 [NASA ADS] [CrossRef] [Google Scholar]
- McCulloch, P. M., Ellingsen, S. P., Jauncey, D. L., et al. 2005, AJ, 129, 2034 [NASA ADS] [CrossRef] [Google Scholar]
- Morganti, R., Oosterloo, T. A., Tadhunter, C. N., et al. 2001, MNRAS, 323, 331 [NASA ADS] [CrossRef] [Google Scholar]
- Morton, D. C., Savage, A., & Bolton, J. G. 1978, MNRAS, 185, 735 [NASA ADS] [Google Scholar]
- Mukherjee, R., Bertsch, D. L., Bloom, S. D., et al. 1997, ApJ, 490, 116 [NASA ADS] [CrossRef] [Google Scholar]
- Nicolson, G. D., Glass, I. S., Feast, M. W., & Andrews, P. J. 1979, MNRAS, 189, 29P [NASA ADS] [Google Scholar]
- Nolan, P. L., Bertsch, D. L., Chiang, J., et al. 1996, ApJ, 459, 100 [NASA ADS] [CrossRef] [Google Scholar]
- Ojha, R., Fey, A. L., Johnston, K. J., et al. 2004a, AJ, 127, 3609 [NASA ADS] [CrossRef] [Google Scholar]
- Ojha, R., Fey, A. L., Johnston, K. J., et al. 2004b, AJ, 127, 1977 [NASA ADS] [CrossRef] [Google Scholar]
- Ojha, R., Fey, A. L., Charlot, P., et al. 2005, AJ, 130, 2529 [NASA ADS] [CrossRef] [Google Scholar]
- Pellegrini, S., Venturi, T., Comastri, A., et al. 2003, ApJ, 585, 677 [NASA ADS] [CrossRef] [Google Scholar]
- Perley, R. A. 1982, AJ, 87, 859 [NASA ADS] [CrossRef] [Google Scholar]
- Perlman, E. S., Padovani, P., Giommi, P., et al. 1998, AJ, 115, 1253 [NASA ADS] [CrossRef] [Google Scholar]
- Peterson, B. A., Jauncey, D. L., Condon, J. J., & Wright, A. E. 1976, ApJ, 207, L5 [NASA ADS] [CrossRef] [Google Scholar]
- Petrov, L., Hirota, T., Honma, M., et al. 2007, AJ, 133, 2487 [NASA ADS] [CrossRef] [Google Scholar]
- Pian, E., Falomo, R., Hartman, R. C., et al. 2002, A&A, 392, 407 [NASA ADS] [CrossRef] [EDP Sciences] [Google Scholar]
- Piner, B. G., Pant, N., & Edwards, P. G. 2008, ApJ, 678, 64 [NASA ADS] [CrossRef] [Google Scholar]
- Preston, R. A., Morabito, D. D., Williams, J. G., et al. 1985, AJ, 90, 1599 [NASA ADS] [CrossRef] [Google Scholar]
- Preston, R. A., Jauncey, D. L., Meier, D. L., et al. 1989, AJ, 98, 1 [NASA ADS] [CrossRef] [Google Scholar]
- Pushkarev, A. B., Kovalev, Y. Y., Lister, M. L., & Savolainen, T. 2009, A&A, 507, L33 [NASA ADS] [CrossRef] [EDP Sciences] [Google Scholar]
- Quintana, H., & Ramirez, A. 1995, ApJS, 96, 343 [NASA ADS] [CrossRef] [Google Scholar]
- Readhead, A. C. S. 1994, ApJ, 426, 51 [Google Scholar]
- Ricci, R., Prandoni, I., Gruppioni, C., et al. 2004, A&A, 415, 549 [NASA ADS] [CrossRef] [EDP Sciences] [Google Scholar]
- Sambruna, R. M., Urry, C. M., Ghisellini, G., & Maraschi, L. 1995, ApJ, 449, 567 [NASA ADS] [CrossRef] [Google Scholar]
- Scarpa, R., Falomo, R., & Pian, E. 1995, A&A, 303, 730 [NASA ADS] [Google Scholar]
- Scarpa, R., Urry, C. M., Falomo, R., & Treves, A. 1999, ApJ, 526, 643 [NASA ADS] [CrossRef] [Google Scholar]
- Schwartz, D. A., Marshall, H. L., Lovell, J. E. J., et al. 2000, ApJ, 540, 69 [Google Scholar]
- Scott, W. K., Fomalont, E. B., Horiuchi, S., et al. 2004, ApJS, 155, 33 [Google Scholar]
- Shen, Z. Q., Wan, T. S., Moran, J. M., et al. 1997, AJ, 114, 1999 [NASA ADS] [CrossRef] [Google Scholar]
- Shen, Z. Q., Hong, X. Y., & Wan, T. S. 1998a, Chinese Astronomy and Astrophysics, 22, 133 [NASA ADS] [CrossRef] [Google Scholar]
- Shen, Z. Q., Wan, T. S., Moran, J. M., et al. 1998b, AJ, 115, 1357 [NASA ADS] [CrossRef] [Google Scholar]
- Shepherd, M. C. 1997, in Astronomical Data Analysis Software and Systems VI, ed. G. Hunt, & H. Payne, ASP Conf. Ser., 125, 77 [Google Scholar]
- Smith, R. J., Lucey, J. R., Hudson, M. J., et al. 2000, MNRAS, 313, 469 [NASA ADS] [CrossRef] [Google Scholar]
- Sowards-Emmerd, D., Romani, R. W., Michelson, P. F., & Ulvestad, J. S. 2004, ApJ, 609, 564 [NASA ADS] [CrossRef] [Google Scholar]
- Stickel, M., Fried, J. W., & Kuehr, H. 1989, A&AS, 80, 103 [Google Scholar]
- Stickel, M., Meisenheimer, K., & Kuehr, H. 1994, A&AS, 105, 211 [Google Scholar]
- Sulentic, J. W., Stirpe, G. M., Marziani, P., et al. 2004, A&A, 423, 121 [NASA ADS] [CrossRef] [EDP Sciences] [Google Scholar]
- Tadhunter, C. N., Fosbury, R. A. E., di Serego Alighieri, S., et al. 1988, MNRAS, 235, 403 [NASA ADS] [Google Scholar]
- Tadhunter, C. N., Morganti, R., di Serego-Alighieri, S., et al. 1993, MNRAS, 263, 999 [NASA ADS] [CrossRef] [Google Scholar]
- Tadhunter, C., Wills, K., Morganti, R., et al. 2001, MNRAS, 327, 227 [NASA ADS] [CrossRef] [Google Scholar]
- Taylor, G. B., Healey, S. E., Helmboldt, J. F., et al. 2007, ApJ, 671, 1355 [NASA ADS] [CrossRef] [Google Scholar]
- Thompson, D. J., Bertsch, D. L., Dingus, B. L., et al. 1993a, ApJ, 415, L13 [NASA ADS] [CrossRef] [Google Scholar]
- Thompson, D. J., Bertsch, D. L., Fichtel, C. E., et al. 1993b, ApJ, 410, 87 [NASA ADS] [CrossRef] [Google Scholar]
- Tingay, S. J., & Edwards, P. G. 2002, AJ, 124, 652 [NASA ADS] [CrossRef] [Google Scholar]
- Tingay, S. J., & de Kool, M. 2003, AJ, 126, 723 [NASA ADS] [CrossRef] [Google Scholar]
- Tingay, S. J., Edwards, P. G., Costa, M. E., et al. 1996a, ApJ, 464, 170 [NASA ADS] [CrossRef] [Google Scholar]
- Tingay, S. J., Jauncey, D. L., Reynolds, J. E., et al. 1996b, AJ, 111, 718 [NASA ADS] [CrossRef] [Google Scholar]
- Tingay, S. J., Jauncey, D. L., Reynolds, J. E., et al. 1997, AJ, 113, 2025 [NASA ADS] [CrossRef] [Google Scholar]
- Tingay, S. J., Jauncey, D. L., Reynolds, J. E., et al. 2000, AJ, 119, 1695 [NASA ADS] [CrossRef] [Google Scholar]
- Tingay, S. J., Reynolds, J. E., Tzioumis, A. K., et al. 2002, ApJS, 141, 311 [NASA ADS] [CrossRef] [Google Scholar]
- Tingay, S. J., Edwards, P. G., & Tzioumis, A. K. 2003a, MNRAS, 346, 327 [NASA ADS] [CrossRef] [Google Scholar]
- Tingay, S. J., Jauncey, D. L., King, E. A., et al. 2003b, PASJ, 55, 351 [NASA ADS] [Google Scholar]
- Tornikoski, M., Jussila, I., Johansson, P., et al. 2001, AJ, 121, 1306 [NASA ADS] [CrossRef] [Google Scholar]
- Tornikoski, M., Lähteenmäki, A., Lainela, M., & Valtaoja, E. 2002, ApJ, 579, 136 [NASA ADS] [CrossRef] [Google Scholar]
- Tosti, G. 2008, The Astronomer's Telegram, 1759, 1 [Google Scholar]
- Tzioumis, A., King, E., Morganti, R., et al. 2002, A&A, 392, 841 [NASA ADS] [CrossRef] [EDP Sciences] [Google Scholar]
- Ulrich, M. H. 1981, A&A, 103, L1 [Google Scholar]
- Venturi, T., Morganti, R., Tzioumis, T., & Reynolds, J. 2000, A&A, 363, 84 [NASA ADS] [Google Scholar]
- Veron-Cetty, M. P., & Veron, P. 2006, VizieR Online Data Catalog, 7248, 0 [Google Scholar]
- Vestrand, W. T., Stacy, J. G., & Sreekumar, P. 1995, ApJ, 454, L93 [NASA ADS] [CrossRef] [Google Scholar]
- von Montigny, C., Bertsch, D. L., Chiang, J., et al. 1995, ApJ, 440, 525 [NASA ADS] [CrossRef] [Google Scholar]
- Wall, J. V. 1994, Austr. J. Phys., 47, 625 [NASA ADS] [Google Scholar]
- Wall, J. V., Danziger, I. J., Pettini, M., et al. 1986, in Quasars, ed. G. Swarup, & V. K. Kapahi, IAU Symp., 119, 59 [Google Scholar]
- Wang, J., Yaqoob, T., Szokoly, G., et al. 2003, ApJ, 590, L87 [NASA ADS] [CrossRef] [Google Scholar]
- Waxman, E. 2007, Science, 315, 63 [NASA ADS] [CrossRef] [PubMed] [Google Scholar]
- White, G. L., Jauncey, D. L., Wright, A. E., et al. 1988, ApJ, 327, 561 [NASA ADS] [CrossRef] [Google Scholar]
- Wills, B. J., Wills, D., Breger, M., et al. 1992, ApJ, 398, 454 [NASA ADS] [CrossRef] [Google Scholar]
- Wills, K. A., Morganti, R., Tadhunter, C. N., et al. 2004, MNRAS, 347, 771 [NASA ADS] [CrossRef] [Google Scholar]
- Wilson, A. S., Young, A. J., & Shopbell, P. L. 2001, ApJ, 547, 740 [NASA ADS] [CrossRef] [Google Scholar]
- Wisotzki, L., Christlieb, N., Bade, N., et al. 2000, A&A, 358, 77 [NASA ADS] [Google Scholar]
- Yaqoob, T., George, I. M., Turner, T. J., et al. 1998, ApJ, 505, L87 [NASA ADS] [CrossRef] [Google Scholar]
- Yaqoob, T., George, I. M., Nandra, K., et al. 1999, ApJ, 525, L9 [NASA ADS] [CrossRef] [PubMed] [Google Scholar]
- Zensus, J. A., Ros, E., Kellermann, K. I., et al. 2002, AJ, 124, 662 [NASA ADS] [CrossRef] [Google Scholar]
Footnotes
- ... USA
![[*]](/icons/foot_motif.png)
- Greg Taylor is also an Adjunct Astronomer at the National Radio Astronomy Observatory.
- ... sources
- See KM3NeT Conceptual Design Report and references therein at http://www.km3net.org/CDR/CDR-KM3NeT.pdf.
- ...
objects
- The candidate EGRET
 -ray blazar 0527-359 was
not observed due to scheduling problems.
-ray blazar 0527-359 was
not observed due to scheduling problems.
- ...
associations
- Abdo et al. (2009a) list three sources below declination -30 degrees and at high galactic latitude |b|>10 degrees, which have no association whatsoever and might be unknown AGNs: 0FGL J 0614.3-3330, 0FGL J 1311.9-3419, and 0FGL J 2241.7-5239. Two sources in this region do have only low-confidence associations with AGN (0FGL J 0407.6-3829 associated with PKS 0405-385 and 0FGL J 0412.9-5341 associated with PMN J 0413-5332).
- ... LBAS
- Below declination
-30 degrees, there are three 3EG sources (Hartman et al. 1999),
which
are not part of the LBAS sample: 0454-463, 1424-418, and 1933-400.
nine other sources associated with lower confidence with EGRET sources
by
Tornikoski et al.
(2002) and Sowards-Emmerd
et al. (2004) have also not been
seen as bright -ray
sources by LAT during its first three
months.
- ... (LBA
- The Long Baseline Array is part of the Australia Telescope which is funded by the Commonwealth of Australia for operation as a National Facility managed by CSIRO.
- ...
 20 c)
20 c)
- For H0=100 and q0=0.5.
- ...(Kedziora-Chudczer 2006)
- The other two strong IDV sources are PKS 1257-326 and J1819+385.
All Tables
Table 1: The long baseline array and affiliated telescopes.
Table 2: Summary of observations.
Table 3: Source list.
Table 4: Source structure.
Table 5: Source structure of tapered images.
Table 6: Distribution of morphology.
Table 7: Opening angles of TANAMI sources.
All Figures
|
|
Figure 1: Contour maps of the 43 TANAMI sources at 8.4 GHz. The scale of each image is in milliarcseconds. The FWHM Gaussian restoring beam applied to the images is shown as a hatched ellipse in the lower left of each panel. Each panel also shows a bar representing a linear scale between 0.1 pc and 100 pc except for the sources without a measured redshift. |
| Open with DEXTER | |
| In the text | |
|
|
Figure 2: Same as Fig. 1. |
| Open with DEXTER | |
| In the text | |
|
|
Figure 3: Same as Fig. 1. |
| Open with DEXTER | |
| In the text | |
|
|
Figure 4: Same as Fig. 1. |
| Open with DEXTER | |
| In the text | |
|
|
Figure 5: Same as Fig. 1. |
| Open with DEXTER | |
| In the text | |
|
|
Figure 6: Same as Fig. 1. |
| Open with DEXTER | |
| In the text | |
|
|
Figure 7: Same as Fig. 1. |
| Open with DEXTER | |
| In the text | |
|
|
Figure 8: Same as Fig. 1. |
| Open with DEXTER | |
| In the text | |
|
|
Figure 9: Tapered contour maps of 13 TANAMI sources at 8.4 GHz revealing more extended emission than visible in the naturally-weighted images. The scale of each image is in milliarcseconds. The FWHM Gaussian restoring beam applied to the images is shown as a hatched ellipse in the lower left of each panel. Each panel also shows a bar representing a linear scale of 10 pc or 100 pc except for the sources without a measured redshift. |
| Open with DEXTER | |
| In the text | |
|
|
Figure 10: Same as Fig. 9. |
| Open with DEXTER | |
| In the text | |
|
|
Figure 11: Same as Fig. 9. |
| Open with DEXTER | |
| In the text | |
|
|
Figure 12: The (u,v)-plane coverage of four sources chosen to span the declination range of the TANAMI targets and thus representative of them. The short baselines near the center of each plot are produced by the telescopes in Australia. The long baselines are furnished by the Hartebeesthoek telescope in South Africa. The ``hole'' in the (u,v)-plane coverage is a result of the absence of any telescopes between Australia and South Africa. Note that Hartebeesthoek is currently out of service and the long baselines are provided by O'Higgins in Antarctica and TIGO in Chile. |
| Open with DEXTER | |
| In the text | |
|
|
Figure 13: Distribution of the redshifts of all TANAMI sources with optical identification shown. |
| Open with DEXTER | |
| In the text | |
|
|
Figure 14: Distribution of the redshifts of the radio-selected sub-sample of TANAMI sources. |
| Open with DEXTER | |
| In the text | |
|
|
Figure 15: Distribution of the redshifts of the EGRET-selected sub-sample of TANAMI sources. |
| Open with DEXTER | |
| In the text | |
|
|
Figure 16: Distribution of the redshifts of all TANAMI sources with LAT detections and non-detections shown. While broadly similar, most galaxies and none of the five most distant sources have been detected yet by the LAT. |
| Open with DEXTER | |
| In the text | |
|
|
Figure 17: Distribution of core brightness temperature of all TANAMI sources with optical identification shown. |
| Open with DEXTER | |
| In the text | |
|
|
Figure 18: Distribution of core brightness temperature of all TANAMI sources with LAT detections and non-detections shown. |
| Open with DEXTER | |
| In the text | |
Copyright ESO 2010
Current usage metrics show cumulative count of Article Views (full-text article views including HTML views, PDF and ePub downloads, according to the available data) and Abstracts Views on Vision4Press platform.
Data correspond to usage on the plateform after 2015. The current usage metrics is available 48-96 hours after online publication and is updated daily on week days.
Initial download of the metrics may take a while.