| Issue |
A&A
Volume 519, September 2010
|
|
|---|---|---|
| Article Number | A117 | |
| Number of page(s) | 12 | |
| Section | Interstellar and circumstellar matter | |
| DOI | https://doi.org/10.1051/0004-6361/200810896 | |
| Published online | 21 September 2010 | |
Accretion-disc model spectra for dwarf-nova stars
I. Idan1 - J.-P. Lasota2,3 - J.-M. Hameury4 - G. Shaviv1
1 - Department of Physics, Technion-Israel Institute of Technology, 32000 Haifa, Israel
2 - Institut d'Astrophysique de Paris, UMR 7095 CNRS, UPMC Univ Paris 06, 98bis Bd Arago, 75014 Paris, France
3 - Astronomical Observatory, Jagiellonian University, ul. Orla 171, 30-244 Kraków, Poland
4 - Observatoire de Strasbourg, CNRS/Université Louis Pasteur, 11 rue de l'Université, 67000 Strasbourg, France
Received 2 September 2008 / Accepted 14 June 2010
Abstract
Context. Radiation from accretion discs in cataclysmic
variable stars (CVs) provides fundamental information about the
properties of these close binary systems and about the physics of
accretion in general. Of particular interest are dwarf-nova outburst
cycles during which variations of the disc properties allow a detailed
study of the physical processes in accretion flows.
Aims. The detailed diagnostics of accretion disc structure can
be achieved by including in its description all the relevant heating
and cooling physical mechanism, in particular the convective energy
transport that, although dominant at temperatures ![]() 104 K,
is usually not taken into account when calculating spectra of accretion
discs. The disc's self-consistently calculated structure and emission
allow testing models of dwarf-nova outbursts and accretion-disc models
in general.
104 K,
is usually not taken into account when calculating spectra of accretion
discs. The disc's self-consistently calculated structure and emission
allow testing models of dwarf-nova outbursts and accretion-disc models
in general.
Methods. We constructed a radiative transfer code coupled with a code determining the disc's hydrostatic vertical structure.
Results. We have obtained for the first time a model spectra of
cold, convective accretion discs. As expected, these spectra are mostly
flat in the optical wavelengths with no contribution from the UV, which
in quiescence must be emitted by the white dwarf. The disc structures
obtained with our radiative-transfer code compare well with the
solutions of equations used to describe the dwarf-nova outburst cycle
according to the thermal-viscous disc instability model thus allowing
the two to be combined. For high-temperature radiative discs our
spectra are compatible with models obtained with Hubeny's code TLUSTY.
Conclusions. Our code allows calculating the spectral evolution
of dwarf nova stars through their whole outburst cycle, providing a new
tool for testing models of accretion discs in cataclysmic variables. We
show that convection plays an important role in determining the
vertical disc structure and substantially affects emitted spectra when,
as often the case, it is effective at optical depths
![]() .
The emergent spectrum is independent of the parameters of the
convection model. We confirm that, as required by the disc instability
model, quiescent discs in dwarf novae must be optically thick in their
outer regions. In general, no emission lines are present in the absence
of external irradiation.
.
The emergent spectrum is independent of the parameters of the
convection model. We confirm that, as required by the disc instability
model, quiescent discs in dwarf novae must be optically thick in their
outer regions. In general, no emission lines are present in the absence
of external irradiation.
Key words: accretion, accretion disks - radiative transfer - stars: dwarf novae
1 Introduction
In most cataclysmic variable stars (CVs) matter lost by the Roche-lobe filling low-mass secondary star forms an accretion disc around the white-dwarf primary. In bright systems such as nova-like stars and dwarf novae in outburst, the disc is the dominant source of luminosity. In quiescent dwarf novae, although rather dim, the disc emission provides crucial information about the physics of accretion discs, in particular about the mechanisms driving the instabilities that are responsible for the dwarf-nova outbursts. It is generally accepted (see, however, Schreiber & Lasota 2007) that properties of the dwarf-nova outburst cycles are reproduced well by the thermal-viscous disc instability model (DIM, see Lasota 2001, for a review), but in reality the description of some phases of theses cycles is far from satisfactory. This is especially true of the quiescence state. Until now models of disc emission spectra have been calculated consistently only for hot, bright accretion discs (see Wade & Hubeny 1998, and references therein). In such a scheme the vertical structure of an accretion ring is calculated using the program TLUSDISK Hubeny (1991,1990), whereas the spectra are synthesized by the code SYNSPEC (Hubeny et al. 1994). A different approach to radiative transfer in accretion discs was presented by Shaviv & Wehrse (1991, hereafter SW), but also in this case it was applied only to hot discs. An attempt to apply the SW code to cold quiescent discs in Idan et al. (1999) was not conclusive.
The main obstacle in solving the vertical structure of cold accretion discs is the presence of convection, which was difficult to include in radiative transfer codes (Hubeny, private communication); models of Wade & Hubeny (1998) are restricted to temperatures for which convection is unimportant. In their pioneering work Pringle et al. (1986) used vertically integrated disc structures and Kurucz's stellar spectra to test the DIM versus the model attributing dwarf-nova outbursts to an increase of mass-transfer rate from the secondary. More recently Kromer et al. (2007, see also Kellermann et al. 2005) have calculated non-LTE accretion-disc spectra throughout the outburst cycle of the dwarf nova SS Cyg, taking into account white-dwarf irradiation. They found that in order to obtain agreement with observations of this system in quiescence one has to assume a radial disc that is optically thin in its outer regions. Such a structure, however, is inconsistent with the DIM. The AcDc NLTE code by Nagel et al. (2004) used to calculate these spectra does not take into account the (often dominant) vertical convective energy transport.
Of related interest are radiative-transfer codes describing emission from cold proto-stellar accretion discs such as Hügelmeyer et al. (2009) and Min et al. (2009). Neither of these codes includes convection.
There is therefore a need for a radiative transfer code consistent with the DIM. This is the main motivation behind the present work. In particular we have obtained a scheme that is totally consistent with the code of Hameury et al. (1998, hereafter HMDLH), which allows following the dwarf-nova spectra during various phases of the outburst with special emphasis put on quiescence. One should stress that the principal aim of our project is testing the DIM, not trying to reproduce the observed spectra of dwarf-nova stars at all costs. In particular our code should allow calculating various delays in rising to (and decaying from) outburst between light at different wavelengths (commonly known a the ``UV-delay'') and determining what properties of the quiescent dwarf-nova disc can be accounted for by the DIM).
The HMDLH
version of the DIM uses a 1+1 D scheme in which the
time-dependent radial evolution equations use as input a
pre-calculated grid of hydrostatic vertical structures. These
structures are calculated using the standard equations of
stellar structure (or the grey-atmosphere approximation in the
optically thin case). The angular-momentum viscous transport
mechanism is described by the ![]() -ansatz of Shakura & Sunyaev (1973).
For a given
-ansatz of Shakura & Sunyaev (1973).
For a given ![]() ,
M/R3 and effective temperature
,
M/R3 and effective temperature
![]() there exists a unique solution describing the disc vertical
structure. Such solutions are very handy for solving the
time-dependent equations of the disc evolution but do not
produce realistic emission spectra. These can be calculated, however, by
using the same input parameters (
there exists a unique solution describing the disc vertical
structure. Such solutions are very handy for solving the
time-dependent equations of the disc evolution but do not
produce realistic emission spectra. These can be calculated, however, by
using the same input parameters (![]() ,
M/R3 and
,
M/R3 and
![]() )
in a radiative-transfer code on the condition that the vertical
structures calculated by the two methods are the same up to the
photosphere. In this way one can reproduce spectra of the whole
cycle of a dwarf-nova outburst.
)
in a radiative-transfer code on the condition that the vertical
structures calculated by the two methods are the same up to the
photosphere. In this way one can reproduce spectra of the whole
cycle of a dwarf-nova outburst.
The outline of the article is as follows. In Sect. 2 we present the model used, with special stress put on marking the differences with the original SW code on which it is based. We discuss there also in details the opacities used. Section 3 is dealing with the solutions obtained for various types of physical set-ups. In this section we compare our vertical structure solutions with those obtained with the HMDLH code for a hot stationary and cold non-stationary discs. These two models represent the main phases of the dwarf-nova outburst cycle respectively: the outburst and quiescence. We compare the corresponding thermal-equilibria (``S-curves'') in Sect. 3.1. The importance of convection in determining the vertical disc structure is discussed in detail in Sect. 3.2.
In Sect. 4 we show our hot whole-disc solutions as examples of spectra emitted during the decay from maximum of a dwarf-nova outburst. We also show that, despite differences in treatment of vertical viscosity stratification our solutions compare very well with the UV spectra obtained by Wade & Hubeny (1998). Then in Sect. 5 we present and discuss the structure and spectrum of cold quiescent accretion disc. Finally we conclude the paper in Sect. 6 by shortly discussing future developments and necessary improvements. A report relating the progress of our work on the radiative-transfer code was published in the conference proceedings Idan et al. (2008). Several solutions presented in this report were only preliminary and have been substantially improved, some results we found to be incorrect. We address these points in the present article.
2 The physical model and basic assumptions
Our model is based on the work of Shaviv & Wehrse (1991). The main improvements consist in using (modern) line opacities and in including the convective energy transport. As far as we know our code is the only working accretion-disc radiative-transfer programme which consistently includes convection. The last improvement allows combining the radiative transfer programme with the DIM code of HMDLH where the time-dependent evolution of dwarf novae is calculated.
2.1 Assumptions
We describe an accretion disc as composed of concentric rings
orbiting the central gravitating body of mass M at a
Keplerian angular speed

The disc is assumed to be geometrically thin, i.e.
where z0 is the disc height. This assumption allows decomposing the disc equations into their vertical and radial components. In this paper we will solve only the vertical accretion-disc equations and obtain the corresponding emission spectra. However, since the radiation of a steady-state accretion disc can be considered as a sum of radiation from individual rings our results can directly applied to such configurations. The same is true for quasi-stationary phases of dwarf-nova outbursts. Also radiation from non-steady quiescent discs of dwarf-nova stars can be treated as being the sum of the emission of individual rings. This is true as long as radial gradients are much smaller than the vertical ones. During the outburst of dwarf nova, when the temperature and density fronts are propagating through the disc this assumption is no longer generally valid. However, since radial gradients are comparable to vertical gradients only in a narrow zone close to the fronts the error on integrated spectra cannot be very large
The disc is assumed to be in a vertical hydrostatic equilibrium and in LTE.
2.2 Equations
The vertical structure of a ring at a distance R from the centre is found by solving the following equations:
- the hydrostatic equilibrium equation
(3)
where P is the total (gas + radiation) pressure; - the energy balance equation
(4)
where is the energy flux in the vertical (z) direction.
We use the
is the energy flux in the vertical (z) direction.
We use the  prescription of Shakura & Sunyaev (1973) to describe
the viscous energy generation
prescription of Shakura & Sunyaev (1973) to describe
the viscous energy generation
Equation (5) defines therefore the stratification of the viscous energy generation; - the radiative energy flux is given by
where J is the mean intensity, B the Planck function and is the monochromatic mass absorption coefficient;
- the radiative transfer equation is
(7)
where I is the intensity, S the source function and is a unit vector in the ray direction. This equation is solved in the two-stream approximation (see Sect. 2.4);
- as in HMDLH, the convective energy flux is calculated by the
method of Paczynski (1969). Whenever the radiative gradient
(8)
is superadiabatic, the temperature gradient of the structure is convective (
 ). The convective gradient is calculated in the mixing length approximation, with the mixing length taken
as H
). The convective gradient is calculated in the mixing length approximation, with the mixing length taken
as H
 ,
where
,
where  is the
pressure scale height:
is the
pressure scale height:
(9)
which ensures that HP is smaller than the vertical scale height of the disc. The convective gradient is found from the relation:
(10)
where is the adiabatic gradient, and Ythe solution of the cubic equation:
(11)
where is the optical depth of
the convective eddies. The coefficient V is given by:
is the optical depth of
the convective eddies. The coefficient V is given by:
(12)
As in HMDLH in our model we take .
.
Here we should mention a caveat. The description of convection used in the present version of the code is not necessarily the correct one as it is not even clear that mixing-length approximation can be applied to turbulent accretion discs. However, in the context of the ``
-disc paradigm'' this is probably the best that
can be done. It is an efficient method of describing an
accretion disc in which most of the vertical energy
transport is not radiative. Finally, as mentioned above,
this treatment of convection is used in the HMDLH code
which is the main reason for using it also in the present
programme. If this approximation is applicable
to accretion discs, there are no indications as to what
the value of
 should be. In solar models values between 1 and 2 are used (see Hameury et al. 1998, and reference therein); in 3.2 we discuss the effect of various values
on the vertical structure;
should be. In solar models values between 1 and 2 are used (see Hameury et al. 1998, and reference therein); in 3.2 we discuss the effect of various values
on the vertical structure;
- the outer boundary condition is
(13)
In the case of a stationary disc
where vr is the radial flow velocity, one has
(15)
but our solutions apply to any distribution of accretion rate in
a geometrically thin accretion disc.
in
a geometrically thin accretion disc.

2.3 Input (opacities and EOS)
Several features of the original SW code have been improved but the use of modern opacities and especially of the line opacities is a major modification we present here in some detail.
There are several ways of calculating opacities. One can either use codes such as PHOENIX (Hauschildt et al. 1999) or ``Atlas 12'' (Kurucz 1992),
or one can use the OPAL database. Our updated version of the SW code
can use the opacities from ``Atlas 12''. However, since
calculating the opacities is time-consuming we decided to use tabulated
data from the Opacity Project (OP) database. To tabulate the data we
used the data from the Opacity Project - ![]() that was downloaded from the website at the Centre
des Donnés de Strasbourg (CDS). For a given abundance
mixture the subroutines mx.f, mixv.f, opfit.f and
mixz.f allowed us (with some modifications) getting the
tabulated opacities for the wavelengths chosen as our basic
grid. For the emerging spectra from every ring we use 10 000 wavelengths starting from 100 Å up to 106 Å. The
grid interval varies between
that was downloaded from the website at the Centre
des Donnés de Strasbourg (CDS). For a given abundance
mixture the subroutines mx.f, mixv.f, opfit.f and
mixz.f allowed us (with some modifications) getting the
tabulated opacities for the wavelengths chosen as our basic
grid. For the emerging spectra from every ring we use 10 000 wavelengths starting from 100 Å up to 106 Å. The
grid interval varies between
![]() Å for
the most important zone such as the range between
850-2300 Å and 1-2 Å used for wavelengths shorter
than 800 Å or above 2300 Å. For wavelengths longer
than 5000 Å,
Å for
the most important zone such as the range between
850-2300 Å and 1-2 Å used for wavelengths shorter
than 800 Å or above 2300 Å. For wavelengths longer
than 5000 Å,
![]() varies logarithmically
starting at 2 Å and getting up to 200 Å for the very
long wavelengths. All data were tabulated using a grid for
the temperature T and electron density
varies logarithmically
starting at 2 Å and getting up to 200 Å for the very
long wavelengths. All data were tabulated using a grid for
the temperature T and electron density ![]() .
The indices
ite and jne are defined by
.
The indices
ite and jne are defined by
| (16) |
The mesh in the tables is calculated for 140<ite<320therefore the lowest temperature that can be used in the code is 3160 K. Let us stress that the opacities in the present work do not take into account the global line broadening due effects such as velocities, expansion opacity (see Shaviv & Wehrse 2005) or microscopic effects such as microturbulence. Consequently, the lines provide only an indication of the presence of a given ion and cannot be used, so far, for abundance determinations etc. These broadenings will be included in the code in the near future.
The reason for allowing the code to work either with OP tabulated
data or with ``Atlas 12'' was to test the tabulated opacities. In
Fig. 1 we show the comparison of opacities as function of wavelength calculated for T=105 K and
![]() g cm-3, and
g cm-3, and
![]() K and
K and
![]() g cm-3
using either ``Atlas 12'' or the OP. The ``Atlas 12''
continuum opacities used were for a solar mixture with the
addition of only H and He lines. The opacities from OP are also for a
mixture of solar abundance (which includes the lines and the
continuum). The result of test shows that tabulated OP opacities are
reliable.
g cm-3
using either ``Atlas 12'' or the OP. The ``Atlas 12''
continuum opacities used were for a solar mixture with the
addition of only H and He lines. The opacities from OP are also for a
mixture of solar abundance (which includes the lines and the
continuum). The result of test shows that tabulated OP opacities are
reliable.
![\begin{figure}
\par\includegraphics[width=8.5cm]{10896fg1a.eps}\\
\includegraphics[width=8.5cm]{10896fg1b.eps}
\vspace*{2mm}
\end{figure}](/articles/aa/full_html/2010/11/aa10896-08/img72.png)
|
Figure 1: Comparison between the
opacities as function of wavelength obtained from ``Atlas 12'' of
Kurucz and those obtain from OP for
|
| Open with DEXTER | |
The two stream approximation contains the scattering coefficient. Following the good agreement obtained between ``Atlas 12'' and OP, the scattering coefficient were calculated from ``Atlas 12'' taking into account scattering from H, He and electrons. One should stress, however, that scattering is not important in CV discs.
The Rosseland mean opacities are taken from OPAL tables for
solar composition. While solving the radiative transfer
equation we checked for the consistency between the Rosseland
mean opacities obtained from the solution of the radiative
transfer equation and the values from the OPAL table. The
equation of state is interpolated from the tables of
Fontaine et al. (1977). The computer programme presented in this
article is able to produce accretion disc models for
temperatures from 3160 to 100 000 K![]() . Consistently with the lower temperature limit we not take into account molecular processes and opacities.
Rayleigh scattering is also neglected. Most of the
reported quiescent dwarf-nova disc effective (colour)
temperatures (
. Consistently with the lower temperature limit we not take into account molecular processes and opacities.
Rayleigh scattering is also neglected. Most of the
reported quiescent dwarf-nova disc effective (colour)
temperatures (![]() 3000 K) justify this assumptions.
3000 K) justify this assumptions.
2.4 The solution method
The basic idea behind the SW original code was to couple the hydrostatic and the radiative transfer equations. To achieve this the programme iterates the two equations at the same time. The iteration is repeated until a structure is found to which both the solutions of the hydrostatic and the radiative transfer equations converge.
The temperature profile is determined from Eq. (6).
The temperature T(z,R) in this equation is solved by
expressing J in terms of B using the radiative transfer
equation (for a detailed description see Wehrse 1981; Kalkofen & Wehrse 1984). As
mentioned above we assumed that each radial ring is independent
of its neighbour rings so we consider a vertical radiative flux
only. The radiative transfer equation is solved in the two
stream approximation. I+ represent the specific
intensity in the outward direction and I- is the specific
intensity in the inward direction. The radiative equation is
therefore written as:

|
= | ||
| (17) |
where
As is now well known, when solving the vertical-structure equations of an accretion disc the main problem is that contrary to the case of stellar atmospheres the exact height of the photosphere is unknown a-priori. Because of the gravity increasing with height, a change in the position of the photosphere is followed by a change of the gravitational acceleration which leads to a change in the entire vertical structure of the disc. One has to remember that the upper part of the disc is optically thin and (depending on the assumptions) may be the site of a non negligible energy production. However, since this optically thin region is a poor radiator and absorber, even a small energy production in this region may have large effect on the final temperature structure.
In view of the above situation we approached the problem in the
following way: we guessed first an initial
temperature-optical depth relation and assumed an initial
height z0. The optical depth (measured vertically from
outside the disc towards the midplane) at the disc's uppermost
point was chosen to be between
10-2-10-6,
and the validity of this assumption was checked once the final
structure was obtained. Using the T(![]() )
relation we can
integrate the hydrostatic equation from z0 down to z=0.
One should emphasize that
)
relation we can
integrate the hydrostatic equation from z0 down to z=0.
One should emphasize that ![]() in the current paper is
calculated using the Rosseland mean opacity and not the optical
depth at 5000 Å as in SW. When the height z0 is the
correct height the total energy generation in the ring
calculated from the energy equation is equal to the total
luminosity of that particular ring. If this were not the case
we were altering the value of z0, keeping the T(
in the current paper is
calculated using the Rosseland mean opacity and not the optical
depth at 5000 Å as in SW. When the height z0 is the
correct height the total energy generation in the ring
calculated from the energy equation is equal to the total
luminosity of that particular ring. If this were not the case
we were altering the value of z0, keeping the T(![]() )
relation fixed, until the energy condition was satisfied. Once
this iteration converged the hydrostatic model was
consistent with the energy generation but not yet with the
radiation field.
)
relation fixed, until the energy condition was satisfied. Once
this iteration converged the hydrostatic model was
consistent with the energy generation but not yet with the
radiation field.
|
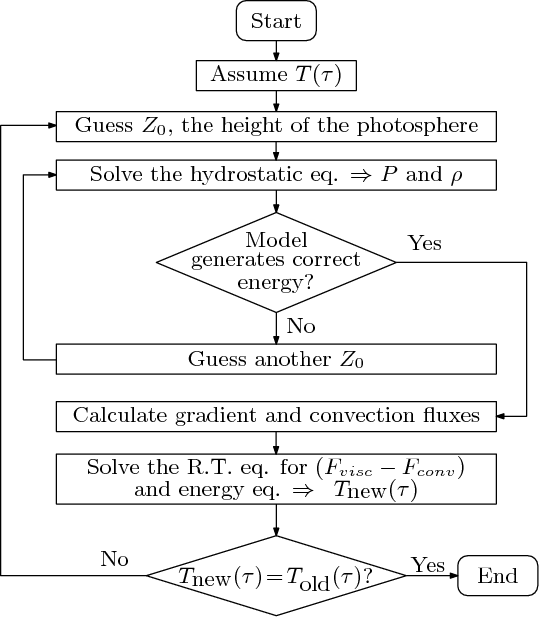
Figure 2: The iteration scheme. |
| Open with DEXTER | |
We then turned to solving the radiative transfer equation using the
disc height, the pressure and the density structure obtained from the
hydrostatic iteration. This structure was kept fixed during the
iteration for the radiative field. The first step in solving the
radiative transfer equation is to calculate the convection. For each
grid point we calculated the convective flux. If the convective flux
was dominant (more than 80% of the viscous flux) - the temperature
was determined by the adiabatic gradient. In the opposite case the
convective flux was subtracted from
the total (viscous) flux and the solution of the radiative transfer
equation for the remaining flux, yielded a new ![]() relation. The temperature profile was assigned new values for the old values of optical depth. If the new
relation. The temperature profile was assigned new values for the old values of optical depth. If the new ![]() profile from the radiative iteration agreed (to a chosen degree of accuracy; usually 0.5%) with the old
profile from the radiative iteration agreed (to a chosen degree of accuracy; usually 0.5%) with the old ![]() relation from the hydrostatic iteration, the hydrostatic structure was
consistent with the radiation field. If not, we iterated again the hydrostatic equation using the new
relation from the hydrostatic iteration, the hydrostatic structure was
consistent with the radiation field. If not, we iterated again the hydrostatic equation using the new ![]() relation.
relation.
![\begin{figure}
\par\includegraphics[width=8.5cm]{10896fg3.eps}
\vspace*{2mm}
\end{figure}](/articles/aa/full_html/2010/11/aa10896-08/img84.png)
|
Figure 3:
Variation of the temperature-optical depth profile during the iteration to the converged
solution (
|
| Open with DEXTER | |
In Fig. 3 we show how the temperature
profile changes during the iteration for a cold accretion disc.
In this case the convergence was obtained after 7 iterations.
One has to remember that since the location of the photosphere
is unknown at the beginning of the iteration we must iterate
for it so as to satisfy the energy conservation condition.
The initial temperature optical-depth profile is a priori unknown
and we guess a certain ![]() law. This
law. This ![]() might change
dramatically after the first iteration but afterward quickly converges to the correct solution.
might change
dramatically after the first iteration but afterward quickly converges to the correct solution.
To summarize we have four basic iteration loops in the code
(see Fig. 2):
- 1.
- Calculating the hydrostatic structure using a given
 relation.
The output results are disc height, pressure and density structure.
relation.
The output results are disc height, pressure and density structure.
- 2.
- Calculating the convective flux using the structure of the hydrostatic structure and subtracting it from the total flux.
- 3.
- Solving the radiative transfer for a given disc height, P and
 .
The output result is a new
relation.
.
The output result is a new
relation.
- 4.
- Repeating the previous two iteration until the
relation
from the hydrostatic part is in agreement with the
relation from the radiative
transfer equation.
Once lines opacities are included in the code the calculation of the spectrum must be done with a much finer grid. The contribution of the lines to the total energy budget in the disc when solving the radiative transfer equation is negligible. Therefore 100 grid points can be used to obtain the convergence of the hydrostatic and radiative transfer equations. However, for the calculation of the emergent spectrum we interpolate between the 100 vertical grid points to up to 500 points in order to get better accuracy. In a recent progress report (Idan et al. 2008) we announced the presence of emission lines in the spectrum, unfortunately this was an artefact of using only 100 grid points in the calculation. Once a finer grid was used, the alleged lines disappeared. This just indicates the importance of the accuracy in calculations of the spectra.
The entire disc is divided into a series of concentric rings
and their width is determined according to their distance from
the WD. All rings which are further away than
![]() are
assumed to have a width of
are
assumed to have a width of
![]() ,
below
,
below
![]() the width of the ring is taken to be
the width of the ring is taken to be
![]() ,
which allow us a detailed
calculation of the emission of the rings near the boundary
layer.
,
which allow us a detailed
calculation of the emission of the rings near the boundary
layer.
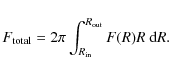
The above procedure is repeated for each ring. The emerging
fluxes from the rings are then integrated in order to get the total
flux from the entire
disc according to:
Since the radiative transfer equation is solved in the two-stream approximation the resulting spectrum does not include the effect of limb darkening. The angle dependence will be added to our code in a future paper through a SYNSPEC-type code. In the present article, however, we will show spectra convolved with an instrumental profile in the manner of the ROTIN
2.5 The disc instability model
Since the main objective of our work is obtaining a tool allowing tests of the dwarf-nova Disc Instability Model (DIM; see Lasota 2001, for a review) we will briefly recall its main tenets that are relevant to the present work.
In the DIM the dwarf-nova outbursts are attributed to a
thermal-viscous instability appearing when the effective temperatures
are contained between
![]() K (these critical temperatures depend
only very weakly on the other disc parameters). Therefore stationary discs with effective temperatures
in this range do not exist in the Universe. When the rate at which a disc is fed with matter corresponds to
an unstable configuration the result is an outburst cycle during which the disc oscillates between the hot and cold
(quiescent) states. Outbursts are triggered by heating fronts propagating up (inside-out) or down (outside-in)
the surface-density gradients. During the rise of the outburst the disc is hot downstream and cold upstream
of the front. Finally, at maximum most of the disc is brought to
a hot quasi-stationary state with the characteristic
K (these critical temperatures depend
only very weakly on the other disc parameters). Therefore stationary discs with effective temperatures
in this range do not exist in the Universe. When the rate at which a disc is fed with matter corresponds to
an unstable configuration the result is an outburst cycle during which the disc oscillates between the hot and cold
(quiescent) states. Outbursts are triggered by heating fronts propagating up (inside-out) or down (outside-in)
the surface-density gradients. During the rise of the outburst the disc is hot downstream and cold upstream
of the front. Finally, at maximum most of the disc is brought to
a hot quasi-stationary state with the characteristic
![]() profile. A cooling front (always outside-in) brings the disc back to
the cold (quiescent) state through a sequence of quasi-stationary
configurations with decreasing accretion rates. In quiescence
the effective temperature is everywhere lower than characteristic
temperature (Eq. (22)) and is roughly constant
with radius (as conformed by observations, see e.g. Froning et al. 1999).
On the other hand the surface-density and the accretion rate strongly
increase with radius (in quiescence the disc
is filling up). The fact that spectra of quiescent dwarf-novae
cannot be fitted with constant accretion-rate disc models is
confirmation of this prediction of the model. All the phases of the
outburst cycle have characteristic spectral signatures.
profile. A cooling front (always outside-in) brings the disc back to
the cold (quiescent) state through a sequence of quasi-stationary
configurations with decreasing accretion rates. In quiescence
the effective temperature is everywhere lower than characteristic
temperature (Eq. (22)) and is roughly constant
with radius (as conformed by observations, see e.g. Froning et al. 1999).
On the other hand the surface-density and the accretion rate strongly
increase with radius (in quiescence the disc
is filling up). The fact that spectra of quiescent dwarf-novae
cannot be fitted with constant accretion-rate disc models is
confirmation of this prediction of the model. All the phases of the
outburst cycle have characteristic spectral signatures.
![\begin{figure}
\par\includegraphics[width=8.5cm,clip]{10896fg4.eps}
\end{figure}](/articles/aa/full_html/2010/11/aa10896-08/img93.png)
|
Figure 4:
|
| Open with DEXTER | |
Locally (for a given ring), for a given set of parameters (white-dwarf
mass, viscosity parameter) the disc equilibria form an S-shaped curve
on the
![]() plane (see Fig. 4).
During the decay from maximum the surface density and effective
temperature of the hot parts of the disc decrease along the upper
branch of the S-curve until they reach the critical value below which
no stationary solution exists. The value of the critical
surface-density
plane (see Fig. 4).
During the decay from maximum the surface density and effective
temperature of the hot parts of the disc decrease along the upper
branch of the S-curve until they reach the critical value below which
no stationary solution exists. The value of the critical
surface-density

implies that the outer disc in quiescence must be optically thick; especially that after leaving the upper branch its surface density increases before it settles on the lower (cold) branch of the S-curve. Therefore observations and spectral models that requires an optically thin quiescent outer disc in dwarf-nova stars contradict the DIM (see Sect. 5).
3 Single-ring calculations
3.1 The S-curves
Since we intend to calculate spectra of disc states given by the time dependent code of HMDLH we checked that the vertical structures calculated by the two codes are sufficiently close for the whole procedure to make sense.
The principal difference between the two calculated disc structures
is their heights. In the HMDLH case the boundary condition is fixed at ![]() whereas in ILHS it is given by
whereas in ILHS it is given by
![]() (
(![]() 10-2-10-6).
10-2-10-6).
The best way of comparing the two structure is by plotting the thermal equilibria obtained by the two methods.
As mentioned above (Sect. 2.5), in the
![]() plane they form an S-shaped curve. Figure 4 shows
an example of
plane they form an S-shaped curve. Figure 4 shows
an example of
![]() S-curves obtained by the HMDLH and ILHS codes for
S-curves obtained by the HMDLH and ILHS codes for
![]() at a radius of
at a radius of
![]() (we used the white-dwarf mass-radius relation of Nauenberg 1972).
Each point on the S-curve represents a thermal-equilibrium state of the
accretion disc at that radius. The upper branch of the S-curve
corresponds to hot stable solutions, while the lower branch where the
temperature is below
(we used the white-dwarf mass-radius relation of Nauenberg 1972).
Each point on the S-curve represents a thermal-equilibrium state of the
accretion disc at that radius. The upper branch of the S-curve
corresponds to hot stable solutions, while the lower branch where the
temperature is below ![]() 6000 K, represents cold, stable configurations. The middle branch of the S-curve contains thermally unstable equilibria.
6000 K, represents cold, stable configurations. The middle branch of the S-curve contains thermally unstable equilibria.
The agreement between the results of the two codes is very good on both branches of the S-curve. On top of the changes in the
opacities due to the hydrogen ionization, the disc close to the
turning knees of the S-curve (the unstable zone) is fully
convective (see Fig. 4).
We were unable to calculate the unstable branch with our radiative
transfer equation code. This is of not much
importance as the equilibrium states represented by the middle
branch are physically meaningless. However, we were also unable to
obtain the convection-dominated disc vertical structures between
![]() and the critical hot-branch temperature
and the critical hot-branch temperature ![]()
![]() since not enough radiative flux was left to use in the transfer code.
This is a more serious drawback which somewhat limits the code's
application. We are working on trying to fix this problem.
since not enough radiative flux was left to use in the transfer code.
This is a more serious drawback which somewhat limits the code's
application. We are working on trying to fix this problem.
On the hot branch, for
![]() the convective flux transports
the convective flux transports ![]() 100% of the flux. Configurations with temperatures down to
100% of the flux. Configurations with temperatures down to
![]() K are also convection dominated. For example at
K are also convection dominated. For example at
![]() ,
for 5000 K 70% of the disc vertical extent is convective and convection still transports
,
for 5000 K 70% of the disc vertical extent is convective and convection still transports ![]() 100% of the flux. For effective temperature of 4000 K 35% of the disc has a
convective flux which represent 60% of the total flux.
100% of the flux. For effective temperature of 4000 K 35% of the disc has a
convective flux which represent 60% of the total flux.
The difference between the values of
![]() (the
maximum surface density on the lower branch) calculated by the
two codes is about 2%.
(the
maximum surface density on the lower branch) calculated by the
two codes is about 2%.
The excellent agreement between the low-temperature solutions calculated by the two methods shows that molecular opacities do not affect the disc structure: they are taken into account in HMDLH, but not in our code.
3.2 The effect of convection
The discussion in the preceding subsection suggest that the effects of convection are worth a closer look.
![\begin{figure}
\par\includegraphics[width=8.8cm]{10896fg5.eps}
\end{figure}](/articles/aa/full_html/2010/11/aa10896-08/img110.png)
|
Figure 5: The total (viscous) flux
and the convective flux (dashed line) as function of the total optical
depth calculated for a cold disc with
|
| Open with DEXTER | |
![\begin{figure}
\par\includegraphics[width=8.5cm]{10896fg6a.eps}\\
\includegraphics[width=8.5cm]{10896fg6b.eps}\vspace*{2mm}
\end{figure}](/articles/aa/full_html/2010/11/aa10896-08/img112.png)
|
Figure 6:
Comparison between the temperature profiles for models with and without convection for cold disc at
|
| Open with DEXTER | |
At temperatures corresponding to hydrogen recombination convection
begins to play an important role in the vertical energy transport.
Therefore at these and lower temperatures it must be taken into account
when determining the vertical structure of accretion discs. In
Figs. 5 and 6 we present the vertical structure of a disc ring with effective temperature of 5000 K and
![]() at a distance of
at a distance of
![]() .
Convection dominates the inner (close to midplane) part of the disc up to
.
Convection dominates the inner (close to midplane) part of the disc up to
![]() .
(At
.
(At
![]() K the convection zone reaches
K the convection zone reaches
![]() ).
).
Figure 6
exhibits the influence of convection on the temperature profile. Once
convection is included the vertical structure becomes cooler and
denser. Therefore the disc is becoming optically thicker - for the
model shown here the optical depth changes from
![]() without convection, to almost
without convection, to almost
![]() ,
when the latter is included.
,
when the latter is included.
Therefore effects of convection noticeably affect the emerging spectrum. According to Fig. 6 at ![]() the temperature of a convection dominated disc is 1000 K cooler
than a radiative disc with the same effective temperature. The
different temperature structure implies therefore different emergent
spectra. Figure 7 presents the differences between the corresponding disc spectra obtained with and without convection.
the temperature of a convection dominated disc is 1000 K cooler
than a radiative disc with the same effective temperature. The
different temperature structure implies therefore different emergent
spectra. Figure 7 presents the differences between the corresponding disc spectra obtained with and without convection.
The calculations presented in this paper do not include disc irradiation by the white dwarf and boundary layer. In principle, by heating up the disc surface irradiation may reduce the effects of convection (see e.g. Hameury et al. 1999). However, in practice, only the innermost regions of a quiescent dwarf-nova disc will be strongly modified by irradiation (Hameury et al. 1999), the rest of the disc being only weakly modified especially that the optical depth increases with radius. There irradiation might affect the spectrum by producing emission lines (Smak 1991).
![\begin{figure}
\par\includegraphics[width=8.5cm]{10896fg7.eps}
\vspace*{2mm}
\end{figure}](/articles/aa/full_html/2010/11/aa10896-08/img120.png)
|
Figure 7:
Comparison between the fluxes for models with and without convection for a cold disc at
|
| Open with DEXTER | |
As stated in the previous section we choose
![]() in order to compare
our results to those of HMDLH. In order to see how the disc structures and the emerging spectra are affected by varying
the mixing length parameter, we solved the equations assuming the two values delimiting the range allowed by solar type stars (Demarque & Guenther 1991; Guzik & Lebreton 1991). Figure 8 shows the vertical structures of a
in order to compare
our results to those of HMDLH. In order to see how the disc structures and the emerging spectra are affected by varying
the mixing length parameter, we solved the equations assuming the two values delimiting the range allowed by solar type stars (Demarque & Guenther 1991; Guzik & Lebreton 1991). Figure 8 shows the vertical structures of a
![]() K ring at
K ring at
![]() for
for
![]() and 2. As
and 2. As
![]() decreases convection becomes less efficient and the temperature therefore increases. Changing
decreases convection becomes less efficient and the temperature therefore increases. Changing
![]() will affect the S-curves (discussed in the next
section). However, since changes in the upper part of the disc due to changes in
will affect the S-curves (discussed in the next
section). However, since changes in the upper part of the disc due to changes in
![]() are minor (Fig. 8 bottom), the emerging spectrum is hardly affected by the assumed value of the mixing-length parameter.
are minor (Fig. 8 bottom), the emerging spectrum is hardly affected by the assumed value of the mixing-length parameter.
![\begin{figure}
\par\includegraphics[width=8.6cm]{10896fg8a.eps}\\
\includegraphics[width=8.6cm]{10896fg8b.eps}
\vspace*{2mm}
\end{figure}](/articles/aa/full_html/2010/11/aa10896-08/img125.png)
|
Figure 8:
The vertical temperature structure for
|
| Open with DEXTER | |
4 Full disc emission
4.1 Solutions at high accretion rate ( = 0.3)
![\begin{figure}
\par\includegraphics[width=8.6cm,clip]{10896fg9a.eps}
\includegraphics[width=8.6cm,clip]{10896fg9b.eps}\vspace*{2mm}
\end{figure}](/articles/aa/full_html/2010/11/aa10896-08/img129.png)
|
Figure 9:
The full disc spectra for three values of accretion rates and outer radii corresponding to the decay from outburst.
|
| Open with DEXTER | |
As recalled in Sect. 2.5,
during the dwarf-nova outbursts accretion discs decay from maximum
through a sequence of hot configurations with decreasing accretion rate
and outer radii (see e.g. Fig. 5 in Hameury et al. 1998). Spectra of three such configurations are shown in Fig. 9 where
![]() have been assumed. The disc is seen face-on (i=0o) and the white-dwarf spectrum has not been added.
The configurations correspond to three values of the accretion rate:
have been assumed. The disc is seen face-on (i=0o) and the white-dwarf spectrum has not been added.
The configurations correspond to three values of the accretion rate:
![]() (maximum temperature
(maximum temperature
![]() ,
,
![]() K respectively). The outer radii correspond to the position of the cooling front, i.e. to the radius where
K respectively). The outer radii correspond to the position of the cooling front, i.e. to the radius where
![]() .
Here we chose 35, 14 and 3
.
Here we chose 35, 14 and 3
![]() (
(
![]() ,
,
![]() and
and
![]() cm).
cm).
![\begin{figure}
\par\includegraphics[width=8.6cm]{10896fg10.eps}\vspace*{2mm}
\end{figure}](/articles/aa/full_html/2010/11/aa10896-08/img139.png)
|
Figure 10:
Rest frame spectra (black) and spectra shown after convolution (red) with a Gaussian instrumental profile
(see text for details). The parameters are the same as in Fig. 9 for
|
| Open with DEXTER | |
In all these spectra one can identify the Balmer lines (at
![]() ,
,
![]() ,
4340 Å, 4860 Å, 6560 Å) as well as the Paschen series and the Lyman lines.
,
4340 Å, 4860 Å, 6560 Å) as well as the Paschen series and the Lyman lines.
Until now we have presented unconvolved ``raw spectra'' to show the direct output of the radiative transfer calculation. Figure 10 shows the comparison between the rest- frame spectra of an accretion disc in the UV part of the wavelengths and the same spectrum convolved with a Gaussian instrumental profile having a FWHM of 1 Å sampled every 0.15 Å.
4.2 Comparison with the Wade and Hubeny (1998) accretion disc spectra
Wade & Hubeny (1998, hereafter WH) calculated with TLUSTDISK and SYNSPEC a large grid of far- and mid-ultraviolet spectra (850-2000 Å) of the integrated light from steady-state accretion discs in bright cataclysmic variables. These data have being used extensively in the recent years for studying the observed accretion disc spectra. In WH model the disc spectra are calculated in four steps. In the first step they calculate the vertical structure of concentric annuli, with each annulus behaving as an independent plane-parallel radiating slab. The energy balance is enforced between radiative losses at the disc surface and heat generation due to viscosity. Once the vertical structure of the annuli is obtained, the radiative transfer equation is solved to compute the local, rest-frame spectrum for each ring of the disc. In the third stage the rest-frame intensities are combined to generate an integrated disc spectrum, and in the fourth stage the monochromatic fluxes are convolved with a Gaussian instrumental broadening function and then re-sampled uniformly in wavelength. All the published WH models are for disc atmospheres which are optically thick and are viewed from a distance of 100 pc.
Wade & Hubeny (1998) also studied the effect of different instrumental resolutions (Gaussian FWHM = 0.1, 1.0 and 3.5 Å) of the UV spectrum. The FWHM = 0.1 Å corresponds to the resolution of the FUSE spectrometers whereas 3.5 Å corresponds to the HUT spectrometer. According to Wade & Hubeny (1998) the differences between the 0.1 Å and 1 Å were barely noticeable, and they applied a FWHM of 1 Å for their calculations. Having confirmed their results we also have chosen instrumental broadening with FWHM=1 Å.
Figure 11 shows a comparison between the
Wade & Hubeny (1998) accretion discs spectra (model cc and model y)
and the spectra obtained with the present ILHS programme. The
model parameters are: Model cc -
![]() and
and
![]() and for model y
-
and for model y
-
![]() and
and
![]() .
We used the same number of rings.
.
We used the same number of rings.
The difficulty with comparing the two schemes lies in the formulation of the viscosity prescription. We are using the ![]() prescription whereas
WH define the viscosity coefficient through the value of the Reynolds number of the flow,
the vertical stratification being controlled by a parameter
prescription whereas
WH define the viscosity coefficient through the value of the Reynolds number of the flow,
the vertical stratification being controlled by a parameter
![]() (Kriz & Hubeny 1986). The relation between the two parameterizations of disc viscosity is rather complicated and non-local (see Kromer et al. 2007; Hubeny & Hubeny 1998).
The relation between the viscosity parameter
(Kriz & Hubeny 1986). The relation between the two parameterizations of disc viscosity is rather complicated and non-local (see Kromer et al. 2007; Hubeny & Hubeny 1998).
The relation between the viscosity parameter ![]() and the Reynolds number
and the Reynolds number ![]() of Kriz & Hubeny (1986) can be written as
of Kriz & Hubeny (1986) can be written as

where

to be compared with the ansatz
We estimated that our
![]() should be roughly equivalent to the Re=5000 and
should be roughly equivalent to the Re=5000 and ![]() of WH but the correspondence between the two different descriptions of
the viscosity mechanisms is not exact. Despite of that the two spectra
are very similar and the small differences are in practice difficult to
pinpoint. The comparison of the two methods presented in Idan et al. (2008) showed a rather serious difference around 1300 Å: a clear absorption feature seen in Wade & Hubeny (1998)
was missing in ILHS. After a careful study of both the code and the OP
database we arrived to the conclusion that there is an error in the
opacity data (silicon lines misplaced). This has been confirmed and
corrected by Delahaye (private communication). Spectra in Fig. 11
have been calculated with the corrected opacity tables. Now both
spectra show an absorption feature at 1300 Å. The remaining
differences most probably are due to the differences in the
parametrization (and stratification) of viscosity.
of WH but the correspondence between the two different descriptions of
the viscosity mechanisms is not exact. Despite of that the two spectra
are very similar and the small differences are in practice difficult to
pinpoint. The comparison of the two methods presented in Idan et al. (2008) showed a rather serious difference around 1300 Å: a clear absorption feature seen in Wade & Hubeny (1998)
was missing in ILHS. After a careful study of both the code and the OP
database we arrived to the conclusion that there is an error in the
opacity data (silicon lines misplaced). This has been confirmed and
corrected by Delahaye (private communication). Spectra in Fig. 11
have been calculated with the corrected opacity tables. Now both
spectra show an absorption feature at 1300 Å. The remaining
differences most probably are due to the differences in the
parametrization (and stratification) of viscosity.
![\begin{figure}
\par\includegraphics[width=8cm,clip]{10896fg11a.eps}
\includegraphics[width=8cm,clip]{10896fg11b.eps}\vspace*{1mm}
\end{figure}](/articles/aa/full_html/2010/11/aa10896-08/img156.png)
|
Figure 11:
Comparison with spectra calculated by (Wade & Hubeny 1998). Model cc ( upper panel) and model y ( lower panel) are compared with ILHS spectra calculated for
|
| Open with DEXTER | |
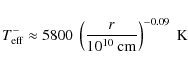
5 Cold, quiescent dwarf-nova disc
According to the disc instability model, the disc in the
quiescent phase of the dwarf-nova outburst is characterized by
a low ![]() and a low (quasi-constant) effective temperature. The effective
temperature in the entire disc must be lower than the critical
value (see Lasota 2001)
and a low (quasi-constant) effective temperature. The effective
temperature in the entire disc must be lower than the critical
value (see Lasota 2001)
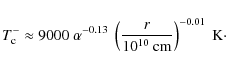
and the critical midplane temperature in the quiescent state must be lower than
Both observations and models show that for most of the quiescence duration the effective temperature profile is roughly parallel to the critical one. Therefore as examples of spectra of quiescent dwarf-nova disc we calculated models with constant (with radius) effective temperature. In such non-equilibrium discs accretion rate is not constant but increases strongly (
Let us stress that low values of ![]() (
(![]() 0.03) in quiescence
are an essential ingredient of the DIM. This is because observations fix the value of the hot disc
0.03) in quiescence
are an essential ingredient of the DIM. This is because observations fix the value of the hot disc
![]() to
to ![]() 0.2 (Smak 1999) and
0.2 (Smak 1999) and
![]() is
required since otherwise the model produces no dwarf-nova outbursts.
Since according to the DIM the values of the critical surface densities
(see Eq. (19)) are rather high and the values of
is
required since otherwise the model produces no dwarf-nova outbursts.
Since according to the DIM the values of the critical surface densities
(see Eq. (19)) are rather high and the values of ![]() in quiescence must be rather low, the model requires quiescent discs to be optically thick, especially in their outer regions.
in quiescence must be rather low, the model requires quiescent discs to be optically thick, especially in their outer regions.
On this subject observations are at best ambiguous. For example, according to Littlefair et al. (2001) (confirmed by Copperwheat et al. 2009) optical observations of the quiescent dwarf nova IP Peg seem to suggest that the outer part of the disc in this system is optically thin. On the other hand Ribeiro et al. (2007) find that infrared observations imply an optically thick outer disc. On the other hand practically all observed dwarf-novae in quiescence have flat radial-temperature (<5000 K) profiles and strongly inward-decreasing accretion rate (Froning et al. 1999; Wood et al. 1989,1986) in excellent agreement with the prediction of the DIM. The presence of strong emission lines is not an evidence for the optical thinness of the disc (Smak 1991) since they can be produced in a chromosphere above the disc. Also, as suggested by Vrielmann et al. (2002), the quiescent disc could be clumpy, with optically thin patches interspersed among optically thick gruels. In addition IP Peg shows strong emission lines also in outburst (Marsh & Horne 1990). The whole subject is therefore rather controversial (``based on current knowledge of such discs, optically thick regions might or might not be present'', according to Hynes et al. 2005) so that it is clearly very important to be able to model correctly and consistently the emission spectra of quiescent dwarf novae if one wishes to solve this fundamental problem.
Here we present the first spectra calculated for self-consistent cold disc structures with
![]() and a constant effective
temperature of 5000 and 3500 K (The second value corresponds to IP Peg in quiescence according to Ribeiro et al. 2007). The outer radius in the model was assumed to be
and a constant effective
temperature of 5000 and 3500 K (The second value corresponds to IP Peg in quiescence according to Ribeiro et al. 2007). The outer radius in the model was assumed to be
![]() .
.
The 5000 K quiescent disc is everywhere optically
thick (Fig. 12); the optical depth in the outer regions reaching 106.
The disc is everywhere convection dominated. As shown above, the
convective flux determines the vertical structure of cold accretion
discs and obviously cannot be ignored through the part of the disc
where the optical depth is larger than 5-10. The 3500 K disc is
optically thin in its innermost regions but starting from ![]()
![]() the optical depth
the optical depth ![]() and reaches 104 at the outer edge.
and reaches 104 at the outer edge.
![\begin{figure}
\par\includegraphics[width=8.6cm]{10896fg12.eps}
\end{figure}](/articles/aa/full_html/2010/11/aa10896-08/img167.png)
|
Figure 12:
The optical depth as function of the disc radii for disc models with
|
| Open with DEXTER | |
![\begin{figure}
\par\includegraphics[width=8.6cm]{10896fg13.eps}
\end{figure}](/articles/aa/full_html/2010/11/aa10896-08/img168.png)
|
Figure 13:
The disc height at optical depth of 10-3 (solid line) and the height of the convection zone (dashed line)
for two values of effective temperatures
|
| Open with DEXTER | |
The total fluxes obtained for cold discs with an outer radius of
![]() are shown in Figs. 14 and 15. The spectra in the range of
3000-10 000 Å are nearly flat as observed and no Balmer jump
is present. As expected there is no significant contribution from the
disc to the UV band. The 3500 K shows a Brackett jump in
absorption, except for case when radiation comes from the innermost
disc regions only; then the jump is in emission and weak emission lines
are present in its vicinity. This reflects obviously the optical
thinness of these regions but is unlikely to have observable
consequences.
are shown in Figs. 14 and 15. The spectra in the range of
3000-10 000 Å are nearly flat as observed and no Balmer jump
is present. As expected there is no significant contribution from the
disc to the UV band. The 3500 K shows a Brackett jump in
absorption, except for case when radiation comes from the innermost
disc regions only; then the jump is in emission and weak emission lines
are present in its vicinity. This reflects obviously the optical
thinness of these regions but is unlikely to have observable
consequences.
As mentioned above quiescent dwarf nova spectra often show strong and broad hydrogen and helium emission lines. The spectrum supposed to represent a cold dwarf-nova disc in Fig. 14 has only absorption line. The temperature in the photosphere of the cold disc are too low to produce emission lines. (As mentioned above, the emission lines we reported in Idan et al. 2008, were an artefact of insufficient resolution of the computational grid).
For low ![]() s we were unable to produce a ``corona'' by the Shaviv & Wehrse (1986) instability. Apparently heating was always compensated by cooling even
high in the disc atmosphere.
Therefore it seems that to obtain emission lines one should take
into account the effect of irradiation by the white dwarf
(as suggested by Smak 1991).
s we were unable to produce a ``corona'' by the Shaviv & Wehrse (1986) instability. Apparently heating was always compensated by cooling even
high in the disc atmosphere.
Therefore it seems that to obtain emission lines one should take
into account the effect of irradiation by the white dwarf
(as suggested by Smak 1991).
![\begin{figure}
\par\includegraphics[width=8.6cm,height=4.6truecm]{10896fg14a.eps}
\includegraphics[width=8.6cm]{10896fg14b.eps}
\vspace*{2mm}
\end{figure}](/articles/aa/full_html/2010/11/aa10896-08/img173.png)
|
Figure 14:
The integrated disc spectrum as function of the outer disc radius for cold discs with
|
| Open with DEXTER | |
![\begin{figure}
\par\includegraphics[width=8.6cm]{10896fg15.eps}
\end{figure}](/articles/aa/full_html/2010/11/aa10896-08/img175.png)
|
Figure 15:
The integrated disc spectrum for two low values of
|
| Open with DEXTER | |
6 Conclusions
We have constructed a numerical code solving radiative transfer in
accretion discs for a range of effective temperatures reaching values
as low as 3000 K. As far as we know, our code is the only one
taking into account convective energy transport, including the cases
when convection is dominating the energy transport.
At high temperatures, in the case of fully radiative accretion discs,
our spectra are in a very satisfactory agreement with the calculations
of Wade & Hubeny (1998) despite the different viscosity prescriptions respectively used. The ![]() -viscosity prescription of our code is
used in the Disc Instability Model and in general to characterize the structure of accretion discs.
-viscosity prescription of our code is
used in the Disc Instability Model and in general to characterize the structure of accretion discs.
Although our code includes convective energy transport it fails to account for important effects that have been successfully taken into account by other authors. For example we assume LTE, whereas the AcDC code (Nagel et al. 2004) describes the NLTE structures. These different approaches are therefore only milestones on the road towards a complete description of accretion disc emission. Unfortunately the main obstacle one will have to overcome is the persisting lack of a reliable description of the disc's ``viscosity'' stratification.
Our code has been designed to work in synergy with the DIM code of HMDLH. This goal has been achieved for most of the range of the relevant parameters. We find, in agreement with the predictions of the DIM, that quiescent dwarf-nova discs must be optically thick. In absence of spontaneously formed disc corona emission lines observed in quiescent dwarf-novae have to be the result of irradiation by the white dwarf (and the boundary layer) of an optically thick disc as suggested by Smak (1991).
In a subsequent article we will include the effects of limb darkening and produce a grid of disc spectra to be compared with observations of various types of cataclysmic variables and various phases of the dwarf-nova outburst cycle. In particular we will focus on the quiescence discs and the effect of the irradiation by the white dwarf and the formation of emission lines. Combining ILHS with the time dependent HMDLH code will provide a tool for the study of dwarf nova outburst cycles.
In particular it will be possible to compare observed quiescent dwarf nova spectra with the model spectra of cold non-equilibrium accretion discs and hot white dwarfs, instead of assuming (as in e.g. Urban & Sion 2006, and references therein) that the disc in such a state is hot and in equilibrium.
The structure of our code allows easy inclusion of various tabulated opacity data. In a future work we plan calculating spectra of helium discs and very cold discs in which molecular opacities are important.
We thank Franck Delahaye and Claude Zeippen for their valuable help with the OP opacities. We will miss the enlightening discussions with our late friend Reiner Wehrse and his always valuable suggestions. Discussions with Ivan Hubeny have been of great help. Some remarks by the referee of the first submitted version of this paper were also helpful. We thank the second referee for very constructive and useful comments. J.P.L. acknowledges support from the French Space Agency CNES and from Polish Ministry of Science and Higher Education within the project N N203 380336.
References
- Clarke, J. T., Bowyer, S., & Capel, D. 1984, ApJ, 287, 845 [NASA ADS] [CrossRef] [Google Scholar]
- Copperwheat, C. M., Marsh, T. R., Dhillon, V. S., Littlefair, S. P., et al. 2010, MNRAS, 402, 1824 [NASA ADS] [CrossRef] [Google Scholar]
- Demarque, P., & Guenther, D. B. 1991, in Solar interior and atmosphere, ed. Cox, A. N., Livingston, W. C. Matthews, M. S. (Tucson: Univ. Arizona Press), 1187 [Google Scholar]
- Fontaine, G., & Graboske, H. C. Jr., & Van Horn, H. M. 1977, ApJS, 35, 293 [NASA ADS] [CrossRef] [Google Scholar]
- Froning, C. S., Robinson, E. L., Welsh, W. F., & Wood, J. H. 1999, ApJ, 523, 399 [Google Scholar]
- Guzik, J. A., & Lebreton, Y. 1991, in Solar interior and atmosphere, ed. Cox, A. N., Livingston, W. C. Matthews, M. S. (Tucson: Univ. Arizona Press), 1235 [Google Scholar]
- Hameury, J.-M. 2002, The Physics of Cataclysmic Variables and Related Objects, 261, 377 [NASA ADS] [Google Scholar]
- Hameury, J.-M., Menou, K., Dubus, G., Lasota, J. -P., & Huré, J. M. 1998, MNRAS, 298, 1048 [NASA ADS] [CrossRef] [Google Scholar]
- Hameury, J.-M., Lasota, J.-P., & Dubus, G. 1999, MNRAS, 303, 39 [NASA ADS] [CrossRef] [Google Scholar]
- Hauschildt, P. H., Allard, F., Ferguson, J., Baron, E., & Alexander, D. R. 1999, ApJ, 525, 871 [NASA ADS] [CrossRef] [Google Scholar]
- Hubeny, I. 1990, ApJ, 351, 632 [NASA ADS] [CrossRef] [Google Scholar]
- Hubeny, I. 1991, The 6th Institute d'Astrophysique de Paris (IAP) Meeting: Structure and Emission Properties of Accretion Disks, IAU Coll., 129, 227 [Google Scholar]
- Hubeny, I., & Hubeny, V. 1998, ApJ, 505, 558 [NASA ADS] [CrossRef] [Google Scholar]
- Hubeny, I., Lanz, T., & Jeffery, C. S. 1994, Newsletter on Analysis of Astronomical Spectra (St Andrews Univ.), 20, 30 [Google Scholar]
- Hügelmeyer, S. D., Dreizler, S., Hauschildt, P. H., et al. 2009, A&A, 498, 793 [NASA ADS] [CrossRef] [EDP Sciences] [Google Scholar]
- Hynes, R. I., Robinson, E. L., & Bitner, M. 2005, ApJ, 630, 405 [NASA ADS] [CrossRef] [Google Scholar]
- Idan, I., Lasota, J. P., Hameury, J.-M., & Shaviv, G. 1999, Phys. Rep., 311, 213 [NASA ADS] [CrossRef] [Google Scholar]
- Idan, I., Lasota, J. P., Hameury, J.-M., & Shaviv, G. 2008, New Astron. Rev., 51, 759 [Google Scholar]
- Kalkofen W., & Wehrse, R. 1984 Methods in radiative transfer, ed. W. Kalkofen (Cambridge University Press), 307 [Google Scholar]
- Kellermann, T., Nagel, T., Hammer, N. J., & Werner, K. 2005, The Astrophysics of Cataclysmic Variables and Related Objects, 330, 391 [NASA ADS] [Google Scholar]
- Kriz, S., & Hubeny, I. 1986, Bull. Astron. Inst. Czechosl., 37, 129 [Google Scholar]
- Kromer, M., Nagel, T., & Werner, K. 2007, A&A, 475, 301 [NASA ADS] [CrossRef] [EDP Sciences] [Google Scholar]
- Kurucz, R. L. 1992, Rev. Mex. Astron. Astrofis., 23, 45 [Google Scholar]
- Lasota, J.-P. 2001, New Astron. Rev., 45, 449 [NASA ADS] [CrossRef] [Google Scholar]
- Lasota, J.-P., Dubus, G., & Kruk, K. 2008, A&A, 486, 523 [NASA ADS] [CrossRef] [EDP Sciences] [Google Scholar]
- Littlefair, S. P., Dhillon, V. S., Marsh, T. R., & Harlaftis, E. T. 2001, MNRAS, 327, 475 [NASA ADS] [CrossRef] [Google Scholar]
- Marsh, T. R., & Horne, K. 1990, ApJ, 349, 593 [NASA ADS] [CrossRef] [Google Scholar]
- Min, M., Dullemond, C. P., Dominik, C., de Koter, A., & Hovenier, J. W. 2009, A&A, 497, 155 [NASA ADS] [CrossRef] [EDP Sciences] [Google Scholar]
- Nagel, T., Dreizler, S., Rauch, T., & Werner, K. 2004, A&A, 428, 109 [NASA ADS] [CrossRef] [EDP Sciences] [Google Scholar]
- Nauenberg, M. 1972, ApJ, 175, 417 [NASA ADS] [CrossRef] [Google Scholar]
- Orosz, J. A., & Wade, R. A. 2003, ApJ, 593, 1032 [NASA ADS] [CrossRef] [Google Scholar]
- Paczynski, B. 1969, Acta Astron., 19, 1 [NASA ADS] [Google Scholar]
- Pringle, J. E., Verbunt, F., & Wade, R. A. 1986, MNRAS, 221, 169 [NASA ADS] [Google Scholar]
- Ribeiro, T., Baptista, R., Harlaftis, E. T., Dhillon, V. S., & Rutten, R. G. M. 2007, A&A, 474, 213 [NASA ADS] [CrossRef] [EDP Sciences] [Google Scholar]
- Schreiber, M. R., & Lasota, J.-P. 2007, A&A, 473, 897 [NASA ADS] [CrossRef] [EDP Sciences] [Google Scholar]
- Shakura, N. I., & Sunyaev, R. A. 1973, A&A, 24, 337 [NASA ADS] [Google Scholar]
- Shaviv, G., & Wehrse, R. 1986, A&A, 159, L5 [NASA ADS] [Google Scholar]
- Shaviv, G.,& Wehrse, R. 1991, A&A, 251, 117 [NASA ADS] [Google Scholar]
- Shaviv, G., & Wehrse, R. 2005, A&A, 440, 13 [NASA ADS] [CrossRef] [EDP Sciences] [Google Scholar]
- Smak, J. 1991, The 6th Institute d'Astrophysique de Paris (IAP) Meeting: Structure and Emission Properties of Accretion Disks, ed. C. Bertout, S. Collin-Souffrin, & J.-P. Lasota (Gif-sur-Yvette: Editions Frontieres), IAU Coll., 129, 247 [Google Scholar]
- Smak, J. 1999, Acta Astron., 49, 391 [NASA ADS] [Google Scholar]
- Urban, J. A., & Sion, E. M. 2006, ApJ, 642, 1029 [NASA ADS] [CrossRef] [Google Scholar]
- Vrielmann, S., Hessman, F. V., & Horne, K. 2002, MNRAS, 332, 176 [NASA ADS] [CrossRef] [Google Scholar]
- Wade, R. A., & Hubeny, I. 1998 ApJ, 509, 350 [Google Scholar]
- Wehrse, R. 1981 MNRAS, 195, 553 [Google Scholar]
- Warner, B. 1995, Cataclysmic Variable Stars (Cambridge: Cambridge University Press) [Google Scholar]
- Williams, G. 1983, ApJS, 53, 523 [NASA ADS] [CrossRef] [Google Scholar]
- Wood, J., Horne, K., Berriman, G., et al. 1986, MNRAS, 219, 629 [NASA ADS] [CrossRef] [Google Scholar]
- Wood, J. H., Horne, K., Berriman, G., & Wade, R. A. 1989, ApJ, 341, 974 [NASA ADS] [CrossRef] [Google Scholar]
Footnotes
- ...
100 000 K
![[*]](/icons/foot_motif.png)
- However, we do not attempt to produce stationary accretion discs spanning such a range of temperatures since such discs do not exist.
- ...
ROTIN
- http://nova.astro.umd.edu/Synspec43/synspec-frames-rotin.html
- ... than
- Whereas the fit critical of
 is accurate within few percent, the accuracy of the fit
to the critical central temperature is no better than 20%.
This explains the difference with the fits given in Lasota
et al. (2008), which in addition contain typing
errors. The formula in Eq. (A1) of this paper should read:
is accurate within few percent, the accuracy of the fit
to the critical central temperature is no better than 20%.
This explains the difference with the fits given in Lasota
et al. (2008), which in addition contain typing
errors. The formula in Eq. (A1) of this paper should read:  .
.
All Figures
|
|
Figure 1: Comparison between the
opacities as function of wavelength obtained from ``Atlas 12'' of
Kurucz and those obtain from OP for
|
| Open with DEXTER | |
| In the text | |
|
|
Figure 2: The iteration scheme. |
| Open with DEXTER | |
| In the text | |
|
|
Figure 3:
Variation of the temperature-optical depth profile during the iteration to the converged
solution (
|
| Open with DEXTER | |
| In the text | |
|
|
Figure 4:
|
| Open with DEXTER | |
| In the text | |
|
|
Figure 5: The total (viscous) flux
and the convective flux (dashed line) as function of the total optical
depth calculated for a cold disc with
|
| Open with DEXTER | |
| In the text | |
|
|
Figure 6:
Comparison between the temperature profiles for models with and without convection for cold disc at
|
| Open with DEXTER | |
| In the text | |
|
|
Figure 7:
Comparison between the fluxes for models with and without convection for a cold disc at
|
| Open with DEXTER | |
| In the text | |
|
|
Figure 8:
The vertical temperature structure for
|
| Open with DEXTER | |
| In the text | |
|
|
Figure 9:
The full disc spectra for three values of accretion rates and outer radii corresponding to the decay from outburst.
|
| Open with DEXTER | |
| In the text | |
|
|
Figure 10:
Rest frame spectra (black) and spectra shown after convolution (red) with a Gaussian instrumental profile
(see text for details). The parameters are the same as in Fig. 9 for
|
| Open with DEXTER | |
| In the text | |
|
|
Figure 11:
Comparison with spectra calculated by (Wade & Hubeny 1998). Model cc ( upper panel) and model y ( lower panel) are compared with ILHS spectra calculated for
|
| Open with DEXTER | |
| In the text | |
|
|
Figure 12:
The optical depth as function of the disc radii for disc models with
|
| Open with DEXTER | |
| In the text | |
|
|
Figure 13:
The disc height at optical depth of 10-3 (solid line) and the height of the convection zone (dashed line)
for two values of effective temperatures
|
| Open with DEXTER | |
| In the text | |
|
|
Figure 14:
The integrated disc spectrum as function of the outer disc radius for cold discs with
|
| Open with DEXTER | |
| In the text | |
|
|
Figure 15:
The integrated disc spectrum for two low values of
|
| Open with DEXTER | |
| In the text | |
Copyright ESO 2010
Current usage metrics show cumulative count of Article Views (full-text article views including HTML views, PDF and ePub downloads, according to the available data) and Abstracts Views on Vision4Press platform.
Data correspond to usage on the plateform after 2015. The current usage metrics is available 48-96 hours after online publication and is updated daily on week days.
Initial download of the metrics may take a while.