| Issue |
A&A
Volume 517, July 2010
|
|
|---|---|---|
| Article Number | A84 | |
| Number of page(s) | 5 | |
| Section | Cosmology (including clusters of galaxies) | |
| DOI | https://doi.org/10.1051/0004-6361/201014062 | |
| Published online | 12 August 2010 | |
 multifractality of Swift short GRBs?
F. Tamburini
Università di Padova, Dipartimento di Astronomia, vicolo dell'Osservatorio 3, 35122 Padova, Italy
Received 14 January 2010 / Accepted 10 March 2010
Abstract
Aims. We analyze and characterize the angular distribution
of selected samples of gamma ray bursts (GRBs) from BATSE and Swift
data to confirm that the division into two classes of short- and
long-duration GRBs also correspond to two distinct spatial populations.
Methods. The angular distribution is analyzed using multifractal
analysis and characterized by a multifractal spectrum of dimensions.
Different spectra of dimensions relate to different angular
distributions.
Results. The spectra of dimensions of short and long bursts
indicate that the two populations indeed have two different angular
distributions. Both Swift and BATSE long bursts appear to be
homogeneously distributed across the sky with a monofractal
distribution. In contrast, short GRBs follow a multifractal
distribution for both the two samples. Even if BATSE data do not enable
a unique interpretation of their angular distribution to be made
because of the instrumental selection effects that mainly favor the
detection of nearby GRBs, the results from Swift short GRBs confirm
this behavior, also when including GRBs corrected by the redshift
factor. The distributions traced by short GRBs, up to z=1,
depict a universe with a structure similar to that of a disordered
porous material with uniformly distributed heterogeneous irregular
structures, appearing more clustered than expected.
Key words: gamma rays: general - large-scale structure of Universe - chaos
1 Introduction
Gamma ray bursts (GRB) are catastrophic explosions of cosmological
origin that illuminate the sky once or twice a day with relatively
short, intense, flashes of ![]() -rays on the order of the MeV and duration that ranges from 10-3 to about 103 s.
Until the launch of Swift, the most widely accepted taxonomy of GRBs
had been the division between short-hard and long-soft bursts. In BATSE
data, both Dezalay (1992) and Kouveliotou (1993) found a bimodal
distribution in the burst duration, which was defined to be the time it
takes the 90% of the flux to arrive (T90) with respect to the local time of the detector. These two distinct GRB distributions are separated by a minimum located at
-rays on the order of the MeV and duration that ranges from 10-3 to about 103 s.
Until the launch of Swift, the most widely accepted taxonomy of GRBs
had been the division between short-hard and long-soft bursts. In BATSE
data, both Dezalay (1992) and Kouveliotou (1993) found a bimodal
distribution in the burst duration, which was defined to be the time it
takes the 90% of the flux to arrive (T90) with respect to the local time of the detector. These two distinct GRB distributions are separated by a minimum located at
![]() s.
This sharp division is apparently also caused by a selection effect of
the instrumentation onboard the satellite. New Swift observations
permit us to include in the classification scheme, as short bursts,
some distant events for which apparently T90>2 s with respect to Swift's proper time. The determination of the redshift allows us to correct the T90
for relativistic effects (Che et al. 1999; Ruffini et al.
2009). This suggests that a more solid classification of GRBs is
required on the basis on a broader set of criteria, beyond the mere
burst duration and the verification of the present taxonomy of
long/short GRBs (Donaghy et al. 2006; Zhang et al. 2007;
Bloom et al. 2008; Belczynski et al. 2008).
s.
This sharp division is apparently also caused by a selection effect of
the instrumentation onboard the satellite. New Swift observations
permit us to include in the classification scheme, as short bursts,
some distant events for which apparently T90>2 s with respect to Swift's proper time. The determination of the redshift allows us to correct the T90
for relativistic effects (Che et al. 1999; Ruffini et al.
2009). This suggests that a more solid classification of GRBs is
required on the basis on a broader set of criteria, beyond the mere
burst duration and the verification of the present taxonomy of
long/short GRBs (Donaghy et al. 2006; Zhang et al. 2007;
Bloom et al. 2008; Belczynski et al. 2008).
Long and short GRBs are understood to have been generated by
different progenitors, which each contain a black hole that accretes
material from either a disc or a torus with the emission of gamma rays (Ghirlanda et al. 2009).
The basic model for long-duration GRBs, related to the catastrophic
release of energy from the collapse of massive stars (Woolsey 2001;
Fryer & Kalogera 2001), has received strong support from the
observations of their X-ray (Gehrels et al. 2008; Nysewander
et al. 2008), optical, and radio counterparts, and the association
with supernova detections, of which the GRB980425/SN1998bw association
was the first clear example (Galama et al. 1998; Kulkarni 1998;
van Paradijs 1999).
Thus, X-ray flashes, which are associated to long-duration GRBs, are
probably produced by the highly-relativistic jets ejected in
core-collapse supernova explosions. The relativistic fireball model
(Goodman 1986; Paczynski 1986, 1990; Castro-Tirado et al. 2001)
provides a reasonable description of the observed afterglow spectrum,
which is produced by the synchrotron emission of electrons accelerated
in a relativistic shock with an estimated total energy budget roughly
the same order of magnitude as that of supernovae Ib/c (Frail 2001).
The discovery of the slowly fading X-ray emission, from optical and
radio afterglows of GRBs and the identification of host galaxies at
cosmological distances provided additional support for their
progenitors being produced short-lived massive stars at different
cosmological epochs, whose detection is limited by the BATSE threshold
to within distances slightly larger than ![]() (Wijiers et al. 1997; Blain & Natarajan 2000). The new data from Swift now has passed the barrier of z=8 (Salvaterra et al. 2009).
(Wijiers et al. 1997; Blain & Natarajan 2000). The new data from Swift now has passed the barrier of z=8 (Salvaterra et al. 2009).
Short GRBs are understood to be produced by highly - relativistic jets
ejected during different processes, such as neutron star - neutron star
(NS-NS) or black hole - neutron star (BH-NS) binary mergers (Narayan et al. 1992; Fox et al. 2005; Metzger et al. 2008), whose averaged redshift distribution, in the Swift-era, seems to be
![]() (see e.g., Magliocchetti et al. 2003; Tanvir
et al. 2005; and Ghirlanda et al. 2006). Swift and
HETE-2 observations have provided evidence of clear similarities with
the afterglows detected in the correspondence of long GRBs, because of
the detection of X-ray and optical afterglows (Soderberg 2006; Grupe 2006; Berger 2007).
Other similarities identified in the spectra for the initial stage of
short and long GRBs and the presence, in some cases, of X-ray flares
infers that a common mechanism operates during the first few seconds
(Barthelmyet et al. 2005; Coward, 2007).
Short GRBs have been observed mostly in elliptical galaxies, but even
less frequently also in nearby irregular and in star-forming galaxies,
confirming as progenitor the binary merging scenario (Castro-Tirado et al. 2002; Mêszáros 2006; Narayan et al. 2001; Belczynski et al. 2008) and the mechanism of star swapping are possible means of forming GRBs (Grindlay 2006). A similar behavior is expected for NS-BH binaries (Paczynski 1991).
The angular and spatial distributions of BATSE GRBs appear to be isotropic (Briggs et al. 1996),
there being only a few anisotropies in the angular distribution
(Mêszáros et al. 2000a,b,c). Short- and long- GRBs in the BATSE
catalog actually show two different angular distributions (Vavrek
et al. 2008; Balázs et al. 2009), but the connection to the
hypothesis of the instrumental selection effect remains completely
unclear.
(see e.g., Magliocchetti et al. 2003; Tanvir
et al. 2005; and Ghirlanda et al. 2006). Swift and
HETE-2 observations have provided evidence of clear similarities with
the afterglows detected in the correspondence of long GRBs, because of
the detection of X-ray and optical afterglows (Soderberg 2006; Grupe 2006; Berger 2007).
Other similarities identified in the spectra for the initial stage of
short and long GRBs and the presence, in some cases, of X-ray flares
infers that a common mechanism operates during the first few seconds
(Barthelmyet et al. 2005; Coward, 2007).
Short GRBs have been observed mostly in elliptical galaxies, but even
less frequently also in nearby irregular and in star-forming galaxies,
confirming as progenitor the binary merging scenario (Castro-Tirado et al. 2002; Mêszáros 2006; Narayan et al. 2001; Belczynski et al. 2008) and the mechanism of star swapping are possible means of forming GRBs (Grindlay 2006). A similar behavior is expected for NS-BH binaries (Paczynski 1991).
The angular and spatial distributions of BATSE GRBs appear to be isotropic (Briggs et al. 1996),
there being only a few anisotropies in the angular distribution
(Mêszáros et al. 2000a,b,c). Short- and long- GRBs in the BATSE
catalog actually show two different angular distributions (Vavrek
et al. 2008; Balázs et al. 2009), but the connection to the
hypothesis of the instrumental selection effect remains completely
unclear.
In this paper, we characterize the angular distributions of the two classes of GRBs by performing multifractal analysis from a selected sample of BATSE and Swift observations, considering the redshift relativistic effects, and comparing the results obtained from the two catalogues. In Sect. 2, we describe the mathematical basis of our method. In Sect. 3, we estimate the fractal/multifractal dimensions by determining the distribution moments of the multifractal spectrum from the second up to the tenth order, and then draw our conclusions.
2 Fractal/multifractal analysis of the angular distribution
Being associated with galaxies, GRBs should trace the angular distribution of their host galaxies at distances slightly larger than those estimated with classical supernovae, i.e., distances on the order of a Gpc (Paczynski 1986; Usov & Chibisov 1975), across which inhomogeneity in the distribution of luminous matter should be averaged out on the Mpc scale.
Mandelbrot (1975) and Peebles (1980) used fractal geometry to describe the angular and spatial distribution of galaxies. They used Lévy-Rayleigh random paths, i.e., infinite-variance, stable, generalized random walks in which the step lengths are described by a tailed probability distribution. Galaxies are placed at the steps of a random walk and each galaxy is randomly connected with another in its vicinity, mimicking the random motion of a fly in the air. The power-law constraint of the motion determines the fractal exponent of the random path and rules the distribution of the jump lengths and the direction of each jump is taken isotropically at random (Martinez 2002).
Galaxy surveys show that the distribution of the luminous matter in the
universe is more complicated than that of a single fractal. The
distribution of galaxies has instead multifractal properties
(Pietronero 1987; Célérier & Thieberger 2001), having a tendency to
cluster following the well known peculiar structures produced by
patterns of voids and filaments (Kurokawa et al. 1999).
The CfA survey of nearby galaxies, for example, presents the scaling
properties of these strucures with a correlation dimension in the
interval
![]() .
The two-point correlation function and the power spectrum analysis
indicates that the distribution of galaxies on very large scales
becomes homogeneous and isotropic like the X-ray background emitted by
active galactic nuclei (AGNs), in agreement with the Cosmological
Principle (Peebles 1993).
.
The two-point correlation function and the power spectrum analysis
indicates that the distribution of galaxies on very large scales
becomes homogeneous and isotropic like the X-ray background emitted by
active galactic nuclei (AGNs), in agreement with the Cosmological
Principle (Peebles 1993).
Multifractal scaling analysis has identified aggregated structures also in some samples of galaxies with distances larger than ![]() Mpc. At scales larger than 30 Mpc, the angular distribution of luminous
matter tends to homogeneity. According to Pietronero (1987), the
distribution of luminous matter has multifractal properties with
fractal dimensions that varies from d=1.23, for the nearby galaxies, up to the value
Mpc. At scales larger than 30 Mpc, the angular distribution of luminous
matter tends to homogeneity. According to Pietronero (1987), the
distribution of luminous matter has multifractal properties with
fractal dimensions that varies from d=1.23, for the nearby galaxies, up to the value ![]() at very high redshifts.
Multifractal distributions are usually present when a structure has
different fractal dimensions on different parts of the geometric
support; in other words, when spatial correlations are present and
change the geometrical shape of the distribution on different scales (Falconer 1990).
Those distributions cannot be adequately described by a geometrical
support with a single fractal dimension, but require instead a whole
spectrum of dimensions.
at very high redshifts.
Multifractal distributions are usually present when a structure has
different fractal dimensions on different parts of the geometric
support; in other words, when spatial correlations are present and
change the geometrical shape of the distribution on different scales (Falconer 1990).
Those distributions cannot be adequately described by a geometrical
support with a single fractal dimension, but require instead a whole
spectrum of dimensions.
To characterize the angular distribution of GRBs in terms of multifractals, we use the ``method of moments'', which estimates the fractality of the distribution by calculating the multifractal spectrum of generalized dimensions Dq in a given range (Falconer 1990; Feder 1988).
If we consider N GRBs in a box of size L divided into cells of size r, the sample is said to have a non-null qth moment ![]() on the scale r iff
on the scale r iff
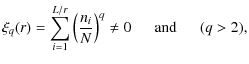
|
(1) |
where ni is the number of objects present in the ith cell. Higher moments reflect the emergence of structures present in the denser regions. From the scaling relation conducted on a two-dimensional section, we obtain (Kurokawa et al. 1999; Kurokawa et al. 2001),
| (2) |
where the coefficients Dq belong to the spectrum of generalized dimensions, D0 is the capacity dimension, D1 is the information dimension, and D2 is the correlation dimension.
To estimate the multifractality of the distribution, one has to determine each generalized dimension D-q as a function of the qth moment. One determines the dependence of each of the fractal dimensions on the moments by drawing the q-Dq plot, which is based on the Lipshitz-Hölder exponent (Benassi et al. 1998; Goltz 1997). In the q-Dq plot, one defines monofractals, those simple fractal structures described by only one dimension, ![]() ,
and in the plot all the Dqs are equivalent to
,
and in the plot all the Dqs are equivalent to ![]() .
In the general case of a multifractal, instead, Dq usually decreases for higher and higher values of the moments q: if q>q', then
.
In the general case of a multifractal, instead, Dq usually decreases for higher and higher values of the moments q: if q>q', then
![]() until converging to the asymptotic value
until converging to the asymptotic value ![]() for a distribution of infinite objects.
for a distribution of infinite objects.
To characterise with high precision the multifractal distribution of a sample of objects in space, one usually does not need to calculate the generalized dimensions up to the limit dictated by the number of points in the space. For our purposes, a good estimate was obtained by taking q=10 as an upper limit.
3 Results and discussion
From Swift observations, we selected a sample of 444 GRBs that do not have ambiguous classifications, 53 of which are classified as short-GRB after correcting of T90 for the relativistic effects (data updated at 2009-09-15). From BATSE 4 catalogue, instead, the total number of GRBs used in our analysis is 1843, 1447 of which are classified as long-GRBs.
To verify whether the classification into the two subgroups corresponds to two distinct populations in both the sets of data collected by BATSE and Swift, we also performed a series of tests of the angular distributions in different subsamples. We randomly selected from our data a sets of either short or long GRBs, mixed together, and then tested whether GRBs might be discriminated without choosing ``a priori'' the two classes following the burst duration-time distribution. The two classes of long/short GRBs were distinguished by the fractal analysis of their angular distribution in the sky. More precisely, by progressively mixing the population of short GRBs with a growing sample of randomly chosen long GRBs, the multifractal dimension converged to that of a homogeneously distributed monofractal with dimension d=2. This simple test corroborated the true subdivision of GRBs into the two short/long populations identifiable from both the BATSE and Swift data and also when the two datasets are mixed together.
We now present and discuss the results obtained for each different class of GRBs.
![\begin{figure}
\par\includegraphics[width=8.8cm,clip]{14062fg1.eps}
\end{figure}](/articles/aa/full_html/2010/09/aa14062-10/img19.png)
|
Figure 1:
Upper panel: q-Dq plot of Swift long GRBs. The long bursts follow an angular homogeneous distribution. The moments Dq tend to decrease slowly from |
| Open with DEXTER | |
3.1 Long bursts
Figure 1 clearly shows the uniform angular distribution of both the samples of Swift and BATSE 4 selected data.
The sample of data from Swift shows a homogeneous distribution. In this case, the moments Dq tend to decrease slowly from
![]() to
to
![]() and the fractal dimension begins to increase after the moment q=8. In the plot, we also present some sporadic and discontinuous jumps down to
and the fractal dimension begins to increase after the moment q=8. In the plot, we also present some sporadic and discontinuous jumps down to
![]() that deviate from the main smoothness, a behavior that might be caused by numerical errors in the determination of certain Dq's
. In any case, this does not affect the interpretation of the global
behavior observed in the plot. We observed a typical example of a
stochastic homogeneous distribution, similar to that of a fractional
Brownian motion (FBM) of dimension D=2, which is expected from distant sources that homogeneously distribute according to the Cosmological Principle.
The errorbars of the Dqs'
are calculated from the error propagation of the statistical
uncertainty in the position of each GRB and from the instrumental
errors. In the case of Swift data, errorbars are too small to be
visible in the graph.
that deviate from the main smoothness, a behavior that might be caused by numerical errors in the determination of certain Dq's
. In any case, this does not affect the interpretation of the global
behavior observed in the plot. We observed a typical example of a
stochastic homogeneous distribution, similar to that of a fractional
Brownian motion (FBM) of dimension D=2, which is expected from distant sources that homogeneously distribute according to the Cosmological Principle.
The errorbars of the Dqs'
are calculated from the error propagation of the statistical
uncertainty in the position of each GRB and from the instrumental
errors. In the case of Swift data, errorbars are too small to be
visible in the graph.
By analyzing BATSE data, we observed a different behavior in the interval 4<q<6, where the distribution is flat, within the experimental errors, and the angular distribution is characterized by an almost constant fractal dimension that fluctuates within the interval Dq= [1.8-2] approximately describing the angular distribution of a uniform structure. We found a similar result in both the datasets, the redshift scale being around the Gyr (as confirmed by the redshift values obtained for most of the bursts), that is, long GRBs are distributed according to the Cosmological Principle, in which the Universe is completely homogeneous and isotropic on large scales.
3.2 Short bursts
They represent a more complicated set of phenomena with many unknown properties. Figure 2 presents data for the whole sample of 53 Swift short bursts in addition to the apparently-long bursts corrected by z and those with T90 already below 2 s. The sample is characterised by a spectrum of dimensions that decreases for increasing q's, the signature of a multifractal distribution.
![\begin{figure}
\par\includegraphics[width=8.8cm,clip]{14062fg2.eps}
\end{figure}](/articles/aa/full_html/2010/09/aa14062-10/img21.png)
|
Figure 2: q-Dq plot of Swift short GRBs. Upper panel: spectrum of fractal dimensions of the angular distribution of the whole sample. This behavior with a maximum around q=3 clearly indicates a multifractal homogeneous distribution very close to that of a multifractional Brownian motion. Lower left panel: dimension moments of the 13 z-corrected GRBs with relatively high redshift. The structure is clearly multifractal. Lower panel: the subsample of GRBs with already T90<2 s, exhibits a multifractal distribution, but with an asymptotic convergence to Dq=1. In this case, the structure traced by the GRBs appears to be more clustered. |
| Open with DEXTER | |
Short GRBs appear to be regularly angularly distributed because they follow multifractional Brownian motion (mBM) of mean index H=0.68, a distribution that begins with a clustered shape then evolves towards homogeneity on relatively larger scales. The mBM is an extension of the fractional Brownian motion in the sense that the path regularity can vary with time, as observed during the evolution of anomalous diffusion processes. The Universe traced by short GRBs exhibits a multifractal structure, which presents non null autocorrelation on lower scales and evolves to homogeneity at larger distances. This structure appears to be similar to a disordered porous material that exhibits a heterogeneous structure, or even an irregular one in a uniform sense. This type of foam contains multiple, nested natural length scales or continuously evolving scales, while moving to higher redshifts (Lim & Muniandy 2002).
The differences between the distributions of short and long bursts, as
evident in the plots, is confirmed by the correlation coefficients and
the p-values
obtained by comparing the results of averaging 10 sets of 53 randomly
chosen (without repetition) long GRBs with respect to the total sample
of short ones. The effects of the numerical problem that produced some
outliers (e.g. the points at
![]() in Fig. 1, upper panel) were corrected by applying a polynomial
fit to the general trend.
The correlation coefficient indicates the strength and the direction of
a linear relationship existing between two data records. When there is
a strong correlation, the correlation coefficient is
in Fig. 1, upper panel) were corrected by applying a polynomial
fit to the general trend.
The correlation coefficient indicates the strength and the direction of
a linear relationship existing between two data records. When there is
a strong correlation, the correlation coefficient is ![]() ,
when there is no correlation, R=0, and when an anti-correlation is present,
,
when there is no correlation, R=0, and when an anti-correlation is present, ![]() .
In general, a correlation greater than 0.8 is considered a strong
correlation, whereas a correlation less than 0.5, is weak. The p-values
are instead calculated to test the hypothesis of no-correlation, which
is the probability of obtaining a correlation as large as the observed
value by random chance, when the true correlation is zero. If the p-value is less than 0.05, one rejects the null hypothesis and the correlation R is significant (Wall & Jenkins 2003). For Swift data, long and short bursts have a very weak correlation (
R = 0.2656) and a very low p-value of p=0.2868,
which rejects the no-correlation hypothesis. From Swift data, short and
long GRBs seem to follow two independent angular distributions.
.
In general, a correlation greater than 0.8 is considered a strong
correlation, whereas a correlation less than 0.5, is weak. The p-values
are instead calculated to test the hypothesis of no-correlation, which
is the probability of obtaining a correlation as large as the observed
value by random chance, when the true correlation is zero. If the p-value is less than 0.05, one rejects the null hypothesis and the correlation R is significant (Wall & Jenkins 2003). For Swift data, long and short bursts have a very weak correlation (
R = 0.2656) and a very low p-value of p=0.2868,
which rejects the no-correlation hypothesis. From Swift data, short and
long GRBs seem to follow two independent angular distributions.
The further division of short GRBs into two sub-classes, one containing the short GRBs corrected for the redshift and the other containing only those GRBs that already present a T90 already below the 2 s, show that the two subsamples follow two mutually exclusive multifractal distributions and that the subclass of the z-corrected short GRBs has a higher fractal dimension q0, close to that of a homogeneous distribution, confirming the behavior expected from a mBM (see the two lower panels in Fig. 2).
The whole sample of BATSE short GRBs exhibits a spectrum of the general dimension Dq, smoother than that of the whole sample of BATSE long GRBs, as reported in the upper panel of Fig. 3. The capacity dimension D0 and the correlation dimension D2 have similar values close to
![]() which are smaller than those of long GRBs. This demonstrates that short
GRBs have a different multifractal and more clustered distribution than
to long ones. This difference ismore evident if BATSE GRBs are divided
into the two subclasses indicated by Mukherjee et al. (1998):
Class II with short/faint/hard bursts and Class III with
intermediate/intermediate/soft bursts (we recall that Class I
correspond to long GRBs), as drawn in the lower panels of Fig. 3.
which are smaller than those of long GRBs. This demonstrates that short
GRBs have a different multifractal and more clustered distribution than
to long ones. This difference ismore evident if BATSE GRBs are divided
into the two subclasses indicated by Mukherjee et al. (1998):
Class II with short/faint/hard bursts and Class III with
intermediate/intermediate/soft bursts (we recall that Class I
correspond to long GRBs), as drawn in the lower panels of Fig. 3.
![\begin{figure}
\includegraphics[width=9cm,clip]{14062fg3.eps}
\end{figure}](/articles/aa/full_html/2010/09/aa14062-10/img25.png)
|
Figure 3:
Upper panel: q-Dq plot of BATSE 4 short GRBs (Class I + Class II) exhibit a fractal structure with dimensions fluctuating around the value |
| Open with DEXTER | |
By applying the same statistical test used to quantify the distributions in Swift data, the R and p values of BATSE data are found to be R=-0.0741 and p=0.7702 which have slightly different statistical behavior: almost no (anti)-correlation with a high p-value. This is a clear indication of instrumental selection effects.
In conclusion, even if R and p values of BATSE
data could be ascribed to a selection effect, Swift results confirm the
existence of two different angular distributions associated with the
two classes of short and long GRBs. In both Swift and BATSE data sets,
long bursts are homogeneously angularly distributed. In contrast, short
GRBs trace a distribution that appears to differ from that expected for
the clustering of luminous matter in the Universe around the redshift
value ![]() .
We can clearly see a multifractal distribution in a structure that
should already be homogeneously-distributed.
By taking into account that the candidate progenitors of short GRBs
probably migrate away from their initial positions, we should also
expect an additional convolving effect on the detected structure that
may tend to make the distribution more towards the total homogeneous, a
result that has not been observed. This suggests either that GRBs are
not good tracers of the matter distribution or that the Universe traced
by GRBs appears more clustered at redshifts
.
We can clearly see a multifractal distribution in a structure that
should already be homogeneously-distributed.
By taking into account that the candidate progenitors of short GRBs
probably migrate away from their initial positions, we should also
expect an additional convolving effect on the detected structure that
may tend to make the distribution more towards the total homogeneous, a
result that has not been observed. This suggests either that GRBs are
not good tracers of the matter distribution or that the Universe traced
by GRBs appears more clustered at redshifts
![]() than expected.
than expected.
The author would like to acknowledge Massimo della Valle for the helpful discussions and suggestions.
References
- Balázs, L. G., Horváth, I., Vavrek, R., Bagoly, Z., & Mêszáros, A. 2008, AIPC, 1000, 52 [NASA ADS] [Google Scholar]
- Barthelmy, S. D., Chincarini, G., Burrows, D. N., et al. 2005, Nature, 438, 994 [NASA ADS] [CrossRef] [PubMed] [Google Scholar]
- Belczynski, K., Hartmann, D. H., Fryer, C. L., Holz, D. E., & O'Shea, B. 2010, ApJ, 708, 117 [NASA ADS] [CrossRef] [Google Scholar]
- Benassi, A., Cohen S., & Istas, J. 1998, Proba Lett., 39, 337 [Google Scholar]
- Berger, E. 2007, ApJ, 670, 1254 [NASA ADS] [CrossRef] [Google Scholar]
- Blain, A. W., & Natarajan, P. 2000, MNRAS, 312, L35 [NASA ADS] [CrossRef] [Google Scholar]
- Bloom, J. S., Butler, N. R., & Perley, D. A. 2008, AIPC, 1000, 11 [NASA ADS] [Google Scholar]
- Briggs, M. S., Paciesas, W. S., Pendleton, G. N., et al. 1996, ApJ, 459, 40 [NASA ADS] [CrossRef] [Google Scholar]
- Castro-Tirado, A. J., Sokolov, V. V., Gorosabel, J., et al. 2001, A&A, 370, 398 [NASA ADS] [CrossRef] [EDP Sciences] [Google Scholar]
- Castro-Tirado, A. J., Castro Cerón, J. M., Gorosabel, J., et al. 2002, A&A, 393, L55 [NASA ADS] [CrossRef] [EDP Sciences] [Google Scholar]
- Célérier, M.-N., & Thieberger, R. 2001, A&A, 367, 449 [NASA ADS] [CrossRef] [EDP Sciences] [Google Scholar]
- Che, H., Yang, Y., Wu, M., & Li, Q. B. 1997, ApJ, 483, L25 [NASA ADS] [CrossRef] [Google Scholar]
- Coward, D. 2007, New Astron. Rev., 51, 539 [NASA ADS] [CrossRef] [Google Scholar]
- Dezalay, J.-P., et al. 1992, in Gamma-ray bursts; Proceedings of the Workshop, Univ. of Alabama, Huntsville, 304 [Google Scholar]
- Donaghy, T. Q., Lamb, D. Q., Sakamoto, T., et al. 2006, unpublished [arXiv:astro-ph/0605570] [Google Scholar]
- Falconer, K. J. 1990, Fractal Geometry, mathematical foundations and applications (Brisbane (UK): Wiley & sons) [Google Scholar]
- Feder, J. 1988, Fractals (NY, USA: Plenum Press) [Google Scholar]
- Fox, D. B., Frail, D. A., Price, P. A., et al. 2005, Nature, 437, 845 [NASA ADS] [CrossRef] [PubMed] [Google Scholar]
- Frail, D. A., Kulkarni, S. R., Sari, R., et al. 2001, ApJ, 562, L55 [NASA ADS] [CrossRef] [Google Scholar]
- Fryer, C. L., & Kalogera, V. 2001, ApJ, 554, 548 [NASA ADS] [CrossRef] [Google Scholar]
- Galama, T. J., Vreeswijk, P. M., van Paradijs, J., et al. 1998, Nature, 395, 670 [NASA ADS] [CrossRef] [Google Scholar]
- Gehrels, N., Barthelmy, S. D., Burrows, D. N., et al. 2008, ApJ, 689, 1161 [NASA ADS] [CrossRef] [Google Scholar]
- Ghirlanda, G., Magliocchetti, M., Ghisellini, G., & Guzzo, L. 2006, MNRAS, 368, L20 [NASA ADS] [Google Scholar]
- Ghirlanda, G., Nava, L., Ghisellini, L., Celotti, A., & Firmani, C. 2009, A&A, 496, 585 [NASA ADS] [CrossRef] [EDP Sciences] [Google Scholar]
- Goltz, C. 1997, Fractal and Chaotic Properties of Earthquakes (Berlin: Springer-Verlag) [Google Scholar]
- Goodman, J. 1986, ApJ, 308, L47 [NASA ADS] [CrossRef] [Google Scholar]
- Grindlay, J., Portegies Zwart, S., & McMillan, S. 2006, Nature Phys., 2, 116 [Google Scholar]
- Grupe D., Burrows, D. N., Patel, S. K., et al. 2006, ApJ, 653, 462 [NASA ADS] [CrossRef] [Google Scholar]
- Kouveliotou, C., Meegan, C. A., Fishman, G. J., et al. 1993, ApJ, 413, L101K [NASA ADS] [CrossRef] [Google Scholar]
- Kulkarni, S. R., Frail, D. A., Wieringa, M. H., et al. 1998, Nature, 395, 663 [NASA ADS] [CrossRef] [Google Scholar]
- Kurokawa, T., Morikawa, M., & Mouri, H. 1999, A&A, 344, 1 [NASA ADS] [Google Scholar]
- Kurokawa, T., Morikawa, M., & Mouri, H. 2001, A&A, 370, 358 [NASA ADS] [CrossRef] [EDP Sciences] [Google Scholar]
- Lim, S. C., & Muniandy, S. V. 2002, Phys. Rev. E., 66, 021114 [NASA ADS] [CrossRef] [Google Scholar]
- Magliocchetti, M., Ghirlanda, G., & Celotti, A. 2003, MNRAS, 343, 255 [NASA ADS] [CrossRef] [Google Scholar]
- Mandelbrot, B. B. 1975, Comptes Rendues (Paris), 280A, 1551 [Google Scholar]
- Martìnez, V. J., & Saar, E. 2001, Statistics of the Galaxy Distribution (Boca Raton: Chapman and Hall/CRC Press) [Google Scholar]
- Mêszáros, A. 2006, Rep. Prog. Phys., 69, 2259 [NASA ADS] [CrossRef] [Google Scholar]
- Mêszáros, A., Bagoly, Z., Horváth, I., Balázs, L. G., & Vavrek, R., 2000a in GAMMA-RAY BURSTS: 5th Huntsville Symposium. AIPC, 526, 102 [Google Scholar]
- Mêszáros, A., Bagoly, Z., & Vavrek, R. 2000b, A&A, 354, 1 [NASA ADS] [Google Scholar]
- Mêszáros, A., Bagoly, Z., Horváth, I., Balázs, L. G., & Vavrek, R. 2000c, ApJ, 539, 98 [NASA ADS] [CrossRef] [Google Scholar]
- Metzger, B., Piro, A., & Quataert, E. 2009, MNRAS, 390, 781 [Google Scholar]
- Mukherjee, S., Feigelson, E. D., Babu, G. J., et al. 1998, ApJ, 508, 314 [NASA ADS] [CrossRef] [Google Scholar]
- Narayan, R., Paczynski, B., & Piran, T. 1992, ApJ, 395, L83N [NASA ADS] [CrossRef] [Google Scholar]
- Narayan, R., Piran, T., & Kumar, P. 2001, ApJ, 557, 949 [NASA ADS] [CrossRef] [Google Scholar]
- Nysewander, M., Fruchter, A. S., & Peer, A. 2009, ApJ, 701, 824 [NASA ADS] [CrossRef] [Google Scholar]
- Paczynski B. 1986, ApJ, 308, L43 [NASA ADS] [CrossRef] [Google Scholar]
- Paczynski B. 1990, ApJ, 363, 218 [NASA ADS] [CrossRef] [Google Scholar]
- Paczynski B. 1991, Acta Astron., 41, 257 [Google Scholar]
- Peebles, P. J. E. 1980, The Large Scale Structure of the Universe (Princeton University Press) [Google Scholar]
- Peebles, P. J. E. 1993, Principles of Physical Cosmology (Princeton Univ. Press) [Google Scholar]
- Pietronero, L. 1987, Phys. A, 144, 257 [CrossRef] [Google Scholar]
- Ruffini, R., et al. 2009, in Proceedings of the 2008 Cefalú Conference, AIPC, 1111, 325 [Google Scholar]
- Salvaterra, R., Della Valle, M., Campana, S., et al. 2009, Nature, 461, 1258 [NASA ADS] [CrossRef] [PubMed] [Google Scholar]
- Soderberg, A. M., Berger, E., Kasliwal, M., et al. 2006, ApJ, 650, 261 [NASA ADS] [CrossRef] [Google Scholar]
- Tanvir, N. R., Chapman, R., Levan, A. J., & Priddey, R. S. 2005, Nature, 438, 991 [NASA ADS] [CrossRef] [PubMed] [Google Scholar]
- Usov V. V., & Chibisov, G. V. 1975, SVA, 19, 115 [NASA ADS] [Google Scholar]
- van Paradijs, J. 1999, Science, 286, 693 [NASA ADS] [CrossRef] [Google Scholar]
- Vavrek, R., Balázs, L. G., Mêszáros, A., Horváth, I., & Bagoly, Z. 2008, MNRAS, 391, 1741 [NASA ADS] [CrossRef] [Google Scholar]
- Wall, J. V., & Jenkins, C. R. 2003, Practical statistics for astronomers (Cambridge University Press) [Google Scholar]
- Wijiers, R. A. M. J., Bloom, J. S., Bagla, J. S., & Natarajan, P. 1997, MNRAS, 294, L13 [Google Scholar]
- Woosley, S. E. 2001, in Gamma-Ray Bursts in the Afterglow Era, Proceedings of the International Workshop Held in Rome, Italy, 17-20 October 2000, ESO ASTROPHYSICS SYMPOSIA, ed. E. Costa, F. Frontera, & J. Hjorth (Springer-Verlag), 257 [Google Scholar]
- Zhang, B., Zhang, B.-B., Liang, E.-W., et al. 2007, ApJ, 655, L25 [NASA ADS] [CrossRef] [Google Scholar]
All Figures
|
|
Figure 1:
Upper panel: q-Dq plot of Swift long GRBs. The long bursts follow an angular homogeneous distribution. The moments Dq tend to decrease slowly from |
| Open with DEXTER | |
| In the text | |
|
|
Figure 2: q-Dq plot of Swift short GRBs. Upper panel: spectrum of fractal dimensions of the angular distribution of the whole sample. This behavior with a maximum around q=3 clearly indicates a multifractal homogeneous distribution very close to that of a multifractional Brownian motion. Lower left panel: dimension moments of the 13 z-corrected GRBs with relatively high redshift. The structure is clearly multifractal. Lower panel: the subsample of GRBs with already T90<2 s, exhibits a multifractal distribution, but with an asymptotic convergence to Dq=1. In this case, the structure traced by the GRBs appears to be more clustered. |
| Open with DEXTER | |
| In the text | |
|
|
Figure 3:
Upper panel: q-Dq plot of BATSE 4 short GRBs (Class I + Class II) exhibit a fractal structure with dimensions fluctuating around the value |
| Open with DEXTER | |
| In the text | |
Copyright ESO 2010
Current usage metrics show cumulative count of Article Views (full-text article views including HTML views, PDF and ePub downloads, according to the available data) and Abstracts Views on Vision4Press platform.
Data correspond to usage on the plateform after 2015. The current usage metrics is available 48-96 hours after online publication and is updated daily on week days.
Initial download of the metrics may take a while.