| Issue |
A&A
Volume 516, June-July 2010
|
|
|---|---|---|
| Article Number | A74 | |
| Number of page(s) | 10 | |
| Section | Planets and planetary systems | |
| DOI | https://doi.org/10.1051/0004-6361/201014361 | |
| Published online | 09 July 2010 | |
Thermal properties of asteroid 21 Lutetia from Spitzer Space Telescope observations
P. L. Lamy1 - O. Groussin1 - S. Fornasier2,3 - L. Jorda1 - M. Kaasalainen4 - M. A. Barucci2
1 - Laboratoire d'Astrophysique de Marseille, UMR6110 CNRS/Université
de Provence,
38 rue Frédéric Joliot-Curie, 13388 Marseille Cedex 13, France
2 - LESIA, Observatoire de Paris, 92195 Meudon Principal Cedex, France
3 - Université de Paris 7 Denis Diderot, France
4 - Tampere University of Technology, Finland
Received 5 March 2010 / Accepted 7 May 2010
Abstract
Context. Asteroid 21 Lutetia is the second target of
the Rosetta space mission with a flyby scheduled in July 2010. To best
prepare the observational campaign, Lutetia is being extensively
characterized by ground- and space-based astronomical facilities.
Aims. We used the Spitzer Space
Telescope (SST) to determine the thermal properties of Lutetia and more
generally, to contrain its physical properties and nature.
Methods. The observations were performed with the
infrared spectrograph (IRS) of the SST on 10 and 11 December 2005, when
the asteroid was 2.81 AU from the Sun, 2.65 AU from
the SST and at a phase angle of 21![]() .
We obtained 14 spectra ranging from 5.2 to 38.0
.
We obtained 14 spectra ranging from 5.2 to 38.0 ![]() m, and
sampling the rotational period of the asteroid. They were interpreted
with a standard thermal model incorporating the thermal inertia.
m, and
sampling the rotational period of the asteroid. They were interpreted
with a standard thermal model incorporating the thermal inertia.
Results. We obtained the first thermal light curve
of Lutetia. Using the most recent solution for its three-dimensional
shape and rotational state, as well as independently determined
parameters such as the albedo, we satisfactorily reproduced the 14
spectral energy distributions and the complete thermal light curve of
Lutetia. The best thermal model has a thermal inertia ![]() JK-1m-2s-1/2
and a beaming factor in the range
JK-1m-2s-1/2
and a beaming factor in the range ![]() 0.70-0.83. This low thermal inertia is typical of
main belt asteroids and implies that the surface of Lutetia is likely
covered by a thick regolith layer. Since the beaming factor only
reflects the effects of surface rugosity, the above range implies a
high degree of roughness. In addition, our results show evidence of
inhomogeneities in the surface roughness in the equatorial band of
Lutetia.
0.70-0.83. This low thermal inertia is typical of
main belt asteroids and implies that the surface of Lutetia is likely
covered by a thick regolith layer. Since the beaming factor only
reflects the effects of surface rugosity, the above range implies a
high degree of roughness. In addition, our results show evidence of
inhomogeneities in the surface roughness in the equatorial band of
Lutetia.
Key words: minor planets, asteroids: general - minor planets, asteroids: individual: 21 Lutetia - techniques: image processing
1 Introduction
The Rosetta spacecraft was successfully launched on 2 March 2004 and is now on its way to rendezvous with comet 67P/Churyumov-Gerasimenko in May 2014 at a heliocentric distance of 4.5 AU. During its journey to the comet, the spacecraft has already flown by asteroid 2867 Steins on 5 September 2008 at a velocity of 8.6 km/s and a closest approach of 803 km (Keller et al. 2010). It will next fly by another main belt asteroid, 21 Lutetia, on 10 July 2010 at a velocity of 15 km s-1 and a closest approach of 3055 km. As for all targets of space missions, an a-priori knowledge of these ``terra incognita'' is crucial for preparing and optimizing the operations of the spacecraft and its instruments so as to maximize the scientific return. We have already performed a detailed characterization of asteroid 2867 Steins before its flyby, in particular on the basis of extensive thermal observations performed with the Spitzer Space Telescope (SST), see Lamy et al. (2008). We now turn our attention to the second target asteroid, 21 Lutetia, and report on the results coming from similar SST observations.
The large main belt asteroid, 21 Lutetia, is about
100 km in diameter.
It was first observed in the infrared by the IRAS satellite and the
main outcome was a relatively high value for the geometric albedo,
![]() where the V subscript refers to the V
photometric band (Tedesco & Veeder 1992) leading
to an M-type taxonomic classification and suggesting a metallic
composition. Mueller et al. (2006) performed
thermal photometry in three, narrow-bandwidth, filters centered at 8.7,
11.6, and 18.4
where the V subscript refers to the V
photometric band (Tedesco & Veeder 1992) leading
to an M-type taxonomic classification and suggesting a metallic
composition. Mueller et al. (2006) performed
thermal photometry in three, narrow-bandwidth, filters centered at 8.7,
11.6, and 18.4 ![]() m
and analyzed their data with a variety of thermal models. They obtained
a geometric albedo pV
in the range
m
and analyzed their data with a variety of thermal models. They obtained
a geometric albedo pV
in the range ![]() to
to ![]() depending upon the model being used, a best-fit thermal inertia
depending upon the model being used, a best-fit thermal inertia
![]() JK-1m-2s-1/2
(but point out that a thermal inertia of zero was compatible with their
data), and a beaming factor
JK-1m-2s-1/2
(but point out that a thermal inertia of zero was compatible with their
data), and a beaming factor
![]() .
Altogether, this implies that Lutetia has thermal properties that are
fairly typical of main-belt asteroids, i.e., low thermal inertia and
some surface roughness. Carvano et al. (2008) performed
thermal photometry in three narrow-bandwidth filters centered at 8.7,
10.49, and 12.35
.
Altogether, this implies that Lutetia has thermal properties that are
fairly typical of main-belt asteroids, i.e., low thermal inertia and
some surface roughness. Carvano et al. (2008) performed
thermal photometry in three narrow-bandwidth filters centered at 8.7,
10.49, and 12.35 ![]() m
and also acquired a (quite noisy) low dispersion N-band
spectrum ranging from 8 to 12.5
m
and also acquired a (quite noisy) low dispersion N-band
spectrum ranging from 8 to 12.5 ![]() m. They analyzed their data with their own
thermophysical model, which solves for the thermal balance of the
individual facets composing the shape model of the asteroid (i.e.,
similar to a method we implemented in similar past studies, see for
instance Groussin et al. 2004) but also
introduce craters to model the rugosity of the surface, each crater
being divided into a number of tiles, all this at the expense of
additional, unknown parameters. They obtained a geometric albedo
pV=0.129
and a very low thermal inertia of
m. They analyzed their data with their own
thermophysical model, which solves for the thermal balance of the
individual facets composing the shape model of the asteroid (i.e.,
similar to a method we implemented in similar past studies, see for
instance Groussin et al. 2004) but also
introduce craters to model the rugosity of the surface, each crater
being divided into a number of tiles, all this at the expense of
additional, unknown parameters. They obtained a geometric albedo
pV=0.129
and a very low thermal inertia of ![]() JK-1m-2s-1/2,
interpreted as evidence of a well-developed regolith layer with low
thermal conductivity, suggestive of high surface microporosity.
JK-1m-2s-1/2,
interpreted as evidence of a well-developed regolith layer with low
thermal conductivity, suggestive of high surface microporosity.
Table 1: Observational circumstances for the observations of 21 Lutetia with the SST on 10 and 11 December 2005.
The observed thermal emission of an asteroid is, to a large extent, determined by its shape, size, rotational state, albedo, thermal inertia, and surface roughness. The analysis of the radiometric measurements is seriously hampered, and can even be flawed if knowledge of them is limited or, worse, incorrect if an over-simplified thermal model is used.
Our present analysis benefits from major improvements on two
fronts.
First, high-angular-resolution, adaptive-optics images were acquired
during the 2008 opposition allowing to resolve Lutetia, and to improve
the determination of its size, shape, and spin axis (Drummond
et al. 2009;
Carry et al. 2010;
Merline et al., in prep.) compared to the early solution of
Torppa et al. (2003).
Second, recent photometric observations analyzed with up-to-date shape
models (Lamy et al. 2010;
Weaver et al. 2010),
as well as polarimetric observations (Belskaya et al. 2010), have
allowed pinning down the determination of the albedo. Coupled with our
unprecedented data set of 14 spectra ranging from 5.2 to 38.0 ![]() m that
sample the rotational period of the asteroid and obtained under the
ideal conditions of a space observatory, we are in a position to make
progress on the question of the thermophysical properties of Lutetia.
m that
sample the rotational period of the asteroid and obtained under the
ideal conditions of a space observatory, we are in a position to make
progress on the question of the thermophysical properties of Lutetia.
The present article is organized as follows. We first present the SST observations of 21 Lutetia, the data reduction, and the set of resulting spectral energy distributions (SEDs). We then introduce the most recent shape model and the thermal model we implemented to analyze the above results, and discuss the parameters. Our results are next presented, and we discuss their implications in terms of the physical properties of the asteroid. We finally produce thermal maps of Lutetia at the time and under the geometric conditions of the Rosetta flyby.
2 Observations with the Spitzer space telescope
There were only two visibility windows of about 20 days each to observe
21 Lutetia with the SST during cycle 2 because of the restriction on
solar elongation (80-120![]() ).
The scheduled window was chosen so as to minimize the thermal flux
expected from Lutetia to avoid saturation of the detectors.
The observations took place on 10 and 11 December 2005, the asteroid
being at a heliocentric distance of 2.81 AU, at a distance
from the SST of 2.65 AU, and at a solar phase angle of 21
).
The scheduled window was chosen so as to minimize the thermal flux
expected from Lutetia to avoid saturation of the detectors.
The observations took place on 10 and 11 December 2005, the asteroid
being at a heliocentric distance of 2.81 AU, at a distance
from the SST of 2.65 AU, and at a solar phase angle of 21![]() .
The current determination of the direction of the rotational axis of
Lutetia implies an aspect angle (defined as the angle between the spin
vector and the asteroid-observer vector) of
.
The current determination of the direction of the rotational axis of
Lutetia implies an aspect angle (defined as the angle between the spin
vector and the asteroid-observer vector) of ![]() ,
close to an equatorial view.
We used the infrared spectrograph (IRS) in the low-resolution mode (
,
close to an equatorial view.
We used the infrared spectrograph (IRS) in the low-resolution mode (
![]() ),
which covers the wavelength range 5.2-38
),
which covers the wavelength range 5.2-38 ![]() m in four long-slit segments: the short
wavelength, 2nd order (SL2, from 5.2 to 8.5
m in four long-slit segments: the short
wavelength, 2nd order (SL2, from 5.2 to 8.5 ![]() m); the
short wavelength, 1st order (SL1, from 7.4 to 14.2
m); the
short wavelength, 1st order (SL1, from 7.4 to 14.2 ![]() m); the long
wavelength, 2nd order (LL2, from 14.0 to 21.5
m); the long
wavelength, 2nd order (LL2, from 14.0 to 21.5 ![]() m); and the
long wavelength, 1st order (LL1, from 19.5 to 38.0
m); and the
long wavelength, 1st order (LL1, from 19.5 to 38.0 ![]() m).
The observational sequence was repeated 14 times at time
interval of
m).
The observational sequence was repeated 14 times at time
interval of ![]() 40 min
from UT 17:32 on 10 December to UT 02:27 on 11 December 2005 in order
to fully sample its rotational period of
40 min
from UT 17:32 on 10 December to UT 02:27 on 11 December 2005 in order
to fully sample its rotational period of ![]() 8.2 h. The observational circumstances
for the observations are reported in Table 1.
All spectra were acquired with a single ramp of 6.29 s. The
pointing of the target was performed using the ephemeris derived from
the Horizon database maintained by the Solar System Dynamics Group at
the Jet Propulsion Laboratory. In addition, we used the blue peak-up
camera to obtain images at 16
8.2 h. The observational circumstances
for the observations are reported in Table 1.
All spectra were acquired with a single ramp of 6.29 s. The
pointing of the target was performed using the ephemeris derived from
the Horizon database maintained by the Solar System Dynamics Group at
the Jet Propulsion Laboratory. In addition, we used the blue peak-up
camera to obtain images at 16 ![]() m, and placed the asteroid image inside the slits
with high accuracy.
This was indeed required because Lutetia is a moving target and the SL
mode has slits that are only 3.6 arcsec wide, while the slits are
larger (10.6 arcsec) for the LL mode.
Details about the SST and its infrared spectrograph can be found in
Werner et al. (2004)
and in the Spitzer observer's manual
(http://ssc.spitzer.caltech.edu/documents/SOM/irs60.pdf).
m, and placed the asteroid image inside the slits
with high accuracy.
This was indeed required because Lutetia is a moving target and the SL
mode has slits that are only 3.6 arcsec wide, while the slits are
larger (10.6 arcsec) for the LL mode.
Details about the SST and its infrared spectrograph can be found in
Werner et al. (2004)
and in the Spitzer observer's manual
(http://ssc.spitzer.caltech.edu/documents/SOM/irs60.pdf).
2.1 Data reduction
The science data coming from the IRS instrument are received and processed at the Spitzer Space Center (SSC). We used the basic calibrated data (BCD) produced by an automated data reduction pipeline (version S13.0) that includes cosmic ray removal, dark current subtraction, collapsing cubes to two-dimensional flux images by fitting ramp slopes, flat fielding, and stray light correction. A detailed description of the pipeline reduction steps can be found in Houck et al. (2004) and in the IRS Spitzer observer's manual - IRS pipeline handbook (http://ssc.spitzer.caltech.edu/irs/dh/). The calibration dataset was provided by the SSC along with the scientific data.
The sky subtraction is not performed by the automated pipeline. The background of the IRS images is dominated by the zodiacal cloud with a minor component from the interstellar medium. We performed the sky correction by calculating the difference between the two nod positions available for the observations in each spectral segment, following a standard ``chopping'' technique usually applied to ground-based infrared observations. The offset (one third of the slit length) is large enough that compact objects have no overlapping pixels in the two dispersed images.
We extracted the one-dimensional spectra in the four IRS segments using SPICE, the Spitzer IRS Custom Extraction software in JAVA language (version 1.3). The extraction pipeline takes the two-dimensional, background-subtracted, BCD image in FITS format as input. Each BCD image has an associated uncertainty and bitmask file, which indicates individual pixel status.
The SPICE spectral extraction thread consists of four modules.
- 1.
- It creates wavelength-collapsed average spatial profile of the slit used in the observation.
- 2.
- The location of the peak in the PROFILE output is identified for the point source extraction.
- 3.
- The spectrum is extracted (flux is in electron/s) along the RIDGE location in accordance with the wavelength-dependent point spread function (PSF) and the spectral profile. It must be noted that the source spectrum incident on the array is not rectilinear in either the spectral or cross-dispersed directions. As a result, the EXTRACT module does not extract whole pixels, but instead subdivides the array into a network of polygon-shaped sampling elements referred to as ``pseudo-rectangles'', which do not necessarily overlap the rectangular pixel grid. These elements allow Nyquist sampling of spectra in the dispersion direction. Extraction is performed by calculating the signal that falls within the boundary of the ``pseudo-rectangles''. Light is assumed to be evenly distributed within a pixel for purposes of calculating fractional contribution.
- 4.
- The software applies photometric tuning and flux conversion coefficients to the 1D spectra, getting a flux in Jy. This module also corrects the slope and curvature of each order by applying polynomial coefficients based on the calibration dataset. This correction is based on an order-by-order comparison of calibration data to standard star model spectra.
2.2 Uncertainties
According to the SPICE data handbook, pointing uncertanties
with high-accuracy peak-up will result in photometric uncertainties of ![]() 2% within a
given nod position. However mismatches between different low-resolution
modules may be as much as 5%.
``Jumps'' in flux between the SL and LL spectral orders for a source
observed with both modules are typically less than 5%, once background
emissions from zodiacal dust and cirrus have been removed. The point
source calibration is based on an average of multiple observations of
the standard star. Due to differences in the fluxes of each nod, an
individual observation may show other mismatches between SL and LL.
2% within a
given nod position. However mismatches between different low-resolution
modules may be as much as 5%.
``Jumps'' in flux between the SL and LL spectral orders for a source
observed with both modules are typically less than 5%, once background
emissions from zodiacal dust and cirrus have been removed. The point
source calibration is based on an average of multiple observations of
the standard star. Due to differences in the fluxes of each nod, an
individual observation may show other mismatches between SL and LL.
2.3 Results
The fourteen SEDs over the full spectral range 5-38 ![]() m are
displayed in Fig. 1.
The fluxes reached the expected level so that the signal-over-noise
ratio is excellent, just slightly degraded beyond about 33
m are
displayed in Fig. 1.
The fluxes reached the expected level so that the signal-over-noise
ratio is excellent, just slightly degraded beyond about 33 ![]() m.
m.
![\begin{figure}
\par\includegraphics[width=17cm,clip]{14361fig1.ps}
\end{figure}](/articles/aa/full_html/2010/08/aa14361-10/img24.png)
|
Figure 1:
The fourteen SEDs of Lutetia over the full spectral range 5-38 |
| Open with DEXTER | |
3 Analysis of the thermal data
Interpretation of the infrared data requires both a shape model and a thermal model, which are described below.
3.1 Shape model
High-angular-resolution adaptive-optics (AO) images were acquired at
different large telescopes during the 2008 opposition and resolved
Lutetia thus leading to improved estimates of its size, shape, and spin
axis (Drummond et al. 2009; Carry
et al. 2010;
Merline et al., in prep.) that supersede the earlier solutions
resulting from the inversion by Torppa et al. (2003) of a set
of light curves (LC) obtained from 1962 to 1998.
Contrary to LC inversion, which gives only a relative shape, the AO
images yield the absolute size of the models.
The triaxial ellipsoid model derived by Drummond et al. (2009) on the
basis of AO images alone has an overall size of
![]() km
and a spin axis direction defined by ecliptic longitude
km
and a spin axis direction defined by ecliptic longitude
![]() and ecliptic latitude
and ecliptic latitude ![]() .
In this study, we use a more elaborated solution that combines AO and
LC information, thus producing a more ``realistic'' shape model. The
overall dimensions measured along the principal axes of inertia are
.
In this study, we use a more elaborated solution that combines AO and
LC information, thus producing a more ``realistic'' shape model. The
overall dimensions measured along the principal axes of inertia are
![]() km,
and the spin axis direction is defined by
km,
and the spin axis direction is defined by
![]() and
and ![]() .
We used a re-sampled version of the shape model, composed of 1112
triangular facets. Figure 2 displays
the 14 views of Lutetia as it would have appeared to the SST
in the visible (i.e., reflected light) at the time of the
14 visits.
.
We used a re-sampled version of the shape model, composed of 1112
triangular facets. Figure 2 displays
the 14 views of Lutetia as it would have appeared to the SST
in the visible (i.e., reflected light) at the time of the
14 visits.
![\begin{figure}
\par\includegraphics[width=16.6cm,clip]{14361fig2.ps}
\end{figure}](/articles/aa/full_html/2010/08/aa14361-10/img31.png)
|
Figure 2:
Fourteen views of Lutetia as it would have appeared to the SST in the
visible (i.e., reflected light) at the time of the 14 visits.
The orientation is such that the aspect angle (defined as the angle
between the spin vector and the asteroid-observer vector) equals |
| Open with DEXTER | |
3.2 Thermal model
The thermal model describes the energy balance on the surface between
the flux received from the Sun, the re-radiated flux, and the heat
conduction into the asteroid.
The surface energy balance for each facet of the shape model with index
i is given by Eq. (1):
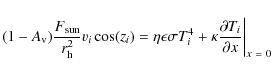
where
As the asteroid rotates around its spin axis, the values of vi
and zi
change, and the heat equation conduction is computed for each facet. We
considered the one-dimensional (x), time-dependent (t)
equation for the heat conduction, given by Eq. (2):
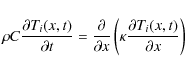
where
|
(3) |
where
The assumption of a constant Bond albedo implicit in
Eq. (1) above is not strictly valid as it is generally a
function of wavelength. Inspection of the spectra of Lutetia obtained
in the visible (Barucci et al. 2005) and in
the near infrared (Nedelcu et al. 2007) indicates
a very modest spectral reddening up to 0.8 ![]() m and a flat
reflectance beyond.
We can safely ignore this slight effect on the further ground that,
when the reddening is much more pronounced as in the case of
2867 Steins, taking the spectral variation of the albedo into
account has a negligible impact on the determination of the thermal
parameters (Lamy et al. 2008).
m and a flat
reflectance beyond.
We can safely ignore this slight effect on the further ground that,
when the reddening is much more pronounced as in the case of
2867 Steins, taking the spectral variation of the albedo into
account has a negligible impact on the determination of the thermal
parameters (Lamy et al. 2008).
3.3 Parameters of the thermal model
Our model has four free parameters: the infrared emissivity ![]() ,
the Bond albedo
,
the Bond albedo ![]() ,
the beaming factor
,
the beaming factor ![]() ,
and the thermal inertia I.
,
and the thermal inertia I.
The infrared emissivity ![]() is taken as equal to 0.95, the middle point of the interval 0.9-1.0
always quoted in the literature. As the interval is very small and the
value near 1.0, this uncertainty has a negligible influence on the
calculated thermal flux.
is taken as equal to 0.95, the middle point of the interval 0.9-1.0
always quoted in the literature. As the interval is very small and the
value near 1.0, this uncertainty has a negligible influence on the
calculated thermal flux.
The Bond albedo ![]() is the product of the visible geometric albedo
is the product of the visible geometric albedo ![]() and of the phase integral q. We used
and of the phase integral q. We used
![]() ,
as derived by Lamy et al. (2010) from
OSIRIS-Rosetta observations, using the same shape model as in this
study and q=0.376, derived from the relationship
q=0.290+0.684
G (Bowell et al. 1989) with G=0.125
(Belskaya et al. 2010).
Altogether, this gives
,
as derived by Lamy et al. (2010) from
OSIRIS-Rosetta observations, using the same shape model as in this
study and q=0.376, derived from the relationship
q=0.290+0.684
G (Bowell et al. 1989) with G=0.125
(Belskaya et al. 2010).
Altogether, this gives ![]() .
.
The beaming factor ![]() follows the strict definition given by Lagerros (1998), and
therefore only reflects the influence of surface roughness.
Theoretically
follows the strict definition given by Lagerros (1998), and
therefore only reflects the influence of surface roughness.
Theoretically ![]() ranges from 0 (largest roughness) to 1 (flat surface), but in practice
it must be larger than 0.7 to avoid unrealistic roughness, with rms
slopes exceeding 45 deg (Lagerros 1998). In this
study,
ranges from 0 (largest roughness) to 1 (flat surface), but in practice
it must be larger than 0.7 to avoid unrealistic roughness, with rms
slopes exceeding 45 deg (Lagerros 1998). In this
study, ![]() is unknown and derived from the observations.
is unknown and derived from the observations.
The thermal inertia is also unknown, and we covered a range 0-50 JK-1m-2s-1/2 with six values I=0, 10, 20, 30, 40 and 50 JK-1m-2s-1/2. As demonstrated later, higher values are not compatible with the observations.
Finally, there are only two unknown parameters in the thermal
model, the thermal inertia I, and the beaming
factor ![]() .
These two parameters have a similar effect as they change the surface
temperature distribution. As such, they cannot be determined
independently, and to each value of I corresponds
one value of
.
These two parameters have a similar effect as they change the surface
temperature distribution. As such, they cannot be determined
independently, and to each value of I corresponds
one value of ![]() .
.
4 The thermal properties of asteroid 21 Lutetia
The thermal properties were determined in two steps. First, we derived
the thermal inertia I and roughness ![]() from the thermal light curve, and then studied the implications for the
individual SEDs presented in Fig. 1.
from the thermal light curve, and then studied the implications for the
individual SEDs presented in Fig. 1.
4.1 Thermal light curve
Using the above shape and thermal models, we generated synthetic
thermal light curves of asteroid Lutetia as seen from the SST in
December 2005. For each value of the thermal inertia in the range
0-50 JK-1m-2s-1/2,
the best value for ![]() was determined by a least-square fit of the synthetic light curve to
the observed one. All light curves were calculated by integrating the
respective SEDs from 5 to 37
was determined by a least-square fit of the synthetic light curve to
the observed one. All light curves were calculated by integrating the
respective SEDs from 5 to 37 ![]() m. Their phasing is absolute in time since the
rotation period is known with sufficient accuracy, better than
0.01 s. The results are presented in Table 2 and
illustrated in Fig. 3
(upper panel).
m. Their phasing is absolute in time since the
rotation period is known with sufficient accuracy, better than
0.01 s. The results are presented in Table 2 and
illustrated in Fig. 3
(upper panel).
As shown in Table 2, the beaming
factor decreases as the thermal inertia increases. In fact, when I
increases, more energy is used for internal heat conduction and less
for surface heating (Eq. (1)), so that the surface temperature
decreases overall.
To match the observations and maintain a constant thermal flux from the
surface, surface cooling must be compensated by a lower beaming factor
(that is, a higher roughness), which in turn increases the surface
temperature. As explained in Sect. 3.3, the beaming factor
must be greater than 0.7 to avoid unrealistic roughness. This
constraint ![]() imposes
that the only acceptable values of I must lie in
the range 0-30 JK-1m-2s-1/2
for the nominal value of the geometric albedo
imposes
that the only acceptable values of I must lie in
the range 0-30 JK-1m-2s-1/2
for the nominal value of the geometric albedo
![]() considered in Sect. 3.3. This constraint would restrict the
above range to 0-20 JK-1m-2s-1/2
in the case of the extreme geometric albedo
considered in Sect. 3.3. This constraint would restrict the
above range to 0-20 JK-1m-2s-1/2
in the case of the extreme geometric albedo
![]() derived by Mueller et al. (2006) using
their thermophysical model (TPM). However, since the value
derived by Mueller et al. (2006) using
their thermophysical model (TPM). However, since the value
![]() of Lamy et al. (2010)
is based on more recent photometric observations analyzed with an
up-to-date shape model, we favor the range 0-30 JK-1m-2s-1/2,
which includes the high albedo case.
of Lamy et al. (2010)
is based on more recent photometric observations analyzed with an
up-to-date shape model, we favor the range 0-30 JK-1m-2s-1/2,
which includes the high albedo case.
![\begin{figure}
\par\includegraphics[width=8.5cm]{14361fig3a.ps}\par\includegraphics[width=8.5cm]{14361fig3b.ps}
\end{figure}](/articles/aa/full_html/2010/08/aa14361-10/img47.png)
|
Figure 3:
Upper panel: Thermal light curves of asteroid
21 Lutetia. The symbols correspond to the SST observations (the open
squares correspond to phased-folded data points). The solid line
corresponds to the synthetic thermal light curve with the combination (
|
| Open with DEXTER | |
Table 2:
Thermal inertia I and beaming factor ![]() of asteroid 21 Lutetia derived from the SST data, for two different
values of the geometric albedo.
of asteroid 21 Lutetia derived from the SST data, for two different
values of the geometric albedo.
Figure 3
(upper panel) displays the synthetic thermal light curves of 21 Lutetia
at the time of the SST observations, for the combinations (I=0,
![]() )
and (I=30 JK-1m-2s-1/2,
)
and (I=30 JK-1m-2s-1/2,
![]() ). Similar results were
obtained for the other combinations of parameters presented in
Table 2.
Qualitatively, the results are impressive since the general shape of
the light curve with two extrema (maximum at UT
). Similar results were
obtained for the other combinations of parameters presented in
Table 2.
Qualitatively, the results are impressive since the general shape of
the light curve with two extrema (maximum at UT ![]() 20.5 h
and minimum at UT
20.5 h
and minimum at UT ![]() 22.0 h)
followed by a plateau (at UT
22.0 h)
followed by a plateau (at UT ![]() 24-27 h) is reproduced well in
phase and, to a lesser extent, in intensity. Quantitatively, the
synthetic curves match 8 out of the 14 SST data points at the 1
24-27 h) is reproduced well in
phase and, to a lesser extent, in intensity. Quantitatively, the
synthetic curves match 8 out of the 14 SST data points at the 1![]() level, and 12 of them at the 3
level, and 12 of them at the 3![]() level. The fit is, however, not perfect since the model gives a flux
that is too large by
level. The fit is, however, not perfect since the model gives a flux
that is too large by ![]() 8%
close to the maximum, too low by
8%
close to the maximum, too low by ![]() 16% close to the minium, and too low by
16% close to the minium, and too low by ![]() 4% close to
the middle of the plateau. These discrepancies are discussed in the
next section.
4% close to
the middle of the plateau. These discrepancies are discussed in the
next section.
4.2 Spectral energy distributions
Figure 1
presents the fourteen SEDs of Lutetia over the full spectral range
5-38 ![]() m,
together with the synthetic SEDs from our thermal model for the
combination I = 0 and
m,
together with the synthetic SEDs from our thermal model for the
combination I = 0 and
![]() .
Since the thermal light curves presented in Fig. 3 (upper
panel) were directly obtained by integrating the individual SEDs, we
notice the same discrepancies in the absolute values of the flux at the
extrema (UT
.
Since the thermal light curves presented in Fig. 3 (upper
panel) were directly obtained by integrating the individual SEDs, we
notice the same discrepancies in the absolute values of the flux at the
extrema (UT ![]() 20:17 h
and UT
20:17 h
and UT ![]() 22:25 h)
and at the plateau (UT
22:25 h)
and at the plateau (UT ![]() 00:28 h).
00:28 h).
These discrepancies most likely result from errors in the
shape model. In particular, the c (north/south)
axis of the model is not well constrained, and that could affect the
thermal light curve since Lutetia was viewed by the SST with a nearly
equatorial aspect; any error on c directly
translates to an error on the apparent cross-section and in turn on the
thermal light curve. Projected shadows may furthermore play an
important role in controlling the plateau (UT ![]() 24-27 h),
as illustrated in Fig. 2. A
slightly different local topography could decrease the projected
shadows, and therefore increase the thermal flux of the asteroid to
better match the data. This effect is particularly relevant for
Lutetia, which has a low thermal inertia, and thus an almost
instantaneous response of the surface temperature to insulation.
24-27 h),
as illustrated in Fig. 2. A
slightly different local topography could decrease the projected
shadows, and therefore increase the thermal flux of the asteroid to
better match the data. This effect is particularly relevant for
Lutetia, which has a low thermal inertia, and thus an almost
instantaneous response of the surface temperature to insulation.
Another possible cause of the above discrepancies is
variations in surface roughness. In Fig. 1, the
value of ![]() is assumed constant over the entire surface, but this may not be the
case. Indeed, Nedelcu et al. (2007) and
Busarev (2008), who observed Lutetia with a near equatorial aspect like
we did, reported variations in the spectral slope of Lutetia with
rotational phase in the visible and near-infrared domains.
is assumed constant over the entire surface, but this may not be the
case. Indeed, Nedelcu et al. (2007) and
Busarev (2008), who observed Lutetia with a near equatorial aspect like
we did, reported variations in the spectral slope of Lutetia with
rotational phase in the visible and near-infrared domains.
These variations may stem from inhomogeneities in the surface
roughness, and we quantified this effect by adjusting the ![]() value of our model to fit each observed SED. The results are presented
in Fig. 4
for a zero thermal inertia, which shows a drastic improvement compared
to Fig. 1.
value of our model to fit each observed SED. The results are presented
in Fig. 4
for a zero thermal inertia, which shows a drastic improvement compared
to Fig. 1.
![]() is then a function of rotational phase (Fig. 3, lower
panel), with two regions clearly below the nominal range of
is then a function of rotational phase (Fig. 3, lower
panel), with two regions clearly below the nominal range of
![]() given in Table 2,
at times
given in Table 2,
at times ![]() 22.5 h
and
22.5 h
and ![]() 24.5 h.
For these two particular regions,
24.5 h.
For these two particular regions, ![]() drops to 0.68 and 0.74. According to Lagerros (1998), for a
low albedo surface such as that of Lutetia, a change in roughness from
drops to 0.68 and 0.74. According to Lagerros (1998), for a
low albedo surface such as that of Lutetia, a change in roughness from
![]() (highest value) to
(highest value) to ![]() (lowest value) corresponds to a variation in r.m.s slopes from
(lowest value) corresponds to a variation in r.m.s slopes from ![]() 25
25![]() to
to ![]() 45
45![]() .
With observed values for other asteroids in the range 0-40
.
With observed values for other asteroids in the range 0-40![]() and a mean value around 10
and a mean value around 10![]() (Thomas et al. 2007),
this is likely at the limit of what is physically acceptable. But since
roughness variations and shape effects cannot be separated, the most
plausible explanation is probably a combination of these two effects.
(Thomas et al. 2007),
this is likely at the limit of what is physically acceptable. But since
roughness variations and shape effects cannot be separated, the most
plausible explanation is probably a combination of these two effects.
![\begin{figure}
\par\includegraphics[width=17cm,clip]{14361fig4.ps}
\end{figure}](/articles/aa/full_html/2010/08/aa14361-10/img67.png)
|
Figure 4:
The fourteen SEDs of Lutetia over the full spectral range 5-38 |
| Open with DEXTER | |
![\begin{figure}
\par\begin{tabular}{cccccc}
{\bf A :} CA-18~min &{\bf B :} CA-13~...
...s} &
\includegraphics[width=58mm]{14361fig5j.eps}\\
\end{tabular}
\end{figure}](/articles/aa/full_html/2010/08/aa14361-10/img68.png)
|
Figure 5:
Simulated visible (in black and white) and thermal (in color) images of
asteroid 21 Lutetia during the forthcoming Rosetta flyby on 10 July
2010. Images were calculated at distances of
16 300 km (panel A),
11 800 km (panel B),
7600 km (panel C), 3900 km
(panel D), and 3700 km (panel E)
from the asteroid, corresponding to phase angles of 0 |
| Open with DEXTER | |
While the absolute value of a SED is determined by the size of the
body, its shape is a diagnostic of the thermal properties (thermal
inertia and roughness) of the surface. As we can see in Fig. 4,
the shape of the SEDs is reproduced very well by the different
combinations of I = 0 and ![]() .
We obtained similar results for the other valid combinations of I
and
.
We obtained similar results for the other valid combinations of I
and ![]() presented in Table 2.
This further reinforces our conclusions of a thermal inertia in the
range 0-30 JK-1m-2s-1/2
and a beaming factor in the range
presented in Table 2.
This further reinforces our conclusions of a thermal inertia in the
range 0-30 JK-1m-2s-1/2
and a beaming factor in the range ![]() 0.70-0.83.
0.70-0.83.
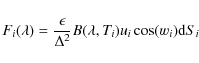
Our result agrees with those of Mueller et al. (2006), I=0-100 JK-1m-2s-1/2, and Carvano et al. (2008), I=5.2+0.9-0.3 JK-1m-2s-1/2. This is also a typical range for large (>100 km) main-belt asteroids, as summarized by Delbó et al. (2009). This suggests that the surface of Lutetia is likely covered by a thick regolith layer, comparable to the Moon, whose thermal inertia was estimated to 43 JK-1m-2s-1/2 by Wesselink (1948).
5 Implications for the Rosetta flyby of 21 Lutetia
The Rosetta spacecraft will fly by asteroid 21 Lutetia on 10 July 2010. Surface temperature measurements will be performed by the VIRTIS (Coradini et al. 1999) and MIRO (Gulkis et al. 2007) instruments. To facilitate the interpretation of these observations, we carried out a simulation of the flyby using the OASIS simulator (Jorda et al. 2010) and a more detailed shape model than is presented in Sect. 3.1. This refined model is composed of 131 072 facets. To make it more realistic, a random distribution of craters was added to the surface, and local topography was simulated using an algorithm that generates fractal terrains.
As illustrated in Fig. 5, we calculated
the images that will be obtained by the ORISIS narrow angle camera
(NAC) at different times during the flyby and the corresponding surface
temperature maps for the combination of thermal parameters I
= 0 and ![]() .
During approach, the geometry is relatively constant and the aspect
angle does not change significantly; surface temperatures vary between
200 K and 260 K on the illuminated side. The warmest
region is located close to the subsolar point, but many hot spots
(>250 K) are also visible at larger zenithal angles,
mainly in craters where incident angles are small. After closest
approach, at larger phase angles, hot spots facing the Sun are hidden
by the local topography (crater rims), and we only see cold regions,
most of them with temperatures below
.
During approach, the geometry is relatively constant and the aspect
angle does not change significantly; surface temperatures vary between
200 K and 260 K on the illuminated side. The warmest
region is located close to the subsolar point, but many hot spots
(>250 K) are also visible at larger zenithal angles,
mainly in craters where incident angles are small. After closest
approach, at larger phase angles, hot spots facing the Sun are hidden
by the local topography (crater rims), and we only see cold regions,
most of them with temperatures below ![]() 230 K.
230 K.
6 Conclusions
Our SST observations of asteroid 21 Lutetia, the second target of the Rosetta mission, have enabled us to ascertain its physical properties. Our main findings are summarized below.
- 1.
- The thermal inertia is in the range 0-30 JK-1m-2s-1/2. This value is consistent with the results of Mueller et al. (2006) and Carvano et al. (2008), and typical of large main belt asteroids (Delbó et al. 2009). This low thermal inertia implies that the surface of Lutetia is likely covered by a thick regolith layer, but it does not really constrain its composition (stony, metallic, or mixed) since it prominently results from voids in the (loose) regolith.
- 2.
- The upper limit of the thermal inertia of 30 JK-1m-2s-1/2
is, in fact, constrained by the lower limit imposed on the beaming
factor
 .
For a zero thermal inertia as favored by our modeling, we obtained
.
For a zero thermal inertia as favored by our modeling, we obtained
 .
Since our beaming factor only reflects the effects of surface rugosity
(Lagerros 1998),
the above result indicates that the surface roughness of Lutetia is
larger than on other asteroids (Thomas et al. 2007), with an
average slope over
.
Since our beaming factor only reflects the effects of surface rugosity
(Lagerros 1998),
the above result indicates that the surface roughness of Lutetia is
larger than on other asteroids (Thomas et al. 2007), with an
average slope over  25
25 .
.
- 3.
- There is evidence of inhomogeneities in the surface
roughness in the
equatorial band of Lutetia with two particular regions where
 drops
to 0.68 and 0.74, the lowest value implying slopes up to 45.
drops
to 0.68 and 0.74, the lowest value implying slopes up to 45.
- 4.
- To first order, the current shape model of Lutetia provides a good fit to the thermal light curve, indicating that it is already quite accurate.
- 5.
- However, small discrepancies between the synthetic and observed thermal light curves could result from shape uncertainties on the c axis (north/south direction), projected shadows due to local topographic uncertainties, and roughness inhomogeneities as mentioned above.
This work is based on observations made with the Spitzer Space Telescope, which is operated by the Jet Propulsion Laboratory, California Institute of Technology under a contract with NASA. We thank the SST ground system personnel for their prompt and efficient scheduling of the observations. We are grateful to I. Belskaya for making her results available to us in advance of publication.
References
- Barucci, M. A., Fulchignoni, M., Fornasier, et al. 2005, A&A, 430, 313 [NASA ADS] [CrossRef] [EDP Sciences] [Google Scholar]
- Belskaya, I. N., Fornasier, S., Krugly, Y. N., et al. 2010, A&A, 515, A29 [NASA ADS] [CrossRef] [EDP Sciences] [Google Scholar]
- Bowell, E., Hapke, B., Domingue, D., et al. 1989, In Asteroids II, ed. R. P. Binzel, T. Gehrels, & M. S. Matthews (Tucson: Univ. of Arizona Press), 524 [Google Scholar]
- Busarev, V. V. 2008, ACM conference, abstract 8010 [Google Scholar]
- Carry, B., Kaasalainen, M., Leyrat, C., et al. 2010, A&A, submitted [Google Scholar]
- Carvano, J. M., Barucci, M. A., Delbó, M., et al. 2008, A&A, 479, 241 [NASA ADS] [CrossRef] [EDP Sciences] [Google Scholar]
- Coradini, A., Capaccioni, F., Drossart, P., et al. 1999, Adv. Space Res., 24, 1095 [NASA ADS] [CrossRef] [Google Scholar]
- Delbó, M., & Tanga, P. 2009, Planet Space Sci., 57, 259 [CrossRef] [Google Scholar]
- Drummond, J., D., Conrad, A., Merline, W., & Carry, B. 2009, DPS meeting 41, 59.07 [Google Scholar]
- Groussin, O. Lamy, P., & Jorda, L. 2004, A&A, 413, 1163 [NASA ADS] [CrossRef] [EDP Sciences] [Google Scholar]
- Gulkis, S., Frerking, M., Crovisier, et al. 2007, Space Sci. Rev., 128, 561 [NASA ADS] [CrossRef] [Google Scholar]
- Houck, J. R., Roellig, T. L., van Cleve, J., et al. 2004, ApJS, 154, 18 [NASA ADS] [CrossRef] [Google Scholar]
- Jorda, L., Spjuth, S., Keller, H. U., Lamy, P., & Llebaria, A. 2010, SPIE, submitted [Google Scholar]
- Keller, H. U., Barbieri, C., Koschny, D., et al. 2010, Science, 327, 190 [NASA ADS] [CrossRef] [PubMed] [Google Scholar]
- Lagerros, J. S. V. 1996, A&A, 310, 1011 [NASA ADS] [Google Scholar]
- Lagerros, J. S. V. 1998, A&A, 332, 1123 [NASA ADS] [Google Scholar]
- Lamy, P., Jorda, L., Fornasier, S., et al. 2008, A&A, 487, 1187 [NASA ADS] [CrossRef] [EDP Sciences] [Google Scholar]
- Lamy, P., Faury, G., Jorda, L., Kassalainen, M., & Hviid, S. F. 2010, A&A, accepted [Google Scholar]
- Mueller, M., Harris, A. W., Bus, S. J., et al. 2006, A&A, 447, 1153 [NASA ADS] [CrossRef] [EDP Sciences] [Google Scholar]
- Nedelcu, D. A., Birlan, M., Vernazza, P., et al. 2007, A&A, 470, 1157 [NASA ADS] [CrossRef] [EDP Sciences] [Google Scholar]
- Tedesco, E. F., Veeder, G. J., Fowler, J. W., & Chillemi, J. R. 1992, in The IRAS Minor planet Survey, Tech. Rep. PL-TR-92-2049, Phillips Laboratory, Hanscom Air Force Base, Massachusetts [Google Scholar]
- Thomas, P. C., Veverka, J., Belton, M. J. S., et al. 2007, Icarus, 187, 4 [NASA ADS] [CrossRef] [Google Scholar]
- Torppa, J., Kaasalainen, M., Michalowski, T., et al. 2006, Icarus, 164, 346 [Google Scholar]
- Weaver, H. A., Feldman, P. D., Merline, W. J., et al. 2010, A&A, accepted [Google Scholar]
- Werner, M. W., Roellig, T. L., & Low, F. J. 2004, ApJS, 154, 1 [Google Scholar]
- Wesselink, A. J. 1948, Bull. Astron. Inst. Neth., 10, 351 [NASA ADS] [Google Scholar]
All Tables
Table 1: Observational circumstances for the observations of 21 Lutetia with the SST on 10 and 11 December 2005.
Table 2:
Thermal inertia I and beaming factor ![]() of asteroid 21 Lutetia derived from the SST data, for two different
values of the geometric albedo.
of asteroid 21 Lutetia derived from the SST data, for two different
values of the geometric albedo.
All Figures
|
|
Figure 1:
The fourteen SEDs of Lutetia over the full spectral range 5-38 |
| Open with DEXTER | |
| In the text | |
|
|
Figure 2:
Fourteen views of Lutetia as it would have appeared to the SST in the
visible (i.e., reflected light) at the time of the 14 visits.
The orientation is such that the aspect angle (defined as the angle
between the spin vector and the asteroid-observer vector) equals |
| Open with DEXTER | |
| In the text | |
|
|
Figure 3:
Upper panel: Thermal light curves of asteroid
21 Lutetia. The symbols correspond to the SST observations (the open
squares correspond to phased-folded data points). The solid line
corresponds to the synthetic thermal light curve with the combination (
|
| Open with DEXTER | |
| In the text | |
|
|
Figure 4:
The fourteen SEDs of Lutetia over the full spectral range 5-38 |
| Open with DEXTER | |
| In the text | |
|
|
Figure 5:
Simulated visible (in black and white) and thermal (in color) images of
asteroid 21 Lutetia during the forthcoming Rosetta flyby on 10 July
2010. Images were calculated at distances of
16 300 km (panel A),
11 800 km (panel B),
7600 km (panel C), 3900 km
(panel D), and 3700 km (panel E)
from the asteroid, corresponding to phase angles of 0 |
| Open with DEXTER | |
| In the text | |
Copyright ESO 2010
Current usage metrics show cumulative count of Article Views (full-text article views including HTML views, PDF and ePub downloads, according to the available data) and Abstracts Views on Vision4Press platform.
Data correspond to usage on the plateform after 2015. The current usage metrics is available 48-96 hours after online publication and is updated daily on week days.
Initial download of the metrics may take a while.