| Issue |
A&A
Volume 516, June-July 2010
|
|
|---|---|---|
| Article Number | A114 | |
| Number of page(s) | 5 | |
| Section | The Sun | |
| DOI | https://doi.org/10.1051/0004-6361/200913978 | |
| Published online | 22 July 2010 | |
Derivation of stochastic differential equations for sunspot activity
E. J. Allen - C. Huff
Department of Mathematics and Statistics, Texas Tech University, Lubbock, TX 79409-1042, USA
Received 28 December 2009 / Accepted 12 April 2010
Abstract
Aims. A system of stochastic differential equations (SDEs) is derived for sunspot activity.
Methods. The SDE derivation relies on basic assumptions about a
cyclic but randomly varying source of sunspots and on an average
lifetime for sunspots. The SDE model parameters are fit to sunspot data
for three different 11-year sunspot cycles. Results of calculations for
the SDE system are compared with the data for each of the three sunspot
cycles.
Results. Certain characteristics are shared by both the SDE
model and the data. In particular, the second and third moments about
the mean divided by the mean are similar for the SDE system and for the
data and appear to be approximately constant over the cycle.
Key words: Sun: activity - sunspots
1 Introduction
There has been much interest in developing mathematical models to describe sunspot activity as exemplified by the investigations of Charbonneau (2005), Haviland (1996), Orfila et al. (2002), Sello (2003), or Spiegel & Wolf (1987). It is now generally accepted that magnetic cycles in the Sun are generated by a solar dynamo produced through nonlinear interactions between solar plasmas and magnetic fields as reviewed by Choudhuri (2000). It appears that the average or large-scale features of the solar cycle can be explained by solar dynamo models (Cameron & Schüssler 2007; Charbonneau 2005; Choudhuri 2000; Dikpati et al. 2006, 2007; or Passos 2008). However, as pointed out, for example by Passos (2008), the variation in the amplitude and period in the 11-year cycle is still difficult to understand. Also, as indicated by Letellier et al. (2006) or Usoskin (2008), it still appears that uncertainty exists about whether the irregularities in the sunspot cycle can be best described by using deterministic or stochastic models, that is, whether the observations favor an explanation in terms of chaotic dynamics or stochastic dynamics. The chaotic behavior of the cycle has been studied with some success, for example, by Jevtic et al. (2001), Letellier et al. (2006), or Orfila et al. (2002). Chaotic processes involve deterministic (predictable) dynamical systems that are sensitive to initial conditions and can appear to be random. In principle, the solar dynamo is deterministic, hence, predictable. In practice, however, the variables in this hydromagnetic process may be inaccurately known so random models may be useful.
In the present investigation, simple, basic assumptions are made that involve the presence of a cyclic but randomly varying solar source of sunspots along with an average lifetime of sunspots. Using these basic assumptions, a system of two stochastic differential equations (SDEs) is derived for the dynamics of the sunspot source and for the number of sunspots.
The parameters in the SDE model are estimated by a least-squares method using sunspot data for three different 11-year cycles. The derived model is compared with the sunspot data for the three 11-year cycles. It is observed that certain characteristics are shared by both the SDE model and the data. In particular, the second and third moments about the mean divided by the mean are similar for the SDE model and the data and appear to be approximately constant over the sunspot cycle. The results indicate that the dynamics of a simple stochastic model, derived from a few basic assumptions, have certain features in common with the complex dynamics of sunspot activity.
2 Sunspot data
The data used in this research were obtained from the United States National Geophysical Data Center, NGDC, which provides long-term scientific data stewardship for the nation's geophysical data. Daily sunspot data were obtained from NGDC for the three 11-year cycles from 1943 to 1953, 1954 to 1964, and 1965 to 1975. The three solar cycles were chosen somewhat arbitrarily in the present investigation. However, the cycles were selected to be three successive cycles occurring within the last century with somewhat different levels of sunspot activity.
There are few sunspots at the beginning and end of each 11-year sunspot cycle with a corresponding increase in noise in the sunspot data. To reduce the influence of this noisy data in estimating model parameters for each 11-year cycle, only 2500 days of data (approximately 7 years of data), with the maximum activity of the cycle located at the center of the 2500 days, are used to fit the model parameters for each cycle.
In Fig. 1, the daily sunspot data is displayed for 2500 days about the maximum activity for each of the three 11-year cycles.
| Figure 1: From left to right, 1943-1953, 1954-1964, and 1965-1975 sunspot data with least squares curves. |
|
| Open with DEXTER | |
Table 1:
Probabilities for the changes in the sunspot source for
small ![]() .
.
3 SDE model derivation
In this section, a derivation is presented of an SDE system that models the number of sunspots with time. There are two basic assumptions made in this derivation. It is hypothesized that there exists a cyclic but randomly varying source of sunspots and, second, it is assumed that sunspots exponentially decay, i.e., sunspots have an average lifetime inversely proportional to their decay rate. To derive the SDE model, it is useful to define a few variables:
- q(t):
- randomly varying source of sunspots;
- n(t):
- the number of sunspots at time t;
 :
:
- average lifetime of a sunspot in days;
-
 :
:
- the probability that a sunspot decays in time
 ;
;
-
 :
:
- the mean or equilibrium sunspot source.
To develop the SDE model for sunspot activity, the possible
changes in the sunspot source and in the number of sunspots are
determined for a small interval of time ![]() .
(See, for
example, Allen 2007, Allen et al. 2008; or
Allen 2003, for a description of a procedure to derive
accurate SDE models.) In Table 1, the changes and
probabilities in the sunspot source and in the number of sunspots
are listed for a small time interval. This table defines a
discrete stochastic model for the sunspot source and for the
number of sunspots. The forms of the probability terms are selected so that the
sunspot source does not wander randomly away from the equilibrium
sunspot source
.
(See, for
example, Allen 2007, Allen et al. 2008; or
Allen 2003, for a description of a procedure to derive
accurate SDE models.) In Table 1, the changes and
probabilities in the sunspot source and in the number of sunspots
are listed for a small time interval. This table defines a
discrete stochastic model for the sunspot source and for the
number of sunspots. The forms of the probability terms are selected so that the
sunspot source does not wander randomly away from the equilibrium
sunspot source
![]() .
In particular, the probability terms
.
In particular, the probability terms
![]() result in a drift of the sunspot source,
q(t), toward the equilibrium source
result in a drift of the sunspot source,
q(t), toward the equilibrium source
![]() ,
i.e.,
,
i.e.,
![]() represents the tendency for the sunspot source
to approach
represents the tendency for the sunspot source
to approach
![]() .
The
.
The
![]() term represents a
purely random component in sunspot source changes. For example, if
term represents a
purely random component in sunspot source changes. For example, if
![]() ,
the source strength q(t) adjusts to
,
the source strength q(t) adjusts to
![]() at a
rate determined by the magnitude of
at a
rate determined by the magnitude of ![]() .
Lower values of
.
Lower values of
![]() and higher values of
and higher values of ![]() imply increased randomness
in sunspot activity. For the number of sunspots, the parameter
imply increased randomness
in sunspot activity. For the number of sunspots, the parameter
![]() represents the rate of decay of the sunspots.
represents the rate of decay of the sunspots.
An Itô SDE system for sunspot activity is developed directly
from Tables 1 and 2 and has the form:


where W1(t) and W2(t) are independent Wiener processes and
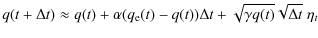
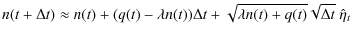
where
Table 2:
Probabilities for the changes in the number of sunspots
for small ![]() .
.
For data analysis and comparison
purposes, it is useful to determine mean values of certain
quantities for SDE model (1). To find these mean
quantities, Itô's formula (Gard 1987; or Kloeden &
Platen 1992) is applied to Eq. (1). The
following ordinary differential equations are then obtained for
expectations of several different powers of q and n where,
e.g.,
E(q2(t)) =E(q2) is the expectation of q2(t):

These differential equations are solved assuming that
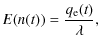
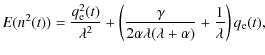
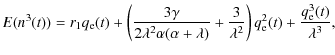
where
Using (3), second and third moments about the mean divided
by the mean are calculated as:
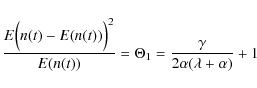
and

Equations (4) and (5) indicate that these ratios are constant independent of time t during the cycle for the SDE model, assuming that
4 Estimation of model parameters
By considering Eq. (1), the parameters
r, a, b, c,
![]() ,
,
![]() ,
and
,
and ![]() need to be estimated to define
the SDE model. The parameter
need to be estimated to define
the SDE model. The parameter ![]() is taken as 1/14days-1 as stated in the previous section. As
is taken as 1/14days-1 as stated in the previous section. As
![]() ,
the values of
r,
a, b, c are estimated by fitting a cosine curve to the number of
sunspots for each cycle for 2500 days around the peak sunspot
activity. Using a least squares procedure, the estimated values
for
r, a, b, c for each of the three sunspot cycles are given in
Table 3, and since t is in days, then b has units of
1/day. For these parameter values, the equilibrium sunspot source,
,
the values of
r,
a, b, c are estimated by fitting a cosine curve to the number of
sunspots for each cycle for 2500 days around the peak sunspot
activity. Using a least squares procedure, the estimated values
for
r, a, b, c for each of the three sunspot cycles are given in
Table 3, and since t is in days, then b has units of
1/day. For these parameter values, the equilibrium sunspot source,
![]() ,
satisfies
,
satisfies
![]() for most values of time tbetween 0 and 2500.
for most values of time tbetween 0 and 2500.
Table 3:
Estimated values of r, a, b, c for
![]() .
.
To estimate the parameters ![]() and
and ![]() ,
it is assumed
that
,
it is assumed
that ![]() is equal to
is equal to ![]() where k is a constant
which is the same for all sunspot cycles. By considering SDE (1) for the sunspot source, i.e.,
where k is a constant
which is the same for all sunspot cycles. By considering SDE (1) for the sunspot source, i.e.,
![]() ,
then if
,
then if
![]() ,
values of
,
values of
![]() ensure that the sunspot
source, q(t), is nonnegative with probability unity as inferred
from Allen (2007). In addition, if
ensure that the sunspot
source, q(t), is nonnegative with probability unity as inferred
from Allen (2007). In addition, if
![]() ,
test simulations with the SDE model (1), with estimated
values of
,
test simulations with the SDE model (1), with estimated
values of ![]() ,
do not produce good comparisons with the
sunspot data. To satisfy these constraints on
,
do not produce good comparisons with the
sunspot data. To satisfy these constraints on ![]() ,
i.e.,
,
i.e.,
![]() ,
,
![]() is set equal to
is set equal to ![]() in the present investigation. (This is not a strong
assumption as the results of the SDE model are relatively
insensitive to values of
in the present investigation. (This is not a strong
assumption as the results of the SDE model are relatively
insensitive to values of
![]() between 2 and 6.) Also,
assuming a fixed ratio of
between 2 and 6.) Also,
assuming a fixed ratio of
![]() ,
expression (4)
for
,
expression (4)
for ![]() indicates greater variability in the sunspot
activity with smaller estimated values of
indicates greater variability in the sunspot
activity with smaller estimated values of ![]() and
and ![]() .
.
To estimate ![]() ,
assuming a fixed ratio of
,
assuming a fixed ratio of
![]() ,
the value of
,
the value of ![]() in Eq. (4) is estimated using
a least squares procedure for each sunspot cycle. Specifically, a
least squares procedure is first used to estimate the parameters
r,a,b, and c by minimizing for each cycle
in Eq. (4) is estimated using
a least squares procedure for each sunspot cycle. Specifically, a
least squares procedure is first used to estimate the parameters
r,a,b, and c by minimizing for each cycle
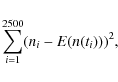
where ni is the ith data value for the number of sunspots and
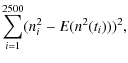
where, by (3),

where
The lower values of ![]() and
and ![]() for the 1943-1953
cycle indicate that the sunspot activity for that cycle
experienced a greater level of variability than the other two
cycles. Indeed, the estimated values for
for the 1943-1953
cycle indicate that the sunspot activity for that cycle
experienced a greater level of variability than the other two
cycles. Indeed, the estimated values for ![]() for the three
successive cycles are 16.76, 12.13, and 12.10, respectively,
indicating that the 1943-1953 cycle experienced greater
variability in the sunspot activity than the other two cycles.
Estimated values of a, b, and c are approximately the same
for all three cycles indicating a similar shape in the sunspot
levels throughout the cycles. The value of r changes for each
cycle and is related to the occurrence of different levels of
sunspot activity for each cycle.
for the three
successive cycles are 16.76, 12.13, and 12.10, respectively,
indicating that the 1943-1953 cycle experienced greater
variability in the sunspot activity than the other two cycles.
Estimated values of a, b, and c are approximately the same
for all three cycles indicating a similar shape in the sunspot
levels throughout the cycles. The value of r changes for each
cycle and is related to the occurrence of different levels of
sunspot activity for each cycle.
5 Comparisons between SDE model and data
In this section, comparisons between the SDE model and the data are described. In particular, similarities between the data and the SDE model are discussed such as the behavior of the second and third moments about the mean divided by the mean.
The data for the three sunspot cycles are compared in Figs. 1-4. The sunspot data along with least squares curves are given in Fig. 1. In Fig. 1, the pronounced maximum activity near day 1250 is clearly seen. In Figs. 2-4, the sunspot data for each cycle is analyzed for fifty 50-day intervals for each 2500-day interval. In Fig. 2, the mean number of sunspots is plotted for each of the fifty 50-day periods. Ratios of second and third moments about the mean divided by the mean are obtained for each 50-day period and are plotted in Figs. 3 and 4. From these figures, no pronounced maximum occurs in the ratios of second and third moments about the mean divided by the mean. Indeed, although variations are present throughout the 2500 days, these ratios appear to be roughly constant for each sunspot cycle.
| Figure 2: Average number of sunspots for 1943-1953, 1954-1964, and 1965-1975 cycles for fifty 50-day periods. |
|
| Open with DEXTER | |
| Figure 3: Ratio of second moment about the mean to the mean for fifty 50-day periods for the three successive sunspot cycles. |
|
| Open with DEXTER | |
| Figure 4: Ratio of third moment about the mean to the mean for fifty 50-day periods for the three successive sunspot cycles. |
|
| Open with DEXTER | |
Next, the SDE model is studied. First, SDE system (1), with the estimated parameter values of Table 3, are simulated for 2000 sample paths using the Euler-Maruyama method. Two sample paths and the mean path are given in Fig. 5 for each sunspot cycle. It is clear that the simulations are similar to the sunspot data of Fig. 1. As derived in Eqs. (4) and (5), the SDE system has the feature that the ratios of second and third moments about the mean divided by the mean are constant, independent of time, throughout the sunspot cycle. Calculated ratios of second and third moments about the mean to the mean for 2000 sample paths of the SDE system are given in Figs. 6 and 7 where it is clearly illustrated that the calculated ratios are constant and independent of time in the three sunspot cycles. The ratios in these figures are averaged over 2000 sample paths and, thus, have relatively little variability over the 2500 days.
| Figure 5: Two calculated sample paths and average path for the SDE model for each cycle. |
|
| Open with DEXTER | |
| Figure 6: Average calculated ratio of second moment about the mean to the mean for 2000 sample paths of the SDE model for each cycle. |
|
| Open with DEXTER | |
| Figure 7: Average calculated ratio of third moment about the mean to the mean for 2000 samples paths of the SDE model for each cycle. |
|
| Open with DEXTER | |
Table 4: Ratios of second and third moments about the mean divided by the mean, R2 and R3, for the data and for the SDE model using 2000 sample paths.
The ratios of the second and third moments about the mean to the mean for the SDE model and for the data are similar. The values for the 1954-1964 sunspot cycle differ by about 30%. However, for sunspot cycles 1943-1953 and 1954-1964, the ratios of second moment about the mean to the mean are quite close and differ by less than 10%.6 Summary and conclusions
A simple SDE model for sunspot activity is derived. In this derivation, basic assumptions are made about a sunspot source and lifetime of sunspots. The primary assumption in the derivation is that the source of sunspots randomly varies about a periodic mean sunspot source. A second assumption is that sunspots decay with an average lifetime of 14 days. (In a more detailed SDE derivation, the lifetime of sunspot groups may be treated separately from the lifetime of individual sunspots.) It is shown for the SDE system that the second and third moments about the mean divided by the mean are constant, independent of time in the cycle.
The parameters of the SDE system are estimated for three successive sunspot cycles. Only 2500 days of highest sunspot activity for each cycle is used to avoid noisy data.
The SDE model is compared with the data for three sunspot cycles. An unexpected and interesting result is that certain similarities are shared by the SDE model and by the data. In particular, it appears that the variance and the third moment about the mean are both approximately proportional to the mean number of sunspots throughout the cycle for both the SDE model and the sunspot data.
AcknowledgementsThe authors are grateful to the anonymous reviewer and to the editor, Hardi Peter, for their helpful comments.
References
- Allen, E. J. 2007, Modeling With Itô Stochastic Differential Equations (Dordrecht: Springer) [Google Scholar]
- Allen, E. J., Allen, L. J. S., Arciniega, A., & Greenwood, P. E. 2008, Stoch Anal Appl, 26, 274 [Google Scholar]
- Allen, L. J. S. 2003, An Introduction to Stochastic Processes with Applications to Biology (Upper Saddle River, New Jersey: Pearson Education Inc.) [Google Scholar]
- Cameron, R., & Schüssler, M. 2007, ApJ, 659, 801 [NASA ADS] [CrossRef] [Google Scholar]
- Charbonneau, P. 2005, Living Rev. Solar Phys., 2, http://solarphysics.livingreviews.org/Articles/ [Google Scholar]
- Choudhuri, A. R. 2000, J. Astrophys. Astron, 21, 373 [NASA ADS] [Google Scholar]
- Dikpati, M., de Toma, G., & Gilman, P. A. 2006, Geophys. Res. Lett., 33, L05102 [NASA ADS] [CrossRef] [Google Scholar]
- Dikpati, M., Gilman, P. A., de Toma, G., & Ghosh, S. S. 2007, Sol. Phys., 245, 1 [NASA ADS] [CrossRef] [Google Scholar]
- Gard, T. C. 1987, Introduction to Stochastic Differential Equations (New York: Marcel Decker) [Google Scholar]
- Haviland, R. P. 1996, IEEE Antennas and Propagation Magazine, 37, 38 [NASA ADS] [CrossRef] [Google Scholar]
- Huff, C. 2009, Thesis in Mathematics and Statistics, Texas Tech University [Google Scholar]
- Jevtic, N., Schweitzer, J. S., & Cellucci, C. J. 2001, A&A, 379, 611 [NASA ADS] [CrossRef] [EDP Sciences] [Google Scholar]
- Kloeden, P. E., & Platen, E. 1992, Numerical Solution of Stochastic Differential Equations (New York: Springer-Verlag) [Google Scholar]
- Kloeden, P. E., Platen, E., & Schurz, H. 1994, Numerical Solution of SDE Through Computer Experiments (Berlin: Springer) [Google Scholar]
- Kopecký, M. 1960, BAC, 11, 110 [NASA ADS] [Google Scholar]
- Letellier, C., Aguirre, L. A., Maquet, J., & Gilmore, R. 2006, A&A, 449, 379 [Google Scholar]
- NGDC, National Geophysical Data Center, Boulder, Colorado, http://www.ngdc.noaa.gov/stp/SOLAR/ftpsunspotnumber.html [Google Scholar]
- Orfila, A., Ballester, J. L., Oliver, R., Alvarez, A., & Tintore, J. 2002, A&A, 386, 313 [NASA ADS] [CrossRef] [EDP Sciences] [Google Scholar]
- Passos, D., & Lopes, I. 2008, ApJ, 686, 1420 [NASA ADS] [CrossRef] [Google Scholar]
- Sello, S. 2003, A&A, 410, 691 [NASA ADS] [CrossRef] [EDP Sciences] [Google Scholar]
- Spiegel, E. A., & Wolf, A. N. 1987, Annals of the New York Academy of Sciences, 497, 55 [NASA ADS] [CrossRef] [Google Scholar]
- Taylor, P. O. 1992, Observing the Sun (New York: Cambridge University Press) [Google Scholar]
- Usoskin, I. G. 2008, Living Rev. Solar Phys., 5, http://solarphysics.livingreviews.org/Articles/ [Google Scholar]
All Tables
Table 1:
Probabilities for the changes in the sunspot source for
small ![]() .
.
Table 2:
Probabilities for the changes in the number of sunspots
for small ![]() .
.
Table 3:
Estimated values of r, a, b, c for
![]() .
.
Table 4: Ratios of second and third moments about the mean divided by the mean, R2 and R3, for the data and for the SDE model using 2000 sample paths.
All Figures
| |
Figure 1: From left to right, 1943-1953, 1954-1964, and 1965-1975 sunspot data with least squares curves. |
| Open with DEXTER | |
| In the text | |
| |
Figure 2: Average number of sunspots for 1943-1953, 1954-1964, and 1965-1975 cycles for fifty 50-day periods. |
| Open with DEXTER | |
| In the text | |
| |
Figure 3: Ratio of second moment about the mean to the mean for fifty 50-day periods for the three successive sunspot cycles. |
| Open with DEXTER | |
| In the text | |
| |
Figure 4: Ratio of third moment about the mean to the mean for fifty 50-day periods for the three successive sunspot cycles. |
| Open with DEXTER | |
| In the text | |
| |
Figure 5: Two calculated sample paths and average path for the SDE model for each cycle. |
| Open with DEXTER | |
| In the text | |
| |
Figure 6: Average calculated ratio of second moment about the mean to the mean for 2000 sample paths of the SDE model for each cycle. |
| Open with DEXTER | |
| In the text | |
| |
Figure 7: Average calculated ratio of third moment about the mean to the mean for 2000 samples paths of the SDE model for each cycle. |
| Open with DEXTER | |
| In the text | |
Copyright ESO 2010
Current usage metrics show cumulative count of Article Views (full-text article views including HTML views, PDF and ePub downloads, according to the available data) and Abstracts Views on Vision4Press platform.
Data correspond to usage on the plateform after 2015. The current usage metrics is available 48-96 hours after online publication and is updated daily on week days.
Initial download of the metrics may take a while.