| Issue |
A&A
Volume 516, June-July 2010
|
|
|---|---|---|
| Article Number | A7 | |
| Number of page(s) | 6 | |
| Section | Cosmology (including clusters of galaxies) | |
| DOI | https://doi.org/10.1051/0004-6361/200913458 | |
| Published online | 16 June 2010 | |
Fitting functions for a disk-galaxy model with different  CDM-halo profiles
(Research Note)
L. Darriba - J. M. Solanes
Departament d'Astronomia i Meteorologia and Institut de Ciències del Cosmos, Universitat de Barcelona, C/ Martí i Franquès, 1, 08028 Barcelona, Spain
Received 13 October 2009 / Accepted 7 April 2010
Abstract
Aims. We present an adaptation of the standard scenario of disk-galaxy formation to the concordant ![]() CDM
cosmology aimed to derive analytical expressions for the scale length
and rotation speed of present-day disks that form within four
different, cosmologically motivated protogalactic dark matter
halo-density profiles.
CDM
cosmology aimed to derive analytical expressions for the scale length
and rotation speed of present-day disks that form within four
different, cosmologically motivated protogalactic dark matter
halo-density profiles.
Methods. We invoke a standard galaxy-formation model that
includes virial equilibrium of spherical dark halos, specific angular
momentum conservation during gas cooling, and adiabatic halo response
to the gas inflow. The mean mass-fraction and mass-to-light ratio of
the central stellar disk are treated as free parameters whose values
are tuned to match the zero points of the observed size-luminosity and
circular speed-luminosity relations of galaxies.
Results. We supply analytical formulas for the characteristic size and rotation speed of disks built inside Einasto r1/6,
Hernquist, Burkert, and Navarro-Frenk-White dark matter halos. These
expressions match simultaneously the observed zero points and slopes of
the different correlations that can be built in the ![]() space of disk galaxies from plausible values of the galaxy- and star-formation efficiencies.
space of disk galaxies from plausible values of the galaxy- and star-formation efficiencies.
Key words: dark matter - galaxies: formation - galaxies: fundamental parameters - galaxies: spiral - galaxies: structure
1 Introduction
In the current hierarchical galaxy-formation paradigm disk-galaxies
are born out of the hot gas-atmospheres associated with the potential
well of virialized cold dark matter (CDM) halos. It is assumed that
baryons have initially both the same density profile and specific
angular momentum distribution as DM - the latter achieved, for
instance, through tidal interactions with neighboring objects in the
precollapse phase (e.g. Peebles 1969). As the gas radiates its
energy it cools and starts to fall towards the center of the DM halo
maintaining its specific angular momentum, where it settles into a
rotationally supported disk. The assembly of a concentration of cold
baryons at the bottom of the gravitational potential well on
timescales longer than the free-fall time produces the adiabatic
contraction of the dark halo![]() . In this standard picture, the internal
properties of disk galaxies are expected to be largely dictated by
those of their host halos, and through the latter, by those of the
background cosmology too.
. In this standard picture, the internal
properties of disk galaxies are expected to be largely dictated by
those of their host halos, and through the latter, by those of the
background cosmology too.
Theoretical predictions for the distribution of disk galaxies in the space of disk scalelength (or size), fiducial (usually, maximum or asymptotic) rotational speed, and luminosity (or mass) based, partially or totally, on the scenario just outlined are abundant in the literature e.g., Mo et al. 1998, hereafter MMW; Pizagno et al. 2005; Dutton et al. 2007. They are widely used in semi-analytic cosmological models, pre-prepared numerical simulations of galaxy groups and clusters, and studies of disk-galaxy scaling relations.
While nowadays there are extensive and comprehensive investigations of
the correlations between disk-galaxy properties that deal with the
scatter and covariances of the variables and allow for different modes
of halo contraction (e.g. Dutton et al. 2007), it is not always feasible
to implement such sophisticated treatments whenever one needs to
estimate the scaling of the basic structural and kinematic parameters
of galaxies. The simplest alternative is the use of scaling laws
derived directly from fits to a given set of observations. However,
because of their lack of theoretical foundation, these formulas cannot
be extrapolated to explain the properties of galaxies other than those
from which they are derived. Halfway between these two options is
the possibility of using analytical expressions endowed with a
physical basis that enables their application to a wide range of
galactic and halo parameters. It is precisely with this aim that we
here introduce a self-consistent pure disk-formation model that
follows the well-known approach by MMW adapted to the
canonical ![]() CDM concordance cosmology and to four different
mass-density distributions for the protogalactic dark halos. This
updated scenario is capable of matching simultaneously with
very good accuracy the zero points and slopes of the observed
correlations in the
CDM concordance cosmology and to four different
mass-density distributions for the protogalactic dark halos. This
updated scenario is capable of matching simultaneously with
very good accuracy the zero points and slopes of the observed
correlations in the ![]() space of disk galaxies from reasonably
realistic values of its input parameters. Yet its most valuable
characteristic is its ease of implementation, as we approximated
the model predictions for the scale length and rotation speed of disks
by analytical expressions. The supplied equations can come in handy
for situations that require the generation of large numbers of
galaxies with intrinsic attributes in good agreement with the mean
observed trends, especially when the relative abundances of these
objects are known in advance.
space of disk galaxies from reasonably
realistic values of its input parameters. Yet its most valuable
characteristic is its ease of implementation, as we approximated
the model predictions for the scale length and rotation speed of disks
by analytical expressions. The supplied equations can come in handy
for situations that require the generation of large numbers of
galaxies with intrinsic attributes in good agreement with the mean
observed trends, especially when the relative abundances of these
objects are known in advance.
2 Model components
We recap here the key assumptions and associated equations of our
self-consistent ![]() CDM-model of disk-galaxy formation:
CDM-model of disk-galaxy formation:
- 1.
- In the protogalactic state, the (hot) baryons and dark matter are well mixed within virialized spherical halos. Both components have the same distribution of specific angular momentum.
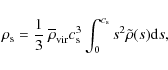
which, according to the results of N-body simulations, follows a lognormal distribution with median
The halo concentration parameter, c, characterizes the overall shape
of a halo density profile by measuring the ratio between its outer
radius and inner scalelength. Originally introduced for the
Navarro-Frenk-White function, its mean values are strongly correlated
with the halo mass given a cosmology (e.g. Navarro et al. 1997). We
approximate the mean concentration-mass relation at z=0 in the range
of halo masses of interest,
![]() ,
by the best-fitting power-law relation recently inferred by
Macciò et al. (2008) from relaxed halos simulated in the Wilkinson Microwave
Anisotropy Probe 5 years results (WMAP5) cosmology
,
by the best-fitting power-law relation recently inferred by
Macciò et al. (2008) from relaxed halos simulated in the Wilkinson Microwave
Anisotropy Probe 5 years results (WMAP5) cosmology
![\begin{displaymath}
c(M_{{\rm vir}},0)=9.35\left[\frac{M_{{\rm vir}}}{10^{12}~h^{-1}M_\odot}\right]^{-0.094},
\end{displaymath}](/articles/aa/full_html/2010/08/aa13458-09/img27.png)
where
- 1.
- Disks form smoothly out of cooling flows preserving the specific angular momentum of the baryons. The cold gas settles in centrifugal equilibrium at the center of the halo's potential well following an exponential distribution.
where the values of this parameter, for which a plausible upper limit is the universal baryon fraction
The common yet uncertain assumption that the specific angular momenta of the central disk galaxy and of the halo hosting it are equal,
On the other hand, a thin exponential mass distribution of total mass
![]() ,
surface density
,
surface density
![]() ,
and a rotation curve V(R), has a total angular momentum
,
and a rotation curve V(R), has a total angular momentum
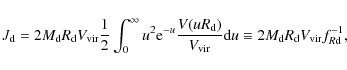
where the factor
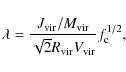
with R the cylindrical radius. An expression for
Substituting Eqs. (1), (3), and (4) into
Eq. (5), one can then obtain the disk scalelength as a function
of the model parameters
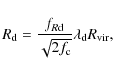
with
- 1.
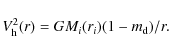
- The halo contracts adiabatically and without shell crossing to gas inflow.
| (8) |
where ri and r are, respectively, the initial and final radius of the spherical shells, Mi(r) is the initial protogalactic halo mass profile, and
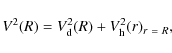
The contribution to the total rotation curve (Eq. [6]) from
the dark matter (and the remaining hot baryons) is therefore
Taking into account that both halo and disk properties are directly proportional to their corresponding virial parameters, Eq. (6) allows one to express the amplitude of the total rotation curve at a given number of scalelengths and, in particular, its peak value,
with
3 Model predictions
We now proceed to tune the free parameters of our disk-galaxy
formation model to match the scaling relations in ![]() space observed at
space observed at ![]() .
For a given halo virial mass, two are the
free parameters in our modeling: the disk mass fraction,
.
For a given halo virial mass, two are the
free parameters in our modeling: the disk mass fraction,
![]() ,
and
mass-to-light ratio,
,
and
mass-to-light ratio,
![]() .
This latter quantity is needed
to convert the predicted disk masses into observed luminosities. We do
not allow the average effective disk spin to vary freely however,
but use the condition
.
This latter quantity is needed
to convert the predicted disk masses into observed luminosities. We do
not allow the average effective disk spin to vary freely however,
but use the condition
![]() to set it equal to three
representative values of
to set it equal to three
representative values of ![]() :
0.03, 0.04, and 0.05
:
0.03, 0.04, and 0.05![]() .
.
Table 1: Halo profiles.
We investigated the performance of our model for the
four functional forms of protogalactic DM halos listed in
Table 1. They are among the most representative functions
used in the literature to describe the equilibrium density profiles of
halos generated in CDM N-body simulations. All of them are spherical
density distributions of the form
| (11) |
where
With the aid of the
![]() relation these expressions can be
reduced to uniparametric
relation these expressions can be
reduced to uniparametric![]() density
laws in which the halo structure is fully determined from
density
laws in which the halo structure is fully determined from
![]() .
It
can be shown that
.
It
can be shown that
|
(12) |
where the characteristic concentration
In order to constrain our model predictions, we consider a subset of
the SFI++ sample (Springob et al. 2007) consisting of 649 galaxies also
included in the compilation of ![]() 1300 local field and cluster
spiral galaxies by Courteau et al. (2007). The full SFI++ contains measures of
intrinsic rotation velocity widths reduced to a homogeneous system
based on the 21 cm spectral line, W, as well as absolute I-band
magnitudes for near 5000 spiral galaxies, while the dataset by
Courteau et al. provides inclination-corrected estimates of disk
scalelengths also in the I-band (below both observables
and model parameters will refer to this near-IR band).
1300 local field and cluster
spiral galaxies by Courteau et al. (2007). The full SFI++ contains measures of
intrinsic rotation velocity widths reduced to a homogeneous system
based on the 21 cm spectral line, W, as well as absolute I-band
magnitudes for near 5000 spiral galaxies, while the dataset by
Courteau et al. provides inclination-corrected estimates of disk
scalelengths also in the I-band (below both observables
and model parameters will refer to this near-IR band).
As stated by Catinella et al. (2007), for most intermediate and bright disks
the width of the global H I profile provides a more reliable
observational estimate of the peak rotation velocity than the widths
of H![]() rotation curves, at least for objects not affected by
environmental interactions. This is probably because the latter are
usually evaluated either at a radius where, on average, they are still
rising (e.g.,
rotation curves, at least for objects not affected by
environmental interactions. This is probably because the latter are
usually evaluated either at a radius where, on average, they are still
rising (e.g.,
![]() ), or on the asymptotic part of the optical
disk. Accordingly, we adopt the approximation
), or on the asymptotic part of the optical
disk. Accordingly, we adopt the approximation
![]() ,
where
,
where
![]() is the maximum width of our model total speed curve measured
within
is the maximum width of our model total speed curve measured
within
![]() .
.
3.1 Scaling laws
The distribution of R as a function of V provides the most
effective way of determining the value of
![]() - which for bright
galaxies represents to a good approximation the stellar mass fraction
- that best fits the observations for each one of the values of
- which for bright
galaxies represents to a good approximation the stellar mass fraction
- that best fits the observations for each one of the values of
![]() under consideration. To allow for a more robust comparison between the
model predictions and the data, the RV scaling law has been recast
in the form of the tighter relation between the average specific
angular momentum of disks computed from the fiducial rotation speed of
the galaxies,
under consideration. To allow for a more robust comparison between the
model predictions and the data, the RV scaling law has been recast
in the form of the tighter relation between the average specific
angular momentum of disks computed from the fiducial rotation speed of
the galaxies,
![]() ,
and
,
and
![]() .
In a log-log scale this
relationship is expected to follow a straight line with a slope near 2
and a zero point that is a sensitive function of
.
In a log-log scale this
relationship is expected to follow a straight line with a slope near 2
and a zero point that is a sensitive function of
![]() .
.
In the upper-left panel of Fig. 1, we show the model
relations that best fit the barycenter of the data cloud for the four
halo profiles considered and the central value of
![]() (the best
values of
(the best
values of
![]() obtained for each one of the three values adopted for
obtained for each one of the three values adopted for
![]() are listed in Col. 3 of Table 2). It can be
seen from this plot that our disk models also reproduce the slope of
the observed
are listed in Col. 3 of Table 2). It can be
seen from this plot that our disk models also reproduce the slope of
the observed
![]() scaling law. We note in passing that on the
basis of its location in this diagram, the angular momentum and disk
scale of the Milky Way (MW) are unrepresentative of those of a typical
spiral (see also Hammer et al. 2007).
scaling law. We note in passing that on the
basis of its location in this diagram, the angular momentum and disk
scale of the Milky Way (MW) are unrepresentative of those of a typical
spiral (see also Hammer et al. 2007).
Table 2: Model parameters.
![\begin{figure}
\par\begin{tabular}{cc}
\includegraphics[width=74mm,clip]{13458f...
...
\includegraphics[width=74mm,clip]{13458fg3.eps} &
\end{tabular}
\end{figure}](/articles/aa/full_html/2010/08/aa13458-09/img77.png)
|
Figure 1:
Scale relations for nearby disks. Upper-left:
Disk-specific angular momentum as a function of
|
| Open with DEXTER | |
With
![]() fixed and given that the halo concentration is not allowed
to vary freely, the most sensitive tuning of the other free parameter
of the model,
fixed and given that the halo concentration is not allowed
to vary freely, the most sensitive tuning of the other free parameter
of the model,
![]() ,
is achieved by normalizing the model predictions
to the observed
,
is achieved by normalizing the model predictions
to the observed ![]() relation. For the latter, which is fully
independent of surface brightness (Courteau & Rix 1999; Zwaan et al. 1995), we use the
calibration of the Tully-Fisher (TF) relationship corrected from
observational and sample biases calculated by Masters et al. (2006) using 807
cluster galaxies extracted from the SFI++ catalog, which we rewrite in
the form
relation. For the latter, which is fully
independent of surface brightness (Courteau & Rix 1999; Zwaan et al. 1995), we use the
calibration of the Tully-Fisher (TF) relationship corrected from
observational and sample biases calculated by Masters et al. (2006) using 807
cluster galaxies extracted from the SFI++ catalog, which we rewrite in
the form
to facilitate the comparison with our model predictions. In Eq. (13),
Table 3: Coefficients of the approximations.
The excellent agreement between predictions and observations in the
RV and ![]() planes is maintained for the joint distribution of the
three variables. The lower-left panel of Fig. 1 depicts,
again for the central value of
planes is maintained for the joint distribution of the
three variables. The lower-left panel of Fig. 1 depicts,
again for the central value of
![]() ,
the scatter diagram of central
disk surface density,
,
the scatter diagram of central
disk surface density,
![]() ,
and rotation speed.
We have converted Springob et al.'s data on MI into total disk
luminosities, which in turn have been transformed into disk masses using
the values of
,
and rotation speed.
We have converted Springob et al.'s data on MI into total disk
luminosities, which in turn have been transformed into disk masses using
the values of
![]() derived from the normalization of the
derived from the normalization of the ![]() relation.
It can be seen that our model predictions are once more comfortably close
to both the normalization and, in this case, curved mean trend delineated by
the data.
relation.
It can be seen that our model predictions are once more comfortably close
to both the normalization and, in this case, curved mean trend delineated by
the data.
3.2 Fitting functions for galaxy scaling parameters
By using the values quoted in Cols. 3 and 4 of Table 2
it is straightforward to calculate the average luminosity of a nearby
disk embedded in a halo of given
![]() and
and
![]() .
However, as shown
in Sect. 2, each of the remaining fundamental disk
properties, the characteristic scale and rotation speed, participates
in the calculation of the other. As a result, they can only be
computed by applying an iterative procedure that, despite its fast
convergence, remains cumbersome. For this reason, it is very
convenient to approximate the dimensionless factors
.
However, as shown
in Sect. 2, each of the remaining fundamental disk
properties, the characteristic scale and rotation speed, participates
in the calculation of the other. As a result, they can only be
computed by applying an iterative procedure that, despite its fast
convergence, remains cumbersome. For this reason, it is very
convenient to approximate the dimensionless factors
![]() and
and
![]() appearing in the calculation of
appearing in the calculation of
![]() and
and
![]() (Eqs. (7) and (10), respectively) by fitting
functions. Drawing inspiration from MMW, we propose the
following fitting formulas, which are valid for any of the
protogalactic halo mass density profiles explored:
(Eqs. (7) and (10), respectively) by fitting
functions. Drawing inspiration from MMW, we propose the
following fitting formulas, which are valid for any of the
protogalactic halo mass density profiles explored:
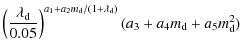

The values of the coefficients corresponding to each profile, which are independent of the adopted
4 Discussion and conclusions
We formulated a standard formation model of disk galaxies inside
DM halos within the concordant ![]() CDM cosmology that
simultaneously predicts with high accuracy the main trends of the
observed fundamental scaling relations of nearby galaxies in
CDM cosmology that
simultaneously predicts with high accuracy the main trends of the
observed fundamental scaling relations of nearby galaxies in ![]() space. This modeling has been developed with the sole aim of deriving
physically sound analytical expressions for predicting the central
properties that characterize the light profiles and rotation curves of
typical spirals. We supply formulas for Einasto r1/6, Hernquist,
Burkert, and Navarro-Frenk-White protogalactic halo mass density
distributions that provide a similarly good overall description of the
data on disks for realistic enough values of the model free
parameters. We find that, for a given
space. This modeling has been developed with the sole aim of deriving
physically sound analytical expressions for predicting the central
properties that characterize the light profiles and rotation curves of
typical spirals. We supply formulas for Einasto r1/6, Hernquist,
Burkert, and Navarro-Frenk-White protogalactic halo mass density
distributions that provide a similarly good overall description of the
data on disks for realistic enough values of the model free
parameters. We find that, for a given
![]() ,
the predictions of the
Einasto r1/6, Hernquist, and Navarro-Frenk-White profiles are
relatively similar, while the Hernquist profile - the only density
law investigated that does not follow a
,
the predictions of the
Einasto r1/6, Hernquist, and Navarro-Frenk-White profiles are
relatively similar, while the Hernquist profile - the only density
law investigated that does not follow a
![]() behavior
near
behavior
near
![]() - requires values of
- requires values of
![]() and
and
![]() that are lower by
about a factor of 0.70 and 0.85, respectively.
that are lower by
about a factor of 0.70 and 0.85, respectively.
The reader may have noticed that our best models yield for
![]() ,
i.e. for the inverse of the average star-formation efficiency, values
somewhat lower than those inferred from population synthesis
calculations (e.g. Pizagno et al. 2005). We stress however that
the observational estimates of this parameter are affected by
considerable uncertainties, our prediction that the average
mass-to-light ratio of disks is
,
i.e. for the inverse of the average star-formation efficiency, values
somewhat lower than those inferred from population synthesis
calculations (e.g. Pizagno et al. 2005). We stress however that
the observational estimates of this parameter are affected by
considerable uncertainties, our prediction that the average
mass-to-light ratio of disks is ![]()
![]() ,
which is
consistent with submaximal disks arguments (Courteau & Rix 1999; Kuzio de Naray et al. 2008), as well
as relatively close to the values adopted as input in more
sophisticated models of disk formation (Dutton et al. 2007). On the other
hand, we find that the predicted values of
,
which is
consistent with submaximal disks arguments (Courteau & Rix 1999; Kuzio de Naray et al. 2008), as well
as relatively close to the values adopted as input in more
sophisticated models of disk formation (Dutton et al. 2007). On the other
hand, we find that the predicted values of
![]() are directly
correlated with those adopted for
are directly
correlated with those adopted for
![]() .
In particular we note that a
value of
.
In particular we note that a
value of
![]() ,
which coincides with the median of the
distribution of the spin parameter for relaxed halos derived by
Macciò et al. (2008), implies a small current average galaxy-formation
efficiency,
,
which coincides with the median of the
distribution of the spin parameter for relaxed halos derived by
Macciò et al. (2008), implies a small current average galaxy-formation
efficiency,
![]() .
This agrees well with the predictions
of galaxy evolution from halo occupation models (Zheng et al. 2007) and
methods that match the stellar mass function to that of the halo
(Conroy & Wechsler 2009). Further recent support for low
.
This agrees well with the predictions
of galaxy evolution from halo occupation models (Zheng et al. 2007) and
methods that match the stellar mass function to that of the halo
(Conroy & Wechsler 2009). Further recent support for low
![]() (and
(and
![]() ,
according to our model) comes for instance from weak lensing
measurements (Mandelbaum et al. 2006) and from the roughly universal
distributions of this parameter obtained by Sales et al. (2009) for various
implementations of feedback in large cosmological
N-body/gasdynamical simulations. Notice also the fifth column in
Table 2, where we list the ratio
,
according to our model) comes for instance from weak lensing
measurements (Mandelbaum et al. 2006) and from the roughly universal
distributions of this parameter obtained by Sales et al. (2009) for various
implementations of feedback in large cosmological
N-body/gasdynamical simulations. Notice also the fifth column in
Table 2, where we list the ratio
![]() calculated for a MW-mass halo, which increases with increasing
calculated for a MW-mass halo, which increases with increasing
![]() and decreasing
and decreasing
![]() .
As stated by Dutton et al. (2007), the relatively
high values we predict for this ratio - a characteristic common to
standard models - would likely hamper a simultaneous match to the
galaxy LF that, according to semi-analytical models of galaxy
formation, requires the condition
.
As stated by Dutton et al. (2007), the relatively
high values we predict for this ratio - a characteristic common to
standard models - would likely hamper a simultaneous match to the
galaxy LF that, according to semi-analytical models of galaxy
formation, requires the condition
![]() .
.
We made no attempt to explore the scatter of the
observed scaling relations and the covariance that exists between
model parameters, except for Fig. 1, where we carry out a naive
comparison between the spread of the data and that resulting from
taking into account the predicted scale of the probability
distribution of the halo concentration. Including this and other
sources of scatter, such as the variance of the halo spin parameter,
or the dependence of the concentration-mass relation on the adopted
cosmology (e.g. Macciò et al. 2008), would undoubtedly enrich the
analysis. Yet, a thorough investigation of scatter requires dealing
with the joint probability distribution of all the parameters entering
the model and, in particular, with all their covariances (not just the
variances), which ideally should be corrected from measurement
errors. This far exceeds the scope of our present research.
We note in addition that efforts in the direction
just outlined will soon be much more effective when they can be
applied to objective, homogeneous, and complete ![]() datasets free
of nontrivial selection biases, as those build from the
cross-correlation of wide-area spectroscopic optical and H I surveys
(e.g., Toribio et al. 2010, in preparation).
datasets free
of nontrivial selection biases, as those build from the
cross-correlation of wide-area spectroscopic optical and H I surveys
(e.g., Toribio et al. 2010, in preparation).
Finally, we wish to comment on the possibility of extending our model
predictions to distant galaxies by adopting a
![]() relationship
of the form
relationship
of the form
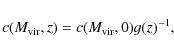
with
We thank the anonymous referee for his/her thorough review and appreciate the comments and suggestions, which significantly helped to improving the manuscript. This work is supported by the Spanish Dirección General de Investigación Científica y Técnica, under contract AYA2007-60366.
References
- Berta, Z. K., Jimenez, R., Heavens, A. F., & Panter, B. 2008, MNRAS, 391, 197 [NASA ADS] [CrossRef] [Google Scholar]
- Binney, J., & Tremaine, S. 2008, Galactic Dynamics, 2nd. edn. (Princeton, NJ: Princeton University Press) [Google Scholar]
- Blumenthal, G. R., Faber, S. M., Flores, R., & Primack, J. R. 1986, ApJ, 301, 27 [NASA ADS] [CrossRef] [MathSciNet] [Google Scholar]
- Bryan, G. L., & Norman, M. L. 1998, ApJ, 495, 80 [NASA ADS] [CrossRef] [Google Scholar]
- Bullock, J. S., Kolatt, T. S., Sigad, Y., et al. 2001, MNRAS, 321, 559 [Google Scholar]
- Burkert, A. 1995, ApJ, 447, L25 (BUR) [NASA ADS] [CrossRef] [Google Scholar]
- Catinella, B., Haynes, M. P., & Giovanelli, R. 2007, AJ, 134, 334 [NASA ADS] [CrossRef] [Google Scholar]
- Conroy, C., & Wechsler, R. H. 2009, ApJ, 696, 620 [NASA ADS] [CrossRef] [Google Scholar]
- Courteau, S., & Rix, H.-W. 1999, ApJ, 513, 561 [NASA ADS] [CrossRef] [Google Scholar]
- Courteau, S., Dutton, A. A., van den Bosch, F. C., et al. 2007, ApJ, 671, 203 [NASA ADS] [CrossRef] [Google Scholar]
- Dutton, A. A., van den Bosch, F., Dekel, A., & Courteau, S. 2007, ApJ, 654, 27 [NASA ADS] [CrossRef] [Google Scholar]
- Einasto, J., & Haud, U. 1989, A&A, 223, 89 (EIN) [NASA ADS] [Google Scholar]
- Hammer, F., Puech, M., Chemin, L., Flores, H., & Lehnert, M. D. 2007, ApJ, 662, 322 [NASA ADS] [CrossRef] [Google Scholar]
- Hernquist, L. 1990, ApJ, 356, 359 (HER) [NASA ADS] [CrossRef] [Google Scholar]
- Kuzio de Naray, R., McGaugh, S. S., & de Blok, W. J. G. 2008, ApJ, 676, 920 [CrossRef] [Google Scholar]
- Lemson, G., & Kauffmann, G. 1999, MNRAS, 302, 111 [NASA ADS] [CrossRef] [Google Scholar]
- Macciò, A. V., Dutton, A. A., & van den Bosch, F. C. 2008, MNRAS, 391, 1940 [NASA ADS] [CrossRef] [Google Scholar]
- Mandelbaum, R., Seljak, U., Kauffmann, G., Hirata, C. M., & Brinkmann, J. 2006, MNRAS, 368, 715 [Google Scholar]
- Masters, K. L., Springob, C. M., Haynes, M. P., & Giovanelli, R. 2006, ApJ, 653, 861 [NASA ADS] [CrossRef] [Google Scholar]
- Merrit, D., Navarro, J. F., Ludlow, A., & Jenkins, A. 2005, ApJ, 624, L85 [NASA ADS] [CrossRef] [Google Scholar]
- Mo, H. J., Mao, S., & White, D. M. 1998, MNRAS, 295, 319 (MMW) [Google Scholar]
- Navarro, J. F., Frenk, C. S., & White, S. D. M. 1997, ApJ, 490, 493 (NFW) [NASA ADS] [CrossRef] [Google Scholar]
- Peebles, P. J. E. 1969, ApJ, 155, 393 [NASA ADS] [CrossRef] [Google Scholar]
- Pizagno, J., Prada, F., Weinberg, D. H., et al. 2005, ApJ, 633, 844 [NASA ADS] [CrossRef] [Google Scholar]
- Portinari, L., Holmberg, J., & Flynn, C. 2007, The Milky Way and the Tully Fisher Relation, in Island Universes, ed. R. S. de Jong, Astrophysics and Space Science Proceedings (Netherlands: Springer), 57 [Google Scholar]
- Sales, L. V., Navarro, J. F., Schaye, J., et al. 2009, MNRAS, 399, L64 [NASA ADS] [Google Scholar]
- Shaw, L. D., Weller J., Ostriker J. P., & Bode P. 2006, ApJ, 646, 815 [NASA ADS] [CrossRef] [Google Scholar]
- Springob, C. M., Masters, K. L., Haynes, M. P., Giovanelli, R., & Marinoni, C. 2007, ApJS, 172, 599 [NASA ADS] [CrossRef] [Google Scholar]
- Tissera, P. B., White, S. D. M., Pedrosa, S., & Scannapieco, C. 2010, MNRAS, in press [arXiv:0911.2316] [Google Scholar]
- Wechsler, R. H., Bullock, J. S., Primack, J. R., Kravtsov, A. V., & Dekel, A. 2002, ApJ, 568, 52 [NASA ADS] [CrossRef] [Google Scholar]
- Zwaan, M. A., van der Hulst, J. M., de Blok, W. J. G., & McGaugh, S. S. 1995, MNRAS, 273, L35 [NASA ADS] [Google Scholar]
- Zheng, Z., Coil, A. L., & Zehavi, I. 2007, ApJ, 667, 760 [NASA ADS] [CrossRef] [Google Scholar]
Footnotes
- ... halo
![[*]](/icons/foot_motif.png)
- In modern literature, the mode and amount of halo contraction are actually a matter of debate (e.g. Dutton et al. 2007; Tissera et al. 2010). The outcome, however, remains unchanged: the properties of disk galaxies are linked to those of their host halos.
- ... 0.05
- We ignore here a possible dependence of this parameter on halo mass (e.g. Berta et al. 2008).
- ... uniparametric
- The Einasto r1/n model has an additional parameter n controlling the curvature of the profile. In our modeling this parameter is kept fixed to n=6, a value representative of galaxy-sized halos (Merrit et al. 2005).
All Tables
Table 1: Halo profiles.
Table 2: Model parameters.
Table 3: Coefficients of the approximations.
All Figures
|
|
Figure 1:
Scale relations for nearby disks. Upper-left:
Disk-specific angular momentum as a function of
|
| Open with DEXTER | |
| In the text | |
Copyright ESO 2010
Current usage metrics show cumulative count of Article Views (full-text article views including HTML views, PDF and ePub downloads, according to the available data) and Abstracts Views on Vision4Press platform.
Data correspond to usage on the plateform after 2015. The current usage metrics is available 48-96 hours after online publication and is updated daily on week days.
Initial download of the metrics may take a while.