| Issue |
A&A
Volume 515, June 2010
|
|
|---|---|---|
| Article Number | A63 | |
| Number of page(s) | 10 | |
| Section | Extragalactic astronomy | |
| DOI | https://doi.org/10.1051/0004-6361/200912568 | |
| Published online | 09 June 2010 | |
The dark matter halo shape of edge-on disk galaxies
IV. UGC 7321
J. C. O'Brien1 - K. C. Freeman1 - P. C. van der Kruit2
1 - Research School of Astronomy and Astrophysics, Australian National
University, Mount Stromlo Observatory, Cotter Road, ACT 2611, Australia
2 -
Kapteyn Astronomical Institute, University of Groningen, PO Box 800,
9700 AV Groningen, The Netherlands
Received 25 May 2009 / Accepted 9 February 2010
Abstract
This is the fourth paper in a series in which we attempt to put
constraints on the flattening of dark halos in disk galaxies. We
observed for this purpose the H I in edge-on galaxies, where it is in
principle possible to measure the force field in the halo vertically
and radially from gas layer flaring and rotation curve decomposition
respectively. As reported in earlier papers in this series we have
for this purpose analysed the H I channel maps to accurately
measure all four functions that describe as a function of
galactocentric radius the planar H I kinematics and 3D H
I distribution of a galaxy: the radial H I surface
density, the H I vertical thickness, the rotation curve and the H
I velocity dispersion. In this paper we analyse these data
for the edge-on galaxy UGC 7321. We measured the stellar mass
distribution (M=3 ![]() 108
108 ![]() with
with
![]() ),
finding that the vertical force of the gas disk dominates the stellar
disk at all radii. Measurements of both the rotation curve and the
vertical force field showed that the vertical force puts a much
stronger constraint on the stellar mass-to-light ratio than rotation
curve decomposition. Fitting of the vertical force field derived from
the flaring of the H I layer and H I velocity dispersion
revealed that UGC 7321 has a spherical halo density distribution
with a flattening of
),
finding that the vertical force of the gas disk dominates the stellar
disk at all radii. Measurements of both the rotation curve and the
vertical force field showed that the vertical force puts a much
stronger constraint on the stellar mass-to-light ratio than rotation
curve decomposition. Fitting of the vertical force field derived from
the flaring of the H I layer and H I velocity dispersion
revealed that UGC 7321 has a spherical halo density distribution
with a flattening of
![]() .
However, the shape of the vertical force field showed that a
non-singular isothermal halo was required, assuming a vertically
isothermal H I velocity dispersion. A pseudo-isothermal halo
and a gaseous disk with a declining H I velocity dispersion at
high latitudes may also fit the vertical force field of UGC 7321,
but to date there is no observational evidence that the H
I velocity dispersion declines away from the galactic plane. We
compare the halo flattening of UGC 7321 with other studies in the
literature and discuss its implications. Our result is consistent with
new n-body simulations which show that inclusion of hydrodynamical
modelling produces more spherical halos.
.
However, the shape of the vertical force field showed that a
non-singular isothermal halo was required, assuming a vertically
isothermal H I velocity dispersion. A pseudo-isothermal halo
and a gaseous disk with a declining H I velocity dispersion at
high latitudes may also fit the vertical force field of UGC 7321,
but to date there is no observational evidence that the H
I velocity dispersion declines away from the galactic plane. We
compare the halo flattening of UGC 7321 with other studies in the
literature and discuss its implications. Our result is consistent with
new n-body simulations which show that inclusion of hydrodynamical
modelling produces more spherical halos.
Key words: galaxies: structure - galaxies: kinematics and dynamics - galaxies: halos - galaxies: ISM
1 Introduction
In Paper I in this series (O'Brien et al. 2010a) we presented H I observations of a sample of 8 edge-on, H I rich, late-type galaxies. The aim of the project has been described there in detail. Briefly, we attempt to put constraints on the flattening of dark halos around disk galaxies by measuring the force field of the halo vertically from the flaring of the H I layer and radially from rotation curve decomposition. For the vertical force field we need to determine in these galaxies both the velocity dispersion of the H I gas (preferably as a function of height from the central plane of the disk) and the thickness of the H I layer, all of this as a function of galactocentric radius. In addition we also need to extract information on the rotation of the galaxy and the deprojected H I surface density, also as a function of galactocentric radius.
In Paper II (O'Brien et al. 2010b) we discussed methods to analyse the H I observations in edge-on galaxies and presented a new method to measure the radial distributions, rotation curves and velocity dispersions. We applied this method to our sample of galaxies in the third paper in this series: O'Brien et al. (2010c). In that paper we also developed a new method to derive the thickness of the H I layer, or ``flaring profile'', as a function of galactocentric radius, which we used to measure the H I flaring of each galaxy in our sample.
In the present paper we have fitted the vertical shape q=c/a of the halo density distribution for the northern galaxy UGC 7321. This particular system was chosen as a first application since the sensitivity of the H I imaging obtained for UGC 7321 at the VLA was 5 times greater than that for the southern galaxies that we observed with the ATCA, allowing more accurate measurement of the gas layer flaring to high latitudes, and better measurement of the H I velocity dispersion. Due to its northern location, UGC 7321 was not in our initial southern galaxy sample for which we measured near-IR and optical stellar photometry at Siding Spring Observatory. However, VLA H I data observed by Lyn Matthews (Matthews et al. 1999) was available for this galaxy and Michael Pohlen (Pohlen et al. 2002) kindly supplied R-band photometry which allowed us to derive the stellar luminosity density necessary to analyse the halo density distribution.
In Sect. 2 we
present the surface brightness and deprojected luminosity volume
density, and our derivation of the halo core radius, halo asymptotic
velocity, and stellar mass-to-light ratio by rotation curve
decomposition. In Sect. 3, we present a new simple method used to measure the halo shape using the vertical gradient of the vertical force,
![]() ,
with the usual assumption of gas in hydrostatic equilibrium to determine the total
,
with the usual assumption of gas in hydrostatic equilibrium to determine the total
![]() of the galaxy. The resulting halo shape measurement
for UGC 7321 is presented and discussed in Sect. 4, and compared to other measurements of dark halo flattening in Sect. 5. Section 6 summarizes our conclusions.
of the galaxy. The resulting halo shape measurement
for UGC 7321 is presented and discussed in Sect. 4, and compared to other measurements of dark halo flattening in Sect. 5. Section 6 summarizes our conclusions.
2 Stellar surface brightness and deprojected luminosity density of UGC 7321
Figure 1 shows the R-band
surface brightness - averaged over four quadrants -
of UGC 7321 with contours ranging from 0.1 to 30 ![]() pc-2 in steps of 0.5 dex. The observations and photometric calibration of UGC 7321 are discussed in Pohlen et al. (2002). Pohlen et al. (2003) analysed the projected surface brightness showing peanut-shaped deviations from
elliptical fits to the isophotes at z heights
greater than 0.5 kpc above the plane. These deviations provide
strong evidence of a stellar bar, although it is difficult to measure
the scale of the bar from the scale of the boxy-peanut shaped bulge
(Athanassoula, private communication).
pc-2 in steps of 0.5 dex. The observations and photometric calibration of UGC 7321 are discussed in Pohlen et al. (2002). Pohlen et al. (2003) analysed the projected surface brightness showing peanut-shaped deviations from
elliptical fits to the isophotes at z heights
greater than 0.5 kpc above the plane. These deviations provide
strong evidence of a stellar bar, although it is difficult to measure
the scale of the bar from the scale of the boxy-peanut shaped bulge
(Athanassoula, private communication).
| Figure 1: Projected stellar surface
density of UGC 7321 averaged over all quadrants. Contours are
separated on a log scale at 0.1, 0.3, 1, 3, 10, 30 |
|
| Open with DEXTER | |
Using an exponential radial surface profile we fit the central surface
brightness and apparent radial scale length of the projected surface
density. In logarithmic units
|
(1) |
where X denotes the major axis distance. We found the projected central R-band surface brightness to be 22.0 mag arcsec-2, with a scalelength of
2.1 Deprojection
To deproject the luminosity distribution from the edge-on
projection, we assume azimuthal symmetry and perform a direct
deprojection of the projected surface density on the sky using the
inverse Abel transform
where X is the position along the major axis and R is the galactocentric radius in the cylindrical coordinate system. Applying the inverse Abel tranform to each z-plane yields the luminous volume density I(R,z) of the galaxy in
| Figure 2:
Stellar luminosity volume density in R and z
after deprojecting the observed surface density using the Inverse Abel
Integral. Contours are separated on a log scale
at 0.0001, 0.003, 0.001, 0.003, 0.01, 0.03, 0.1, 0.3 |
|
| Open with DEXTER | |
Figure 2 shows the derived volume density I(R,z) of UGC 7321, while Fig. 3
shows the radial and vertical surface brightness obtained by
integrating over the volume density. UGC 7321 is indeed a
very low surface brightness galaxy. The face-on radial scalelength is
hR = 2.65 ![]() 0.17 kpc. Both the volume density and the radial profile, show
that UGC 7321 clearly has a small central nuclear region that is
approximately 8 times brighter in surface brightness than the
fitted central surface brightness of
0.17 kpc. Both the volume density and the radial profile, show
that UGC 7321 clearly has a small central nuclear region that is
approximately 8 times brighter in surface brightness than the
fitted central surface brightness of
![]()
![]() 0.14 mag arcsec-2 derived assuming an exponential disk only. The peak face-on central surface brightness of the nuclear region is
0.14 mag arcsec-2 derived assuming an exponential disk only. The peak face-on central surface brightness of the nuclear region is
![]() mag arcsec-2.
mag arcsec-2.
The central luminosity volume density of UGC 7321 is 0.3 ![]() pc-3 in the central nucleus averaged over 250 pc. At 2.2 scalelengths the midplane volume density is 0.002
pc-3 in the central nucleus averaged over 250 pc. At 2.2 scalelengths the midplane volume density is 0.002 ![]() pc-3, much less than the luminosity density near the Sun (
pc-3, much less than the luminosity density near the Sun (
![]()
![]() pc-2) as would be expected for such a low surface brightness galaxy.
pc-2) as would be expected for such a low surface brightness galaxy.
2.2 Rotation curve decomposition
In the standard manner we decomposed the rotation curve to obtain the
parameters of a spherical pseudo-isothermal halo, and constrain the
stellar mass-to-light ratio. The radial surface density of the stars
and gas was used directly to derive the rotation curve contribution due
to each luminous mass component, and the observed rotation curve fitted
such that
|
(3) |
where
The observed rotation curve was fitted using a spherical pseudo-isothermal halo density distribution
|
(4) |
with corresponding rotation curve
![\begin{displaymath}%
v_{\rm h}^2(R) = 4 \pi G \rho_{\rm h,0} R_{\rm c}^2 \left[ ...
...}{R} {\rm arctan}\left(\frac{R}{R_{\rm c}}\right) \right]\cdot
\end{displaymath}](/articles/aa/full_html/2010/07/aa12568-09/img31.png)
|
(5) |
The pseudo-isothermal halo shown above is defined by the core radius
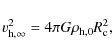
|
(6) |
such that the rotation can also be written
![\begin{displaymath}%
v_{\rm h}^2(R) = v_{\rm h,\infty}^2 \left[ 1 - \frac{R_{\rm c}}{R} {\rm arctan}\left(\frac{R}{R_{\rm c}}\right) \right]\cdot
\end{displaymath}](/articles/aa/full_html/2010/07/aa12568-09/img35.png)
|
(7) |
By definition the rotation curve measures the total force in the radial direction KR = v2(R)/R; however it is unable to constrain the halo flattening q.
By evaluating the radial force KR(R,z) of a flattened pseudo-isothermal halo with density distribution
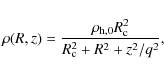
|
(8) |
Sackett et al. (1994) show that the corresponding rotation curve in the midplane is
![$\displaystyle %
v_{\rm h}^2(R,q)\!=\! v_{{\rm h},\infty}^2(q) \left[ 1 \!- \! {...
...1/2}
\arctan \left( {R^2 \!+\! a}\over {q^2 R_{\rm c}^2} \right)^{1/2} \right],$](/articles/aa/full_html/2010/07/aa12568-09/img37.png)
|
(9) |
where

|
(10) |
and the asymptotic rotation
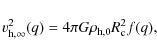
where
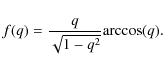
|
(12) |
| Figure 3: Exponential fits to the radial and vertical surface brightness profiles formed by integrating over the deprojected volume density. The arrows mark the radial scalelength ( left) and vertical scaleheight ( right). |
|
| Open with DEXTER | |
We use the rotation curve of a spherical pseudo-isothermal halo, as the shape of the rotation of a similar, but flattened halo is almost the same. This similarity implies that the measured asymptotic rotation derived from a spherical pseudo-isothermal fit to the rotation curve also defines the asymptotic rotation of a flattened pseudo-isothermal halo via Eq. (11).
In Fig. 4 we show how the rotation curve of a flattened pseudo-isothermal halo varies with q (for ![]() )
at z=0. The vertical axis shows the rotation normalised by the asymptotic rotation
)
at z=0. The vertical axis shows the rotation normalised by the asymptotic rotation
![]() ,
while the abscissa shows the radius normalised by the core radius
,
while the abscissa shows the radius normalised by the core radius ![]() .
The thick, black curve shows the rotation for q=0.3, while the thin, red curve shows the rotation for q=0.9
with the radius scaled by 0.84. The nearly identical shape of the
two curves shows that shape of the rotation curve of the halo is almost
independent of q, with the radial scaling varying by only
.
The thick, black curve shows the rotation for q=0.3, while the thin, red curve shows the rotation for q=0.9
with the radius scaled by 0.84. The nearly identical shape of the
two curves shows that shape of the rotation curve of the halo is almost
independent of q, with the radial scaling varying by only
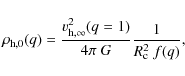
![]() over a large range of q. The derived halo central density does vary significantly with q, becoming denser for more flattened halos:
over a large range of q. The derived halo central density does vary significantly with q, becoming denser for more flattened halos:
|
(13) |
![\begin{figure}
\par\includegraphics[width=9cm,clip]{12568fg04.eps}
\end{figure}](/articles/aa/full_html/2010/07/aa12568-09/img45.png)
|
Figure 4:
Scaled rotation curves of a flattening pseudo-isothermal halo for two different values of the halo flattening q. The thick, black curve shows the rotation curve of q=0.3 and the thin, red curve shows the rotation for q=0.9 with the radius scaled by 0.84. The vertical axis shows the rotation normalised by the asymptotic rotation
|
| Open with DEXTER | |
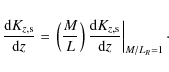
In Sect. 4 we measure q by fitting the gradient of the vertical force
![]() ,
where the gradient of the flattened pseudo-isothermal halo is also given by Sackett et al. (1994). As Kz(R,z) also depends on the same parameters q, halo core radius
,
where the gradient of the flattened pseudo-isothermal halo is also given by Sackett et al. (1994). As Kz(R,z) also depends on the same parameters q, halo core radius ![]() and halo central density
and halo central density
![]() ,
we can use the asymptotic halo rotation
,
we can use the asymptotic halo rotation
![]() and the core radius
and the core radius ![]() which are well measured from rotation curve decomposition, and just perform a single parameter fit to the flattening q, as the central
density
which are well measured from rotation curve decomposition, and just perform a single parameter fit to the flattening q, as the central
density
![]() is tied to
is tied to
![]() ,
,
![]() and q.
and q.
In Fig. 5 we
show the best fitting stellar and halo rotation curves derived from
rotation curve decomposition of UGC 7321. The observed rotation
curve is shown by the thick black line, while the rotation due to gas,
stars and the halo are shown by dashed lines (from the bottom up stars
(red), gas (green) and halo (blue). The resulting fit is shown by the
grey full-drawn line (yellow). The best fit was achieved with a
sub-maximal (see below) stellar M/LR of 1.05, which
scaled the stellar component from a luminosity of L=4.0 ![]() 108
108 ![]() to a mass of 4.2
to a mass of 4.2 ![]() 108
108 ![]() .
UGC 7321 is a gas-rich low surface brightness galaxy with a
.
UGC 7321 is a gas-rich low surface brightness galaxy with a
![]() ;
thus even with an M/LR near unity, the stellar mass is roughly a third of the gas mass (
;
thus even with an M/LR near unity, the stellar mass is roughly a third of the gas mass (
![]() ).
).
The plot shows that the rotation curve is well fit by a pseudo-isothermal halo with core radius
![]()
![]() 0.02 kpc, and central density
0.02 kpc, and central density
![]()
![]() 0.05
0.05 ![]() pc-3.
As the halo core radius and halo asymptotic rotation are nearly
independent of the halo shape in flattened pseudo-isothermal halos,
we adopt those measurements from rotation curve decomposition for
our halo shape modelling in Sect. 3. The halo is clearly the dominant component at all radii, comprising over 90% of the total galaxy mass of 3.2
pc-3.
As the halo core radius and halo asymptotic rotation are nearly
independent of the halo shape in flattened pseudo-isothermal halos,
we adopt those measurements from rotation curve decomposition for
our halo shape modelling in Sect. 3. The halo is clearly the dominant component at all radii, comprising over 90% of the total galaxy mass of 3.2 ![]() 1010
1010 ![]() at the last measured point. Uson & Matthews (2003)
reach a very similar conclusion. UGC 7321 has a similar
dark-to-light mass ratio, although it is significantly more massive
than DDO154 and shows evidence of a bar (Carignan & Freeman 1988).
at the last measured point. Uson & Matthews (2003)
reach a very similar conclusion. UGC 7321 has a similar
dark-to-light mass ratio, although it is significantly more massive
than DDO154 and shows evidence of a bar (Carignan & Freeman 1988).
The dominance of the halo at all radii means that the stellar mass-to-light ratio is rather unconstrained. Forcing a maximum disk fit yielded a stellar M/LR of 2.9, but resulted in a very poor fit with rotation velocities in error by 15-25% in the inner disk. Even with a maximum disk fit, the peak rotation for the stellar disk was only 43 km s-1. The best fit occurs for an M/LR of 1.05, but all M/LR values less than 1.05 provide acceptable fits to the rotation curve. Consequently, we use 1.05 as an upper limit in the analysis in Sect. 3.
The low mass-to-light ratio and extremely sub-maximal nature of the UGC 7321 stellar disk implies that the recent star formation rate exceeds the average rate over the galaxy's lifetime. Observations by Matthews et al. (1999) that found a significant fraction of young stars support our results. Detailed studies of the vertical disk structure indicate multiple disk components (Matthews 2000). Our finding of a very low mass-to-light ratio (in the R-band) warrants further studies of the structure and composition of the stellar disk, but this is beyond the scope of the present paper.
![\begin{figure}
\par\includegraphics[width=9cm,clip]{12568fg05.eps}
\end{figure}](/articles/aa/full_html/2010/07/aa12568-09/img51.png)
|
Figure 5:
Rotation curve decomposition of UGC 7321. The observed rotation
curve is shown by the thick (black) line, while the rotation due to the
other components are shown by dashed lines; from the bottom up stars
(red), gas (green) and the halo (blue). The disk has in this fit
an M/LR of 1.05. The resulting fit,
|
| Open with DEXTER | |
3 Method for fitting the halo shape
The thickness of the gas layer depends on the vertical force Kz, and hence on the shape of the dark matter halo (Maloney 1992; Kundic et al. 1993; Olling & van Gorkom 1993; Maloney 1993). A gas layer with less flaring for a given gas velocity dispersion implies a stronger Kz.
Analytically it has been shown that at large radii the thickness of the gas layer is roughly proportional to the square root of the halo flattening q (Maloney 1993; Olling 1995) and that the flaring should increase radially in an exponential fashion (van der Kruit 1981). This was confirmed in our measurements and the earlier study of Rupen (1991) comprising high resolution VLA H I observations of NGC 891 and NGC 4565.
We determine the halo flattening by measuring the z-gradient of the total vertical force
![]() from the equation of hydrostatic equilibrium for the gas layer, and evaluating
from the equation of hydrostatic equilibrium for the gas layer, and evaluating
![]() for each luminous mass component using Poisson's equation. The halo gradient
for each luminous mass component using Poisson's equation. The halo gradient
![]() is modelled using the equation for the vertical force Kz of a flattened pseudo-isothermal halo given in Sackett et al. (1994).
is modelled using the equation for the vertical force Kz of a flattened pseudo-isothermal halo given in Sackett et al. (1994).
Given the gas disk is in equilibrium, the gas pressure gradient and
internal forces must exactly balance the gradient of the total
gravitational potential of the galaxy, where the total gravitational
potential
![]() is the sum of the stellar, gas and halo potentials,
is the sum of the stellar, gas and halo potentials,
![]() .
Assuming that the gas velocity dispersion is isothermal in z (though not in R), the equilibrium condition in z becomes
.
Assuming that the gas velocity dispersion is isothermal in z (though not in R), the equilibrium condition in z becomes
![\begin{displaymath}%
\frac{\partial ^2}{\partial z^2} [\sigma_{v,{\rm g}}^2(R) ~...
...rho_{\rm g}(R,z)]
= \frac{\partial K_z(R,z)}{\partial z}\cdot
\end{displaymath}](/articles/aa/full_html/2010/07/aa12568-09/img56.png)
|
(14) |
If we further assume that the gas density distribution is Gaussian in z, the vertical gradient of the total Kz becomes a simple function of the gas velocity dispersion and the vertical FWHM thickness of the gas, both functions of radius which we measured in Paper III, namely
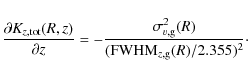
From this we see that the vertical gradient of
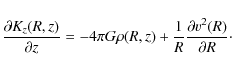
The gradient of the vertical force of each of the luminous
components was directly calculated from the Poisson equation for each
component

where
Consequently, the gradient of the halo force must satisfy

|
= | 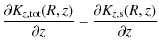
|
|

|
(18) |
where the subscripts s, g and h, denote the stars, gas and halo, respectively.
The vertical
![]() force of the flattened pseudo-isothermal halo is given in Sackett et al. (1994). As the asymptotic halo rotation and the halo core radius were well
determined from the rotation curve decomposition, and the central density determined by q, the fitting of
force of the flattened pseudo-isothermal halo is given in Sackett et al. (1994). As the asymptotic halo rotation and the halo core radius were well
determined from the rotation curve decomposition, and the central density determined by q, the fitting of
![]() reduces to a fit with a single parameter q.
reduces to a fit with a single parameter q.
Comparison of the stellar vertical force gradient with the total
vertical force gradient shows that the vertical force puts a much
stronger constraint on the stellar mass-to-light ratio than does the
radial force fitting undertaken in rotation curve decomposition.
Inclusion of the gas self-gravity requires that the stellar vertical
force gradient
![]() must be
must be
|
(19) |
where from here on we take the R-dependence of Kz as implicit and write the derivatives as total derivatives.
Given that the stellar mass density and its squared rotation are
both proportional to the stellar mass-to-light ratio, we see from
Eq. (17)
that the vertical gradient of the vertical force of the stars is
linearly related to the stellar mass-to-light ratio. As the low
stellar luminosity meant the rotation curve decomposition was
relatively insensitive to the stellar mass-to-light ratio, we consider
the stellar mass-to-light ratio to be a free parameter and fitted

as determined from the observations as a function of R with

where the
The total Kz gradient and the gas Kz gradient come directly from observations without any free parameters.
We recall from above that the vertical gradient of
![]() derived for a Gaussian gas disk is independent of z.
To be most sensitive to the constraints from the luminous
mass density, we fit the gradient of the vertical force near the
midplane at z=100 pc, high enough to avoid the bulk of the internal extinction caused by dust in the plane of the thin stellar disk.
derived for a Gaussian gas disk is independent of z.
To be most sensitive to the constraints from the luminous
mass density, we fit the gradient of the vertical force near the
midplane at z=100 pc, high enough to avoid the bulk of the internal extinction caused by dust in the plane of the thin stellar disk.
![\begin{figure}
\par\includegraphics[width=9cm,clip]{12568fg06.eps}
\end{figure}](/articles/aa/full_html/2010/07/aa12568-09/img72.png)
|
Figure 6:
The vertical gradient of the vertical force. The total gradient,
|
| Open with DEXTER | |
4 The halo shape of UGC 7321
4.1 Results of the fitting
Figure 6 shows the vertical gradient of each of the Kz components
for UGC 7321. The thick, black line (labelled ``total'') is the
gradient determined from the gas flaring and velocity distribution
using Eq. (15).
The gradient due to the stellar disk is shown by the red line (labelled
``stars'') and has been calculated with the mass-to-light ratio
of 1.05, which was the best fitting value in our rotation curve
decomposition. We see immediately
that the stellar
![]() alone is comparable to the total
alone is comparable to the total
![]() given by the hydrostatics over most of the range of R.
The gradient due to the H I is the line labelled ``gas'' (green). We
can subtract this gradient for the gas from the total gradient and
derive the gradient due to the sum of the halo and the stars. This is
the (cyan) line labelled ``halo+stars''. Subtracting the gradient for
the stars from the gradient for the (halo+stars) then leaves the
gradient that should be attributed to the halo alone (blue line
labelled ``halo''). With the adopted M/L ratio for the stellar disk, the halo gradient turns
out to be positive, which is unphysical.
given by the hydrostatics over most of the range of R.
The gradient due to the H I is the line labelled ``gas'' (green). We
can subtract this gradient for the gas from the total gradient and
derive the gradient due to the sum of the halo and the stars. This is
the (cyan) line labelled ``halo+stars''. Subtracting the gradient for
the stars from the gradient for the (halo+stars) then leaves the
gradient that should be attributed to the halo alone (blue line
labelled ``halo''). With the adopted M/L ratio for the stellar disk, the halo gradient turns
out to be positive, which is unphysical.
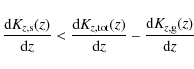
From this example, it is clear that the gradient of
![]() measured from the hydrostatics provides a very strong constraint on the stellar M/LR ratio. Even with a zero-mass halo, which is excluded by the rotation curve fit, we see that the stellar M/LR must be less than 1 to leave room for the gradient of Kz given by the gas self-gravity. With the necessary inclusion of the gas, we find that the stellar mass-to-light ratio M/LR must be
measured from the hydrostatics provides a very strong constraint on the stellar M/LR ratio. Even with a zero-mass halo, which is excluded by the rotation curve fit, we see that the stellar M/LR must be less than 1 to leave room for the gradient of Kz given by the gas self-gravity. With the necessary inclusion of the gas, we find that the stellar mass-to-light ratio M/LR must be ![]() .
The difference
.
The difference
![]() (cyan; labelled ``halo+stars'') constitutes the combined
(cyan; labelled ``halo+stars'') constitutes the combined
![]() of the halo (blue; labelled ``halo'') and stars (red; labelled
``stars''). The rotation curve decomposition requires a positive halo
mass density at all radii, thus
of the halo (blue; labelled ``halo'') and stars (red; labelled
``stars''). The rotation curve decomposition requires a positive halo
mass density at all radii, thus
![]() for all radii. This constraint requires that the stellar
for all radii. This constraint requires that the stellar
![]() .
.
Inspection of the
![]() difference (cyan; ``halo+stars'') shows a steep gradient at small R,
flattening at large radii, particularly where the gas layer undergoes
exponential flaring at radii outside 7 kpc. We see from Fig. 7 that this is similar to the characteristic shape of
difference (cyan; ``halo+stars'') shows a steep gradient at small R,
flattening at large radii, particularly where the gas layer undergoes
exponential flaring at radii outside 7 kpc. We see from Fig. 7 that this is similar to the characteristic shape of
![]() for pseudo-isothermal halos with different halo flattenings. But
despite this similarity, it was not possible to fit the halo
flattening q while holding the core radius
for pseudo-isothermal halos with different halo flattenings. But
despite this similarity, it was not possible to fit the halo
flattening q while holding the core radius ![]() and the asymptotic halo rotation
and the asymptotic halo rotation
![]() fixed, even with a zero mass stellar distribution (stellar M/LR=0) and allowing q to range between oblate and prolate shapes. By adjusting q, and keeping
fixed, even with a zero mass stellar distribution (stellar M/LR=0) and allowing q to range between oblate and prolate shapes. By adjusting q, and keeping
![]() small, it is possible to get a similar shape to the difference
gradient (cyan; ``halo+stars''), but it is always offset to larger
negative values of the gradient. This implies that the asymptotic halo
rotation scale derived from the rotation curve is too high, as the
magnitude of
small, it is possible to get a similar shape to the difference
gradient (cyan; ``halo+stars''), but it is always offset to larger
negative values of the gradient. This implies that the asymptotic halo
rotation scale derived from the rotation curve is too high, as the
magnitude of
![]() is proportional to the
is proportional to the
![]() (see Sackett et al. 1994).
(see Sackett et al. 1994).
![\begin{figure}
\par\includegraphics[width=9cm,clip]{12568fg07.eps}
\end{figure}](/articles/aa/full_html/2010/07/aa12568-09/img79.png)
|
Figure 7: The vertical gradient equated near the midplane of a flattened pseudo-isothermal halo, as calculated from Eq. (6) of Sackett et al. (1994) for both oblate and prolate halos ranging from q of 0.5 to 1.5 in steps of 0.1. The bottom curve corresponds to the most flattened halo with q=0.5, becoming increasingly shallow as the halo gets less flat. The gradient of a spherical halo is shown by the dashed line. The top curve corresponds to q=1.5. |
| Open with DEXTER | |
This may be an artefact of the adopted pseudo-isothermal halo model.
While the flattened pseudo-isothermal (PIT) model is computationally
convenient, we note that a true (spherical) non-singular isothermal
(IT) model was initially adopted for dark halos (Carignan & Freeman 1985, 1988).
Few studies have compared the relative merits of the PIT and
IT dark halo models. In their paper on halo scaling laws for
disk galaxies (Sc and later) and dwarf speroidals, Kormendy & Freeman (2004)
compare halo fits to rotation curves over a large sample and generate
scaling laws between halo parameters measured with a IT halo
and those with a PIT halo. In Fig. 8 (adapted from Fig. 1 of Kormendy & Freeman 2004),
we show IT and PIT halo rotation scaled to the same asymptotic
rotation. As can be seen, the rotation of the IT halo rises
above the asymptotic rotation speed before declining to it at large
radii, while the rotation curve of a PIT halo approaches the
asymptotic rotation from below. The declining shape of the rotation
curve for the IT model would provide a lower and possibly more
realistic estimate of the asymptotic rotational velocity
![]() from
a rotation curve decomposition of rotation data which in practice does
not extend to radii in excess of a few halo core radii.
from
a rotation curve decomposition of rotation data which in practice does
not extend to radii in excess of a few halo core radii.
If an IT halo was fitted to the observed rotation curve of
UGC 7321, the asymptotic rotation would be approximately 20-40%
lower than that of the PIT halo. This would provide the lower
asymptotic rotation scale
![]() necessary to fit the difference
necessary to fit the difference
![]() of UGC 7321 with a flattened halo over radial ranges from 1.5 to 9 kpc.
of UGC 7321 with a flattened halo over radial ranges from 1.5 to 9 kpc.
![\begin{figure}
\par\includegraphics[width=9cm,clip]{12568fg08.eps}
\end{figure}](/articles/aa/full_html/2010/07/aa12568-09/img80.png)
|
Figure 8: This figure shows the difference in the rotation curve and velocity dispersion of isothermal and pseudo-isothermal halo models. The top panel shows that rotation of an IT halo rises above the asymptotic rotation speed at large radii, before declining to it, while the rotation curve of a PIT halo approaches the asymptotic rotation from below. Both rotation curves are scaled to the same asymptotic rotation speed to allow comparison. The lower panel shows that an isotropic pseudo-isothermal halo is not isothermal, exhibiting a lower velocity dispersion at low radii. (Adapted from Fig. 1 of Kormendy & Freeman 2004.) |
| Open with DEXTER | |
Flattened non-singular isothermal halos could be formed by halo
rotation or anisotropy of the velocity dispersion. The rotation is
unlikely to be figure rotation, as figure rotation of triaxial
halos measured in n-body simulations was found to be very slow (Bailin & Steinmetz 2004) (0.148 h km s-1 kpc-1, where h is H0/100, insufficient to flatten halos more than ![]() ).
The velocity dispersion anisotropy of the halo dark matter would allow
either prolate or oblate halos, just as velocity anisotropy of the
stars in the brighter elliptical galaxies defines the galaxy shape.
).
The velocity dispersion anisotropy of the halo dark matter would allow
either prolate or oblate halos, just as velocity anisotropy of the
stars in the brighter elliptical galaxies defines the galaxy shape.
With the asymptotic rotation as a free parameter in addition to the stellar M/LR and q, we found that the residual
![]() curve (``halo+stars'', cyan) is best modelled with a halo shape of q=1.0
curve (``halo+stars'', cyan) is best modelled with a halo shape of q=1.0 ![]() 0.1.
Robust least squares minimization fitting using a Levenberg-Marquardt
algorithm (MINPACK-1) favoured a zero mass stellar disk, but fits were
almost as good for an M/LR=0.2 stellar disk. These fits were successful over the radial
range from 2-9 kpc.
0.1.
Robust least squares minimization fitting using a Levenberg-Marquardt
algorithm (MINPACK-1) favoured a zero mass stellar disk, but fits were
almost as good for an M/LR=0.2 stellar disk. These fits were successful over the radial
range from 2-9 kpc.
We illustrate this first for the unphysical case where there is no mass in stars in Fig. 9. This figure is organised in the same manner as Fig. 6. The gradient due to the stars is now zero at all z.
Recall that
the (cyan) line ``halo+stars'' is the observed gradient, which has to
be fit. The smooth (also cyan) line ``halo'' is that fit
(the dashed -blue- line superimposed is that of the halo alone,
which
is the same when M/LR is zero). This best fit was achieved with an asymptotic PIT halo rotation reduced by 30 ![]()
![]() compared to the PIT fit to the rotation curve in Fig. 5.
compared to the PIT fit to the rotation curve in Fig. 5.
![\begin{figure}
\par\includegraphics[width=9cm,clip]{12568fg09.eps}
\end{figure}](/articles/aa/full_html/2010/07/aa12568-09/img83.png)
|
Figure 9:
The z-gradient of the vertical force showing successful fits of the halo shape for a zero mass disk M/LR=0. The black curve, labelled ``total'' shows the total gradient
|
| Open with DEXTER | |
It is remarkable that the shape of the R-dependence of
![]() for the adopted halo model in Fig. 9 agrees so well with the shape of the Kz gradient
derived from the H I flaring and velocity dispersion, at least for
radii <9 kpc. Although some rescaling of
the strength of the Kz force was
needed, we see that the density distribution of the adopted
spherical PIT, using the core radius derived from the rotation
curve fit, also provides the correct radial variation of the Kz gradient. This need not have happened. Although the KR estimate from the rotation curve and the hydrostatic estimate of
for the adopted halo model in Fig. 9 agrees so well with the shape of the Kz gradient
derived from the H I flaring and velocity dispersion, at least for
radii <9 kpc. Although some rescaling of
the strength of the Kz force was
needed, we see that the density distribution of the adopted
spherical PIT, using the core radius derived from the rotation
curve fit, also provides the correct radial variation of the Kz gradient. This need not have happened. Although the KR estimate from the rotation curve and the hydrostatic estimate of
![]() come from analysing the same XV data (see Paper III),
the two functions come from different features in the
XV data, so are relatively independent.
come from analysing the same XV data (see Paper III),
the two functions come from different features in the
XV data, so are relatively independent.
In Fig. 10 we show the fit for a stellar M/LR=0.2 disk.
The lines labelled ``halo+stars'' (cyan) show the gradient as deduced
from the observed total gradient minus that of the gas in the
full-drawn line (which of course is the same as in Fig. 9) and that of the sum of the gradient of the halo model fit and that deduced from the stellar distribution with M/LR=0.2
as the dashed line. The gradient from the stellar disk alone is the
(red) curve
labelled ``stars'' and for the halo the (blue) curve labelled ``halo''.
For this case an asymptotic halo rotation reduction of 50 ![]()
![]() was needed. In effect, reducing
was needed. In effect, reducing
![]() and reducing the stellar M/LR have similar effects of increasing the magnitude of the asymptotic value of the difference
and reducing the stellar M/LR have similar effects of increasing the magnitude of the asymptotic value of the difference
![]() curve (``halo+stars'', cyan). For both cases (M/LR=0 in Fig. 9 and M/LR=0.2 in Fig. 10), the shape of this difference
curve (``halo+stars'', cyan). For both cases (M/LR=0 in Fig. 9 and M/LR=0.2 in Fig. 10), the shape of this difference
![]() curve
dictated (given the derived core radius for the dark halo from our
rotaton curve decomposition) a halo flattening close to spherical.
curve
dictated (given the derived core radius for the dark halo from our
rotaton curve decomposition) a halo flattening close to spherical.
![\begin{figure}
\par\includegraphics[width=9cm,clip]{12568fg10.eps}
\vspace{-2mm}
\end{figure}](/articles/aa/full_html/2010/07/aa12568-09/img84.png)
|
Figure 10:
The z-gradient of the vertical force showing successful fits of the halo shape for stellar mass-to-light ratio M/LR=0.2. The curve are coloured as in Fig. 9, except that the line for the stars is now at non-zero values. The
cyan line, labelled ``halo+stars'', shows again the difference
|
| Open with DEXTER | |
At radii larger than 9 kpc, the strong flaring causes the difference
![]() (cyan, ``halo+stars'') to be too small to be fit with the same asymptotic halo rotation. Even the shallow gradient of
(cyan, ``halo+stars'') to be too small to be fit with the same asymptotic halo rotation. Even the shallow gradient of
![]() given by a highly prolate halo, combined with a low
given by a highly prolate halo, combined with a low
![]() ,
did not produce a good fit at these radii. We briefly discuss why
the derived gradient for halo+stars may have been underestimated.
,
did not produce a good fit at these radii. We briefly discuss why
the derived gradient for halo+stars may have been underestimated.
We have argued that a true isothermal halo may provide a more
valid model for this analysis. Another possibility is that the gas
velocity dispersion is not vertically isothermal. We were forced to
adopted this assumption in the hydrostatic equation, because there is
currently no available
measurements of the z-dependence of the gas velocity dispersion![]() .
Prior to our work the gas velocity dispersion had only been measured in
a few face-on galaxies. Our H I disk modelling of edge-on galaxies
has more than doubled the number of galaxies with radial gas velocity
dispersion measurements. These high resolution observations show that
the gas velocity dispersion is not isothermal in radius, but its
vertical properties are unknown and we had to assume that is is
vertically isothermal.
.
Prior to our work the gas velocity dispersion had only been measured in
a few face-on galaxies. Our H I disk modelling of edge-on galaxies
has more than doubled the number of galaxies with radial gas velocity
dispersion measurements. These high resolution observations show that
the gas velocity dispersion is not isothermal in radius, but its
vertical properties are unknown and we had to assume that is is
vertically isothermal.
The gas velocity dispersion in disk galaxies is often ascribed to local heating by supernovae and stellar winds in star formation regions. Indeed, Shostak & van der Kruit (1984) found in NGC 628 that the gas velocity dispersion is systematically higher in the spiral arms than in between. On the other hand, similar velocity dispersions are seen in regions of star formation and in regions where there is no visible star formation (e.g. Meurer et al. 1996), and both low and high surface brightness galaxies seem to have similar gas velocity dispersion. Sellwood & Balbus (1999) offer a plausible alternative, suggesting that weak magnetic fields in galaxies allow energy to be extracted from differential rotation via MHD-driven turbulence. This would result in a gas velocity dispersion that was proportional to the rotational shear due to the disk, resulting in similar gas velocity dispersion for galaxies with similar rotation curves. However, while heating caused by gas shear could generate radial variation in the gas velocity dispersion, it is unclear how it could cause the gas velocity dispersion not to be vertically isothermal. Conversely, the decline in star formation away from the midplane could cause a fall-off in gas velocity dispersion with z.
A non-isothermal vertical gas velocity dispersion would probably have
more of an effect at larger radii where the flaring gas is probing a
larger range in z. A gas velocity dispersion declining with z would increase the absolute total vertical gradient of Kz derived from the equation of hydrostatic equilibrium. A significant increase of
![]() would enable a
larger asymptotic halo rotation more consistent with a pseudo-isothermal halo and a larger stellar M/LR.
would enable a
larger asymptotic halo rotation more consistent with a pseudo-isothermal halo and a larger stellar M/LR.
Another, less plausible, explanation of the
![]() fitting problem at large radius, is that the gas-to-H I ratio used to scale the H I density to account for He and H2
is not constant. This is unlikely as the He content is mainly
primordial and well known from big bang
nucleo-synthesis. As He accounts for 0.34 of the
additional 0.4 fraction, it is unlikely that a radially
declining molecular hydrogen distribution could significantly reduce
fitting problem at large radius, is that the gas-to-H I ratio used to scale the H I density to account for He and H2
is not constant. This is unlikely as the He content is mainly
primordial and well known from big bang
nucleo-synthesis. As He accounts for 0.34 of the
additional 0.4 fraction, it is unlikely that a radially
declining molecular hydrogen distribution could significantly reduce
![]() thus allowing a higher difference
thus allowing a higher difference
![]() (cyan).
(cyan).
5 Comparison to other work
We first review earlier work on the flattening of dark halos in spiral
galaxies. The earliest concern was whether the dark matter indicated by
flat rotation curves resided indeed in a more or less round halo or was
part of the disk. That the latter was not the case was shown in 1981,
using evidence from bulge isophotes in external galaxies and star
counts in our Galaxy (Monet et al. 1981) and from H I flaring in NGC 891 (van der Kruit 1981). Next, the question of the actual flattening q = c/a
of dark halos in spiral galaxies arose and we will now review previous
work on this subject, starting with our Galaxy. One of the early
methods is the analysis of the local surface density in the Solar
neighbourhood using stellar kinematics. With this method Binnet et al. (1987) find
![]() ,
van der Marel (1991)
,
van der Marel (1991)
![]() and Bienaymé et al. (2006)
and Bienaymé et al. (2006) ![]() .
.
At large radial distances of
![]() kpc, RR Lyrae stars show the dark matter distribution to be flattened by
kpc, RR Lyrae stars show the dark matter distribution to be flattened by
![]() (Amendt & Cuddeford 1994).
Hyper-velocity stars open another promising way of probing the shape of
the Galactic dark matter distribution. One star, assuming it is
70 kpc away, gives
0.5 < q < 1.6 (Gnedin et al. 2005). Samurovic et al. (1999)
used the microlensing optical depth towards the Galactic bulge, LMC,
SMC and M 31 to probe the shape of the Galactic halo to large
radii (
(Amendt & Cuddeford 1994).
Hyper-velocity stars open another promising way of probing the shape of
the Galactic dark matter distribution. One star, assuming it is
70 kpc away, gives
0.5 < q < 1.6 (Gnedin et al. 2005). Samurovic et al. (1999)
used the microlensing optical depth towards the Galactic bulge, LMC,
SMC and M 31 to probe the shape of the Galactic halo to large
radii (
![]() ). However, they were not able to derive strong constraints: q =0.6
). However, they were not able to derive strong constraints: q =0.6 ![]() 0.4.
0.4.
Since the discovery of the Sagittarius dwarf galaxy, modelling
of its extended stellar tidal debris stream has become one of the most
promising methods. Majewski et al. (2003) show that the Sagittarius stream traces a great circle around our Galaxy, extending to radii of 2 R25
from the Galactic centre. If the tidal debris has made several
orbits, the Galactic halo must be near-spherical so that the stream
does not precess away from a single plane. Merrifield (2004)
argued that the apparent coherency of the carbon star kinematics in the
stream suggest that all the stars are on the same wrap, making it
impossible to constrain the halo flattening. Conversely, Ibata et al. (2001) contend that the stream has made several orbits, and from this infer that the Galactic halo must have flattening ![]() in the radial range
16 < R < 60 kpc.
in the radial range
16 < R < 60 kpc.
Recently, numerically modelling of small satellite infall on a Sgr-like orbit by Helmi (2004a) finds that tidal streams younger than about 2 Gyr lead to spatially coherent streams for a large
range of halo flattenings
![]() .
Since then she (Helmi 2004b) has significantly revised her initial measurement to a highly prolate shape with
.
Since then she (Helmi 2004b) has significantly revised her initial measurement to a highly prolate shape with
![]() by constraining the star sample to the older Sgr stream stars of Law et al. (2005). However, Johnston et al. (2005) dispute this result, finding a near-spherical halo with
by constraining the star sample to the older Sgr stream stars of Law et al. (2005). However, Johnston et al. (2005) dispute this result, finding a near-spherical halo with
![]() .
In a more recent analysis of the Magellanic Stream Ruzicka et al. (2007) find a flattening of
.
In a more recent analysis of the Magellanic Stream Ruzicka et al. (2007) find a flattening of
![]() .
.
The situation for halo shape measurement in external galaxies is just
as confusing, because some methods are suited only to specific types of
galaxies. The determination of halo shape from polar ring galaxies is
such a case. By simply comparing the equatorial and polar rotation
curves it is possible to ascertain the flattening of the total
potential. Using this method NGC 4650A and A0136-0801
were found to be moderately flattened with ![]() (Schweizer et al. 1983; Whitmore et al. 1987, respectively), while MCG-5-7-1 was found to be approximately spherical (Whitmore et al. 1987).
A potentially more accurate method is to model the rotation along
both
axes using a multi component mass model comprising bulge, equatorial
stellar and gas disks, and polar stellar and gas rings. Using this
method, Sackett & Sparke (1990) originally found the halo flattening of NGC 4650A to be
(Schweizer et al. 1983; Whitmore et al. 1987, respectively), while MCG-5-7-1 was found to be approximately spherical (Whitmore et al. 1987).
A potentially more accurate method is to model the rotation along
both
axes using a multi component mass model comprising bulge, equatorial
stellar and gas disks, and polar stellar and gas rings. Using this
method, Sackett & Sparke (1990) originally found the halo flattening of NGC 4650A to be
![]() ;
subsequent higher quality observations were able to constrain the halo more tightly, to
;
subsequent higher quality observations were able to constrain the halo more tightly, to
![]() (Sackett et al. 1994). This method has also been applied to AM2020-504, where the flattening was found to be
(Sackett et al. 1994). This method has also been applied to AM2020-504, where the flattening was found to be
![]() (Arnaboldi et al. 1993).
Another method involves modelling of the twisting caused by precession of the ring. With some specific assumptions, Steiman-Cameron et al. (1992) constrain the flattening of the NGC 4753 halo to be
(Arnaboldi et al. 1993).
Another method involves modelling of the twisting caused by precession of the ring. With some specific assumptions, Steiman-Cameron et al. (1992) constrain the flattening of the NGC 4753 halo to be
![]() .
Finally, using the twisting of the morphological minor axis of the disk
plane away from the kinematic minor axis to model the velocity field of
polar rings, the flattening of the dark halo of A0136-0801 was found to
be
.
Finally, using the twisting of the morphological minor axis of the disk
plane away from the kinematic minor axis to model the velocity field of
polar rings, the flattening of the dark halo of A0136-0801 was found to
be
![]() (Sackett & Pogge 1995).
(Sackett & Pogge 1995).
Another method that has been used to measure halo flattening is strong
gravitational lensing. An early study of a double lens system
comprising two spirals found ![]() (Koopmans et al. 1998). More recently there have been two studies of multiple quad lens systems finding
(Koopmans et al. 1998). More recently there have been two studies of multiple quad lens systems finding ![]() (Rusin & Tegman 2110) and
(Rusin & Tegman 2110) and
![]() (Cohn & Kochanek 2004), and another analysis of a double lens system
0.6 < q < 0.7 (Chae et al. 2002).
(Cohn & Kochanek 2004), and another analysis of a double lens system
0.6 < q < 0.7 (Chae et al. 2002).
Warps in stellar disks (e.g. Reshetnikov & Combes 1998)
offer several mechanisms to probe the halo shape of spiral galaxies.
One method uses the precession of the warped disk to constrain the halo
flattening. It has been applied to NGC 2903, yielding a halo
flattening of q = 0.80 ![]() 0.15 (Hofner & Sparke 1994).
0.15 (Hofner & Sparke 1994).
It is also possible to measure the mean shape of vast numbers of
galaxies via weak gravitational lensing. Measurements of about 105 lensed systems against about 106 background galaxies (Hoekstra et al. 2005) find a mean projected halo ellipticity of
0.20+0.04-0.05 and a mean
projected halo flattening of
![]() (1-
(1-![]() error).
However, a larger investigation of about 2 million lensed
galaxies against 32 million background galaxies from the
SDSS dataset found no strong evidence of flattening, with
error).
However, a larger investigation of about 2 million lensed
galaxies against 32 million background galaxies from the
SDSS dataset found no strong evidence of flattening, with
![]() (Mandelbaum et al. 2006).
(Mandelbaum et al. 2006).
The results of halo flattening studies so far do not reveal a
consistent picture. We believe that the method of the flaring of the
gas layer is among the most promising, at least for late-type
spiral galaxies. First tried by Celnik et al. (1979) on the Galaxy, early development of the method was undertaken by van der Kruit (1981)
who applied it to low resolution observations of NGC 891,
concluding that the halo was not as flattened as the stellar disk.
It was then applied to several galaxies in the 1990's, most
notably the careful study of the very nearby
Sc galaxy NGC 4244, which found a highly flattened halo
with by
q=0.2+0.3-0.1 out to radii of
![]() (Olling 1996). All applications of the flaring method have indicated highly flattened halo distributions with
(Olling 1996). All applications of the flaring method have indicated highly flattened halo distributions with
![]() (Becquaert & Combes 1997; Becquaert 1997; Sicking 1997). Recently, Banerjee & Jog (2008) measured a flattening of q=0.4
from flaring of the H I layer in M 31. This assumed a
constant H I velocity dispersion with radius; if it is
allowed to have a modest decline in the outer disk the flattening can
be made less with q more like 0.5 to 0.6. With
the exclusion of NGC 4244, it may therefore be suspected that
the assumption of a radially constant gas velocity dispersion has led
to errors in the derived flattening of the halo.
(Becquaert & Combes 1997; Becquaert 1997; Sicking 1997). Recently, Banerjee & Jog (2008) measured a flattening of q=0.4
from flaring of the H I layer in M 31. This assumed a
constant H I velocity dispersion with radius; if it is
allowed to have a modest decline in the outer disk the flattening can
be made less with q more like 0.5 to 0.6. With
the exclusion of NGC 4244, it may therefore be suspected that
the assumption of a radially constant gas velocity dispersion has led
to errors in the derived flattening of the halo.
Measurements of significant flattening using the flaring method
initially led to the supposition that perhaps the method is
systematically biased to flattened halos. Our analysis of UGC 7321
shows that this is not the case: the gas layer flaring method is
just as sensitive to prolate halos as it is to oblate ones. Here, we
briefly consider the set of q measurements using the flaring
method that have indicated flat halos. The flattening for NGC 891 (Becquaert & Combes 1997) was estimated from VLA observations with a low peak signal-to-noise of 13 (Rupen 1991). The low sensitivity could have led to underestimates of the gas density and vertical flaring, thus changing the shape of
both
![]() and
and
![]() ,
and thereby q. Except in the case of NGC 4244 (Olling 1996),
it is unclear what model was used for the radial gas velocity
dispersion. An assumption of radially-constant gas velocity
dispersion could easily skew the
derived halo shape measurement.
,
and thereby q. Except in the case of NGC 4244 (Olling 1996),
it is unclear what model was used for the radial gas velocity
dispersion. An assumption of radially-constant gas velocity
dispersion could easily skew the
derived halo shape measurement.
In some cases it is not clear whether the gas self-gravity was
included in the mass modelling.
Additionally, excluding NGC 4244, all the previous measurements of
the halo flattening from the gas layer flaring were performed on large
Sb-Sc galaxies with maximum rotation speeds
![]() between 177 and 295 km s-1. As the gas layer flaring is inversely proportional to
between 177 and 295 km s-1. As the gas layer flaring is inversely proportional to
![]() ,
the maximum H I flaring of these galaxies is
,
the maximum H I flaring of these galaxies is ![]() kpc, making it difficult to resolve unless the galaxy is nearer than 5 Mpc.
kpc, making it difficult to resolve unless the galaxy is nearer than 5 Mpc.
The Galactic q measurement from the gas flaring by Olling & Merrifield (2000)
is particularly interesting. They were unable to fit the halo with a
pseudo-isothermal model, unless the Solar radius and rotation velocity
are significantly less (
![]() kpc,
kpc,
![]() km s-1) than the standard values. The uncertainty associated with these values translates to a large
uncertainty of q: q=0.8
km s-1) than the standard values. The uncertainty associated with these values translates to a large
uncertainty of q: q=0.8 ![]() 0.3.
0.3.
UGC 7321 is the least massive galaxy for which the halo flattening has been measured. The derived R-band face-on central surface brightness is 2.5 times fainter than the B-band measurement of NGC 4244, and the total R-band luminosity is 4.5 times fainter than NGC 4244, while its gas layer flares to twice the height of NGC 4244. The very low stellar mass of UGC 7321 made it an ideal candidate for halo modelling with the gas flaring method.
Although there are now a number of different measurements of galactic halo flattening, there is no obvious concentration around a particular halo shape or any correlation of halo flattening with galaxy morphology. Currently the measured q values range from 0.1 to 1.4. The low q values for the large Sb galaxies, M 31, NGC 891 and NGC 4013, are puzzling as in these cases the stellar density distribution may be more spherical than the halo density distribution. It seems unlikely that the galactic halos could exist in the range of shapes measured, unless the fractions of the constituent dark matter types vary significantly from galaxy to galaxy. Early work by Dubinski (1994) found that including baryon infall in n-body halo simulations led to nearly axisymmetric halos. Most n-body simulations without hydrodynamics tend to form prolate halos (Sellwood 2004); however, new work by Dubinski (unpublished) has shown that the inclusion of hydrodynamical modelling generates halos that are more spherical.
We note here an application of H I hydrostatics to our Galaxy by Kalberla et al. (2007),
which illustrates the potential power of H I hydrostatics to trace
the Galactic potential gradient and hence the total dark matter
distribution in the Galaxy. Kalberla et al. adopted an isothermal
velocity dispersion for the Galactic H I and found several
components of dark matter, including the usual extended halo with a
mass of about 1.8 ![]() 1012
1012 ![]() ,
a thick self-gravitating disk with a mass of about 2 to 3
,
a thick self-gravitating disk with a mass of about 2 to 3 ![]() 1011
1011 ![]() ,
and an outer dark matter ring with a mass of about 2 to 3
,
and an outer dark matter ring with a mass of about 2 to 3 ![]() 1010
1010 ![]() .
Similar studies in other edge-on galaxies may reveal comparable
substructure in the dark matter, including dark matter rings which may
be left over from accreted
and circularized smaller galaxies, drawn down into the disk by
dynamical friction. As we will argue in the next section, it is
important to measure the structure, rotation and velocity dispersion of
the H I in both R and z, to ensure such structures are not artifacts of assumptions required to apply the hydrostatics.
.
Similar studies in other edge-on galaxies may reveal comparable
substructure in the dark matter, including dark matter rings which may
be left over from accreted
and circularized smaller galaxies, drawn down into the disk by
dynamical friction. As we will argue in the next section, it is
important to measure the structure, rotation and velocity dispersion of
the H I in both R and z, to ensure such structures are not artifacts of assumptions required to apply the hydrostatics.
Finally we note that since we submitted the original version of this paper, a study of the density distribution of dark matter halo of UGC 7321 by Banerjee et al. (2010) appeared, using the rotation curve and flaring of the H I layer derived from the same data. In this study the fitting was performed with the halo central density, core radius and radial exponential density slope as free parameters, but with the halo assumed spherical, the stellar M/L of the disk fixed and using values for the H I velocity dispersion from Gaussian fits to the position-velocity profiles (typically 7 to 9 km s-1). These authors also conclude from their work that the dark matter halo dominates the dynamics of UGC 7321 at all radii, but they rule out a dark matter halo flatter than a spherical one.
6 Conclusions
In this study we have shown that it is possible to measure the gas flaring and H I velocity dispersion via modelling of the H I distribution. Using these methods we found that the small late-type disk galaxies in our sample show substantial H I flaring, increasing linearly with radius in the inner disk and exponentially in the outer disk. The H I velocity dispersion has a mean value of 7 km s-1, but varies from 4.5 to 12 km s-1. Our H I modelling method is also capable of measuring the vertical variation of the H I velocity dispersion given additional H I observations.
UGC 7321, a small low surface brightness Sd galaxy in
our sample, has the most accurate flaring measurements in our sample.
We were unable to model the observations using a pseudo-isothermal
halo.
By lowering the asymptotic halo rotation to a value corresponding
to a true isothermal halo model, we found that UGC 7321 has a
spherical halo density distribution of q=1.0 ![]() 0.1. Highly prolate halos (q>1.2) and highly flattened halos (q<0.6) are strongly excluded if our approximation of a true isothermal halo is valid.
0.1. Highly prolate halos (q>1.2) and highly flattened halos (q<0.6) are strongly excluded if our approximation of a true isothermal halo is valid.
Our mass modelling analysis assumed that the H I gas velocity
dispersion was vertically isothermal, as no measurements of the
vertical variation of the H I gas velocity dispersion are as yet
available![]() .
If the H I velocity dispersion is in fact vertically
declining, this would lead to a larger estimated vertical gradient of
the total vertical force, which may allow a pseudo-isothermal
model for the halo.
.
If the H I velocity dispersion is in fact vertically
declining, this would lead to a larger estimated vertical gradient of
the total vertical force, which may allow a pseudo-isothermal
model for the halo.
UGC 7321 is a gas-rich galaxy (
![]() ), with a very low stellar mass galaxy (M=3
), with a very low stellar mass galaxy (M=3 ![]() 108
108 ![]() ), four times less massive than the gas disk. The R-band stellar mass-to-light ratio of UGC 7321 is very low at
), four times less massive than the gas disk. The R-band stellar mass-to-light ratio of UGC 7321 is very low at
![]() .
Mass modelling of the vertical force
distribution showed that vertical force fitting provides a much
stronger constraint on the stellar mass-to-light ratio than the
standard method of radial force fitting via rotation curve
decomposition.
.
Mass modelling of the vertical force
distribution showed that vertical force fitting provides a much
stronger constraint on the stellar mass-to-light ratio than the
standard method of radial force fitting via rotation curve
decomposition.
Two important assumptions in this work need to be tested
further. The first is that the H I velocity dispersion is
isothermal in z. For a definitive estimate of the R and z-components
of the
total potential gradients from H I hydrostatics, it is
essential to have reliable measurements of the H I density,
rotation and velocity dispersion as a function of both R and z.
It should
be possible, with additional short spacing ATCA observations
supplementing our data, to measure the H I velocity
dispersion as a function of z
in ESO274-G001 by modelling the H I XV diagram at varying
heights above the galactic plane. ESO274-G001 is the closest, isolated,
southern edge-on galaxy at a distance of 3.4 Mpc. In the
northern hemisphere, UGC 7321 is a prime candidate due
to its high H I mass, despite its larger distance of 10 Mpc.
The large H I flaring means that the H I could be measured at a
height of 400 pc for radii from 5-11 kpc, and
at 700 pc for radii from
9-11 kpc. The dwarf Scd galaxy NGC 5023 is also an
excellent candidate, given its distance of about 8 Mpc (van der Kruit & Searle 1982). For this galaxy, early flaring measurements by Bottema et al. (1986)
found that the gas thickness was constant with radius. This is a surprising result, because the
![]() value for this galaxy is only about 80 km s-1,
and large flaring might be expected. It would be interesting to
measure the radial and vertical variation of the gas velocity
dispersion, gas flaring, and halo shape using beter data, as this
galaxy has a similar size, H I brightness and total mass
as UGC 7321.
value for this galaxy is only about 80 km s-1,
and large flaring might be expected. It would be interesting to
measure the radial and vertical variation of the gas velocity
dispersion, gas flaring, and halo shape using beter data, as this
galaxy has a similar size, H I brightness and total mass
as UGC 7321.
The other important test is to determine whether a true
isothermal halo provides a better model than the pseudo-isothermal halo
for the dark matter in late-type disk galaxies, or whether there are
better models than either of these. Our analysis of UGC 7321 has
shown that the vertical gradient of the vertical force provides a
significantly stronger constraint on the halo density distribution
than does rotation curve decomposition. So, this test can in
principle be achieved by analysing UGC 7321 and the other galaxies
in our sample with both flattened pseudo-isothermal and true isothermal
halo models. Such flattened isothermal halos could be flattened by
rotation or by anisotropy of the velocity dispersion. This will
determine which kind of model is better for both the radial halo force
as measured from the rotation curve, and the vertical force of the halo
determined from
![]() fitting.
fitting.
We are very grateful to Albert Bosma who contributed greatly to initiating this project. He pointed out that H I flaring studies are best done on edge-on galaxies with low maximum rotational velocities, and we used an unpublished Parkes H I survey of edge-on galaxies by Bosma and KCF when selecting our galaxies. J.C.O. thanks E. Athanassoula, M. Bureau, R. Olling, A. Petric and J. van Gorkom for helpful discussions. J.C.O. is grateful to B. Koribalski, R. Sault, L. Staveley-Smith and R. Wark for help and advice with data reduction and analysis, and to P. Sackett, A. Kalnajs and F. Briggs for advice and discussions on the modelling. M. Pohlen generously provided his deep R-band image of UCG 7321, for which we are very grateful. Scott Tremaine has our gratitude for a few important comments on a draft version of this paper. We thank the referee, J. M. van der Hulst, for his careful and thorough reading of the manuscripts of this series of papers and his helpful and constructive remarks and suggestions.
References
- Amendt, P., & Cuddeford, P. 1994, ApJ, 435, 93 [NASA ADS] [CrossRef] [Google Scholar]
- Arnaboldi, M., Capaccioli, M., Cappellaro, E., Held, E. V., & Sparke, L. 1993, A&A, 267, 21 [NASA ADS] [Google Scholar]
- Bailin, J., & Steinmetz, M. 2004, ApJ, 616, 27 [NASA ADS] [CrossRef] [Google Scholar]
- Banerjee, A., & Jog, C. J. 2008, 685, 254 [Google Scholar]
- Banerjee, A., Matthews, L. D., & Jog, C. J. 2010, New Astron., 15, 89 [NASA ADS] [CrossRef] [Google Scholar]
- Becquaert, J.-F. 1997, Ph.D. Thesis, University of Paris [Google Scholar]
- Becquaert, J.-F., & Combes, F. 1997, A&A, 325, 41 [NASA ADS] [Google Scholar]
- Bienamyé, O., Soubiran, C., Mishenina, T. V., Kovtyukh, V. V., & Siebert, A. 2006, A&A, 446, 993 [Google Scholar]
- Binney, J., May, A., & Ostriker, J. P. 1987, MNRAS, 226, 149 [NASA ADS] [Google Scholar]
- Bottema, R., Shostak, G. S., & van der Kruit, P. C. 1986, A&A, 167, 34 [NASA ADS] [Google Scholar]
- Carignan, C., & Freeman, K. C. 1985, ApJ, 294, 494 [NASA ADS] [CrossRef] [Google Scholar]
- Carignan, C., & Freeman, K. C. 1988, ApJ, 332, L33 [NASA ADS] [CrossRef] [Google Scholar]
- Chae, K.-H., Biggs, A. D., Blandford, R. D., et al. 2002, Phys. Rev. Lett., 89, 151301 [NASA ADS] [CrossRef] [PubMed] [Google Scholar]
- Celnik, W., Rohlfs, K., & Braunsfurth, E. 1979, A&A, 76, 24 [NASA ADS] [Google Scholar]
- Cohn, J. D., & Kochanek, C. S. 2004, ApJ, 608, 25 [NASA ADS] [CrossRef] [Google Scholar]
- Dubinski, J. 1994, ApJ, 431, 617 [Google Scholar]
- Gnedin, O. Y., Gould, A., Miralda-Escude, J., & Zentner, A. R. 2005, ApJ, 634, 344 [NASA ADS] [CrossRef] [Google Scholar]
- Helmi, A. 2004a, MNRAS, 351, 643 [NASA ADS] [CrossRef] [Google Scholar]
- Helmi, A. 2004b, ApJ, 610, L97 [NASA ADS] [CrossRef] [Google Scholar]
- Hoekstra, H., Yee, H. K. C., & Gladders, M. D. 2005, ApJ, 606, 67 [Google Scholar]
- Hofner, P., & Sparke, L. S. 1994, ApJ, 428, 466 [NASA ADS] [CrossRef] [Google Scholar]
- Ibata, R., Lewis, G. F., Irwin, M., Totten, E., & Quinn, T. 2001, ApJ, 551, 294 [NASA ADS] [CrossRef] [Google Scholar]
- Johnston, K. V., Law, D. R., & Majewski, S. R. 2005, AJ, 619, 800 [NASA ADS] [CrossRef] [Google Scholar]
- Kalberla, P. M. W., Dedes, L., Kerp, J., & Haud, U. 2007, A&A, 469, 511 [NASA ADS] [CrossRef] [EDP Sciences] [Google Scholar]
- Koopmans, L. V. E., de Bruyn, A. G., & Jackson, N. 1998, MNRAS, 295, 534 [NASA ADS] [CrossRef] [Google Scholar]
- Kormendy, J., & Freeman, K. C. 2004, IAU Symp., 220, 377 [NASA ADS] [Google Scholar]
- Kundic, T., Hernquist, H., & Gunn, J. E. 1993, AIP Conf. Ser., 278, 292 [Google Scholar]
- Law, D. R., Johnston, K. V., & Majewski, S. R. 2005, ApJ, 619, 807 [NASA ADS] [CrossRef] [Google Scholar]
- Majewski, S. R., Skrutskie, M. F., Weinberg, M. D., & Ostheimer, J. C. 2003, ApJ, 599, 1082 [NASA ADS] [CrossRef] [Google Scholar]
- Maloney, P. 1992, NASA Conf. Publ., 3190, 117 [Google Scholar]
- Maloney, P. 1993, ApJ, 414, 41 [NASA ADS] [CrossRef] [Google Scholar]
- Mandelbaum, R., Hirata, C. M., Broderick, T., Seljak, U., & Brinkmann, J. 2006, MNRAS, 370, 1008 [NASA ADS] [CrossRef] [Google Scholar]
- Matthews, L. D., Galagher, J. S., & van Driel, W. 1999, AJ, 118, 2751 [NASA ADS] [CrossRef] [Google Scholar]
- Matthews, L. D. 2000, AJ, 120, 1764 [NASA ADS] [CrossRef] [Google Scholar]
- Merrifield, M. R. 2004, IAU Symp., 220, 431 [NASA ADS] [Google Scholar]
- Meurer, G. R., Carignan, C., Beaulieu, S. F., & Freeman, K. C. 1996, AJ, 111, 1551 [NASA ADS] [CrossRef] [Google Scholar]
- Monet, D. G., Richstone, D. O., & Schechter, P. L. 1981, ApJ, 245, 454 [NASA ADS] [CrossRef] [Google Scholar]
- O'Brien, J. C., Freeman, K. C., van der Kruit, P. C., & Bosma, A. 2010a, A&A, 515, A60 (Paper I) [NASA ADS] [CrossRef] [EDP Sciences] [Google Scholar]
- O'Brien, J. C., Freeman, K. C., & van der Kruit, P. C. 2010b, A&A, 515, A61 (Paper II) [NASA ADS] [CrossRef] [EDP Sciences] [Google Scholar]
- O'Brien, J. C., Freeman, K. C., & van der Kruit, P. C. 2010c, A&A, 515, A62 (Paper III) [NASA ADS] [CrossRef] [EDP Sciences] [Google Scholar]
- Olling, R. P. 1995, AJ, 110, 591 [NASA ADS] [CrossRef] [Google Scholar]
- Olling, R. P., & van Gorkom, J. H. 1993, Third Teton Summer School, 374 [Google Scholar]
- Olling, R. P. 1996, AJ, 112, 481 [NASA ADS] [CrossRef] [Google Scholar]
- Olling, R. P., & Merrifield, M. R. 2000, MNRAS, 311, 361 [NASA ADS] [CrossRef] [Google Scholar]
- Pohlen, M., Dettmar, R.-J., Lütticke, R., & Aronca, G. 2002, A&A, 392, 807 [NASA ADS] [CrossRef] [EDP Sciences] [Google Scholar]
- Pohlen, M., Balcells, M., Lütticke, R., & Dettmar, R.-J. 2003, A&A, 409, 485 [NASA ADS] [CrossRef] [EDP Sciences] [Google Scholar]
- Reshetnikov, V., & Combes, F. 1998, A&A, 337, 9 [NASA ADS] [Google Scholar]
- Rupen, M. P. 1991, AJ, 102, 48 [NASA ADS] [CrossRef] [Google Scholar]
- Rusin, D., & Tegman, M. 2001, ApJ, 553, 709 [NASA ADS] [CrossRef] [Google Scholar]
- Ruzicka, A., Palous, J., & Theis, C. 2007, A&A, 461, 155 [NASA ADS] [CrossRef] [EDP Sciences] [Google Scholar]
- Sackett, P. D., & Pogge, R. W. 1999, AIP Conf., 336, 141 [NASA ADS] [CrossRef] [Google Scholar]
- Sackett, P. D., & Sparke, L. S. 1990, ApJ, 361, 408 [NASA ADS] [CrossRef] [Google Scholar]
- Sackett, P. D., Rix, H., Jarvis, B. J., & Freeman, K. C. 1994, ApJ, 436, 629 [NASA ADS] [CrossRef] [Google Scholar]
- Samurovic, S., Cirkovic, M. M., & Milosevic-Zdjelar, V. 1999, MNRAS, 309, 63 [NASA ADS] [CrossRef] [Google Scholar]
- Schweizer, F., Whitmore, B. C., & Rubin, V. C. 1983, AJ, 88, 909 [NASA ADS] [CrossRef] [Google Scholar]
- Sellwood, J. A., & Balbus, S. A. 1999, ApJ, 511, 660 [NASA ADS] [CrossRef] [Google Scholar]
- Sellwood, J. A. 2004, IAU. Symp., 220, 27 [NASA ADS] [Google Scholar]
- Shostak, G. S., & van der Kruit, P. C. 1984, A&A, 132, 20 [NASA ADS] [Google Scholar]
- Sicking, F. J. 1997, Ph.D. Thesis, University of Groningen [Google Scholar]
- Steiman-Cameron, T. Y., Kormendy, J., & Durisen, R. H. 1992, AJ, 104, 1339 [NASA ADS] [CrossRef] [Google Scholar]
- Uson, J. M., & Matthews, L. D. 2003, AJ, 125, 2455 [NASA ADS] [CrossRef] [Google Scholar]
- van der Kruit, P. C. 1981, A&A, 99, 298 [NASA ADS] [Google Scholar]
- van der Kruit, P. C., & Searle, L. 1982, A&A, 110, 61 [NASA ADS] [Google Scholar]
- van der Marel, R. P. 1991, MNRAS, 248, 515 [NASA ADS] [Google Scholar]
- Whitmore, B. C., McElroy, D. B., & Schweizer, F. 1987, ApJ, 314, 439 [NASA ADS] [CrossRef] [Google Scholar]
Footnotes
- ... dispersion
![[*]](/icons/foot_motif.png)
- Because of S/N limitations, our measurement of the gas velocity dispersion in Paper III models the H I XV diagram integrated over z. Thus it represents a luminosity-weighted average dispersion as a function of radius.
- ... available
- Our measurements of the H I gas velocity dispersion used the vertically averaged H I distribution, i.e. they are the luminosity-weighted mean velocity dispersion as a function of radius.
All Figures
| |
Figure 1: Projected stellar surface
density of UGC 7321 averaged over all quadrants. Contours are
separated on a log scale at 0.1, 0.3, 1, 3, 10, 30 |
| Open with DEXTER | |
| In the text | |
| |
Figure 2:
Stellar luminosity volume density in R and z
after deprojecting the observed surface density using the Inverse Abel
Integral. Contours are separated on a log scale
at 0.0001, 0.003, 0.001, 0.003, 0.01, 0.03, 0.1, 0.3 |
| Open with DEXTER | |
| In the text | |
| |
Figure 3: Exponential fits to the radial and vertical surface brightness profiles formed by integrating over the deprojected volume density. The arrows mark the radial scalelength ( left) and vertical scaleheight ( right). |
| Open with DEXTER | |
| In the text | |
|
|
Figure 4:
Scaled rotation curves of a flattening pseudo-isothermal halo for two different values of the halo flattening q. The thick, black curve shows the rotation curve of q=0.3 and the thin, red curve shows the rotation for q=0.9 with the radius scaled by 0.84. The vertical axis shows the rotation normalised by the asymptotic rotation
|
| Open with DEXTER | |
| In the text | |
|
|
Figure 5:
Rotation curve decomposition of UGC 7321. The observed rotation
curve is shown by the thick (black) line, while the rotation due to the
other components are shown by dashed lines; from the bottom up stars
(red), gas (green) and the halo (blue). The disk has in this fit
an M/LR of 1.05. The resulting fit,
|
| Open with DEXTER | |
| In the text | |
|
|
Figure 6:
The vertical gradient of the vertical force. The total gradient,
|
| Open with DEXTER | |
| In the text | |
|
|
Figure 7: The vertical gradient equated near the midplane of a flattened pseudo-isothermal halo, as calculated from Eq. (6) of Sackett et al. (1994) for both oblate and prolate halos ranging from q of 0.5 to 1.5 in steps of 0.1. The bottom curve corresponds to the most flattened halo with q=0.5, becoming increasingly shallow as the halo gets less flat. The gradient of a spherical halo is shown by the dashed line. The top curve corresponds to q=1.5. |
| Open with DEXTER | |
| In the text | |
|
|
Figure 8: This figure shows the difference in the rotation curve and velocity dispersion of isothermal and pseudo-isothermal halo models. The top panel shows that rotation of an IT halo rises above the asymptotic rotation speed at large radii, before declining to it, while the rotation curve of a PIT halo approaches the asymptotic rotation from below. Both rotation curves are scaled to the same asymptotic rotation speed to allow comparison. The lower panel shows that an isotropic pseudo-isothermal halo is not isothermal, exhibiting a lower velocity dispersion at low radii. (Adapted from Fig. 1 of Kormendy & Freeman 2004.) |
| Open with DEXTER | |
| In the text | |
|
|
Figure 9:
The z-gradient of the vertical force showing successful fits of the halo shape for a zero mass disk M/LR=0. The black curve, labelled ``total'' shows the total gradient
|
| Open with DEXTER | |
| In the text | |
|
|
Figure 10:
The z-gradient of the vertical force showing successful fits of the halo shape for stellar mass-to-light ratio M/LR=0.2. The curve are coloured as in Fig. 9, except that the line for the stars is now at non-zero values. The
cyan line, labelled ``halo+stars'', shows again the difference
|
| Open with DEXTER | |
| In the text | |
Copyright ESO 2010
Current usage metrics show cumulative count of Article Views (full-text article views including HTML views, PDF and ePub downloads, according to the available data) and Abstracts Views on Vision4Press platform.
Data correspond to usage on the plateform after 2015. The current usage metrics is available 48-96 hours after online publication and is updated daily on week days.
Initial download of the metrics may take a while.