| Issue |
A&A
Volume 514, May 2010
|
|
|---|---|---|
| Article Number | A60 | |
| Number of page(s) | 20 | |
| Section | Cosmology (including clusters of galaxies) | |
| DOI | https://doi.org/10.1051/0004-6361/200913810 | |
| Published online | 20 May 2010 | |
J0454-0309: evidence of a strong lensing fossil group falling into a poor galaxy cluster![[*]](/icons/foot_motif.png)
M. Schirmer1 - S. Suyu1 - T. Schrabback2 - H. Hildebrandt2 - T. Erben1 - A. Halkola3,4
1 - Argelander-Institut für Astronomie, Universität Bonn, Auf dem Hügel 71, 53121 Bonn, Germany
2 -
Leiden Observatory, Leiden University, Niels Bohrweg 2, 2333 Leiden, The Netherlands
3 -
University of Tuorla Observatory, Väisäläntie 20, 21500 Piikkiö, Finland
4 -
Excellence Cluster Universe, Technische Universität München, Boltzmannstr. 2, 85748 Garching, Germany
Received 5 December 2009 / Accepted 4 February 2010
Abstract
Aims. We have discovered a strong lensing fossil group
(J0454) projected near the well-studied cluster MS0451-0305. Using
the large amount of available archival data, we compare J0454 to normal
groups and clusters. A highly asymmetric image configuration of
the strong lens enables us to study the substructure of
the system.
Methods. We used multicolour Subaru/Suprime-Cam and
CFHT/Megaprime imaging, together with Keck spectroscopy to identify
member galaxies. A VLT/FORS2 spectrum was taken to determine the
redshifts of the brightest elliptical and the lensed arc. Using
HST/ACS images, we determined the group's weak lensing signal and
modelled the strong lens system. This is the first time that a fossil
group is analysed with lensing methods. The X-ray luminosity and
temperature were derived from XMM-Newton data.
Results. J0454 is located at z=0.26, with a gap of
2.5 mag between the brightest and second brightest galaxies within
half the virial radius. Outside a radius of 1.5 Mpc, we find two
filaments extending over 4 Mpc, and within we identify
31 members spectroscopically and 33 via the red sequence with
i<22 mag. They segregate into spirals (
![]() )
and a central concentration of ellipticals (
)
and a central concentration of ellipticals (
![]() ), establishing a morphology-density relation. Weak lensing and cluster richness relations yield consistent values of
r200=810-850 kpc and
M200=(0.75-0.90)
), establishing a morphology-density relation. Weak lensing and cluster richness relations yield consistent values of
r200=810-850 kpc and
M200=(0.75-0.90) ![]()
![]() .
The brightest group galaxy (BGG) is inconsistent with the dynamic centre of J0454. It strongly lenses a galaxy at z=2.1
.
The brightest group galaxy (BGG) is inconsistent with the dynamic centre of J0454. It strongly lenses a galaxy at z=2.1 ![]() 0.3, and we model the lens with a pseudo-isothermal elliptical mass
distribution. A high external shear, and a discrepancy
between the Einstein radius and the weak lensing velocity dispersion
requires that the BGG must be offset from J0454's dark halo centre by
at least 90-130 kpc. The X-ray halo is offset by 24
0.3, and we model the lens with a pseudo-isothermal elliptical mass
distribution. A high external shear, and a discrepancy
between the Einstein radius and the weak lensing velocity dispersion
requires that the BGG must be offset from J0454's dark halo centre by
at least 90-130 kpc. The X-ray halo is offset by 24 ![]() 16 kpc from the BGG, shows no signs of a cooling flow and can be fit by a single
16 kpc from the BGG, shows no signs of a cooling flow and can be fit by a single ![]() -model. With
-model. With
![]()
![]()
![]() J0454 falls onto standard cluster scaling relations, but appears cooler (T=1.1
J0454 falls onto standard cluster scaling relations, but appears cooler (T=1.1 ![]() 0.1 keV) than expected (
0.1 keV) than expected (![]() keV).
Taken all together, these data indicate that J0454 consists of two
systems, a sparse cluster and an infalling fossil group, where the
latter seeds the brightest cluster galaxy. An alternative to the
sparse cluster could be a filament projected along the line of sight
mimicking a cluster, with galaxies streaming towards the fossil group.
keV).
Taken all together, these data indicate that J0454 consists of two
systems, a sparse cluster and an infalling fossil group, where the
latter seeds the brightest cluster galaxy. An alternative to the
sparse cluster could be a filament projected along the line of sight
mimicking a cluster, with galaxies streaming towards the fossil group.
Key words: galaxies: evolution - galaxies: clusters: individual: J0454-0309 - galaxies: formation
1 Introduction
In a ![]() CDM
cosmology, galaxies acquire mass mostly through minor merger events,
where one galaxy has 0.3 times or less the mass of its collision
partner. Only the most luminous elliptical
galaxies experience a major merger event in their history (Parry et al. 2009). The growth of large elliptical systems is facilitated particularly well in the low-velocity environments of galaxy
groups where dynamical friction (Nusser & Sheth 1999; Chandrasekhar 1943)
is very efficient. This effect increases with the mass of the infalling
galaxy and is higher for lower velocities. In this way galaxies
cool down into the group or cluster core, losing their gas through
ram-pressure stripping along the way (Quilis et al. 2000). At the same time they undergo slower morphological transformations (Parry et al. 2009; Scannapieco et al. 2009),
leading to the formation of the red sequence in the inner region. The
time
scale for dynamical friction depends on the mass of the infalling
galaxy and its distance from the core. For the most massive
galaxies (
CDM
cosmology, galaxies acquire mass mostly through minor merger events,
where one galaxy has 0.3 times or less the mass of its collision
partner. Only the most luminous elliptical
galaxies experience a major merger event in their history (Parry et al. 2009). The growth of large elliptical systems is facilitated particularly well in the low-velocity environments of galaxy
groups where dynamical friction (Nusser & Sheth 1999; Chandrasekhar 1943)
is very efficient. This effect increases with the mass of the infalling
galaxy and is higher for lower velocities. In this way galaxies
cool down into the group or cluster core, losing their gas through
ram-pressure stripping along the way (Quilis et al. 2000). At the same time they undergo slower morphological transformations (Parry et al. 2009; Scannapieco et al. 2009),
leading to the formation of the red sequence in the inner region. The
time
scale for dynamical friction depends on the mass of the infalling
galaxy and its distance from the core. For the most massive
galaxies (
![]() ), it is as short as a few Gyr (Nath 2008; Boylan-Kolchin et al. 2008), implying that large elliptical galaxies in groups can already accur at early times.
), it is as short as a few Gyr (Nath 2008; Boylan-Kolchin et al. 2008), implying that large elliptical galaxies in groups can already accur at early times.
Several mechanisms for the formation of BCGs (the brightest
cluster galaxies) have been suggested, ranging from galactic
cannibalism and cooling flows to merger processes during cluster
collapse
(see von der Linden et al. 2007, and
references therein). Elliptical galaxies growing in this fashion should
be located at the centre of the gravitational potential, and their
recession velocity should match the
mean of the radial velocities of the other cluster members for
virialised systems. Recently, Skibba et al. (2010) have shown that in
![]() of all haloes of mass
of all haloes of mass ![]()
![]()
![]() the BCG is not the central galaxy, falsifying this paradigm. This was
also demonstrated for clusters with higher masses (Oegerle & Hill 2001; von der Linden et al. 2007).
Most of these analyses have in common that the centre of the halo is
identified by the distribution centre of elliptical galaxies or, more
rarely, by the X-ray centroid or weak gravitational lensing. Either of
these methods has advantages and disadvantages; for instance, they can
be hampered by small numbers
of galaxies, low X-ray S/N or projection effects. In
this paper we are in the lucky situation that a strongly lensed galaxy
let us put tight constraints on the dark matter halo centre, and in
this way show that the BCG is not located at the minimum of the
potential. We conclude that the BCG was formed outside the cluster in a
nearby group, which is now falling into the cluster.
the BCG is not the central galaxy, falsifying this paradigm. This was
also demonstrated for clusters with higher masses (Oegerle & Hill 2001; von der Linden et al. 2007).
Most of these analyses have in common that the centre of the halo is
identified by the distribution centre of elliptical galaxies or, more
rarely, by the X-ray centroid or weak gravitational lensing. Either of
these methods has advantages and disadvantages; for instance, they can
be hampered by small numbers
of galaxies, low X-ray S/N or projection effects. In
this paper we are in the lucky situation that a strongly lensed galaxy
let us put tight constraints on the dark matter halo centre, and in
this way show that the BCG is not located at the minimum of the
potential. We conclude that the BCG was formed outside the cluster in a
nearby group, which is now falling into the cluster.
1.1 Fossil groups
Contrary to the quick dynamical collapse of galaxy groups,
the cooling times for their X-ray haloes are comparable to one or
several Hubble times (Sarazin 1988).
This can lead to isolated giant elliptical galaxies, embedded in X-ray
haloes with luminosities characteristic for entire galaxy groups. Such
objects exist in the Universe (Vikhlinin et al. 1999), either isolated (Yoshioka et al. 2004) or
surrounded by groups of less luminous satellite galaxies (Jones et al. 2003; La Barbera et al. 2009; Khosroshahi et al. 2006b). One of the first systems has been reported by Ponman et al. (1994) coining the term ``fossil group'', and Jones et al. (2003)
have introduced general selection criteria. Accordingly, the galaxies must be embedded in an extended X-ray halo with
![]() ,
integrated over the 0.5-2.0 keV
range. In addition, the central elliptical galaxy must be
,
integrated over the 0.5-2.0 keV
range. In addition, the central elliptical galaxy must be
![]() mag brighter in R-band than the second brightest galaxy (independent of morphology) within half
the virial radius. This magnitude gap is motivated by the accretion of L*-galaxies in the inner volume, which are then absent in the group's luminosity function. Current observational samples
(e.g. Khosroshahi et al. 2007; Voevodkin et al. 2010; La Barbera et al. 2009) are largely based on this definition, and so are simulations (von Benda-Beckmann et al. 2008).
mag brighter in R-band than the second brightest galaxy (independent of morphology) within half
the virial radius. This magnitude gap is motivated by the accretion of L*-galaxies in the inner volume, which are then absent in the group's luminosity function. Current observational samples
(e.g. Khosroshahi et al. 2007; Voevodkin et al. 2010; La Barbera et al. 2009) are largely based on this definition, and so are simulations (von Benda-Beckmann et al. 2008).
The selection criteria by Jones et al. (2003) have been relaxed in the course of systematic searches. Santos et al. (2007) have favoured a fixed radius of
0.5 h50 Mpc within which the magnitude
gap must hold, independent of the cluster's virial state. Voevodkin et al. (2010) adopt
![]() ,
with r500 being calculated from the group's X-ray luminosity. Similar relaxations have been adopted for the magnitude gap. Milosavljevic et al. (2006) and La Barbera et al. (2009)
show that there is no sharp transition in the magnitude gap of galaxy
clusters, hence there is no physical motivation for a particular
numeric value. Voevodkin et al. (2010) and La Barbera et al. (2009) favour smaller gap sizes of
,
with r500 being calculated from the group's X-ray luminosity. Similar relaxations have been adopted for the magnitude gap. Milosavljevic et al. (2006) and La Barbera et al. (2009)
show that there is no sharp transition in the magnitude gap of galaxy
clusters, hence there is no physical motivation for a particular
numeric value. Voevodkin et al. (2010) and La Barbera et al. (2009) favour smaller gap sizes of
![]() and 1.75 mag, respectively. According to Voevodkin et al. (2010)
the gap should not be too strict a requirement, as the
determination of the total magnitude of very extended galaxies is
not trivial.
and 1.75 mag, respectively. According to Voevodkin et al. (2010)
the gap should not be too strict a requirement, as the
determination of the total magnitude of very extended galaxies is
not trivial.
As for the formation of the magnitude gap, von Benda-Beckmann et al. (2008) have found in simulations that it usually arises at redshifts 0<z<0.7, after the haloes assembled half of their final mass at 0.8<z<1.2. This is significantly earlier than the formation of normal groups (Dariush et al. 2007) and leads to increased NFW (Navarro et al. 1997) concentration parameters. Accordingly, the last major merger in the simulated fossil groups took place more than 6 Gyr ago for more than 50% of the galaxies. Most of the magnitude gaps are closed at later (current) times when more infall of satellite galaxies occurs.
The exact formation process of fossils is not yet entirely understood. For example, Yoshioka et al. (2004) observe mass-to-light ratios as high as 1000, which are difficult to explain if these galaxies assembled their mass only through dynamical friction. Another uncertainty lies in the type of the galaxies from which the giant elliptical forms. Khosroshahi et al. (2006b) argue that their disky isophotes indicate gas-rich mergers, which would distinguish these galaxies from the BCGs in normal clusters. These tend to show more boxy isophotes from gas-poor mergers. However, La Barbera et al. (2009) do not find a preference for either disky or boxy shapes in their larger sample. They have argued that fossils merely represent a transitional state in the last stages of mass assembly than a class of their own.
While the formation process of fossils is still a matter of debate, their occurrence is not. About ![]() of all X-ray luminous groups and clusters have fossil character (e.g. Jones et al. 2003; von Benda-Beckmann et al. 2008), with typical masses of 1-10
of all X-ray luminous groups and clusters have fossil character (e.g. Jones et al. 2003; von Benda-Beckmann et al. 2008), with typical masses of 1-10 ![]()
![]() .
However, they are difficult to identify observationally. Only a few
dozen systems are known so far, mostly extracted from large-area
surveys such as SDSS (La Barbera et al. 2009; Santos et al. 2007) or the 400D cluster catalogue
(Voevodkin et al. 2010).
The last authors discuss various difficulties in the selection process,
in particular completeness and problems in the accurate determination
of the magnitude of the brightest galaxy. In general,
the observationally determined abundances of fossil groups agree
with those predicted by
simulations. However, in terms of absolute numbers samples are
systematically incomplete since the second brightest galaxy can be at a
sufficiently large physical distance from the centre and still
appear projected onto the inner volume. Assuming that all galaxies are
within the virial radius and follow a radially symmetric distribution,
we estimate that
.
However, they are difficult to identify observationally. Only a few
dozen systems are known so far, mostly extracted from large-area
surveys such as SDSS (La Barbera et al. 2009; Santos et al. 2007) or the 400D cluster catalogue
(Voevodkin et al. 2010).
The last authors discuss various difficulties in the selection process,
in particular completeness and problems in the accurate determination
of the magnitude of the brightest galaxy. In general,
the observationally determined abundances of fossil groups agree
with those predicted by
simulations. However, in terms of absolute numbers samples are
systematically incomplete since the second brightest galaxy can be at a
sufficiently large physical distance from the centre and still
appear projected onto the inner volume. Assuming that all galaxies are
within the virial radius and follow a radially symmetric distribution,
we estimate that ![]()
![]() of all fossils are overlooked for
of all fossils are overlooked for
![]() (0.5)
(0.5)
![]() due to this effect.
due to this effect.
Almost all of the few dozen fossil groups known were discovered and analysed based upon comparatively shallow optical and/or X-ray survey data. In general the observational data are poor compared to what are available for normal clusters. Only a few fossils were investigated in detail, such as ESO 3060170 (Sun et al. 2004), RX J1552.2+2013 (Mendes de Oliveira et al. 2006), RX J1416.4+2315 (Jones et al. 2003; Khosroshahi et al. 2006a; Cypriano et al. 2006), CL0259+0013 (Voevodkin et al. 2010) or UGC 842 (Lopes de Oliveira et al. 2010). For a comprehensive comparison with normal groups and clusters a systematic deep survey of a larger number is needed.
In this paper we present our analysis of J0454.0-0308 (hereafter: J0454), a fossil group at z=0.26. It is projected 8![]() south of the well-known cluster MS0451-0301 (hereafter: MS0451, z=0.54),
thus a large amount of archival data are available for our analysis.
J0454 consists of at
least 60 galaxies and was identified by us in Subaru/Suprime-Cam
images. It is dominated by a giant elliptical galaxy (hereafter:
E0454), which strongly lenses a distant background source. We use
Subaru/Suprime-Cam and CFHT/MegaPrime for photometry, XMM-Newton to
study the intra-cluster gas and HST/ACS for the weak and strong lensing
analysis. The imaging data (see Fig. 1 for an
overview) are complemented by VLT and Keck spectroscopy.
south of the well-known cluster MS0451-0301 (hereafter: MS0451, z=0.54),
thus a large amount of archival data are available for our analysis.
J0454 consists of at
least 60 galaxies and was identified by us in Subaru/Suprime-Cam
images. It is dominated by a giant elliptical galaxy (hereafter:
E0454), which strongly lenses a distant background source. We use
Subaru/Suprime-Cam and CFHT/MegaPrime for photometry, XMM-Newton to
study the intra-cluster gas and HST/ACS for the weak and strong lensing
analysis. The imaging data (see Fig. 1 for an
overview) are complemented by VLT and Keck spectroscopy.
1.2 Terminology and assumptions
In this work we present evidence that J0454 is composed of a poor cluster and an infalling fossil group. We refer to the global system as J0454, but also to the cluster without the fossil group. The latter distinction is only made in Sect. 8 when we discuss the results. E0454 is the brightest galaxy of the system.
![\begin{figure}
\par\includegraphics[width=8.8cm,clip]{13810_f01.eps}
\end{figure}](/articles/aa/full_html/2010/06/aa13810-09/img38.png)
|
Figure 1: Pointings of the imaging data sets. The positions of the fossil group J0454 and the background cluster MS0451 are shown as well. |
| Open with DEXTER | |
The paper is organised as follows: in Sect. 2 we describe the imaging and spectroscopic data provided this was not done elsewhere. In Sect. 3 we study foreground and background contamination and select a red cluster sequence in colour-colour and colour-magnitude space. In Sect. 4 we investigate the galactic content of the system, establish a morphology-density relation and obtain the velocity dispersions of early- and late-type galaxies. We use virial properties and the size-richness relation for an estimate of r200. In Sect. 5 we present the X-ray results, followed by our weak and strong lensing analysis in Sects. 6 and 7. We discuss our findings in Sect. 8 and summarise in Sect. 9.
We assume a flat standard cosmology with
![]() ,
,
![]() and
and
![]() .
On occasion we refer to relations from the literature with
parameterisations
.
On occasion we refer to relations from the literature with
parameterisations
![]() or
or
![]() .
To avoid confusion we quote them as published originally, indexing h
accordingly. X-ray luminosities are reported for the 0.5-2.0 keV
range, and optical luminosities are given in solar units. The relation
between angular and physical scales at z=0.26 is
.
To avoid confusion we quote them as published originally, indexing h
accordingly. X-ray luminosities are reported for the 0.5-2.0 keV
range, and optical luminosities are given in solar units. The relation
between angular and physical scales at z=0.26 is
![]() kpc. All numeric values quoted for physical distances in J0454 must be scaled with h-1.
Magnitudes are reported for both the Johnson-Cousins and the Sloan
passbands and denoted with uppercase and lowercase letters,
respectively. All error bars represent the
kpc. All numeric values quoted for physical distances in J0454 must be scaled with h-1.
Magnitudes are reported for both the Johnson-Cousins and the Sloan
passbands and denoted with uppercase and lowercase letters,
respectively. All error bars represent the ![]() confidence level.
confidence level.
2 Observations and data reduction
2.1 Subaru/Suprime-Cam and CFHT/Megaprime data reduction
We serendipitously discovered J0454 in deep Subaru/Suprime-Cam (Miyazaki et al. 2002) images of MS0451. The data were reduced with THELI![]() (Erben et al. 2005),
our pipeline for the reduction of wide-field optical and near-infrared
images. In the following we summarise those aspects where our
reduction scheme deviated significantly from the standard approach.
(Erben et al. 2005),
our pipeline for the reduction of wide-field optical and near-infrared
images. In the following we summarise those aspects where our
reduction scheme deviated significantly from the standard approach.
Images were taken in nine different nights during six periods
between 2001-01-22 and 2006-12-21 (PIs: H. Ebeling, N. Yasuda, G.
Kosugi). Suprime-Cam consists of 10 CCDs, covering
![]()
![]()
![]() with 0
with 0
![]() 202 per pixel.
In 2001 Suprime-Cam had one broken CCD and individual gain
settings. The defect CCD and three others were replaced, and the gains
were
homogenised and refined once more another year later. We brought all
chips to the same gain and then performed the standard pre-processing
including debiasing, flatfielding, superflatting, defringing, and sky
subtraction. The data were astrometrically calibrated with Scamp (Bertin 2006)
and then stacked. Since images were taken with two different sky
position angles we could recover areas
initially lost due to blooming. The data did not allow for correction
of scattered light in the flat fields, for which extensive dithering of
photometric standard fields is required (see Koch et al. 2004; Magnier & Cuillandre 2004; Manfroid & Selman 2001).
202 per pixel.
In 2001 Suprime-Cam had one broken CCD and individual gain
settings. The defect CCD and three others were replaced, and the gains
were
homogenised and refined once more another year later. We brought all
chips to the same gain and then performed the standard pre-processing
including debiasing, flatfielding, superflatting, defringing, and sky
subtraction. The data were astrometrically calibrated with Scamp (Bertin 2006)
and then stacked. Since images were taken with two different sky
position angles we could recover areas
initially lost due to blooming. The data did not allow for correction
of scattered light in the flat fields, for which extensive dithering of
photometric standard fields is required (see Koch et al. 2004; Magnier & Cuillandre 2004; Manfroid & Selman 2001).
We complemented the ![]() Subaru/Suprime-Cam data with
Subaru/Suprime-Cam data with
![]() CFHT/Megaprime images, which improves the photometric redshifts as a result of the presence of u*-band. The CFHT/Megaprime data were pre-reduced using ELIXIR (Magnier & Cuillandre 2004)
at CFHT, including corrections for scattered light of the order of
0.1 mag. The remaining processing was done with THELI following Erben et al. (2009). The properties of the coadded images are summarised in Table 1.
CFHT/Megaprime images, which improves the photometric redshifts as a result of the presence of u*-band. The CFHT/Megaprime data were pre-reduced using ELIXIR (Magnier & Cuillandre 2004)
at CFHT, including corrections for scattered light of the order of
0.1 mag. The remaining processing was done with THELI following Erben et al. (2009). The properties of the coadded images are summarised in Table 1.
2.1.1 Catalogue creation
Object detection and photometry was done using SExtractor (Bertin & Arnouts 1996) in double image mode. We stacked all exposures in all filters of one camera with an image seeing of less than 1
![]() 0,
obtaining a deep noise-normalised detection image. Coadded images in
the different filters were convolved to a common seeing of 0
0,
obtaining a deep noise-normalised detection image. Coadded images in
the different filters were convolved to a common seeing of 0
![]() 95, ensuring that the object flux in each waveband was
integrated over identical apertures. We kept objects with at least 5 connected pixels with
95, ensuring that the object flux in each waveband was
integrated over identical apertures. We kept objects with at least 5 connected pixels with ![]() each.
each.
Table 1: Summary of the Subaru/Suprime-Cam and CFHT/Megaprime data.
Table 2: Combined Subaru mirror reflectivity and corrector throughput.
The Subaru/Suprime-Cam data were only partially taken in photometric
conditions, with zeropoint variations of up to 0.1 mag in other
nights. We tied the photometric z-band image to CFHT/Megaprime data taken in the same filter. The other Subaru/Suprime-Cam zeropoints were
inferred by comparing the fluxes from non-saturated stars, measured in
![]() wide apertures, against the Pickles (1998) library (for details see Erben et al. 2009). We took into account filter
transmission, quantum efficiency, and the combined mirror reflectivity and corrector throughput (Table 2, S. Miyazaki, priv. comm.). The photometric calibration of the
CFHT/Megaprime data was taken from the ELIXIR
headers. The zeropoints of both data sets were ultimately fine-tuned
during the calculation of the photometric redshifts based on several
hundred
calibration spectra (see Sect. 2.1.2).
wide apertures, against the Pickles (1998) library (for details see Erben et al. 2009). We took into account filter
transmission, quantum efficiency, and the combined mirror reflectivity and corrector throughput (Table 2, S. Miyazaki, priv. comm.). The photometric calibration of the
CFHT/Megaprime data was taken from the ELIXIR
headers. The zeropoints of both data sets were ultimately fine-tuned
during the calculation of the photometric redshifts based on several
hundred
calibration spectra (see Sect. 2.1.2).
2.1.2 Photometric redshifts
We need photometric redshifts for the weak gravitational lensing analysis in Sect. 6, mainly to distinguish between lensed background and unlensed foreground galaxies. The photometric
redshifts were obtained as outlined in Hildebrandt et al. (2009) for all objects in the catalogues (see Sect. 2.1.1) and calibrated against 774 and 493 spectroscopic redshifts from Moran et al. (2007), for CFHT and Subaru, respectively. Notice that Moran et al. (2007) obtained spectroscopic redshifts for a total of 1562 sources in the field of view of MS0451. We performed the phot-z
calibration using only those spectra of sources with photometric errors
smaller than 0.1 mag in all
bands. In detail, we fix the redshifts of the corresponding galaxies to
their spectroscopically determined values. The magnitude differences
between the best-fit templates and the observed photometry then yield
the zeropoint corrections, in the range of
0.02-0.09 mag for CFHT and
0.04-0.18 mag for Subaru. The correlation between photometric and spectroscopic redshifts is shown in Fig. 2 for both data sets, using a confidence limit (ODDS parameter) higher than 0.8. Due to the lack of u-band data the Subaru photo-zs are highly unreliable for ![]() ,
moving a significant fraction of lensed galaxies into the unlensed
foreground sample. The CFHT data are much better in this respect,
but shows 2-3 times as much scatter for
,
moving a significant fraction of lensed galaxies into the unlensed
foreground sample. The CFHT data are much better in this respect,
but shows 2-3 times as much scatter for ![]() and fails for fainter galaxies due to inferior depth in i- and z-band. The accuracy of the
photo-zs is
and fails for fainter galaxies due to inferior depth in i- and z-band. The accuracy of the
photo-zs is
![]() .
.
![\begin{figure}
\par\includegraphics[width=8.5cm,clip]{13810_f02.ps}
\end{figure}](/articles/aa/full_html/2010/06/aa13810-09/img58.png)
|
Figure 2: Comparison of photometric and spectroscopic redshifts. |
| Open with DEXTER | |
We run both data sets simultaneously through the photo-z process but found the results to be significantly worse than the photo-zs
obtained separately for CFHT and Subaru. This is due to different
PSF characteristics of the two data sets which could not be
homogenised sufficiently, and in particular due to the fact that the
Subaru data could not be corrected for scattered light in the flats,
resulting in inconsistent magnitudes across similar passbands. We
therefore created
a composite photo-z catalogue in the following manner. We took the CFHT estimate if
![]() and the average if both estimates are between 0.4 and 0.7.
The remaining galaxies were split in two groups. The first is formed by
galaxies for which the Subaru redshift is higher than 0.7, and we
assigned them this estimate. Galaxies in the second group, with
and the average if both estimates are between 0.4 and 0.7.
The remaining galaxies were split in two groups. The first is formed by
galaxies for which the Subaru redshift is higher than 0.7, and we
assigned them this estimate. Galaxies in the second group, with
![]() and
and
![]() got either the CFHT or the Subaru redshift assigned, depending on which
one has higher confidence. Ultimately, the redshifts were transformed
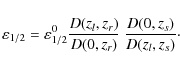
into relative lensing strengths,
got either the CFHT or the Subaru redshift assigned, depending on which
one has higher confidence. Ultimately, the redshifts were transformed
into relative lensing strengths,

where D(z1,z2) is the angular diameter distance between two sources at redshifts z1 and z2, and zl and zs are the lens and source redshifts, respectively. See Sects. 2.2 and 6 for more details.
2.2 HST/ACS imaging and shear catalogue
For the weak lensing measurements and the strong lens modelling we rely on wide-field imaging with HST/ACS through the F814W filter (PI: R. Ellis). The data consist of 41 single orbit pointings of 2036s each, covering a continuous area of
![]()
![]()
![]() ,
and was reduced according to Schrabback et al. (2007,2009). An extensive description of our shape measurement pipeline is given in Schrabback et al. (2009). In the following we summarise the main characteristics.
,
and was reduced according to Schrabback et al. (2007,2009). An extensive description of our shape measurement pipeline is given in Schrabback et al. (2009). In the following we summarise the main characteristics.
The shear catalogue is based on SExtractor (Bertin & Arnouts 1996) detections, for which we required a minimum number of 8 connected pixels with S/N > 1.4 each after filtering with a 5 ![]() 5 pixel wide Gaussian kernel. The object catalogue created in this manner was then fed into our implementation (see Erben et al. 2001) of the KSB method (Luppino & Kaiser 1997; Kaiser et al. 1995; Hoekstra et al. 1998) for the shape measurement, adapted for HST/ACS as detailed in Schrabback et al. (2007,2009).
We employed a principal component interpolation for the variable
HST/ACS point-spread function and parametric corrections for
charge-transfer inefficiency for both stars and galaxies.
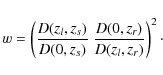
In addition, we applied weights wi to the individual shear estimates given by
5 pixel wide Gaussian kernel. The object catalogue created in this manner was then fed into our implementation (see Erben et al. 2001) of the KSB method (Luppino & Kaiser 1997; Kaiser et al. 1995; Hoekstra et al. 1998) for the shape measurement, adapted for HST/ACS as detailed in Schrabback et al. (2007,2009).
We employed a principal component interpolation for the variable
HST/ACS point-spread function and parametric corrections for
charge-transfer inefficiency for both stars and galaxies.
In addition, we applied weights wi to the individual shear estimates given by
![\begin{displaymath}w_i^{-1} = \left(\frac{2}{{\rm Tr}[P^g_i]}\right)^2 \sigma_{e_{\rm ani}}^2({\rm mag}_i) + 0.25^2,
\end{displaymath}](/articles/aa/full_html/2010/06/aa13810-09/img64.png)
|
(2) |
where
After all filtering, the shear catalogue contains 33 500 galaxies with redshift estimates z>0.3, corresponding to a number density of n=73 arcmin-2. 42% of the galaxies have their redshifts estimated photometrically as outlined in Sect. 2.1.2.
For those galaxies without redshift estimate (median magnitude
![]() )
we used the mean magnitude-redshift relation from Schrabback et al. (2009). Thereto we split the galaxies into magnitude bins of width 0.5 mag, starting from
)
we used the mean magnitude-redshift relation from Schrabback et al. (2009). Thereto we split the galaxies into magnitude bins of width 0.5 mag, starting from
![]() down to
down to
![]() .
For each bin we calculated the average lensing strength
.
For each bin we calculated the average lensing strength
![]() defined in Eq. (1). Since the lens is at a very low redshift of
zl=0.26, it is insensitive to the redshift distribution, in particular for galaxies with redshifts
defined in Eq. (1). Since the lens is at a very low redshift of
zl=0.26, it is insensitive to the redshift distribution, in particular for galaxies with redshifts ![]() .
Essentially,
.
Essentially,
![]() is
between 0.70 and 0.80 for 96% of these galaxies, and we
might as well have assumed a constant redshift without affecting
our results.
is
between 0.70 and 0.80 for 96% of these galaxies, and we
might as well have assumed a constant redshift without affecting
our results.
The median and mean redshift of all galaxies in the shear catalogue
are 1.39 and 1.16, respectively. Objects are evenly
distributed over the sky, and the area around J0454 has only very few
masks for bright stars, none of which is larger than
![]() .
We estimate the 50% completeness limiting AB magnitude of our shear catalogue to
.
We estimate the 50% completeness limiting AB magnitude of our shear catalogue to
![]() mag, consistent with the results for the COSMOS field, which was observed with very similar strategies (Scoville et al. 2007). The depth matches the one for the ground-based data (see Table 1).
mag, consistent with the results for the COSMOS field, which was observed with very similar strategies (Scoville et al. 2007). The depth matches the one for the ground-based data (see Table 1).
2.3 VLT/FORS2 spectroscopy of the strong lens system
We used VLT/FORS2 to determine the redshifts of the fossil group's
brightest elliptical, E0454, and its arc system. Data were taken on
2009-03-23 in DDT time and in 1
![]() 0 seeing, using the OG590 order sorting filter, GRIS_300I grism and a 1
0 seeing, using the OG590 order sorting filter, GRIS_300I grism and a 1
![]() 0 long slit, resulting in a resolution of
0 long slit, resulting in a resolution of ![]() (1.68 Å pixel-1). The spectra were exposed for 2
(1.68 Å pixel-1). The spectra were exposed for 2 ![]() 600 s and their useable range extends over 6250-9300 Å. The long slit covered the core of E0454 and the
bright northern arc.
600 s and their useable range extends over 6250-9300 Å. The long slit covered the core of E0454 and the
bright northern arc.
We debiased, flat-fielded and sky-corrected the data using
modified THELI modules. A third-order polynomial was fit to
the calibration lamp emission lines for wavelength calibration, and a
small residual offset was corrected by comparison to sky lines. We
obtained the spectrum of E0454 by averaging 6 detector rows,
yielding ![]() in the continuum (Fig. 3).
The spectrum of the arc is strongly blended with that of E0454.
To remove this contamination, we exploited the symmetry of the
lens and extracted a spectrum from the opposite side of E0454 at the
same distance as the arc. This spectrum was subtracted from the
arc's spectrum, which was then
averaged over 4 rows yielding
in the continuum (Fig. 3).
The spectrum of the arc is strongly blended with that of E0454.
To remove this contamination, we exploited the symmetry of the
lens and extracted a spectrum from the opposite side of E0454 at the
same distance as the arc. This spectrum was subtracted from the
arc's spectrum, which was then
averaged over 4 rows yielding
![]() .
The noise level was determined from 200 nearby detector rows which only contained sky background.
.
The noise level was determined from 200 nearby detector rows which only contained sky background.
The lens redshift is z=0.2594 ![]() 0.0004 and based on five absorption features: MgI/MgH (5156/5196 Å), E-band
(a blend of Fe and Ca at 5269 Å), and NaD
(5890/5896 Å). Thus E0454 is a physical member of J0454,
establishing the magnitude gap and thus the fossil character. The
redshift of the arc is more difficult to infer. Our lens modelling
(see Sect. 7) yields
a magnification of 8-33 for the arc, which allows us to
resolve two maxima in its light distribution. The colours of the object
and the morphology rule out an early-type galaxy. If the
morphology is indicative of star formation and if the redshift (
0.0004 and based on five absorption features: MgI/MgH (5156/5196 Å), E-band
(a blend of Fe and Ca at 5269 Å), and NaD
(5890/5896 Å). Thus E0454 is a physical member of J0454,
establishing the magnitude gap and thus the fossil character. The
redshift of the arc is more difficult to infer. Our lens modelling
(see Sect. 7) yields
a magnification of 8-33 for the arc, which allows us to
resolve two maxima in its light distribution. The colours of the object
and the morphology rule out an early-type galaxy. If the
morphology is indicative of star formation and if the redshift (
![]() )
of the arc is less than about 1.0, then there would be a chance to
detect the common set of nebular emission lines such as
[OII] (3728 Å), H
)
of the arc is less than about 1.0, then there would be a chance to
detect the common set of nebular emission lines such as
[OII] (3728 Å), H![]() (4863 Å), [OIII] (5008 Å) and H
(4863 Å), [OIII] (5008 Å) and H![]() (6565 Å) with the given exposure time. However, the spectrum does
not contain any significant features. There are two possible
explanations:
(6565 Å) with the given exposure time. However, the spectrum does
not contain any significant features. There are two possible
explanations:
First,
![]() is lower than
is lower than ![]() and
the morphology observed is not indicative for star formation, or the
star formation rate (SFR) is low. In this case we can at least infer
upper limits for the SFR based on the non-detection of lines. For
and
the morphology observed is not indicative for star formation, or the
star formation rate (SFR) is low. In this case we can at least infer
upper limits for the SFR based on the non-detection of lines. For
![]() the H
the H![]() line would still be accessible. Using Kennicutt (1998), a presumed line width of 30 Å and correcting for the strong lens magnification (see Sect. 7), we find
line would still be accessible. Using Kennicutt (1998), a presumed line width of 30 Å and correcting for the strong lens magnification (see Sect. 7), we find
![]() .
For
.
For
![]() both [OII] and H
both [OII] and H![]() are covered. Following Argence & Lamareille (2009) the upper limits for the SFR from these two lines are
are covered. Following Argence & Lamareille (2009) the upper limits for the SFR from these two lines are
![]() for
for
![]() and
and
![]() for
for
![]() ,
the uncertainties being due to the unknown [OII]/H
,
the uncertainties being due to the unknown [OII]/H![]() line ratio.
line ratio.
![\begin{figure}
\par\includegraphics[width=8.5cm,clip]{13810_f03.eps}
\end{figure}](/articles/aa/full_html/2010/06/aa13810-09/img88.png)
|
Figure 3: Redshifted FORS2 spectra of the lens and the arc (binned 3 times). No significant features were found in the spectrum of the arc. The noise level was offset by -0.5 for better visibility. |
| Open with DEXTER | |
The second possibility is that the lensed source is at significantly higher redshift,
![]() ,
such that possibly present emission lines are redshifted beyond the
spectral range covered by our observations. The clear detection in u*-band on the other hand means
,
such that possibly present emission lines are redshifted beyond the
spectral range covered by our observations. The clear detection in u*-band on the other hand means
![]() and therefore
and therefore
![]()
![]() 0.3. Based on strong-lensing properties and the stellar velocity dispersion of E0454 we show in Sect. 7.2
that this higher redshift is indeed the most plausible assumption. The
actual redshift of the arc is not relevant for our main conclusions
(see Sect. 8.1).
0.3. Based on strong-lensing properties and the stellar velocity dispersion of E0454 we show in Sect. 7.2
that this higher redshift is indeed the most plausible assumption. The
actual redshift of the arc is not relevant for our main conclusions
(see Sect. 8.1).
![\begin{figure}
\par\includegraphics[width=17cm,clip]{13810_f04.ps}
\end{figure}](/articles/aa/full_html/2010/06/aa13810-09/img92.png)
|
Figure 4: Target selection in colour-colour and colour-magnitude space. The left and middle panels: galaxies with 0.52<z<0.56 and 0.28<z<0.5 are shown as red and cyan diamonds, respectively. Confirmed members of J0454 are coded green, and blue triangles are objects with 0.1<z<0.24. A selection in colour-magnitude space leads to significant contamination with objects at higher redshifts ( left panel, exemplary for B-R vs. R). Instead, we selected galaxies in B-V vs. V-I ( middle). The right panel shows that the galaxies selected in B-V vs. V-I form a well-defined red sequence in V-I vs. I, and the box indicates additional selection criteria. Black points represent galaxies that were kept based on this purely photometric selection, and grey ones were excluded. Small corrections were made by means of available spectra (see text for details). |
| Open with DEXTER | |
2.4 X-ray observations
The field was observed for 42 ks on 2004-09-17 with XMM-Newton
(PI: D. Warroll, observation ID 0205670101), covering a radius of ![]() around MS0451. J0454 is contained in the 2XMM catalogue (Watson et al. 2009) as source 2XMM J045400.6-030832:41489. We reduced the data using
XMM-SAS
around MS0451. J0454 is contained in the 2XMM catalogue (Watson et al. 2009) as source 2XMM J045400.6-030832:41489. We reduced the data using
XMM-SAS![]() v8.0.0. The maximum flare level in the 10-15 keV range is well below 0.35 counts s-1,
and about half of the data were taken during completely quiescent
periods. Thus we did not reject any data due to high background rates.
v8.0.0. The maximum flare level in the 10-15 keV range is well below 0.35 counts s-1,
and about half of the data were taken during completely quiescent
periods. Thus we did not reject any data due to high background rates.
X-rays are particularly absorbed by neutral hydrogen,
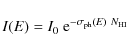
|
(3) |
where
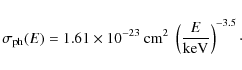
|
(4) |
Accordingly, the absorption is significant for low X-ray energies (0.2-0.5 keV) and becomes low for energies higher than 0.5-1 keV (see also Morrison & McCammon 1983). For the soft cluster spectrum of J0454 (T=1.1 keV, see Sect. 5),
3 Cluster members and field contamination
3.1 Object selection
The MS0451 field had extensive wide-field spectroscopy with Keck by Moran et al. (2007), who kindly made their redshift catalogue publicly available. They randomly selected galaxies in a Subaru I-band
image (a subset of the data we use) from a sample with I<21.5 mag,
irrespective of morphology. Remaining spaces in the 14 slit masks
were then filled up with fainter objects. In total, redshifts
were obtained for 1562 galaxies in a
![]()
![]()
![]() field that covers J0454 as well.
field that covers J0454 as well.
3.1.1 Selection of J0454 member galaxies
The spectroscopic sampling of J0454 is complete to about 44% for I<21.5 mag (see Sect. 3.1.3).
First, J0454 is at significantly lower redshift than MS0451, and thus
its brighter galaxies were not observed as it is implausible that they
are members of MS0451. This holds in particular for the central
elliptical with I=16.6 mag. Second, its angular separation from MS0451 is 8![]() and thus it was not at the centre of interest. Lastly, slit masks cannot be configured arbitrarily due to source clustering.
and thus it was not at the centre of interest. Lastly, slit masks cannot be configured arbitrarily due to source clustering.
Our photometric redshifts (
![]() )
do not offer sufficient power to distinguish unambiguously between structures in the range
z=0.24-0.32, which are present along the line of sight (Sect. 3.1.3).
For a more complete picture we therefore selected ellipticals in
colour-colour and colour-magnitude space using the red cluster sequence
(RCS) method from Gladders & Yee (2000). The
spectroscopic redshifts were used to identify suitable areas. However,
the large angular extent of MS0451 and its significant content of
blue galaxies leads to a high contamination
when using the red sequence alone (see e.g. Fig. 4, left panel). We investigated various colour-colour combinations and found that in B-V vs. V-I (Fig. 4, middle panel) the highest redshift differentiation is achieved. All galaxies at
)
do not offer sufficient power to distinguish unambiguously between structures in the range
z=0.24-0.32, which are present along the line of sight (Sect. 3.1.3).
For a more complete picture we therefore selected ellipticals in
colour-colour and colour-magnitude space using the red cluster sequence
(RCS) method from Gladders & Yee (2000). The
spectroscopic redshifts were used to identify suitable areas. However,
the large angular extent of MS0451 and its significant content of
blue galaxies leads to a high contamination
when using the red sequence alone (see e.g. Fig. 4, left panel). We investigated various colour-colour combinations and found that in B-V vs. V-I (Fig. 4, middle panel) the highest redshift differentiation is achieved. All galaxies at
![]() are cleanly separated from those at z=0.54, thus removing the bulk of the contamination. There is also very little overlap with galaxies at
are cleanly separated from those at z=0.54, thus removing the bulk of the contamination. There is also very little overlap with galaxies at ![]() .
Only bluer objects at z=0.26 cannot be separated from those at lower redshift. In a first pass, we selected objects with
.
Only bluer objects at z=0.26 cannot be separated from those at lower redshift. In a first pass, we selected objects with
| B-V>1.2 | (5) |
| B-V<1.7 | (6) |
| B-V > 1.286 (V-I) + 0.07 | (7) |
| B-V < 1.286 (V-I) + 0.59. | (8) |
These form a red sequence in V-I vs. I (diamonds in the right panel of Fig. 4) with a typical width of
Taken all together, these selection criteria exclude all galaxies with
![]() ,
and all but two ellipticals with
,
and all but two ellipticals with
![]() .
A good fit to the red sequence formed by the remaining galaxies is
.
A good fit to the red sequence formed by the remaining galaxies is
| V-I = -0.0430 I + 1.768. | (9) |
From the sample of 55 galaxies selected in this manner (black diamonds in the right panel of Fig. 4) we removed three with higher and one with lower spectroscopic redshift, and those where the photometric redshifts deviated by more than 0.1 from the cluster redshift (
In total, 15 of the red sequence galaxies have spectroscopic
redshifts, including the red galaxy that was added back to the sample.
Assuming that similar effects hold for the 32 red sequence
galaxies without spectra, we estimate that about 2 galaxies were
overlooked. Our sample of red sequence galaxies is then ![]() complete down to i=22.0 mag (Mi=-18.6
complete down to i=22.0 mag (Mi=-18.6 ![]() 0.05).
0.05).
We confined the galaxy sample to within 6![]() of the brightest elliptical galaxy, E0454, corresponding to
of the brightest elliptical galaxy, E0454, corresponding to
![]() (see Sects. 4.3 and 6.2). Beyond this perimeter the number density of red sequence galaxies is indistinguishable from
the density of field galaxies selected in the same manner (n=0.09 arcmin-2, determined from a
(see Sects. 4.3 and 6.2). Beyond this perimeter the number density of red sequence galaxies is indistinguishable from
the density of field galaxies selected in the same manner (n=0.09 arcmin-2, determined from a
![]()
![]()
![]() wide area where structures with 0.2<z<0.3 are unknown).
wide area where structures with 0.2<z<0.3 are unknown).
After correcting for galactic extinction (Schlegel et al. 1998) we determined the k-correction (Hogg et al. 2002) using kcorrect (v. 4.1.4, Blanton & Roweis 2007). For better comparison with other publications we report the rest-frame absolute magnitudes in the Sloan g and i passbands. The errors for Mg and Mi are 0.07 and 0.05 mag, respectively, based upon measurement uncertainties and the internal error estimate of kcorrect. The spatial distribution of the member galaxies is shown in Fig. 5, and their properties are summarised in Table A.1.
![\begin{figure}
\par\includegraphics[width=8.8cm,clip]{13810_f05.ps}
\end{figure}](/articles/aa/full_html/2010/06/aa13810-09/img114.png)
|
Figure 5:
Photometrically and spectroscopically selected cluster galaxies. The circle indicates
|
| Open with DEXTER | |
3.1.2 Magnitude gap
Assuming a virial radius of
![]() kpc (3
kpc (3
![]() 5) from our analysis presented below, we determined a magnitude gap of
5) from our analysis presented below, we determined a magnitude gap of
![]() mag in I-band for J0454 within half the virial radius. The second-brightest galaxy is object #20 from Table A.1, an elliptical galaxy at a separation of
mag in I-band for J0454 within half the virial radius. The second-brightest galaxy is object #20 from Table A.1, an elliptical galaxy at a separation of
![]() and with spectroscopic confirmation of its redshift. Notice that within
and with spectroscopic confirmation of its redshift. Notice that within
![]() there is no other possible foreground or background galaxy brighter
than the second-brightest member galaxy, hence the fossil character of
J0454 is secured. The third- and fourth-brightest members within
there is no other possible foreground or background galaxy brighter
than the second-brightest member galaxy, hence the fossil character of
J0454 is secured. The third- and fourth-brightest members within
![]() are 2.8 mag fainter than E0454 and also spectroscopically confirmed. Two brighter galaxies exist at larger radii with
are 2.8 mag fainter than E0454 and also spectroscopically confirmed. Two brighter galaxies exist at larger radii with
![]() (objects #34 and #45), but they do not have their redshifts
measured. For a meaningful luminosity function we need complete
spectroscopic sampling, in particular because the line of sight is
contaminated by nearby structures in
redshift space (see Sect. 3.1.3).
(objects #34 and #45), but they do not have their redshifts
measured. For a meaningful luminosity function we need complete
spectroscopic sampling, in particular because the line of sight is
contaminated by nearby structures in
redshift space (see Sect. 3.1.3).
![\begin{figure}
\par\includegraphics[width=18cm,clip]{13810_f06.ps}
\end{figure}](/articles/aa/full_html/2010/06/aa13810-09/img121.png)
|
Figure 6:
Clustering for different spectroscopic redshift bins and their width (in parentheses). J0454 is shown in the upper right, MS0451 in the lower left. The circle is centred on E0454 and traces
|
| Open with DEXTER | |
3.1.3 Structures along the line of sight
Based on the Keck spectra we identified 16 structures between 0.1<z<0.8, consisting of at least 12 galaxies within
![]() .
The spatial distributions of the 12 most significant ones are shown in Fig. 6. The circle indicates
.
The spatial distributions of the 12 most significant ones are shown in Fig. 6. The circle indicates
![]() kpc determined below from galaxy counts (Sect. 4.3) and weak gravitational lensing (Sect. 6.2). MS0451 overlaps significantly with J0454, whereas other structures contribute fewer interlopers.
kpc determined below from galaxy counts (Sect. 4.3) and weak gravitational lensing (Sect. 6.2). MS0451 overlaps significantly with J0454, whereas other structures contribute fewer interlopers.
The distributions shown in Fig. 6 are representative of the actual galaxy distribution. This is not self-evident due to the incomplete spectroscopic sampling with slit masks. However, the main selection criterion of Moran et al. (2007) was simply I<21.5 mag, with a possible bias preferring galaxies closer to MS0451 over those with larger separations. Thus the selection function is approximately constant across the field and does not favour one particular structure over another.
The line of sight towards J0454 is not only contaminated by MS0451 but also by structures at z=0.240, 0.246, 0.282, 0.293 and 0.325. Without spectra we cannot distinguish these from members at z=0.26. We estimated the contamination assuming that the interlopers had the same probability of being selected for spectroscopy as the members of J0454. From the number of red sequence galaxies with and without spectra we determined the spectroscopic coverage to be 44% complete for I<21.5. Five interlopers were kept by the initial selection (see Sect. 3.1.1) and therefore we expect that about 10 of the 32 purely photometrically selected galaxies in Table A.1 are not true members of J0454. We applied corrections for this where necessary.
4 Morphology-density relation, kinematics and r200
In this section we show that J0454 has characteristics typical for normal galaxy clusters, such as a distinct morphology-density relation (see e.g. Goto et al. 2003) and a significantly lower velocity dispersion for the central population of elliptical galaxies as compared to the population of spirals. Based upon general cluster scaling relations, we obtain size and mass estimates.
4.1 Cluster extent and mass: r200 and M200
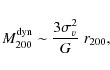
A characteristic key estimate of a cluster's linear extent is the virial radius. It is often approximated by r200, within which the mean density is 200 times higher than the critical density
![]() ,
,
![\begin{displaymath}H^2(z) = H_0^2\;[\Omega_{\rm m}(1+z)^3+\Omega_\Lambda]
\end{displaymath}](/articles/aa/full_html/2010/06/aa13810-09/img125.png)
being the Hubble function. The mass enclosed within r200 is
A common estimator for the virial mass is
which can be combined with (10) and (12) yielding a dynamic estimate for r200,

Estimating virial masses from galaxy dynamics is non-trivial (see e.g. Carlberg et al. 1997), in particular if the cluster under investigation is poorly sampled with spectroscopic redshifts. Our dynamic mass and size estimates for J0454 should therefore be viewed with caution, and we complement them with more robust cluster scaling relations, weak lensing and X-ray estimates.
![\begin{figure}
\par\includegraphics[width=8.3cm,clip]{13810_f07.ps}
\end{figure}](/articles/aa/full_html/2010/06/aa13810-09/img129.png)
|
Figure 7: The kinematic structure of J0454 with respect to E0454. Filled and open symbols mark red- and blueshifted galaxies, respectively. |
| Open with DEXTER | |
4.2 Velocity field and virial estimate of r200
In Fig. 7 we show the positions of all galaxies around J0454 with spectroscopic redshifts in the range
0.255<z<0.265. The symbol
size encodes the relative velocity with respect to E0454, and open
(filled) symbols denote blueshifted (redshifted) motions. We notice two
filaments extending up to 4.3 Mpc to the North and to the
North-West. The former is on average blue-shifted by
![]() compared to E0454, whereas the latter does not show a significant
motion. A photometric selection of more member galaxies in these
areas would result in significant contamination as these filaments are
projected onto four structures at similar redshifts (Fig. 6). We thus confined our subsequent analysis to the region within 6
compared to E0454, whereas the latter does not show a significant
motion. A photometric selection of more member galaxies in these
areas would result in significant contamination as these filaments are
projected onto four structures at similar redshifts (Fig. 6). We thus confined our subsequent analysis to the region within 6![]() from E0454.
from E0454.
We compute the velocity dispersion ![]() as
as
![\begin{displaymath}\sigma_v^2=\left(\frac{c}{1+\langle z \rangle}\right)^2~
\le...
..._i-\langle
z\rangle\right]^2 - \langle\delta\rangle^2\right),
\end{displaymath}](/articles/aa/full_html/2010/06/aa13810-09/img132.png)
|
(15) |
excluding E0454 and following the prescription of Danese et al. (1980) and Harrison (1974). Therein, c is the speed of light,
The velocity dispersion of the red galaxies is significantly lower than
the one of the blue galaxies, which is expected from dynamical friction
and the morphology-density relation (right panel of Fig. 8, consistent with the findings of Goto et al. 2003, for a much larger sample of clusters). Their mean velocities are different too, and offsets exist with respect to E0454 (
![]() for the red population, significant on the
for the red population, significant on the ![]() level, and
level, and
![]() (
(![]() )
for the blue galaxies). For the red galaxies this could still be an
observational effect due to incomplete sampling, as within 1
)
for the blue galaxies). For the red galaxies this could still be an
observational effect due to incomplete sampling, as within 1![]() of E0454 only two of nine ellipticals have their redshifts
measured. If confirmed by future observations, these features would
indicate that these galaxies have a different origin than those which
already collapsed into E0454, and that significant substructure exists
in the entire system (see also Oegerle & Hill 2001).
of E0454 only two of nine ellipticals have their redshifts
measured. If confirmed by future observations, these features would
indicate that these galaxies have a different origin than those which
already collapsed into E0454, and that significant substructure exists
in the entire system (see also Oegerle & Hill 2001).
Using Eqs. (13) and (14) we obtained
![]()
![]() 44 kpc and
44 kpc and
![]()
![]()
![]() for the red population, and
for the red population, and
![]()
![]() 44 kpc and
44 kpc and
![]()
![]()
![]() for the blue population.
for the blue population.
4.3 Size-richness relation
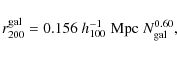
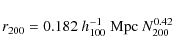
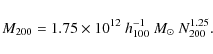
Hansen et al. (2005) and Johnston et al. (2007) have shown that r200 and M200 can be estimated starting from the number
![]() of galaxies within a radius of
1 h100-1 Mpc of the BCG. Only galaxies in the red sequence and with i-band luminosities L>0.4 L* are considered. Based on
of galaxies within a radius of
1 h100-1 Mpc of the BCG. Only galaxies in the red sequence and with i-band luminosities L>0.4 L* are considered. Based on
![]() one has
one has
a refined version of the original relation from Hansen et al. (2005). Within
|
(17) |
|
(18) |
Using Mi,*=-21.8 mag from Hansen et al. (2009), we counted N200=15+1-2 red sequence galaxies with Mi<-20.8 mag (corresponding to 0.4 L*). This richness estimate contains a correction for field contamination, and the errors are due to an uncertainty of 0.2 mag which we allowed for Mi,*. As a result we have r200=811
| Figure 8:
Left panel: redshift distribution for the red (E, S0)
and blue (Sa-Sc, Irr) galaxy populations. Notice that the
spectroscopic sampling of ellipticals is complete to only
|
|
| Open with DEXTER | |
5 X-ray halo
The XMM-Newton image of J0454 is shown in Fig. 9, overlaid over the HST/ACS optical image, and in Fig. A.1
in the Appendix (overlaid over a colour picture of the
Subaru/Suprime-Cam data, online material). X-ray flux is detected
locally out to 1![]() (240 kpc) from the core of E0454, encompassing the
10 innermost galaxies. If azimuthally averaged, we can trace
the halo about twice as far. It is possible that this very
extended emission is not associated with E0454 anymore but with the
surrounding cluster of galaxies (see below). The offset
of the X-ray centroid with respect to E0454 is
(240 kpc) from the core of E0454, encompassing the
10 innermost galaxies. If azimuthally averaged, we can trace
the halo about twice as far. It is possible that this very
extended emission is not associated with E0454 anymore but with the
surrounding cluster of galaxies (see below). The offset
of the X-ray centroid with respect to E0454 is
![]()
![]()
![]() (24 kpc). The luminosity profile is described by an isothermal
(24 kpc). The luminosity profile is described by an isothermal ![]() -model with
-model with
![]()
![]() 0.06 and a core radius of
0.06 and a core radius of
![]()
![]() 17 kpc (Fig. 10). The best-fit isothermal redshifted bremsstrahlung model of the spectrum yields T=1.1
17 kpc (Fig. 10). The best-fit isothermal redshifted bremsstrahlung model of the spectrum yields T=1.1 ![]() 0.1 keV. Assuming a mean particle mass of
0.1 keV. Assuming a mean particle mass of ![]() we find
we find
![]()
![]()
![]() and
r200=617
and
r200=617 ![]() 28 kpc, respectively, and for the total luminosity within r200 we have
28 kpc, respectively, and for the total luminosity within r200 we have
![]()
![]()
![]() .
.
A cooling flow is absent from the data as can be seen from the
luminosity profile. Consequently, we do not expect star formation in
the core of E0454. This is confirmed by our VLT/FORS2 spectrum
(Fig. 3) which does not show any H![]() -emission, which would be a prime indicator for star formation second to molecular CO emission (Edge 2001).
-emission, which would be a prime indicator for star formation second to molecular CO emission (Edge 2001).
The X-ray properties of J0454 agree with those of normal groups and clusters. Rykoff et al. (2008) find a tight correlation between
![]() and
and
![]() of 17 000 maxBCG
clusters, and this relation describes J0454 well. The
of 17 000 maxBCG
clusters, and this relation describes J0454 well. The
![]() relation drawn from the same sample predicts
relation drawn from the same sample predicts
![]()
![]()
![]() ,
the same as we measured for the elliptical galaxy population. In the compilation of Mulchaey (2000) J0454 falls comfortably within the natural scatter of the
,
the same as we measured for the elliptical galaxy population. In the compilation of Mulchaey (2000) J0454 falls comfortably within the natural scatter of the
![]() relation, resembling either a rich group or a poor cluster.
relation, resembling either a rich group or a poor cluster.
![\begin{figure}
\par\includegraphics[width=8.8cm,clip]{13810_f09.eps}
\vspace*{5mm}
\end{figure}](/articles/aa/full_html/2010/06/aa13810-09/img168.png)
|
Figure 9:
HST/ACS image of J0454. The (jagged) blue contours trace the S/N-ratio of the 0.5-2.0 keV X-ray flux, starting with |
| Open with DEXTER | |
Differences occur in temperature-based scaling relations. While no deviation is found with respect to the
![]() relation from the HIFLUGCS sample (Reiprich & Böhringer 2002; Stanek et al. 2006), J0454 appears cooler than expected (
relation from the HIFLUGCS sample (Reiprich & Böhringer 2002; Stanek et al. 2006), J0454 appears cooler than expected (![]() keV) when comparing it to the
keV) when comparing it to the
![]() relations presented by Mulchaey (2000) and Rykoff et al. (2008). A similar trend is seen for
relations presented by Mulchaey (2000) and Rykoff et al. (2008). A similar trend is seen for ![]() (Mulchaey 2000), i.e. for
(Mulchaey 2000), i.e. for
![]() one would expect
one would expect ![]() keV (or
keV (or
![]() for T=1.1 keV).
These
deviations can be explained by the natural scatter seen in groups of
galaxies. A different explanation would be that we see a
group-sized substructure embedded in, but not yet fully merged with,
a larger sparse cluster. Extended and patchy X-ray emission exists
on the lowest levels and at radii
for T=1.1 keV).
These
deviations can be explained by the natural scatter seen in groups of
galaxies. A different explanation would be that we see a
group-sized substructure embedded in, but not yet fully merged with,
a larger sparse cluster. Extended and patchy X-ray emission exists
on the lowest levels and at radii
![]() .
It is unclear whether this emission is still part of the E0454
halo or if we see the brightest emission features of the gas associated
with J0454. With deeper X-ray data we could look for temperature
variations or different chemical compositions to distinguish these two
components. We discuss these findings in Sect. 8.
.
It is unclear whether this emission is still part of the E0454
halo or if we see the brightest emission features of the gas associated
with J0454. With deeper X-ray data we could look for temperature
variations or different chemical compositions to distinguish these two
components. We discuss these findings in Sect. 8.
The inner, flat core of the X-ray halo is elongated, tracing the optical ellipticity of E0454. These trends have been seen previously for groups (e.g. Mulchaey & Zabludoff 1998) and clusters (e.g. Hashimoto et al. 2008), and also for fossils (Khosroshahi et al. 2006a,2004; Sun et al. 2004). In general, the X-ray contours of the halo analysed in this work are not as concentric and regular as e.g. those for the fossil groups RX J1331.5+1108 and RX J1416.4+2315 from Khosroshahi et al. (2007), yet they do not appear more disturbed than those of the other three fossil groups presented by the same authors.
We mention here that the X-ray halo of E0454 was detected previously
and is listed as object #6 in the Chandra cluster sample of Boschin (2002). The reported centroid of the X-ray flux is located
![]()
![]() 8 kpc south-east of E0454, whereas the XMM-Newton data reveals only a small offset of 24
8 kpc south-east of E0454, whereas the XMM-Newton data reveals only a small offset of 24 ![]() 16 kpc to the North-West. We explain this by the fact that
XMM-Newton collected more than 10 times as many photons
as Chandra.
16 kpc to the North-West. We explain this by the fact that
XMM-Newton collected more than 10 times as many photons
as Chandra.
![\begin{figure}
\par\includegraphics[width=8.5cm,clip]{13810_f10.ps}
\vspace*{5mm}
\end{figure}](/articles/aa/full_html/2010/06/aa13810-09/img176.png)
|
Figure 10:
Best-fit |
| Open with DEXTER | |
6 Weak lensing analysis
The strength of a gravitational lens scales with the ratio of the angular diameter distances
D(z1,z2) between the lens
and the source and between the observer and the source. The more
distant the source the stronger the lensing effect, but for a lens
redshift
zl=0.26 and
sources at
zs>0.8 it is effectively constant. One must project the sources to some arbitrarily chosen reference redshift
(zr=1) and rescale the shear estimator (the image ellipticities) accordingly to obtain comparable shear values,
|
(19) |
This rescaling decreases (enhances) the noise for zs>zr ( zs<zr) and is taken into account by individual weighting factors
|
(20) |
Before we could proceed on the weak lensing analysis of J0454 we had to remove the lensing contribution of MS0451 from the data by subtracting a singular isothermal sphere (SIS) tangential shear profile parametrised with
6.1 Mass reconstruction
We use the finite-field method from Seitz & Schneider (2001) to reconstruct the projected surface mass density, ![]() ,
from the sheared images. This method uses the field border as a
boundary condition, which makes reconstructions of non-rectangular
areas difficult. We therefore work
on a 16
,
from the sheared images. This method uses the field border as a
boundary condition, which makes reconstructions of non-rectangular
areas difficult. We therefore work
on a 16
![]() 8 wide rectangle inscribed into the HST/ACS mosaic. Our code is freely available
8 wide rectangle inscribed into the HST/ACS mosaic. Our code is freely available![]() and based on the original version from Seitz & Schneider (2001).
and based on the original version from Seitz & Schneider (2001).
The convergence ![]() is determined up to an additive constant, the ``mass-sheet'' degeneracy, which is safely broken by assuming that
is determined up to an additive constant, the ``mass-sheet'' degeneracy, which is safely broken by assuming that ![]() vanishes on average along the border of the field. The algorithm only works for under-critical regions with
vanishes on average along the border of the field. The algorithm only works for under-critical regions with ![]() ,
i.e. strong lensing areas are not reconstructed reliably. In the case of J0454 this affects only the innermost 4
,
i.e. strong lensing areas are not reconstructed reliably. In the case of J0454 this affects only the innermost 4
![]() (see Sect. 7), which is well below the resolution limit and thus of no concern.
(see Sect. 7), which is well below the resolution limit and thus of no concern.
The resulting density map must not be interpreted without a
corresponding noise map. For example, bright stars cause holes in the
data field, which locally increase the noise due to the reduced number
density of galaxies. In addition, the smoothing length for the
shear field must be larger than these holes. Otherwise, the boundary
condition of a rectangular data field is violated, resulting in a
corrupted solution. To obtain the noise map, we created
1000 realisations of randomised galaxy orientations keeping their
positions fixed, and obtained ![]() for each. The two-dimensional rms of these
for each. The two-dimensional rms of these ![]() -maps
yields the desired noise map. Since lensing increases the ellipticities
of galaxies, we removed the SIS shear profile of J0454 (Sect. 6.2) from the data prior to the randomisations. Otherwise the noise at the cluster position would
be overestimated.
-maps
yields the desired noise map. Since lensing increases the ellipticities
of galaxies, we removed the SIS shear profile of J0454 (Sect. 6.2) from the data prior to the randomisations. Otherwise the noise at the cluster position would
be overestimated.
The S/N-level of the mass map is shown in Fig. 9. J0454 is detected on the ![]() level with a peak convergence of
level with a peak convergence of
![]() .
It is the only significant (S/N>4) mass peak besides MS0451 (S/N =7.7), and located 12
.
It is the only significant (S/N>4) mass peak besides MS0451 (S/N =7.7), and located 12 ![]() 5
5
![]() south
of E0454. The uncertainty in the position was determined from
boot-strapping the shear catalogue. The mass of J0454 within
182 kpc (approximately tracing the S/N = 1 contour) is
south
of E0454. The uncertainty in the position was determined from
boot-strapping the shear catalogue. The mass of J0454 within
182 kpc (approximately tracing the S/N = 1 contour) is
![]()
![]()
![]() .
This is not comparable to M200 since it is integrated within a much smaller radius. A determination of M200
from the reconstructed density map is not sensible as the noise
entirely dominates the signal in the larger aperture. However, we can
infer a lower limit of
.
This is not comparable to M200 since it is integrated within a much smaller radius. A determination of M200
from the reconstructed density map is not sensible as the noise
entirely dominates the signal in the larger aperture. However, we can
infer a lower limit of
![]()
![]() 50 kpc. One way to test the integrity of the detection is to check
for noise peaks in the 1000 randomisations with equal or higher
significance. No such peak is found, consistent with the expectation
(0.21 peaks) from idealised Gaussian noise. In reality the noise
is non-Gaussian as the dispersion of image ellipticities is
non-Gaussian. Probing the actual differences for
50 kpc. One way to test the integrity of the detection is to check
for noise peaks in the 1000 randomisations with equal or higher
significance. No such peak is found, consistent with the expectation
(0.21 peaks) from idealised Gaussian noise. In reality the noise
is non-Gaussian as the dispersion of image ellipticities is
non-Gaussian. Probing the actual differences for
![]() peaks would require many more randomisations, but would not change
our main conclusion here that is that we detected a real signal.
peaks would require many more randomisations, but would not change
our main conclusion here that is that we detected a real signal.
As mentioned previously, we removed the contribution of MS0451 by subtracting a SIS profile with
![]() .
Changing this value by 5% alters the mass estimate by 0.1%,
hence this measurement is insensitive to the presence of MS0451. This
is not unexpected as the separation between J0454 and M0451 is large
and
.
Changing this value by 5% alters the mass estimate by 0.1%,
hence this measurement is insensitive to the presence of MS0451. This
is not unexpected as the separation between J0454 and M0451 is large
and ![]() is a local quantity, resulting in no overlap of the clusters' projected surface mass densities.
is a local quantity, resulting in no overlap of the clusters' projected surface mass densities.
![\begin{figure}
\par\includegraphics[width=8.8cm,clip]{13810_f11.ps}
\end{figure}](/articles/aa/full_html/2010/06/aa13810-09/img188.png)
|
Figure 11: Tangential shear of J0454 and best-fit SIS and NFW profiles. The shaded area shows the 68% confidence region of the SIS fit. |
| Open with DEXTER | |
6.2 SIS and NFW fits to the tangential shear profile
We fit SIS and NFW profiles to the tangential shear around J0454 (Fig. 11),
assuming a spherical symmetric density distribution. As compared
to the mass reconstruction, the results are not model-independent. For
the SIS we furthermore assumed that the system is in virial
equilibrium with isotropic distribution of the orbits, having a density
profile
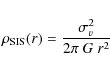
|
(21) |
which yields, in analogy to the derivation of Eq. (14),
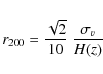
|
(22) |
(note the different pre-factor).
The tangential shear is measured with respect to a reference point,
which should be near or at the centre of mass, depending on
substructure. We identify the position where the tangential shear
is maximised with a matched-filter technique (the S-statistics or peak finder, see Schirmer et al. 2007). The signal is maximised for a 5
![]() 5 wide filter approximating the NFW shear profile, detecting J0454 on the
5 wide filter approximating the NFW shear profile, detecting J0454 on the
![]() level
level
![]()
![]()
![]() south-east of E0454 (position angle 162
south-east of E0454 (position angle 162 ![]() 2 degrees, both error estimates from bootstrapping). This is
coincident with the peak of the mass reconstruction and indicates a
robust choice for the reference point. In general, the two peaks
would not necessarily coincide as
both methods compute very different quantities. Deviations can occur in
particular for clusters with significant substructure (see e.g. Holhjem et al. 2009), provided that the S/N is high enough to
resolve such features. With this reference point the SIS fit yields
2 degrees, both error estimates from bootstrapping). This is
coincident with the peak of the mass reconstruction and indicates a
robust choice for the reference point. In general, the two peaks
would not necessarily coincide as
both methods compute very different quantities. Deviations can occur in
particular for clusters with significant substructure (see e.g. Holhjem et al. 2009), provided that the S/N is high enough to
resolve such features. With this reference point the SIS fit yields
![]()
![]()
![]() and
and
![]()
![]()
![]() ,
and from the NFW fit we obtained a concentration parameter of c=9.5
,
and from the NFW fit we obtained a concentration parameter of c=9.5 ![]() 4.8,
r200=834
4.8,
r200=834 ![]() 219 kpc and
219 kpc and
![]()
![]()
![]() .
Contrary to the convergence
.
Contrary to the convergence ![]() ,
the shear is a non-local quantity and therefore more susceptible to
changes in the velocity dispersion assumed for MS0451. For
example, decreasing (increasing) its
,
the shear is a non-local quantity and therefore more susceptible to
changes in the velocity dispersion assumed for MS0451. For
example, decreasing (increasing) its ![]() by 5% results in a 2% (4%) increase of the velocity
dispersion for J0454. These effects are included in our error budget.
by 5% results in a 2% (4%) increase of the velocity
dispersion for J0454. These effects are included in our error budget.
To quantify the effect of possible errors in the choice of the
reference point, we repeated the analysis using the core of E0454 and
the centroid of the distribution of elliptical galaxies within
r200=830 kpc. This yielded
![]()
![]()
![]() and 376
and 376 ![]()
![]() ,
respectively. The first fit is qualitatively slightly worse than the
original fit but still acceptable, whereas the second is significantly
deteriorated. The centroid of the distribution of
elliptical galaxies can therefore be ruled out as the centre of mass.
We show below based on strong lensing that this also applies
to E0454.
,
respectively. The first fit is qualitatively slightly worse than the
original fit but still acceptable, whereas the second is significantly
deteriorated. The centroid of the distribution of
elliptical galaxies can therefore be ruled out as the centre of mass.
We show below based on strong lensing that this also applies
to E0454.
![\begin{figure}
\par\includegraphics[width=8.8cm,clip]{13810_f12.eps}
\end{figure}](/articles/aa/full_html/2010/06/aa13810-09/img201.png)
|
Figure 12: HST/ACS image of the strong lens. The counter image and the arcs reveal two maxima in the source intensity distribution, forming two sets of multiple image systems. They are marked by circles and squares and are used for the lens modelling. |
| Open with DEXTER | |
7 Strong lensing analysis
7.1 Lens modelling
We identified two sets of multiple image systems, corresponding to two
bright knots in the source intensity distribution and identified by
circles and squares in Fig. 12. The lens is modelled using a pseudo-isothermal elliptic mass distribution (PIEMD, Kassiola & Kovner 1993, with zero core radius),
where b is the strength and q is the axis ratio. The 1/(1+q) normalisation is needed to match the profile in Kassiola & Kovner (1993) that was defined using ellipticities (
Table 3: Marginalised strong lens parameters.
![\begin{figure}
\par\includegraphics[width=6cm,clip]{13810_f13.ps}
\end{figure}](/articles/aa/full_html/2010/06/aa13810-09/img212.png)
|
Figure 13: The most probable critical curve (dashed) and caustic curve of the lens. The caustic consists of four folds (solid lines) joining at four cusps. The modelled source and image positions for the two sets of multiple-image systems are marked by squares and circles. |
| Open with DEXTER | |
We used the strong lens modelling code (Halkola et al. 2010, in preparation) based on Halkola et al. (2006), Halkola et al. (2008), Suyu et al. (2006) and Dunkley et al. (2005).
Markov chain Monte Carlo (MCMC) methods were employed to obtain
the posterior probability distributions of the lens parameters. We
placed Gaussian priors on the centroid, q, and
![]() of the PIEMD (with Gaussian widths of 0.05'', 0.09 and
of the PIEMD (with Gaussian widths of 0.05'', 0.09 and
![]() ,
respectively) based on the observed light distribution.
,
respectively) based on the observed light distribution.
Table 3 lists the results of the marginalised lens parameters from a MCMC chain of length 105 after the burn-in phase. Typical predicted image positions agree with the observations within 1 pixel (rms ![]()
![]() ). Figure 13
shows the critical and caustic curves of the most probable lens
parameters. The arc is in a fold configuration, close to being in a
cusp configuration (i.e., the positions of the bright knots in the
source lie next to a fold and are in the vicinity of a cusp of the
caustic curves). The two merging images form the northern half of the
arc with magnifications
). Figure 13
shows the critical and caustic curves of the most probable lens
parameters. The arc is in a fold configuration, close to being in a
cusp configuration (i.e., the positions of the bright knots in the
source lie next to a fold and are in the vicinity of a cusp of the
caustic curves). The two merging images form the northern half of the
arc with magnifications
![]() ,
and the other image the southern arc with
,
and the other image the southern arc with
![]() .
The counter image has
.
The counter image has
![]() .
.
The separations between the arc and the lens, and between the counter image and the lens, are
![]() and 3
and 3
![]() 42, respectively. This asymmetry requires the presence of significant external shear,
42, respectively. This asymmetry requires the presence of significant external shear,
![]() .
As gravitational lensing is an achromatic process, all images
should have similar colours, which allowed us to test the counter image
hypothesis. Since the lensed images are very near the core of E0454 we
subtracted a model for
the lens galaxy light before obtaining usable photometry. Thereto we
fit an elliptic Sersic model to the
.
As gravitational lensing is an achromatic process, all images
should have similar colours, which allowed us to test the counter image
hypothesis. Since the lensed images are very near the core of E0454 we
subtracted a model for
the lens galaxy light before obtaining usable photometry. Thereto we
fit an elliptic Sersic model to the
![]() data using GALFIT (Peng et al. 2002). The resulting images and source fluxes are shown in Figs. 14 and 15. We found good agreement confirming the lens modelling. Only the V-band
flux of the southern arc appears too low, which is a consequence of the
worse seeing in this filter and the fact that this image is closest to
the lens making it very susceptible to over-subtraction effects.
data using GALFIT (Peng et al. 2002). The resulting images and source fluxes are shown in Figs. 14 and 15. We found good agreement confirming the lens modelling. Only the V-band
flux of the southern arc appears too low, which is a consequence of the
worse seeing in this filter and the fact that this image is closest to
the lens making it very susceptible to over-subtraction effects.
7.2 PIEMD and stellar velocity dispersions
The equivalent Einstein radius of the PIEMD reads
|
(24) |
(e.g. Koopmans et al. 2006) and evaluates to
|
(25) |
yielding a PIEMD velocity dispersion of
![\begin{figure}
\par\includegraphics[width=8.8cm,clip]{13810_f14.eps}
\end{figure}](/articles/aa/full_html/2010/06/aa13810-09/img229.png)
|
Figure 14:
The arc system after subtracting an elliptic Sersic model from the CFHT u*-band and the Subaru |
| Open with DEXTER | |
Elíasdóttir et al. (2007) provide a recipe
through which the PIEMD strong lensing velocity dispersion can be
linked to the observed stellar velocity dispersion ![]() .
Their mass model is a parametrised truncated PIEMD (hereafter: dPIE) with core radius a and scale radius s, which becomes identical to our model in the limit of
.
Their mass model is a parametrised truncated PIEMD (hereafter: dPIE) with core radius a and scale radius s, which becomes identical to our model in the limit of
![]() and
and
![]() .
We obtain
.
We obtain
|
(26) |
The relation between
These considerations depend on the arc redshift which could not be
determined unambiguously from spectroscopy (see Sect. 2.3). For
![]() (1.0) we would have
(1.0) we would have
![]() (
(
![]() )
and similarly high stellar velocity dispersions. Thus
)
and similarly high stellar velocity dispersions. Thus
![]() is clearly ruled out by the velocity dispersion measured (
is clearly ruled out by the velocity dispersion measured (
![]()
![]()
![]() ), and also by the fundamental plane properties of BCG galaxies (Desroches et al. 2007). The latter predict
), and also by the fundamental plane properties of BCG galaxies (Desroches et al. 2007). The latter predict
![]()
![]()
![]() for a BCG with the absolute I-band luminosity of E0454 (-24.1 mag). A redshift of
for a BCG with the absolute I-band luminosity of E0454 (-24.1 mag). A redshift of
![]() would still be permitted within
would still be permitted within ![]() errors, but the redshift most consistent with the data are
errors, but the redshift most consistent with the data are
![]()
![]() 0.3, as assumed throughout our paper.
0.3, as assumed throughout our paper.
![\begin{figure}
\par\includegraphics[width=8cm,clip]{13810_f15.ps}
\end{figure}](/articles/aa/full_html/2010/06/aa13810-09/img248.png)
|
Figure 15: Magnitudes of the arc components and the counter image, obtained from the images in Fig. 14. The uncertainties in the values are of the order of 0.2 mag due to the residuals from the removal of E0454. |
| Open with DEXTER | |
8 Interpretation and discussion
8.1 E0454 is not at the centre of the dark matter potential
Strong gravitational lensing by galaxy groups is very sensitive to the
local group environment, and in particular to the internal distribution
of dark matter (Momcheva et al. 2006).
During the build-up
of the morphology-density relation individual dark matter haloes get
partially stripped and integrated into the group halo. In these
systems, strong lensing can occur by individual galaxies with typical
Einstein radii of
![]() ,
but also by the common and more massive group halo with
,
but also by the common and more massive group halo with
![]() (see e.g. Fassnacht et al. 2008; Limousin et al. 2009).
(see e.g. Fassnacht et al. 2008; Limousin et al. 2009).
The Einstein radius for the 476 ![]()
![]() weak lensing SIS halo of J0454 and a source redshift of zs=2.1
weak lensing SIS halo of J0454 and a source redshift of zs=2.1 ![]() 0.3 is
0.3 is
|
(27) |
more than twice as large as the observed arc radius of
This argument would not hold anymore if the lensed source was at very
low redshift (we assume that it is at high redshift, see Sects. 2.3 and 7.2). The Einstein radius of
![]() would be reproduced for zs=0.42, but already for slightly higher redshifts such as 0.5 (0.6) it would increase to
would be reproduced for zs=0.42, but already for slightly higher redshifts such as 0.5 (0.6) it would increase to
![]() (
(
![]() ).
But even if we overestimated the
source redshift significantly, E0454 could still not be located at
J0454's halo centre as we show in the following using the lensed image
configuration.
).
But even if we overestimated the
source redshift significantly, E0454 could still not be located at
J0454's halo centre as we show in the following using the lensed image
configuration.
The lens modelling (Table 3) requires a large amount of external shear,
![]()
![]() 0.02,
which can be caused by a different lens along the line of sight, but
also by an offset of E0454 in the halo of J0454. The SIS model for
the background cluster
MS0451 predicts
0.02,
which can be caused by a different lens along the line of sight, but
also by an offset of E0454 in the halo of J0454. The SIS model for
the background cluster
MS0451 predicts
![]() with
with
![]() degrees. To obtain the external shear required, we need additional components whose net shear is
degrees. To obtain the external shear required, we need additional components whose net shear is
![]()
![]() 0.017 and
0.017 and
![]()
![]() 0.6 degrees. Since there is no evidence for other suitable lenses
in the Keck spectra and the XMM-Newton data, this signal must come from
J0454 alone. Its centre of mass must be located
0.6 degrees. Since there is no evidence for other suitable lenses
in the Keck spectra and the XMM-Newton data, this signal must come from
J0454 alone. Its centre of mass must be located
![]()
![]()
![]() (89
(89 ![]() 16 kpc) south of E0454 for a SIS profile, and
31+30-12 arcsec (
126+122-49 kpc) for NFW (see Fig. 16).
The same external shear could also be caused if the halo was at
identical distances to the North of E0454, but this is ruled out at the
16 kpc) south of E0454 for a SIS profile, and
31+30-12 arcsec (
126+122-49 kpc) for NFW (see Fig. 16).
The same external shear could also be caused if the halo was at
identical distances to the North of E0454, but this is ruled out at the
![]() level by the mass reconstruction and the peak finder, both of which locate the centre of mass
level by the mass reconstruction and the peak finder, both of which locate the centre of mass
![]()
![]()
![]() south of E0454. This is unlikely to be the real centre, as neither
the mass reconstruction nor the peak finder are able to resolve such
substructures in the halo for the given lensing signal-to-noise ratio.
A much larger number
density of lensed background galaxies than n=73 arcmin-2 would be required for this purpose.
south of E0454. This is unlikely to be the real centre, as neither
the mass reconstruction nor the peak finder are able to resolve such
substructures in the halo for the given lensing signal-to-noise ratio.
A much larger number
density of lensed background galaxies than n=73 arcmin-2 would be required for this purpose.
![\begin{figure}
\par\includegraphics[width=8.8cm,clip]{13810_f16.eps}
\end{figure}](/articles/aa/full_html/2010/06/aa13810-09/img260.png)
|
Figure 16: The various estimates for the halo centre of J0454: distribution of elliptical galaxies, mass reconstruction and peak finder, and from the external shear coming from an SIS or NFW profile. The arrow marks a tidal feature in the optical halo of E0454. |
| Open with DEXTER | |
The different offsets predicted by the spherically symmetric NFW
and SIS density profiles are obviously model-dependent.
Furthermore, an elliptical halo would increase the offset if the
halo's projected major axis pointed to E0454. The reason for this is
the increased projected mass and thus shear seen by the strongly lensed
light bundle towards J0454, putting the halo at larger separation from
E0454 to satisfy the external shear constraint. Likewise a smaller
offset
would result if the halo minor axis pointed towards E0454. The first
scenario is more likely as the distribution of red sequence galaxies is
significantly elongated North-South within r200 (see Fig. 5),
which is expected if the galaxies are virialised within an elliptic
halo. In addition, E0454 is elongated along the same
direction, and Okumura et al. (2009) show that the central luminous red galaxies in clusters are preferentially aligned within ![]() degrees
with their host dark matter haloes. The separations between E0454 and
the halo centre should therefore be regarded as lower limits.
degrees
with their host dark matter haloes. The separations between E0454 and
the halo centre should therefore be regarded as lower limits.
8.1.1 Effect of sub-haloes on the external shear
Individual galaxies can significantly affect strong lensing systems
in cluster environments. We modelled the red sequence galaxies with
SIS profiles to estimate their contribution to the external shear,
using the velocity dispersions predicted by the Faber-Jackson relation
from Desroches et al. (2007).
Including successively more galaxy haloes going from the strong lens
outwards, we find that the external shear increases gradually and
stabilises at
![]()
![]() 0.056 with
0.056 with
![]() degrees. Only 5 galaxies within 0
degrees. Only 5 galaxies within 0
![]() 51
contribute to the signal. The uncertainty in the shear is large and
based on the intrinsic scattering of the Faber-Jackson relation. If we
systematically increase the predicted velocity dispersions of all
5 galaxies by the
51
contribute to the signal. The uncertainty in the shear is large and
based on the intrinsic scattering of the Faber-Jackson relation. If we
systematically increase the predicted velocity dispersions of all
5 galaxies by the ![]() range allowed by Faber-Jackson, then the entire external shear can be
explained by these haloes. In the other extreme, by lowering the
velocity dispersion by
range allowed by Faber-Jackson, then the entire external shear can be
explained by these haloes. In the other extreme, by lowering the
velocity dispersion by ![]() ,
the contribution to the external shear becomes zero.
,
the contribution to the external shear becomes zero.
We therefore expect halo substructures to contribute about 30% to the
total external shear. Since this lowers the shear coming from a smooth
common group or cluster halo with
![]() ,
the offset from E0454 to the centre of this halo becomes larger. For
example, in case of a SIS halo the separation would
increase from 22
,
the offset from E0454 to the centre of this halo becomes larger. For
example, in case of a SIS halo the separation would
increase from 22
![]() to 40
to 40
![]() .
The position angle, i.e. the location of the halo centre south of
E0454, remains unchanged. We ignore the smaller effects of substructure
for the rest of the paper as the main result, i.e. the presence of
an offset of E0454 with respect to the centre of the projected mass
distribution, remains unaffected.
.
The position angle, i.e. the location of the halo centre south of
E0454, remains unchanged. We ignore the smaller effects of substructure
for the rest of the paper as the main result, i.e. the presence of
an offset of E0454 with respect to the centre of the projected mass
distribution, remains unaffected.
8.1.2 Interpretation: a group falling into a cluster, or a filament collapsing onto a group?
How can it be explained that E0454, which is significantly more
luminous and massive than all other member galaxies, is not
located at the minimum of the gravitational potential? Such offsets are
not
uncommon for normal groups and clusters (Oegerle & Hill 2001; Skibba et al. 2010; von der Linden et al. 2007),
but for old and evolved fossils they are unusual and have not been
reported previously. If all galaxies in J0454 had the same origin, then
the observations are difficult to reconcile. A simple solution
would be that E0454 formed outside of J0454 in a separate small group
which is now falling into J0454. This could
also explain the velocity offset of
![]() (
(
![]() )
observed between the BCG and the population of elliptical (spiral) galaxies (see Sect. 4.2 and Oegerle & Hill 2001; Zabludoff & Mulchaey 1998). We present more support for this scenario below based on the properties of the X-ray halo.
)
observed between the BCG and the population of elliptical (spiral) galaxies (see Sect. 4.2 and Oegerle & Hill 2001; Zabludoff & Mulchaey 1998). We present more support for this scenario below based on the properties of the X-ray halo.
There is one observational difficulty in this picture. If the halo into which the group is falling represents a fully formed NFW mass distribution, then one would expect a galaxy or concentration of galaxies at its centre whose brightness is reasonably scaled to the halo mass. However, no such galaxies are seen. From this we conclude that the halo is not fully assembled yet, or decomposed into several sub-haloes in a filament projected along the line of sight, mimicking a spherical system. In the latter case, galaxies could be streaming along the filament onto the denser fossil group, presenting an alternative interpretation of the system (B. Fort, private communication). Unfortunately neither the strong nor the weak lensing data allows us to distinguish between a filament and a more spherical cluster. We pool both scenarios under the term ``infall hypothesis'', indicating a fossil group still forming an object of its own in a larger system (J0454).
8.2 X-ray halo properties support infall hypothesis
Whereas the strong lensing data require an offset of 90-120 kpc
between E0454 and the halo of J0454, only a weakly significant
offset of 24 ![]() 16 kpc exists between E0454 and the X-ray
halo. The latter appears to be gravitationally bound by E0454 and not
by J0454. Even though the X-ray halo overlaps in projection with
the presumed core of J0454, no significant mass transfer has happened
yet as the X-ray halo appears undisturbed. This can be explained if
E0454 still forms a local minimum and thus a system of its own in the
larger gravitational potential of J0454. The significantly lower X-ray
mass of 0.34
16 kpc exists between E0454 and the X-ray
halo. The latter appears to be gravitationally bound by E0454 and not
by J0454. Even though the X-ray halo overlaps in projection with
the presumed core of J0454, no significant mass transfer has happened
yet as the X-ray halo appears undisturbed. This can be explained if
E0454 still forms a local minimum and thus a system of its own in the
larger gravitational potential of J0454. The significantly lower X-ray
mass of 0.34 ![]()
![]() as compared to
(0.75-0.90)
as compared to
(0.75-0.90) ![]()
![]() from galaxy counts and weak lensing supports this interpretation. The same holds for the
from galaxy counts and weak lensing supports this interpretation. The same holds for the ![]() -model velocity dispersion (316
-model velocity dispersion (316 ![]()
![]() )
which matches the strong lensing value (319
)
which matches the strong lensing value (319 ![]()
![]() )
much better than the one derived from weak lensing (476
)
much better than the one derived from weak lensing (476 ![]()
![]() ). The halo temperature of 1.1 keV is also more characteristic for a group with
). The halo temperature of 1.1 keV is also more characteristic for a group with
![]() than the optically determined overall
than the optically determined overall
![]() .
If E0454 indeed represents a very evolved and virialised
former group of galaxies that is now falling into J0454 (Sect. 8.1),
then one would expect the X-ray properties to reflect a less massive
and smaller system than J0454. Given the undisturbed X-ray halo,
the absence of shock fronts and the low temperature, we presume that
E0454 has not yet passed through J0454 and is thus inbound for the
first time. The present data does not allow us to infer more
information about the three-dimensional orientation of the trajectory.
To this end we would need a better sampling of the peculiar
motions of the member galaxies in J0454.
.
If E0454 indeed represents a very evolved and virialised
former group of galaxies that is now falling into J0454 (Sect. 8.1),
then one would expect the X-ray properties to reflect a less massive
and smaller system than J0454. Given the undisturbed X-ray halo,
the absence of shock fronts and the low temperature, we presume that
E0454 has not yet passed through J0454 and is thus inbound for the
first time. The present data does not allow us to infer more
information about the three-dimensional orientation of the trajectory.
To this end we would need a better sampling of the peculiar
motions of the member galaxies in J0454.
8.3 X-ray offsets in other strong lensing or fossil groups
The offset of 24 ![]() 16 kpc
between the X-ray centroid and E0454 is consistent with those of other
groups. Four of the strong lensing selected systems by Fassnacht et al. (2008) have X-ray haloes, coinciding within
25-50 h100-1 kpc with the brightest group galaxy (BGG). Even smaller offsets have been observed for the five fossil groups in Khosroshahi et al. (2006b),
where the X-ray centroids of four systems match those of the BGGs. For
the fifth system, RX J1552.2+2013, an offset of 12 kpc
is
reported, but the authors argue that it is unlikely to be real. Fossil
samples that were cross-matched with the ROSAT All-Sky Survey (Voges et al. 1999) such as those by Santos et al. (2007) and La Barbera et al. (2009)
show larger offsets of up to 50 and 90 kpc, respectively.
These should be interpreted with caution though due to the poor angular
resolution of ROSAT. In general, X-ray selected galaxy groups
often show small offsets, but in dynamically disturbed or merging
systems they can
become larger than 100 kpc (Jeltema et al. 2007,2006).
16 kpc
between the X-ray centroid and E0454 is consistent with those of other
groups. Four of the strong lensing selected systems by Fassnacht et al. (2008) have X-ray haloes, coinciding within
25-50 h100-1 kpc with the brightest group galaxy (BGG). Even smaller offsets have been observed for the five fossil groups in Khosroshahi et al. (2006b),
where the X-ray centroids of four systems match those of the BGGs. For
the fifth system, RX J1552.2+2013, an offset of 12 kpc
is
reported, but the authors argue that it is unlikely to be real. Fossil
samples that were cross-matched with the ROSAT All-Sky Survey (Voges et al. 1999) such as those by Santos et al. (2007) and La Barbera et al. (2009)
show larger offsets of up to 50 and 90 kpc, respectively.
These should be interpreted with caution though due to the poor angular
resolution of ROSAT. In general, X-ray selected galaxy groups
often show small offsets, but in dynamically disturbed or merging
systems they can
become larger than 100 kpc (Jeltema et al. 2007,2006).
Whether small X-ray offsets are representative for strong lensing X-ray groups is currently difficult to answer due to the small sample size and possible selection effects. For example, the groups from Fassnacht et al. (2008) could be biased towards systems for which the X-ray centroid and the BGG coincide, as this would boost the central density giving rise to strong lensing. On the other hand, groups with more complicated dynamical states (and larger X-ray offsets) have increased lensing cross-sections and should therefore be selected as well.
8.4 Comparison with other strong lensing groups
Limousin et al. (2009) use an automated algorithm to detect strong lensing features. They were looking for Einstein radii larger than
![]() ,
targetting group-scale strong lenses, and found 13 such systems.
The authors also report weak lensing measurements of the velocity
dispersions in the range of
,
targetting group-scale strong lenses, and found 13 such systems.
The authors also report weak lensing measurements of the velocity
dispersions in the range of
![]() .
A comparison of the weak and strong lensing Einstein radii is not
made, but the according values have been tabulated. In general
there seems to be good agreement between the two estimates if the group
halo is responsible for the lensing. About half of the groups show
significantly larger strong lensing Einstein radii, most likely systems
where the lensing has been boosted by the potential of an individual
galaxy in addition to the group halo. Due to the lower cut-off in
.
A comparison of the weak and strong lensing Einstein radii is not
made, but the according values have been tabulated. In general
there seems to be good agreement between the two estimates if the group
halo is responsible for the lensing. About half of the groups show
significantly larger strong lensing Einstein radii, most likely systems
where the lensing has been boosted by the potential of an individual
galaxy in addition to the group halo. Due to the lower cut-off in
![]() objects
like J0454 with large weak and small strong lensing Einstein radii are
filtered out. A survey aiming at smaller strong lensing features
near the core of the BGG could identify systems similar to J0454.
In combination with a high external shear this would be a prime
indicator for substructure and a possible infall.
objects
like J0454 with large weak and small strong lensing Einstein radii are
filtered out. A survey aiming at smaller strong lensing features
near the core of the BGG could identify systems similar to J0454.
In combination with a high external shear this would be a prime
indicator for substructure and a possible infall.
8.5 Spatial and dynamic misalignment of E0454
More evidence for the infall hypothesis arises when looking at the sample of seven groups selected by Fassnacht et al. (2008) for their strong lensing effects. These authors found that the BGG almost always
coincides with the spatial and the dynamical group centre. E0454 on the other hand is marginally consistent within ![]() with the centre of the distribution of elliptical galaxies. In addition, its velocity deviates by
with the centre of the distribution of elliptical galaxies. In addition, its velocity deviates by ![]() (half
the velocity dispersion) from the mean recession velocity of the
ellipticals, and even more so from that of the spiral galaxies
(comparable to the velocity dispersion, see Sect. 4.2). E0454 also contradicts the nine X-ray selected groups and poor clusters of Mulchaey et al. (2006),
who found that BGGs coinciding with the X-ray centroid have the same
mean recession velocity as the surrounding group. It would be
worthwhile to look for similar
deviations in the currently existing samples of fossil groups.
(half
the velocity dispersion) from the mean recession velocity of the
ellipticals, and even more so from that of the spiral galaxies
(comparable to the velocity dispersion, see Sect. 4.2). E0454 also contradicts the nine X-ray selected groups and poor clusters of Mulchaey et al. (2006),
who found that BGGs coinciding with the X-ray centroid have the same
mean recession velocity as the surrounding group. It would be
worthwhile to look for similar
deviations in the currently existing samples of fossil groups.
With a more complete sampling of velocities of the elliptical galaxies we could analyse these deviations in more detail, possibly identifying a dynamic sub-population of galaxies belonging to the fossil group (or, if we summon our alternative interpretation, identify galaxies in the filament streaming towards the group). With the data at hand we cannot estimate how many galaxies comprise the fossil group. A tidal feature in E0454's optical halo (see Fig. 16) indicates that the accretion process in the fossil component of J0454 has not yet finished, and therefore it is plausible that E0454 is not the only galaxy belonging to that component.
Table 4: Summary of the main results.
8.6 Dynamic disturbances, X-ray offsets and cooling flows
Dynamically disturbed haloes can suppress or reheat cooling cores, as has been shown by Sanderson et al. (2009) for the 65 systems in the Local Cluster Substructure Survey (LoCuSS, median redshift z=0.23). They demonstrated that for clusters without cooling core or with inactive BCGs the probability distribution function of the projected offset between the X-ray centroid and the BCG peaks between 40 and 60 kpc. Conversely, cooling core clusters never showed offsets larger than 15 kpc. With an offset of 24 kpc and no traces of star formation in the FORS2/VLT spectrum, E0454 matches the LoCuSS observations. In addition there are also hints for dynamic disturbances. E0454 is embedded in an extended optical halo (see Fig. 16), forming a tidal tail in the North at a distance of about 90 kpc from the core. This feature is too small and too localised to be attributed to a current major merger event. It could be a residual of a recently disrupted small companion galaxy, or caused by tidal disturbances of galaxies orbiting very close to the halo (objects #2, 3 and 4 from Table A.1). A similar feature is observed in the BCG of the fossil cluster ESO 3060170 (Sun et al. 2004).
E0454 is currently accreting mass, but the rate is too small to have destroyed a previously existing cool core. Burns et al. (2008) have analysed the survival rate of cool cores in merger simulations and found that non-cooling core clusters experienced a high accretion rate with major mergers at z>0.5, destroying a potentially existing cool core and also prevent their later reformation. Minor, and in particular late accretion events such as the one observed in E0454 do not suppress a cool core. Thus, if a cooling core were present in E0454, it must have been destroyed at early times. This is consistent with E0454 being a giant elliptical galaxy, as only these galaxies have experienced major mergers in their history (Parry et al. 2009), and fossil systems in particular form their halos at earlier times than other groups (von Benda-Beckmann et al. 2008; Dariush et al. 2007). A systematic survey of fossils regarding cooling flows and cool cores would be helpful in testing theoretical predictions. So far, the number of examined systems is small (see e.g. Khosroshahi et al. 2006a,2004; Sun et al. 2004) and the amount of fossils with suitable X-ray data poor. This also applies to J0454, for which the data are insufficient to derive a temperature map with sufficient resolution to establish the non-existence of a cooling core.
8.7 Mass-to-light ratio
Sheldon et al. (2009a) have obtained mass-to-light ratios for the maxBCG cluster sample in SDSS, using weak lensing to estimate M200. The total luminosity within r200 was inferred from red sequence galaxies only. To minimise K-corrections, it was calculated for the i-band
bandpass shifted to the median cluster redshift of 0.25. We adopt
their terminology and refer to the shifted bandpass as 0.25i. A minimum 0.25i-band luminosity of
![]() was required for each galaxy.
was required for each galaxy.
From the SIS and NFW fit to the tangential shear profile we obtained an average
![]() kpc, corresponding to 3
kpc, corresponding to 3
![]() 47.
Within this radius are 14 and 22 red sequence galaxies with
and without spectroscopic confirmation above the minimum luminosity
threshold. To correct for the field contamination determined in
Sect. 3.1.3, we
randomly selected a corresponding number of 5 galaxies from
the sample without spectroscopic redshifts and calculated their total
flux contribution. This was repeated 100 times to estimate the
average background correction. The total luminosity found is
47.
Within this radius are 14 and 22 red sequence galaxies with
and without spectroscopic confirmation above the minimum luminosity
threshold. To correct for the field contamination determined in
Sect. 3.1.3, we
randomly selected a corresponding number of 5 galaxies from
the sample without spectroscopic redshifts and calculated their total
flux contribution. This was repeated 100 times to estimate the
average background correction. The total luminosity found is
![]()
![]()
![]() ,
and
M200/L0.25i=130
,
and
M200/L0.25i=130 ![]() 39 h for the SIS profile and
M200/L0.25i=122
39 h for the SIS profile and
M200/L0.25i=122 ![]() 96 h for NFW. In the rest-frame bandpass the M/L ratios would be 8% lower. For a cluster with the same number of N200 (Sect. 4.3) galaxies as J0454, Sheldon et al. (2009a) predict
96 h for NFW. In the rest-frame bandpass the M/L ratios would be 8% lower. For a cluster with the same number of N200 (Sect. 4.3) galaxies as J0454, Sheldon et al. (2009a) predict
![]()
![]() 30 h. Given the scatter present in the luminosity and the mass of a given N200 bin (see Sheldon et al. 2009a,b),
J0454 does not appear exceptionally over-luminous compared to
non-fossil systems. The contribution of the BGG to the total luminosity
in i-band within r200 is 38%.
30 h. Given the scatter present in the luminosity and the mass of a given N200 bin (see Sheldon et al. 2009a,b),
J0454 does not appear exceptionally over-luminous compared to
non-fossil systems. The contribution of the BGG to the total luminosity
in i-band within r200 is 38%.
For completeness we also report the corresponding result for rest-frame B-band and the SIS mass,
M200/LB=115 ![]() 34 h. If we include also galaxies bluer than the red sequence, the ratio becomes 101
34 h. If we include also galaxies bluer than the red sequence, the ratio becomes 101 ![]() 30 h. The contribution of the BGG to
30 h. The contribution of the BGG to
![]() is 34% for red sequence galaxies alone, decreasing to 29% if late type
galaxies are included. The latter is an upper limit as the sample of
late types is incomplete. For the two fossil
clusters RX J1416.4+2315 and RX J1552.2+2013 the
non-brightest cluster members contribute only
is 34% for red sequence galaxies alone, decreasing to 29% if late type
galaxies are included. The latter is an upper limit as the sample of
late types is incomplete. For the two fossil
clusters RX J1416.4+2315 and RX J1552.2+2013 the
non-brightest cluster members contribute only
![]() of the flux of the BCG, i.e. the BCG provides about 2/3 of
of the flux of the BCG, i.e. the BCG provides about 2/3 of
![]() (see Khosroshahi et al. 2007; Cypriano et al. 2006; Mendes de Oliveira et al. 2006).
(see Khosroshahi et al. 2007; Cypriano et al. 2006; Mendes de Oliveira et al. 2006).
9 Summary and conclusions
In deep ground-based Subaru/Suprime-Cam data we discovered a galaxy
strongly lensed by a very bright elliptical galaxy (E0454). Using
VLT/FORS2 spectroscopy we confirmed that E0454 is a member of a larger
association of galaxies (J0454) at z=0.26. The system forms a fossil group with a gap of 2.5 mag in I-band
between the brightest and the second brightest galaxy within half the
virial radius. We have spectroscopically confirmed the membership of 31
galaxies, and furthermore selected 33 objects based on their
photometric properties. Our catalogue is complete down to ![]() (Mi=-18.6).
(Mi=-18.6).
The data, being the deepest so far for a fossil group, show that J0454
is a complex system in various stages of mass assembly. Stripping away
the layers from outside to inside, we find two filaments extending
4 Mpc from J0454. Within a projected distance of 1.5 Mpc of
the centre is a population of spirals with
![]() ,
surrounding a more concentrated and dynamically cooler group of
,
surrounding a more concentrated and dynamically cooler group of ![]() galaxies (
galaxies (
![]() ). These form a red sequence with an
intrinsic width of
). These form a red sequence with an
intrinsic width of
![]() .
.
Using HST/ACS and photometric redshifts we performed the first weak
lensing analysis for a fossil group. The tangential shear profile
yields
![]() kpc and
kpc and
![]()
![]()
![]() ,
fully consistent with the predictions made by the cluster size-richness relation of Hansen et al. (2009).
From this point of view J0454 is indistinguishable from normal
clusters, forming either a rich fossil group or a poor fossil cluster.
The X-ray halo can be described by a classic
,
fully consistent with the predictions made by the cluster size-richness relation of Hansen et al. (2009).
From this point of view J0454 is indistinguishable from normal
clusters, forming either a rich fossil group or a poor fossil cluster.
The X-ray halo can be described by a classic ![]() -model and is only marginally offset (24 kpc) from the brightest group galaxy. However, the velocity dispersion of
-model and is only marginally offset (24 kpc) from the brightest group galaxy. However, the velocity dispersion of
![]() is lower than the one measured from weak lensing (
is lower than the one measured from weak lensing (
![]() )
and
spectroscopy (
)
and
spectroscopy (
![]() ), and so is M200 (0.34
), and so is M200 (0.34 ![]()
![]() ). The low X-ray halo temperature of 1.1 keV also favours a smaller structure with
). The low X-ray halo temperature of 1.1 keV also favours a smaller structure with
![]() .
.
Peculiarities arise when analysing the brightest group galaxy with
respect to its environment. It not located at the spatial centre
of elliptical galaxies and shows a significantly different velocity
than the mean velocity of the ellipticals. This indicates a different
origin of E0454 from the surrounding galaxies. More evidence for this
hypothesis is provided by the strongly lensed galaxy near the core of
E0454. We constrained its redshift to z=2.1 ![]() 0.3 and determined an Einstein radius of
0.3 and determined an Einstein radius of
![]() .
The weak lensing velocity dispersion of
.
The weak lensing velocity dispersion of
![]() corresponds to an Einstein radius of
corresponds to an Einstein radius of
![]() ,
meaning that E0454 cannot be located at the centre of the dark matter
halo of J0454. Even stronger evidence comes from the external shear
required to fit the position of the counter image. About 15% of the
shear can be attributed to the background cluster MS0451, and about 30%
to individual galaxies near E0454, but the dominant contribution must
come from J0454 itself. This can only be explained if E0454 is not at
the centre of the gravitational potential. If we describe the density
profile with NFW, then the projected distance between E0454 and the
halo centre must be at least
,
meaning that E0454 cannot be located at the centre of the dark matter
halo of J0454. Even stronger evidence comes from the external shear
required to fit the position of the counter image. About 15% of the
shear can be attributed to the background cluster MS0451, and about 30%
to individual galaxies near E0454, but the dominant contribution must
come from J0454 itself. This can only be explained if E0454 is not at
the centre of the gravitational potential. If we describe the density
profile with NFW, then the projected distance between E0454 and the
halo centre must be at least ![]() kpc. Whereas such offsets have
been shown to be common for other groups and clusters (Oegerle & Hill 2001; Skibba et al. 2010; von der Linden et al. 2007) this has not yet been reported for fossils.
kpc. Whereas such offsets have
been shown to be common for other groups and clusters (Oegerle & Hill 2001; Skibba et al. 2010; von der Linden et al. 2007) this has not yet been reported for fossils.
An explanation that reconciles all observations is that E0454 is currently infalling for the first time into the sparse cluster J0454, seeding the brightest cluster galaxy. An alternative interpretation is that J0454 is of filamentary nature, projected along the line of sight, and galaxies therein stream towards the denser fossil core. Both scenarios explain why the X-ray halo appears associated with E0454, has undisturbed isophotes, no shock fronts, a low temperature and a velocity dispersion and mass that fits a smaller group. This hypothesis is only possible because of the presence and properties of the strong lens, ruling out that E0454 is at the gravitational centre. Without the lens all data would form a consistent picture.
Recently, Lopes de Oliveira et al. (2010) have demonstrated for the fossil UGC 842 that it segregates into two groups with
![]() each, separated by about
each, separated by about
![]() .
Contrary to J0454 with a comparatively low temperature of 1.1 keV,
UGC 842 shows a, with respect to the velocity dispersion,
increased temperature of 1.9 keV, which has been interpreted as a
sign of an advanced interaction or merging state.
.
Contrary to J0454 with a comparatively low temperature of 1.1 keV,
UGC 842 shows a, with respect to the velocity dispersion,
increased temperature of 1.9 keV, which has been interpreted as a
sign of an advanced interaction or merging state.
9.1 Future observations
Our Subaru/Suprime-Cam images are significantly deeper than those of any other fossil system investigated so far, reaching ![]() -limits of 24.9 in z-band down to 26.6 in B-band. Hence
this data set could probe the luminosity function
-limits of 24.9 in z-band down to 26.6 in B-band. Hence
this data set could probe the luminosity function ![]() mag
below the BGG, provided deep spectroscopic data are available to remove
objects with very similar redshifts. The existing
spectra are limited to I<21.5 mag and complete to only about 40% at this depth. Hence we limited our analysis to galaxies with I<22 mag. With several hours of exposure time at 4-8 m telescopes we could push the spectroscopic limit by
mag
below the BGG, provided deep spectroscopic data are available to remove
objects with very similar redshifts. The existing
spectra are limited to I<21.5 mag and complete to only about 40% at this depth. Hence we limited our analysis to galaxies with I<22 mag. With several hours of exposure time at 4-8 m telescopes we could push the spectroscopic limit by ![]() mag,
which would enable us to present an uncontaminated luminosity function
extending down to dwarf ellipticals. Numerous of those are seen in the
data with colours matching that of the red sequence. With a better
spectroscopic
sampling we could remove all line of sight contamination and construct
a complete red sequence down to much fainter magnitudes, and a fairly
complete sample of blue galaxies. There are also possibilities that we
could resolve J0454 from a dynamical point of view into members
belonging to the fossil component, and into galaxies belonging to the
sparse surrounding. If both components have indeed separate origins,
then one could attempt to identify stellar populations of different
age and composition.
mag,
which would enable us to present an uncontaminated luminosity function
extending down to dwarf ellipticals. Numerous of those are seen in the
data with colours matching that of the red sequence. With a better
spectroscopic
sampling we could remove all line of sight contamination and construct
a complete red sequence down to much fainter magnitudes, and a fairly
complete sample of blue galaxies. There are also possibilities that we
could resolve J0454 from a dynamical point of view into members
belonging to the fossil component, and into galaxies belonging to the
sparse surrounding. If both components have indeed separate origins,
then one could attempt to identify stellar populations of different
age and composition.
Significantly deeper X-ray data could be used to better determine the offset with respect to the BGG. We could also look for temperature variations and changes in the chemical composition of the gas, which would tell us more about the different origins of the sparse cluster and the infalling group.
Lastly, deeper space-based observations could double the number density of lensed galaxies and we could attempt to obtain direct evidence for the separation of J0454 and E0454 in the mass reconstructions. However, given the aged detectors of the HST/ACS instrument this will be a difficult endeavour.
AcknowledgementsM.S. thanks Bodo Ziegler at ESO and the staff at Paranal for the prompt execution of the DDT programme, and Helen Eckmiller, Bernard Fort, Sarah Hansen, Stefan Hilbert, Satoshi Miyazaki and Achille Nucita for their expertise and helpfulness concerning various aspects of this work. Andrew Cardwell, Karianne Holhjem and Peter Schneider provided very useful comments on the manuscript. We thank the anonymous referee for very helpful suggestions that improved the paper significantly. Author contributions: M.S. did the scientific analysis, obtained the VLT spectrum, reduced the Subaru, VLT and the XMM data, discovered the strong lens system and wrote most parts of the manuscript. S.S. did the strong lens modelling, based upon a code developed by herself and by A.H. T.S. reduced the HST/ACS data and provided the shear catalogue, while H.H. complemented it with photometric redshifts. T.E. provided the stacks of the Elixir pre-processed CFHTimages. Some figures in this paper were made with the plotting tool WIP (Morgan 1995). The authors wish to recognize and acknowledge the very significant cultural role and reverence that the summit of Mauna Kea has always had within the indigenous Hawaiian community. We are most fortunate to have the opportunity to conduct observations from this mountain. M.S. acknowledges support by the German Ministry for Science and Education (BMBF) through DESY under the project 05AV5PDA/3 and the Deutsche Forschungsgemeinschaft (DFG) in the frame of the Schwerpunktprogramm SPP 1177 ``Galaxy Evolution''. S.S. is supported in part through the DFG under project SCHN 342/7-1. T.S. acknowledges financial support from the Netherlands Organisation for Scientific Research (NWO). H.H. is supported by DUEL-RTN, MRTN-CT-2006-036133, and A.H. by the DFG cluster of excellence ``Origin and Structure of the Universe''.
References
- Argence, B., & Lamareille, F. 2009, A&A, 495, 759
- Bertin, E. 2006, in Astronomical Data Analysis Software and Systems XV, ed. C. Gabriel, C. Arviset, D. Ponz, & S. Enrique, ASP Conf. Ser., 351, 112
- Bertin, E., & Arnouts, S. 1996, A&AS, 117, 393
- Blanton, M. R., & Roweis, S. 2007, AJ, 133, 734
- Böhringer, H., Schuecker, P., Guzzo, L., et al. 2004, A&A, 425, 367
- Boschin, W. 2002, A&A, 396, 397
- Boylan-Kolchin, M., Ma, C.-P., & Quataert, E. 2008, MNRAS, 383, 93
- Burns, J. O., Hallman, E. J., Gantner, B., Motl, P. M., & Norman, M. L. 2008, ApJ, 675, 1125
- Carlberg, R. G., Yee, H. K. C., & Ellingson, E. 1997, ApJ, 478, 462
- Chandrasekhar, S. 1943, ApJ, 97, 255
- Cypriano, E. S., Mendes de Oliveira, C. L., & Sodré, L. J. 2006, AJ, 132, 514
- Danese, L., de Zotti, G., & di Tullio, G. 1980, A&A, 82, 322
- Dariush, A., Khosroshahi, H. G., Ponman, T. J., et al. 2007, MNRAS, 382, 433
- Desroches, L., Quataert, E., Ma, C., & West, A. A. 2007, MNRAS, 377, 402
- Dunkley, J., Bucher, M., Ferreira, P. G., Moodley, K., & Skordis, C. 2005, MNRAS, 356, 925
- Edge, A. C. 2001, MNRAS, 328, 762
- Elíasdóttir, Á., Limousin, M., Richard, J., et al. 2007 [arXiv:0710.5636]
- Erben, T., Hildebrandt, H., Lerchster, M., et al. 2009, A&A, 493, 1197
- Erben, T., Schirmer, M., Dietrich, J., et al. 2005, AN, 326, 432
- Erben, T., van Waerbeke, L., Bertin, E., Mellier, Y., & Schneider, P. 2001, A&A, 366, 717
- Fassnacht, C. D., Kocevski, D. D., Auger, M. W., et al. 2008, ApJ, 681, 1017
- Gladders, M., & Yee, H. 2000, AJ, 120, 2148
- Goto, T., Yamauchi, C., Fujita, Y., et al. 2003, MNRAS, 346, 601
- Halkola, A., Hildebrandt, H., Schrabback, T., et al. 2008, A&A, 481, 65
- Halkola, A., Seitz, S., & Pannella, M. 2006, MNRAS, 372, 1425
- Hansen, S. M., McKay, T. A., Wechsler, R. H., et al. 2005, ApJ, 633, 122
- Hansen, S. M., Sheldon, E. S., Wechsler, R. H., & Koester, B. P. 2009, ApJ, 699, 1333
- Harrison, E. R. 1974, ApJ, 191, L51
- Hashimoto, Y., Henry, J. P., & Boehringer, H. 2008, MNRAS, 390, 1562
- Hildebrandt, H., Pielorz, J., Erben, T., et al. 2009, A&A, 498, 725
- Hoekstra, H., Franx, M., Kuijken, K., & Squires, G. 1998, ApJ, 504, 636
- Hogg, D. W., Baldry, I. K., Blanton, M. R., & Eisenstein, D. J. 2002 [arXiv:astro-ph/0210394]
- Holhjem, K., Schirmer, M., & Dahle, H. 2009, A&A, 504, 1
- Jeltema, T. E., Mulchaey, J. S., Lubin, L. M., Rosati, P., & Böhringer, H. 2006, ApJ, 649, 649
- Jeltema, T. E., Mulchaey, J. S., Lubin, L. M., & Fassnacht, C. D. 2007, ApJ, 658, 865
- Johnston, D. E., Sheldon, E. S., Wechsler, R. H., et al. 2007 [arXiv:0709.1159]
- Jones, L. R., Ponman, T. J., Horton, A., et al. 2003, MNRAS, 343, 627
- Kaiser, N., Squires, G., & Broadhurst, T. 1995, ApJ, 449, 460
- Kalberla, P. M. W., Burton, W. B., Hartmann, D., et al. 2005, A&A, 440, 775
- Kassiola, A., & Kovner, I. 1993, ApJ, 417, 450
- Kennicutt, Jr., R. C. 1998, ARA&A, 36, 189
- Khosroshahi, H. G., Jones, L. R., & Ponman, T. J. 2004, MNRAS, 349, 1240
- Khosroshahi, H. G., Maughan, B. J., Ponman, T. J., & Jones, L. R. 2006a, MNRAS, 369, 1211
- Khosroshahi, H. G., Ponman, T. J., & Jones, L. R. 2006b, MNRAS, 372, L68
- Khosroshahi, H. G., Ponman, T. J., & Jones, L. R. 2007, MNRAS, 377, 595
- Koch, A., Odenkirchen, M., Grebel, E. K., & Caldwell, J. A. R. 2004, Astron. Nachr., 325, 299
- Koopmans, L. V. E., Treu, T., Bolton, A. S., Burles, S., & Moustakas, L. A. 2006, ApJ, 649, 599
- La Barbera, F., de Carvalho, R. R., de la Rosa, I. G., et al. 2009, AJ, 137, 3942
- Limousin, M., Cabanac, R., Gavazzi, R., et al. 2009, A&A, 502, 445
- Lopes de Oliveira, R., Carrasco, E. R., Mendes de Oliveira, C., et al. 2010, AJ, 139, 216
- Luppino, G. A., & Kaiser, N. 1997, ApJ, 475, 20
- Magnier, G., & Cuillandre, J.-C. 2004, PASP, 116, 449
- Manfroid, J., & Selman, F. 2001, The Messenger, 104, 16
- McKean, J. P., Auger, M. W., Koopmans, L. V. E., et al. 2010, MNRAS, 404, 749
- Mendes de Oliveira, C. L., Cypriano, E. S., & Sodré, L. J. 2006, AJ, 131, 158
- Milosavljevic, M., Miller, C. J., Furlanetto, S. R., & Cooray, A. 2006, ApJ, 637, L9
- Miyazaki, S., Komiyama, Y., Sekiguchi, M., et al. 2002, PASJ, 54, 833
- Momcheva, I., Williams, K., Keeton, C., & Zabludoff, A. 2006, ApJ, 641, 169
- Moran, S. M., Ellis, R. S., Treu, T., et al. 2007, ApJ, 671, 1503
- Morgan, J. 1995, ASPC, 77, 129
- Morrison, R., & McCammon, D. 1983, ApJ, 270, 119
- Mulchaey, J. S. 2000, ARA&A, 38, 289
- Mulchaey, J. S., & Zabludoff, A. I. 1998, ApJ, 496, 73
- Mulchaey, J. S., Lubin, L. M., Fassnacht, C., Rosati, P., & Jeltema, T. E. 2006, ApJ, 646, 133
- Nath, B. B. 2008, MNRAS, 387, L50
- Navarro, J., Frenk, C., & White, S. 1997, ApJ, 486, 493
- Nusser, A., & Sheth, R. K. 1999, MNRAS, 303, 685
- Oegerle, W. R., & Hill, J. M. 2001, AJ, 122, 2858
- Okumura, T., Jing, Y. P., & Li, C. 2009, ApJ, 694, 214
- Parry, O. H., Eke, V. R., & Frenk, C. S. 2009, MNRAS, 396, 1972
- Peng, C. Y., Ho, L. C., Impey, C. D., & Rix, H. W. 2002, AJ, 124, 266
- Pickles, A. J. 1998, PASP, 110, 863
- Ponman, T. J., Allan, D. J., Jones, L. R., et al. 1994, Nature, 369, 462
- Quilis, V., Moore, B., & Bower, R. 2000, Science, 288, 1617
- Rakic, A., Räsänen, S., & Schwarz, D. J. 2006, MNRAS, 369, L27
- Reiprich, T. H., & Böhringer, H. 2002, ApJ, 567, 716
- Rykoff, E. S., McKay, T. A., Becker, M. R., et al. 2008, ApJ, 675, 1106
- Sanderson, A. J. R., Edge, A. C., & Smith, G. P. 2009, MNRAS, 398, 1698
- Santos, W. A., Mendes de Oliveira, C., & Sodré, L. J. 2007, AJ, 134, 1551
- Sarazin, C. L. 1988, X-ray emission from clusters of galaxies (Cambridge: Cambridge University Press), Cambridge Astrophys. Ser.
- Scannapieco, C., White, S. D. M., Springel, V., & Tissera, P. B. 2009, MNRAS, 396, 696
- Schirmer, M., Erben, T., Hetterscheidt, M., & Schneider, P. 2007, A&A, 462, 875
- Schlegel, D. J., Finkbeiner, D. P., & Davis, M. 1998, ApJ, 500, 525
- Schrabback, T., Erben, T., Simon, P., et al. 2007, A&A, 468, 823
- Schrabback, T., Hartlap, J., Joachimi, B., et al. 2009, A&A, accepted [arXiv:0911.0053]
- Scoville, N., Abraham, R. G., Aussel, H., et al. 2007, ApJS, 172, 38
- Seitz, S., & Schneider, P. 2001, A&A, 374, 740
- Sheldon, E. S., Johnston, D. E., Masjedi, M., et al. 2009a, ApJ, 703, 2232
- Sheldon, E. S., Johnston, D. E., Scranton, R., et al. 2009b, ApJ, 703, 2217
- Skibba, R. A., van den Bosch, F. C., Yang, X., et al. 2010, MNRAS, submitted [arXiv:1001.4533]
- Stanek, R., Evrard, A. E., Böhringer, H., Schuecker, P., & Nord, B. 2006, ApJ, 648, 956
- Sun, M., Forman, W., Vikhlinin, A., et al. 2004, ApJ, 612, 805
- Suyu, S. H., Marshall, P. J., Hobson, M. P., & Blandford, R. D. 2006, MNRAS, 371, 983
- Vikhlinin, A., McNamara, B. R., Hornstrup, A., et al. 1999, ApJ, 520, L1
- Voevodkin, A., Borozdin, K., Heitmann, K., et al. 2010, ApJ, 708, 1376
- Voges, W., Aschenbach, B., Boller, T., et al. 1999, A&A, 349, 389
- von Benda-Beckmann, A. M., D'Onghia, E., Gottlöber, S., et al. 2008, MNRAS, 386, 2345
- von der Linden, A., Best, P. N., Kauffmann, G., & White, S. D. M. 2007, MNRAS, 379, 867
- Watson, M. G., Schröder, A. C., Fyfe, D., et al. 2009, A&A, 493, 339
- Yoshioka, T., Furuzawa, A., Takahashi, S., et al. 2004, Adv. Space Res., 34, 2525
- Zabludoff, A. I., & Mulchaey, J. S. 1998, ApJ, 496, 39
Appendix A:
Table A.1: Members of J0454, ordered by increasing separation r from E0454.
![\begin{figure}
\par\includegraphics[width=17cm,clip]{13810_f17.eps}
\end{figure}](/articles/aa/full_html/2010/06/aa13810-09/img315.png)
|
Figure A.1:
Logarithmically scaled Subaru/Suprime-Cam |
| Open with DEXTER | |
Footnotes
- ... cluster
- This work is based on data collected at the Subaru Telescope, which is operated by the National Astronomical Observatory of Japan; based on observations obtained with MegaPrime/MegaCam, a joint project of CFHT and CEA/DAPNIA, at the Canada-France-Hawaii Telescope (CFHT) which is operated by the National Research Council (NRC) of Canada, the Institut National des Sciences de l'Univers of the Centre National de la Recherche Scientifique (CNRS) of France, and the University of Hawaii; based on observations made with ESO Telescopes at the La Silla and Paranal Observatories, Chile (ESO DDT Programme 282.A-5066); based on observations made with the NASA/ESA Hubble Space Telescope (programme #9836) obtained at the Space Telescope Science Institute, which is operated by the Association of Universities for Research in Astronomy, Inc., under NASA contract NAS 5-26555; based on observations obtained with XMM-Newton, an ESA science mission with instruments and contributions directly funded by ESA Member States and NASA; based on data obtained at the W.M. Keck Observatory, which is operated as a scientific partnership among the California Institute of Technology, the University of California and the National Aeronautics and Space Administration. The Observatory was made possible by the generous financial support of the W.M. Keck Foundation.
- ... THELI
- Available at
http://www.astro.uni-bonn.de/ mischa/theli.html - ...
XMM-SAS
- http://xmm.esac.esa.int/sas/
- ... available
- http://www.astro.uni-bonn.de/ mischa/download/massrec.tar
All Tables
Table 1: Summary of the Subaru/Suprime-Cam and CFHT/Megaprime data.
Table 2: Combined Subaru mirror reflectivity and corrector throughput.
Table 3: Marginalised strong lens parameters.
Table 4: Summary of the main results.
Table A.1: Members of J0454, ordered by increasing separation r from E0454.
All Figures
|
|
Figure 1: Pointings of the imaging data sets. The positions of the fossil group J0454 and the background cluster MS0451 are shown as well. |
| Open with DEXTER | |
| In the text | |
|
|
Figure 2: Comparison of photometric and spectroscopic redshifts. |
| Open with DEXTER | |
| In the text | |
|
|
Figure 3: Redshifted FORS2 spectra of the lens and the arc (binned 3 times). No significant features were found in the spectrum of the arc. The noise level was offset by -0.5 for better visibility. |
| Open with DEXTER | |
| In the text | |
|
|
Figure 4: Target selection in colour-colour and colour-magnitude space. The left and middle panels: galaxies with 0.52<z<0.56 and 0.28<z<0.5 are shown as red and cyan diamonds, respectively. Confirmed members of J0454 are coded green, and blue triangles are objects with 0.1<z<0.24. A selection in colour-magnitude space leads to significant contamination with objects at higher redshifts ( left panel, exemplary for B-R vs. R). Instead, we selected galaxies in B-V vs. V-I ( middle). The right panel shows that the galaxies selected in B-V vs. V-I form a well-defined red sequence in V-I vs. I, and the box indicates additional selection criteria. Black points represent galaxies that were kept based on this purely photometric selection, and grey ones were excluded. Small corrections were made by means of available spectra (see text for details). |
| Open with DEXTER | |
| In the text | |
|
|
Figure 5:
Photometrically and spectroscopically selected cluster galaxies. The circle indicates
|
| Open with DEXTER | |
| In the text | |
|
|
Figure 6:
Clustering for different spectroscopic redshift bins and their width (in parentheses). J0454 is shown in the upper right, MS0451 in the lower left. The circle is centred on E0454 and traces
|
| Open with DEXTER | |
| In the text | |
|
|
Figure 7: The kinematic structure of J0454 with respect to E0454. Filled and open symbols mark red- and blueshifted galaxies, respectively. |
| Open with DEXTER | |
| In the text | |
| |
Figure 8:
Left panel: redshift distribution for the red (E, S0)
and blue (Sa-Sc, Irr) galaxy populations. Notice that the
spectroscopic sampling of ellipticals is complete to only
|
| Open with DEXTER | |
| In the text | |
|
|
Figure 9:
HST/ACS image of J0454. The (jagged) blue contours trace the S/N-ratio of the 0.5-2.0 keV X-ray flux, starting with |
| Open with DEXTER | |
| In the text | |
|
|
Figure 10:
Best-fit |
| Open with DEXTER | |
| In the text | |
|
|
Figure 11: Tangential shear of J0454 and best-fit SIS and NFW profiles. The shaded area shows the 68% confidence region of the SIS fit. |
| Open with DEXTER | |
| In the text | |
|
|
Figure 12: HST/ACS image of the strong lens. The counter image and the arcs reveal two maxima in the source intensity distribution, forming two sets of multiple image systems. They are marked by circles and squares and are used for the lens modelling. |
| Open with DEXTER | |
| In the text | |
|
|
Figure 13: The most probable critical curve (dashed) and caustic curve of the lens. The caustic consists of four folds (solid lines) joining at four cusps. The modelled source and image positions for the two sets of multiple-image systems are marked by squares and circles. |
| Open with DEXTER | |
| In the text | |
|
|
Figure 14:
The arc system after subtracting an elliptic Sersic model from the CFHT u*-band and the Subaru |
| Open with DEXTER | |
| In the text | |
|
|
Figure 15: Magnitudes of the arc components and the counter image, obtained from the images in Fig. 14. The uncertainties in the values are of the order of 0.2 mag due to the residuals from the removal of E0454. |
| Open with DEXTER | |
| In the text | |
|
|
Figure 16: The various estimates for the halo centre of J0454: distribution of elliptical galaxies, mass reconstruction and peak finder, and from the external shear coming from an SIS or NFW profile. The arrow marks a tidal feature in the optical halo of E0454. |
| Open with DEXTER | |
| In the text | |
|
|
Figure A.1:
Logarithmically scaled Subaru/Suprime-Cam |
| Open with DEXTER | |
| In the text | |
Copyright ESO 2010
Current usage metrics show cumulative count of Article Views (full-text article views including HTML views, PDF and ePub downloads, according to the available data) and Abstracts Views on Vision4Press platform.
Data correspond to usage on the plateform after 2015. The current usage metrics is available 48-96 hours after online publication and is updated daily on week days.
Initial download of the metrics may take a while.