| Issue |
A&A
Volume 514, May 2010
Science with AKARI
|
|
|---|---|---|
| Article Number | A10 | |
| Number of page(s) | 17 | |
| Section | Extragalactic astronomy | |
| DOI | https://doi.org/10.1051/0004-6361/200913483 | |
| Published online | 03 May 2010 | |
Science with AKARI
The AGN fraction of submm-selected galaxies and contributions to the submm/mm-wave extragalactic background light
S. Serjeant1 - M. Negrello1 - C. Pearson1,2,17 - A. Mortier3 - J. Austermann4 - I. Aretxaga5 - D. Clements3 - S. Chapman18 - S. Dye6 - J. Dunlop7 - L. Dunne8 - D. Farrah9 - D. Hughes5 - H.-M. Lee12 - H. Matsuhara13 - E. Ibar10 - M. Im12 - W.-S. Jeong16 - S. Kim11 - S. Oyabu13 - T. Takagi13 - T. Wada13 - G. Wilson14 - M. Vaccari15 - M. Yun14
1 - Department of Physics & Astronomy, The Open University, Milton Keynes MK7 6BJ, UK
2 - Rutherford Appleton Laboratory, Chilton, Didcot, Oxfordshire OX11 0QX, UK
3 - Astrophysics Group, Dept. of Physics, Imperial College London, Prince Consort Road, London SW7 2BW, UK
4 - Center for Astrophysics and Space Astronomy, University of Colorado, Boulder, CO80309, USA
5 - Instituto Nacional de Astrofísica, Optica y Electrónica (INAOE), Tonantzintla, Puebla, México
6 - Cardiff University, School of Physics & Astronomy, Queens Buildings, The Parade, Cardiff CF24 3AA, UK
7
- Scottish Universities Physics Alliance (SUPA), Institute for
Astronomy, The University of Edinburgh, Royal Observatory, Blackford
Hill, Edinburgh EH9 3HJ, UK
8 - School of Physics & Astronomy, University of Nottingham, University Park, Nottingham, NG7 2RD, UK
9 - Astronomy Centre, University of Sussex, Falmer, Brighton BN1 9QH, UK
10 - UK Astronomy Technology Centre, Royal Observatory, Edinburgh EH9 3HJ, UK
11 - Astronomy & Space Science Department, Sejong University, 143-747 Seoul, South Korea
12 - Department of Physics and Astronomy, Seoul National University, Shillim-Dong, Kwanak-Gu Seoul 151-742, South Korea
13 - Institute of Space and Astronautical Science, Japan Aerospace Exploration Agency, Sagamihara, Kanagawa 229 8510, Japan
14 - Department of Astronomy, University of Massachusetts, Amherst, MA01003, USA
15 - Department of Astronomy, University of Padova, vic. Osservatorio 2, 35122 Padova, Italy
16 - Space Science Divison, KASI, 61-1, Whaam-dong, Yuseong-gu, Deajeon 305-348, South Korea
17 - Department of Physics, University of Lethbridge, 4401 University Drive, Lethbridge, Alberta T1J 1B1, Canada
18 - Institute of Astronomy, University of Cambridge, Madingley Road, Cambridge CB3 0HA, UK
Received 15 October 2009 / Accepted 18 February 2010
Abstract
We present a comparison of the SCUBA half degree extragalactic survey (SHADES) at ![]() m,
m, ![]() m and
m and ![]() m with deep guaranteed time
m with deep guaranteed time ![]() m AKARI FU-HYU survey data and Spitzer guaranteed time data at
m AKARI FU-HYU survey data and Spitzer guaranteed time data at
![]() m
in the Lockman hole east. The AKARI data was analysed using bespoke
software based in part on the drizzling and minimum-variance matched
filtering developed for SHADES, and was cross-calibrated against ISO
fluxes. Our stacking analyses find AKARI
m
in the Lockman hole east. The AKARI data was analysed using bespoke
software based in part on the drizzling and minimum-variance matched
filtering developed for SHADES, and was cross-calibrated against ISO
fluxes. Our stacking analyses find AKARI ![]() m galaxies with
m galaxies with
![]() Jy contribute
Jy contribute ![]() of the
of the ![]() m background, but only
m background, but only ![]() of the
of the ![]() m
background, suggesting that different populations contribute at
mm-wavelengths. We confirm our earlier result that the ultra-deep
m
background, suggesting that different populations contribute at
mm-wavelengths. We confirm our earlier result that the ultra-deep ![]() m SCUBA-2 cosmology survey will be dominated by populations already detected by AKARI and Spitzer mid-infrared surveys. The superb mid-infrared wavelength coverage afforded by combining Spitzer and AKARI photometry is an excellent diagnostic of AGN contributions, and
we find that
m SCUBA-2 cosmology survey will be dominated by populations already detected by AKARI and Spitzer mid-infrared surveys. The superb mid-infrared wavelength coverage afforded by combining Spitzer and AKARI photometry is an excellent diagnostic of AGN contributions, and
we find that
![]() of submm-selected galaxies have AGN bolometric fractions
of submm-selected galaxies have AGN bolometric fractions
![]() .
.
Key words: galaxies: starburst - infrared: galaxies - galaxies: active - galaxies: statistics
1 Introduction
The pioneering submm-wave observations of the Hubble deep field north (Hughes et al. 1998; Barger et al. 1998) and galaxy cluster gravitational lenses (Smail et al. 1997) revealed the presence of completely unanticipated populations of submm-luminous galaxies with fluxes of several mJy at ![]() m.
This discovery was one of the first in a series that led to the
development and ultimately wide acceptance of ``downsizing''
phenomenological models of galaxy evolution, that massive galaxies
formed the bulk of their stars at high redshifts in large starburst
events, with the opposite behaviour found in lower-mass systems. This
is contrary to naive expectations from hierarchical models, but
nevertheless it was found these observations could be made consistent
with semi-analytic hierarchical models by adjusting the physical
parameters used to characterised feedback processes (e.g. Granato
et al. 2006) and/or with adjustments to the initial mass function (e.g. Baugh et al. 2005; Lacey et al. 2008).
m.
This discovery was one of the first in a series that led to the
development and ultimately wide acceptance of ``downsizing''
phenomenological models of galaxy evolution, that massive galaxies
formed the bulk of their stars at high redshifts in large starburst
events, with the opposite behaviour found in lower-mass systems. This
is contrary to naive expectations from hierarchical models, but
nevertheless it was found these observations could be made consistent
with semi-analytic hierarchical models by adjusting the physical
parameters used to characterised feedback processes (e.g. Granato
et al. 2006) and/or with adjustments to the initial mass function (e.g. Baugh et al. 2005; Lacey et al. 2008).
Indeed the existence of strong relationships between supermassive black hole masses in nearby galaxies and the properties of the host bulges or spheroids (e.g. the Magorrian relation, Magorrian et al. 1998; see also e.g. Ferrarese & Merritt 2000) all but require a strong link between high-redshift black hole accretion and the generation of the stellar mass of the host. This is reinforced by the observations that many or perhaps all quasars show evidence of star formation (e.g. Lehnert et al. 1992; Hughes et al. 1997; Aretxaga et al. 1998; Brotherton et al. 1999; Lutz et al. 2008; Mullaney et al. 2010; Shi et al. 2009; Veilleux et al. 2009; Serjeant & Hatziminaoglou 2009). While submm and mm-wave direct detections are only made in a minority of high-redshift quasars (e.g. Carilli et al. 2001; Omont et al. 2001; Isaak et al. 2002; Bertoldi & Cox 2002; Omont et al. 2003; Priddey et al. 2003a,b; Willlot et al. 2003; Bertoldi et al. 2003), stacking the far-infrared to mm-wave non-detections yielded significant detections and demonstrated clearly that all quasars are on average ultraluminous starbursts (Serjeant & Hatziminaoglou 2009). If submm-selected galaxies are the violent starbursts that mark the sites of the progenitors of present-day giant ellipticals, then the presence and nature of AGN in submm-selected galaxies may track the feedback processes regulating the stellar mass assembly.
Are the bolometric luminosities of submm galaxies dominated by the release of gravitational binding energy around a central supermassive black hole, or are they dominated by the release of nuclear binding energy in starbursts? Similar questions were asked of local ultraluminous infrared galaxies in the 1990s (see e.g. Genzel & Cezarsky 2000); now the issues of feedback and the Magorrian relation add an additional perspective and motivation to the higher-redshift equivalent questions for submm-selected galaxies. Deep 2-10 keV imaging of submm-selected galaxies has found that around three-quarters show evidence of an active nucleus (Alexander et al. 2005), the majority of which are heavily obscured. Nevertheless, the X-ray to far-infrared luminosity ratios suggest that star formation rather than active nuclei typically dominate the bolometric output, assuming the underlying spectral energy distributions of the active nuclei resemble those of unobscured quasars. In order to eliminate the possibility that Compton-thick active nuclei in submm-selected galaxies have different underlying spectral energy distributions than the comparator populations, one should sample the spectra around the expected peak of the dust torus output, in the mid-infrared.
The advent of the Spitzer space telescope led to the
discovery of new dust-shrouded galaxy populations with starbursts
and/or active nuclei (e.g. Martínez-Sansigre et al. 2005; Dey et al. 2008a,b).
The mid-IR where the dust torus luminous output peaks is the ideal
place to test for AGN; we expect star-forming galaxies to have strong
PAH and silicate features, while AGN dust tori have much more
featureless spectra, with the possible sole exception of a ![]() m rest-frame silicate absorption trough. We found in Negrello et al. (2009)
that with sufficiently comprehensive broad-band photometry in the
mid-IR, starburst galaxies can have photometric redshift determinations
from the redshifting of PAH features. Furthermore, if the
bolometric AGN fraction is more than
m rest-frame silicate absorption trough. We found in Negrello et al. (2009)
that with sufficiently comprehensive broad-band photometry in the
mid-IR, starburst galaxies can have photometric redshift determinations
from the redshifting of PAH features. Furthermore, if the
bolometric AGN fraction is more than ![]() ,
the mid-IR SEDs are sufficiently close to featureless power-laws in
broad-band
photometry that photometric redshifts are impossible with mid-IR data
alone. However in these cases, the power-law SEDs are a useful
signature of bolometrically-significant AGN regardless of redshift.
In this case, the longer wavelength range obtained by combining
AKARI and Spitzer offers significant advantages over the insights available (albeit useful ones) from broad-band Spitzer photometry alone (e.g. Yun et al. 2008). A recent mid-infrared spectroscopic study of 13 submm-selected galaxies (Pope et al. 2008)
found only 2/13 with such power-law mid-infrared spectral energy
distributions; similarly, Menéndez-Delmestre et al. (2009)
found 4/23 submm-selected galaxies with continuum-dominated
mid-infrared spectra. Clearly there is a need for larger samples of
submm-selected galaxies with constrained AGN bolometric fractions.
,
the mid-IR SEDs are sufficiently close to featureless power-laws in
broad-band
photometry that photometric redshifts are impossible with mid-IR data
alone. However in these cases, the power-law SEDs are a useful
signature of bolometrically-significant AGN regardless of redshift.
In this case, the longer wavelength range obtained by combining
AKARI and Spitzer offers significant advantages over the insights available (albeit useful ones) from broad-band Spitzer photometry alone (e.g. Yun et al. 2008). A recent mid-infrared spectroscopic study of 13 submm-selected galaxies (Pope et al. 2008)
found only 2/13 with such power-law mid-infrared spectral energy
distributions; similarly, Menéndez-Delmestre et al. (2009)
found 4/23 submm-selected galaxies with continuum-dominated
mid-infrared spectra. Clearly there is a need for larger samples of
submm-selected galaxies with constrained AGN bolometric fractions.
Submm galaxies are also significant contributors to the submm-wave
extragalactic background light (EBL). The EBL can be expressed as an
integral over the comoving volume-averaged luminosity density (with an
additional (1+z) factor, e.g. Peacock 1999), so at any redshift z the galaxies that dominate the far-IR to mm-wave EBL are also the ones that dominate the star formation
rate at that z. But resolved submm galaxies only contribute a few tens of percent at most (Hughes et al. 1998)
to the EBL at those wavelengths. To constrain the populations that
contribute the rest one needs to use stacking analyses. Several
populations of galaxies have been shown to contribute significant
minorities of the submm EBL, such as EROs and HEROs,
BzK galaxies, (e.g. Coppin et al. 2004; Takagi et al. 2007; Greve et al. 2009), and Lyman-break galaxies (e.g. Peacock et al. 2000). In Serjeant et al. (2008) we found that the ![]() m-selected galaxies contribute the bulk of the
m-selected galaxies contribute the bulk of the ![]() m background, but that at
m background, but that at ![]() m there are unknown new populations that contribute the bulk of that background.
m there are unknown new populations that contribute the bulk of that background.
In this paper we will constrain the AGN bolometric fractions of a
sample of submm-selected galaxies in the Lockman hole east, taken from
the SCUBA half degree extragalactic survey (SHADES), using mid-infrared
photometry from the AKARI and Spitzer
space telescopes. We also constrain the contributions the mid-infrared
populations make to the submm and mm-wave extragalactic background
light using stacking analyses. SHADES Papers I and II
(Mortier et al. 2005; Coppin et al. 2006) present the SHADES survey design, data analysis and source counts. Paper III (Ivison et al. 2007) gave radio and mid-infrared counterparts of SHADES galaxies. SHADES Paper IV (Aretxaga et al. 2007)
presents photometric redshift constraints of submm galaxies derived
from far-infrared and radio data alone. SHADES Paper V (Takagi
et al. 2007) constrains the submm properties of near-infrared-selected galaxies. Paper VI (Coppin et al. 2007) gave ![]() m photometry for SHADES galaxies, while Papers VII and VIII (Dye et al. 2008a,b; and Clements et al. 2008,
respectively) analysed the multiwavelength spectral energy
distributions based on data available at the time. SHADES Paper IX
(Serjeant et al. 2008) made submm stacking analyses of ISO and Spitzer-selected galaxies, and in this paper we will extend this analysis to include the AKARI catalogues described in the Sect. 2. Austermann et al. (2010) extended the SHADES survey to mm-wavelengths and substantially increased the areal coverage. The comparison of the
m photometry for SHADES galaxies, while Papers VII and VIII (Dye et al. 2008a,b; and Clements et al. 2008,
respectively) analysed the multiwavelength spectral energy
distributions based on data available at the time. SHADES Paper IX
(Serjeant et al. 2008) made submm stacking analyses of ISO and Spitzer-selected galaxies, and in this paper we will extend this analysis to include the AKARI catalogues described in the Sect. 2. Austermann et al. (2010) extended the SHADES survey to mm-wavelengths and substantially increased the areal coverage. The comparison of the ![]() m and
m and ![]() m data, including a critical comparison of the
m data, including a critical comparison of the ![]() m
data from different instruments and a systematic search for populations
of submm-wave drop-outs, will be given in Negrello et al. (2009, in preparation). In this paper we will use the AzTEC
m
data from different instruments and a systematic search for populations
of submm-wave drop-outs, will be given in Negrello et al. (2009, in preparation). In this paper we will use the AzTEC ![]() m data, rather than the
m data, rather than the ![]() m data from Coppin et al. (2008) which has not been corrected for Eddington bias (Eddington 1913). We will also use the multi-wavelength data from SHADES Papers III, VI, VII and VIII (Ivison et al. 2007; Coppin et al. 2007; Dye et al. 2008a,b; and Clements et al. 2008, respectively) who presented spectral energy distribution (SED) fits of SHADES galaxies.
m data from Coppin et al. (2008) which has not been corrected for Eddington bias (Eddington 1913). We will also use the multi-wavelength data from SHADES Papers III, VI, VII and VIII (Ivison et al. 2007; Coppin et al. 2007; Dye et al. 2008a,b; and Clements et al. 2008, respectively) who presented spectral energy distribution (SED) fits of SHADES galaxies.
2 Data acquisition
2.1 Submm and mm-wave observations
The SHADES was the largest project on the James Clerk Maxwell Telescope
from 2003-2005. During the instrument lifetime of SCUBA the survey
mapped a total of approximately a quarter of a square degree at ![]() m to a typical
m to a typical ![]() depth of 8 mJy, in the Lockman hole east and the Subaru-XMM deep field (Mortier et al. 2005). The originally-planned areal coverage and more was completed by the SHADES team with the AzTEC instrument at
depth of 8 mJy, in the Lockman hole east and the Subaru-XMM deep field (Mortier et al. 2005). The originally-planned areal coverage and more was completed by the SHADES team with the AzTEC instrument at ![]() m (Austermann et al. 2010) to typical
m (Austermann et al. 2010) to typical ![]() depths
in the Lockman hole east of 3.1-4.6 mJy. Both SHADES fields
benefit from enormous multi-wavelength wide-field campaigns, and the
Lockman hole east in particular has some of the deepest Spitzer
Space Telescope mid-infrared mapping of any contiguous field over
hundreds of square arcminutes. More details on the SHADES project,
including the survey goals, methodology and submm data analysis,
can be found in SHADES Papers I and II (Mortier et al. 2005; Coppin et al. 2006). Details on the SHADES mm-wave data analysis are given in Austermann et al. (2010). We use the Austermann et al. (2010) mm-wave measurements in preference to Coppin et al. (2008), since the former but not the latter have been corrected for Eddington bias.
depths
in the Lockman hole east of 3.1-4.6 mJy. Both SHADES fields
benefit from enormous multi-wavelength wide-field campaigns, and the
Lockman hole east in particular has some of the deepest Spitzer
Space Telescope mid-infrared mapping of any contiguous field over
hundreds of square arcminutes. More details on the SHADES project,
including the survey goals, methodology and submm data analysis,
can be found in SHADES Papers I and II (Mortier et al. 2005; Coppin et al. 2006). Details on the SHADES mm-wave data analysis are given in Austermann et al. (2010). We use the Austermann et al. (2010) mm-wave measurements in preference to Coppin et al. (2008), since the former but not the latter have been corrected for Eddington bias.
2.2 Mid-infrared observations
The Lockman hole east was targetted by the Spitzer space telescope in guaranteed time. The field was mapped with the IRAC and MIPS instruments (Fazio et al. 2004; Rieke et al. 2004) and sources extracted to depths of ![]() Jy at
Jy at ![]() m (
m (![]() ),
), ![]() Jy at
Jy at ![]() m (
m (![]() ),
), ![]() Jy at
Jy at ![]() m (
m (![]() ),
), ![]() Jy at
Jy at ![]() m (
m (![]() )
and
)
and ![]() Jy at
Jy at ![]() m (
m (![]() ). For more details of this catalogue, see Serjeant et al. (2008, and references therein). The Lockman hole east was also mapped at
). For more details of this catalogue, see Serjeant et al. (2008, and references therein). The Lockman hole east was also mapped at ![]() m with the CAM instrument on the ISO. More details of the ISO survey can be found in Elbaz et al. (1999) and Rodighiero et al. (2004).
m with the CAM instrument on the ISO. More details of the ISO survey can be found in Elbaz et al. (1999) and Rodighiero et al. (2004).
The Lockman hole east was also the subject of a 10' ![]() 30' survey in the L15
30' survey in the L15 ![]() m filter by infrared camera (IRC) of AKARI, as part of the FU-HYU mission programme (Pearson et al. 2010), to a typical
m filter by infrared camera (IRC) of AKARI, as part of the FU-HYU mission programme (Pearson et al. 2010), to a typical ![]() noise level of
noise level of ![]() Jy. This programme targetted well-studied Spitzer fields to capitalize on the comprehensive multi-wavelength data sets available in these fields. Some FU-HYU observations in the GOODS-N field have been presented in Negrello et al. (2009).
Jy. This programme targetted well-studied Spitzer fields to capitalize on the comprehensive multi-wavelength data sets available in these fields. Some FU-HYU observations in the GOODS-N field have been presented in Negrello et al. (2009).
A pipeline analysis of the IRC is available in the Image Reduction and Analysis Facility (IRAF). Despite being an excellent general-purpose analysis, we found that the processing was not optimal for our purposes of minimum-variance point source extraction. The standard pipeline locates and flags bad pixels, then interpolates the image to correct for field distortions. However this interpolation stage creates Moiré effects, correlates the noise between pixels and in some cases spreads bad individual pixel readouts over several pixels in the interpolated image. Furthermore, some of the AKARI observations had been mistakenly taken without the requested dithering intended to remove bad pixels, so our only option was to use the spacecraft jitter, which necessarily requires a bespoke analysis.
We had previously developed mapping and minimum-variance point source extraction tools in the Interactive Data Language (IDL) for the SHADES survey, so we opted to use a similar approach here. We stopped the IRC pipeline after the flat fielding, imported the data into IDL, then determined an approximate pointing solution using catalogues of ISO and Spitzer sources in the field. The relative jitter was found by measuring centroids of bright sources in each data frame, and hence we could determine a World Coordinate System solution for each frame. Bad pixels were identified and masked using the same pixel histogram fitting procedure employed in the SCUBA Hubble deep field north and SHADES observations (Serjeant et al. 2003a; Mortier et al. 2005). Several frames were affected by Earthshine, so we performed a polynomial fit to each row, then each column, then identified and corrected a small number of pixels which reported consistently low counts regardless of target. This latter effect may indicate the need to improve the flat field determinations, but the offsets induced by these corrections are much smaller than our photometric errors. Following the best practice in SCUBA observations we determined the noise in each detector pixel using Gaussian fits to readout histograms. We adopted the field distortion corrections as coded in the IRAF IRC pipeline, but from a comparison of our initial AKARI catalogues against Spitzer observations we found evidence for further field distortions. We fit to these using a second-order polynomial and incorporated the correction into our total field distortion solution.
To mosaic the individual frames onto a master image we used the ``zerofootprint'' drizzling technique developed originally for SCUBA (Serjeant et al. 2003a): detector pixels are mapped onto much finer sky pixels, accounting for field distortion and jitter, with the flux from a detector pixel deposited in a single sky pixel. Where a sky pixel has multiple observations, fluxes are combined using noise-weighted coadds. The final coadded map represents a detector pixel's view of the sky, in the sense that at every point it reports the noise-weighted mean flux of all detector pixels centred exactly on that point. Notwithstanding cross-talk between detector pixels (which we neglect), the final coadded map also has statistically independent pixels, i.e. without covariances.
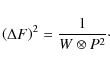
We performed a further deglitching stage on the coadded map. The minimum-variance estimator for
the point source flux F
at any point in the map can be expressed a noise-weighted point spread
function convolution, as used in submm surveys (Serjeant
et al. 2003a; Mortier et al. 2005):

where I is the coadded image, W is the weight image (the reciprocal of the noise squared), and P is the point spread function. Propagating errors on Eq. (1) yields an expression for
For the point spread function we assumed a Gaussian with a full width half maximum of 5.47''.
Our point source detection map is the
![]() image, in which we found objects using a connected pixels algorithm.
Objects were identified as discrete regions with map values greater
than a given threshold. We used a series of thresholds of
image, in which we found objects using a connected pixels algorithm.
Objects were identified as discrete regions with map values greater
than a given threshold. We used a series of thresholds of
![]() in steps of
in steps of ![]() ,
because objects which are blended at a low threshold may be distinct
objects at a brighter threshold (e.g. Mortier et al. 2005),
yielding a catalogue of 622 distinct objects. The
IRC pipeline flux calibration is given only for photometry taken
with the IRC pipeline outputs, which is necessarily systematically
different to our pipeline outputs, so we cross-matched our
catalogue with the previous ISO
,
because objects which are blended at a low threshold may be distinct
objects at a brighter threshold (e.g. Mortier et al. 2005),
yielding a catalogue of 622 distinct objects. The
IRC pipeline flux calibration is given only for photometry taken
with the IRC pipeline outputs, which is necessarily systematically
different to our pipeline outputs, so we cross-matched our
catalogue with the previous ISO ![]() m sources from Rodighiero et al. (2004) and based our calibration on the cross-matchings so the average flux ratio is unity, shown in Fig. 1. The final AKARI
m sources from Rodighiero et al. (2004) and based our calibration on the cross-matchings so the average flux ratio is unity, shown in Fig. 1. The final AKARI ![]() m sources are shown in Figs. 2 and 3.
m sources are shown in Figs. 2 and 3.
![\begin{figure}
\par\includegraphics[width=6.5cm,clip]{iso_akari_flux_comparison.ps}
\end{figure}](/articles/aa/full_html/2010/06/aa13483-09/img46.png)
|
Figure 1:
Comparison of |
| Open with DEXTER | |
![\begin{figure}
\par\includegraphics[width=7.8cm,clip]{lockman_850um_plus_iso_plus_akari.ps}
\vspace*{4mm}
\end{figure}](/articles/aa/full_html/2010/06/aa13483-09/img47.png)
|
Figure 2:
The SHADES SCUBA |
| Open with DEXTER | |
![\begin{figure}
\par\includegraphics[width=6.3cm,clip]{lockman_1100um_plus_iso_plus_akari.ps}
\end{figure}](/articles/aa/full_html/2010/06/aa13483-09/img48.png)
|
Figure 3:
The SHADES AzTEC |
| Open with DEXTER | |
3 Methods
For the stacking analyses of submm galaxies we adopted the same methodologies of Serjeant et al. (2008). In brief, we first subtract the catalogued objects from the ![]() m and
m and ![]() m maps (there are no secure
m maps (there are no secure ![]() m
point source detections). We used Gaussian point spread functions for
the submm data and the point spread function in Austermann
et al. (2010) for the
AzTEC data. We refer to these maps as the residual maps. The
comparison of the histograms of mm-wave fluxes in the map and at the
positions of
m
point source detections). We used Gaussian point spread functions for
the submm data and the point spread function in Austermann
et al. (2010) for the
AzTEC data. We refer to these maps as the residual maps. The
comparison of the histograms of mm-wave fluxes in the map and at the
positions of ![]() m-selected galaxies yielded a possibly strong signal (
m-selected galaxies yielded a possibly strong signal (
![]() )
but which appeared to be dominated by a non-Gaussian shape to the latter histogram (Fig. 4).
This could be suggestive of weak but coherent features in parts of the
map, but which would necessarily have to have absolute values less than
)
but which appeared to be dominated by a non-Gaussian shape to the latter histogram (Fig. 4).
This could be suggestive of weak but coherent features in parts of the
map, but which would necessarily have to have absolute values less than
![]() per beam,
making investigation difficult. Alternatively, this could be a
consequence of having a relatively small number of AzTEC beams in
the
per beam,
making investigation difficult. Alternatively, this could be a
consequence of having a relatively small number of AzTEC beams in
the ![]() m
survey coverage. Without passing judgement on these issues, we have
opted to take a very conservative approach and adopted an additional
beamswitching sky subtraction, by subtracting from the
AzTEC residual map the same map offset by 100 pixels East,
or 300''. We also derived a noise map for this beamswitched
residual map by measuring the standard deviation in
a 45'' radius circular region at every point in the map.
m
survey coverage. Without passing judgement on these issues, we have
opted to take a very conservative approach and adopted an additional
beamswitching sky subtraction, by subtracting from the
AzTEC residual map the same map offset by 100 pixels East,
or 300''. We also derived a noise map for this beamswitched
residual map by measuring the standard deviation in
a 45'' radius circular region at every point in the map.
![\begin{figure}
\par\hspace*{3.8mm}\includegraphics[width=6.4cm,clip]{450_histo.p...
...
\includegraphics[width=6.3cm,clip]{1100_histo_not_beamswitched.ps}
\end{figure}](/articles/aa/full_html/2010/06/aa13483-09/img50.png)
|
Figure 4:
Histograms of the submm and mm-wave fluxes in the regions with |
| Open with DEXTER | |
There is some disagreement in the literature over the best practice in stacking methodology Some (such as Peacock et al. 2000; Serjeant et al. 2004, 2008) have opted to subtract known point sources, while others (such as Wang et al. 2007; Scott et al. 2008; Marsden et al. 2009) opt to use the unsubtracted map. In essence, it depends on what one wants to measure. If one requires the total intensity from all galaxies, one should not subtract any flux (or the subtracted population should be added afterwards). If however one requires the mean flux from a particular population, as distinct from all galaxies as a whole, then one needs to clean the map to avoid any biases in the mean.
In Serjeant et al. (2008) we found that the submm-selected galaxies had very different mid-IR/submm flux ratios to the galaxies selected at ![]() m.
This could be due to bimodality, i.e. two populations, or we could
be sampling two ends of a continuum; it is difficult to
distinguish these possibilities from stacks alone. The possibility that
a few
m.
This could be due to bimodality, i.e. two populations, or we could
be sampling two ends of a continuum; it is difficult to
distinguish these possibilities from stacks alone. The possibility that
a few ![]() m-selected
galaxies are (relative to the rest) pathological would suggest the use
of point-source-subtracted maps, which is the approach we have adopted.
m-selected
galaxies are (relative to the rest) pathological would suggest the use
of point-source-subtracted maps, which is the approach we have adopted.
We take unweighted mean averages of the submm fluxes in the residual
maps (or for the AzTEC observations, mm-wave fluxes) at the
positions of mid-infrared-selected galaxies. By the central limit
theorem the unweighted mean flux is Gaussian distributed with a
dispersion of
![]() where
where ![]() is the standard deviation of the sample of fluxes and N
is the number of fluxes being averaged. We also use Kolmogorov-Smirnoff
tests to compare the histogram of fluxes at the positions of
mid-infrared-selected galaxies with the histogram of the submm/mm-wave
fluxes in the submm/mm-wave map as a whole, excluding regions with no
mid-infrared data. This latter
test inherently incorporates a control comparison. We include the
is the standard deviation of the sample of fluxes and N
is the number of fluxes being averaged. We also use Kolmogorov-Smirnoff
tests to compare the histogram of fluxes at the positions of
mid-infrared-selected galaxies with the histogram of the submm/mm-wave
fluxes in the submm/mm-wave map as a whole, excluding regions with no
mid-infrared data. This latter
test inherently incorporates a control comparison. We include the ![]() m survey from ISO (Elbaz et al. 1999; Rodighiero et al. 2004);
although this survey is not as deep as our AKARI mapping,
it increases the areal coverage of the stacking analysis
(Figs. 2 and 3) and therefore also the number of submm and mm-wave beams contributing, which improve the stacked signal (Serjeant et al. 2008).
Unweighted means give cosmetically poor results for stacked postage
stamps due to edge effects, so we used noise-weighted means for
the purposes of making stacked postage stamps only.
m survey from ISO (Elbaz et al. 1999; Rodighiero et al. 2004);
although this survey is not as deep as our AKARI mapping,
it increases the areal coverage of the stacking analysis
(Figs. 2 and 3) and therefore also the number of submm and mm-wave beams contributing, which improve the stacked signal (Serjeant et al. 2008).
Unweighted means give cosmetically poor results for stacked postage
stamps due to edge effects, so we used noise-weighted means for
the purposes of making stacked postage stamps only.
For the characterisation of the spectral energy distributions of
submm-selected galaxies, we assume a minimum photometric error of ten
percent. We use an ensemble of starburst model outputs from Takagi
et al. (2003, 2004) and an ensemble of dust torus model outputs from Efstathiou & Rowan-Robinson (1995), following the methodology of Negrello et al. (2009).
We make linear superimpositions of these model spectral energy
distributions neglecting the small effects of energy transfer between
the dust torus and the starburst dust components. The key physical
parameters in these models are: the torus opening angle ![]() (which we set to
(which we set to ![]() ), the ratio of outer and inner torus radii (which we set to 20), and viewing angle
), the ratio of outer and inner torus radii (which we set to 20), and viewing angle
![]() ;
starburst compactness parameter
;
starburst compactness parameter ![]() ,
age T
and dust composition (Milky Way, SMC or LMC). A star
formation timescale of 100 Myr was adopted for the Takagi
et al. models. A wider parameter space of AGN models is
not justified by the contraints available from our data. We leave the
redshift as a further free parameter even where spectroscopic redshifts
have been published, to avoid dependence on the often-uncertain
discussion of identifications. The total number of fitted parameters
(including normalisation, but not counting dust composition) is three,
and two more with the addition of AGN, plus a further fitting
parameter for redshift.
,
age T
and dust composition (Milky Way, SMC or LMC). A star
formation timescale of 100 Myr was adopted for the Takagi
et al. models. A wider parameter space of AGN models is
not justified by the contraints available from our data. We leave the
redshift as a further free parameter even where spectroscopic redshifts
have been published, to avoid dependence on the often-uncertain
discussion of identifications. The total number of fitted parameters
(including normalisation, but not counting dust composition) is three,
and two more with the addition of AGN, plus a further fitting
parameter for redshift.
![\begin{figure}
\par\includegraphics[width=13.2cm,clip]{akari_stack_postages.eps}
\end{figure}](/articles/aa/full_html/2010/06/aa13483-09/img57.png)
|
Figure 5:
Stacked mm-wave and submm signal-to-noise postage stamps of |
| Open with DEXTER | |
4 Results
4.1 Stacking analysis results
Figure 5 shows noise-weighted stacked ![]() m,
m, ![]() m and
m and ![]() m postage stamps of the AKARI and ISO
m postage stamps of the AKARI and ISO ![]() m-selected galaxies. This is a significant improvement over the detections in Serjeant et al. (2008),
and for the first time extends the stacked signal of
mid-infrared-selected galaxies to mm-wavelengths. The unweighted mean
submm-wave and mm-wave fluxes of the
m-selected galaxies. This is a significant improvement over the detections in Serjeant et al. (2008),
and for the first time extends the stacked signal of
mid-infrared-selected galaxies to mm-wavelengths. The unweighted mean
submm-wave and mm-wave fluxes of the ![]() m-selected galaxies are
m-selected galaxies are
![]() mJy,
mJy,
![]() mJy and
mJy and
![]() mJy. The
mJy. The
![]() m flux ratio is consistent with a grey-body index of
m flux ratio is consistent with a grey-body index of ![]() on the Rayleigh-Jeans tail, though the
on the Rayleigh-Jeans tail, though the ![]() m stacked flux is marginally discrepant. In the source count model of Pearson (2005) the predicted median redshift of our sample is
m stacked flux is marginally discrepant. In the source count model of Pearson (2005) the predicted median redshift of our sample is ![]() ,
with of the order
,
with of the order ![]() at z>2.
at z>2.
Figure 4 shows the histograms of submm and mm-wave fluxes at the positions of the ![]() m-selected galaxies, compared to the histograms of the maps as a whole were
m-selected galaxies, compared to the histograms of the maps as a whole were ![]() m data is available. The probabilities that the
m data is available. The probabilities that the ![]() m-selected galaxies are drawn randomly from the submm maps are
m-selected galaxies are drawn randomly from the submm maps are
![]() at
at ![]() m, 0.046 at
m, 0.046 at ![]() m and 0.016 at
m and 0.016 at ![]() m,
i.e. a significant stacking detection. These probabilities in
all three cases are due to slight asymmetries or positive shifts in the
submm/mm-wave flux distributions.
m,
i.e. a significant stacking detection. These probabilities in
all three cases are due to slight asymmetries or positive shifts in the
submm/mm-wave flux distributions.
4.2 SED fitting results
We found centroids in the ![]() m AKARI point source detection map at the positions of SHADES Lockman galaxies reported in Dye et al. (2008a,b). Where no centroid solution could be obtained, we took the value of the point source flux F and its associated error
m AKARI point source detection map at the positions of SHADES Lockman galaxies reported in Dye et al. (2008a,b). Where no centroid solution could be obtained, we took the value of the point source flux F and its associated error ![]() at the SHADES counterpart position (Eqs. (1) and (2)). Tables 1 and 2 give a compilation of available photometry of the SHADES galaxies from Dye et al. (2008a,b), Ivison et al. (2007) and Coppin et al. (2007), and incorporating our new
at the SHADES counterpart position (Eqs. (1) and (2)). Tables 1 and 2 give a compilation of available photometry of the SHADES galaxies from Dye et al. (2008a,b), Ivison et al. (2007) and Coppin et al. (2007), and incorporating our new ![]() m photometry.
m photometry.
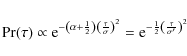
Following Negrello et al. (2009), we found the minimum ![]() solution
for the available photometry assuming a mix of starburst and active
nucleus, allowing the relative bolometric fractions of the
components (
solution
for the available photometry assuming a mix of starburst and active
nucleus, allowing the relative bolometric fractions of the
components (
![]() and
and
![]() respectively) to vary. Table 3
gives the best-fit parameters of these two-component fits, excluding
those for which no fit could be made, but including for completeness
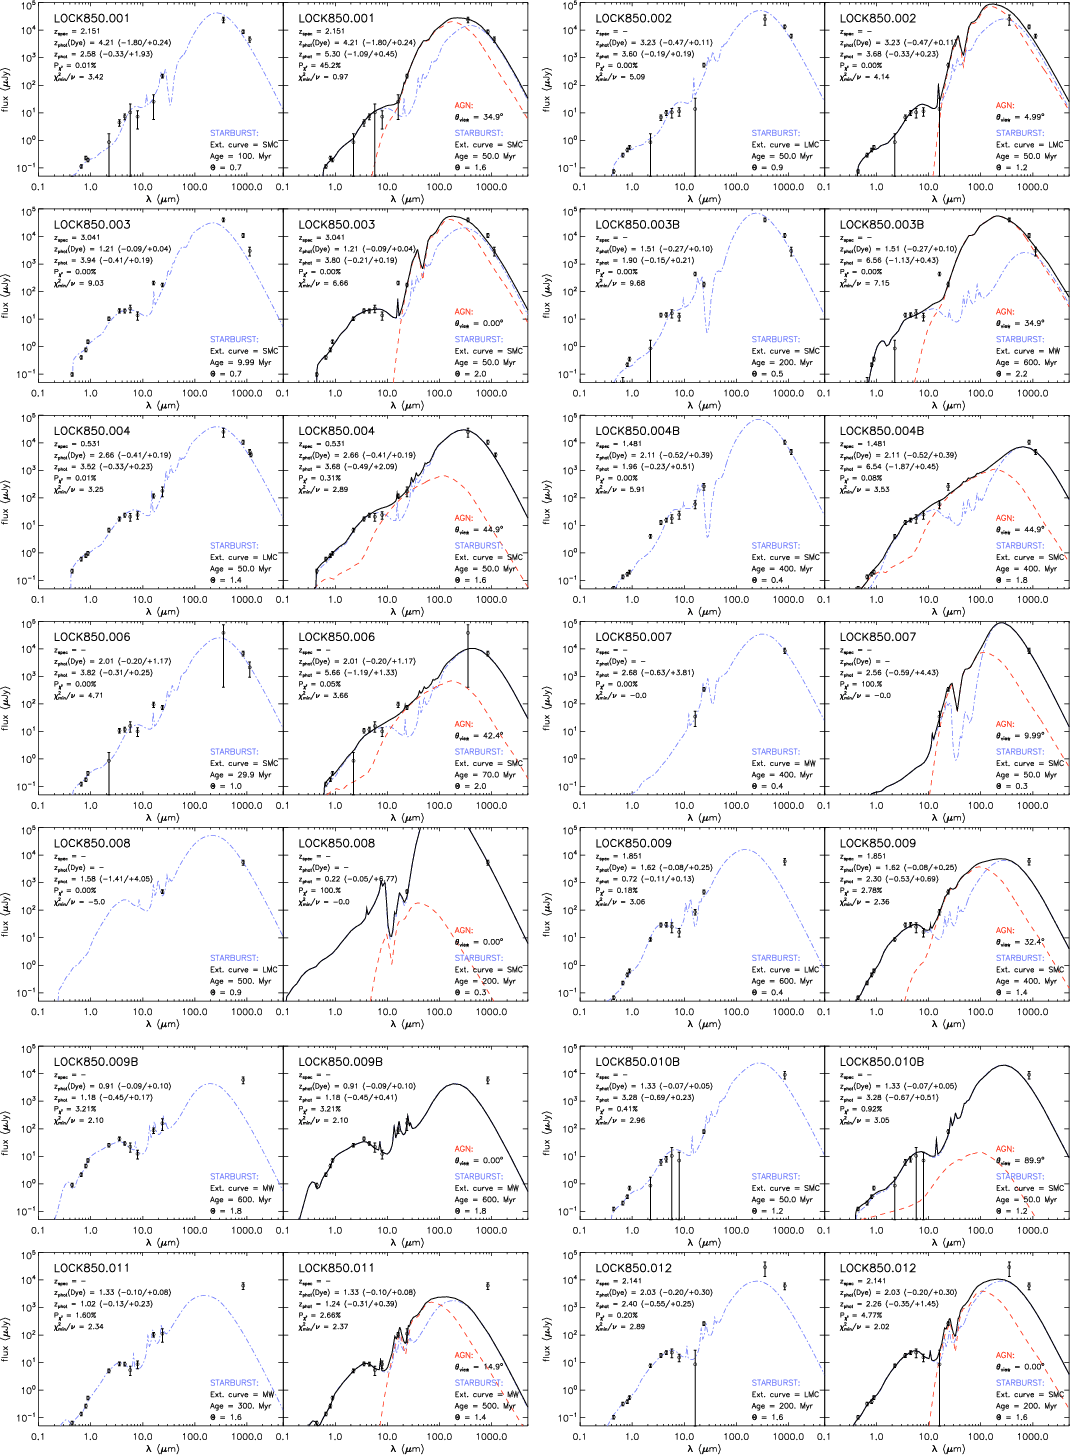
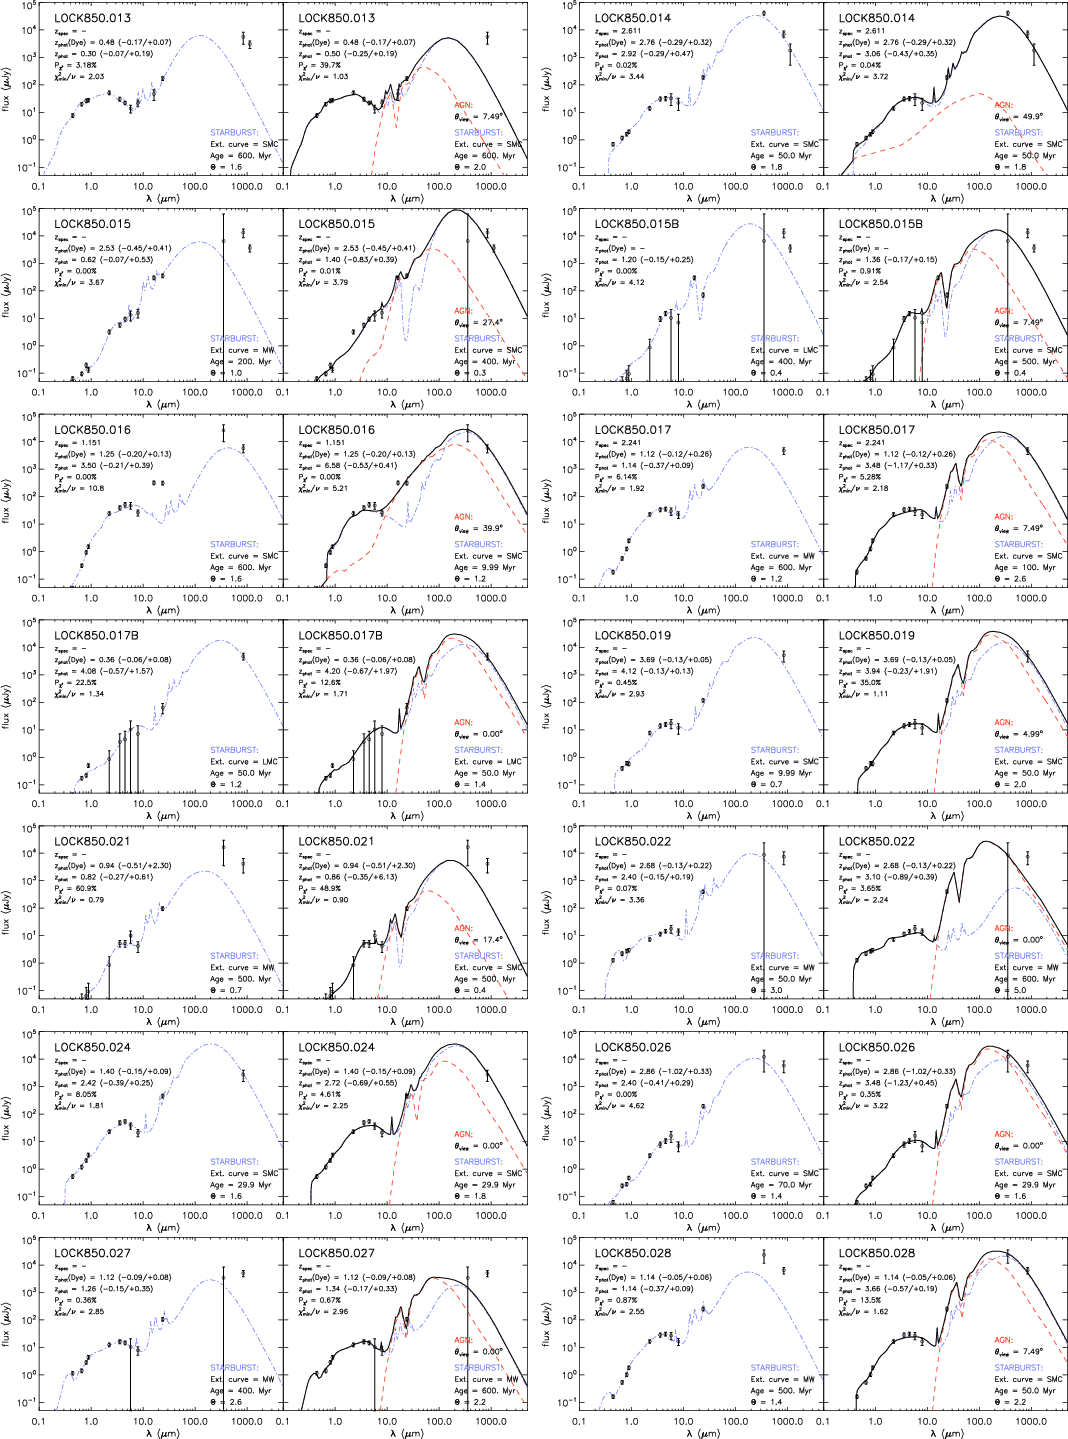
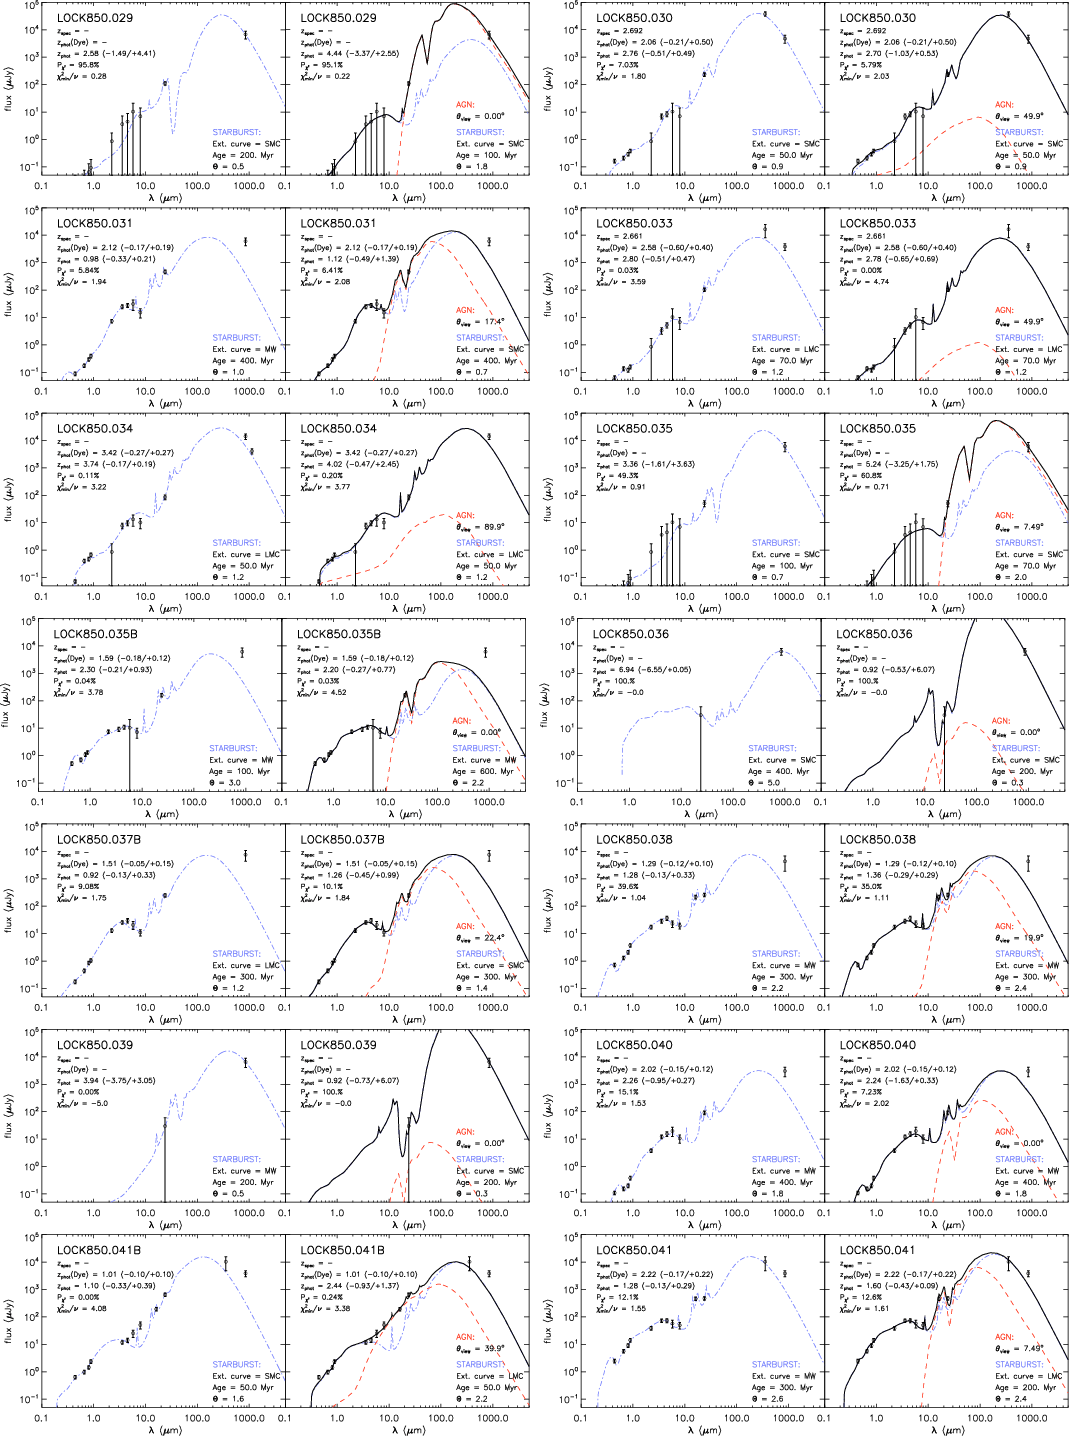
those for which the fitting is under-constrained. Figures 6 to 10
show the best-fit SEDs,
as well as the best-fit starburst-only model for each
SHADES galaxy. In many cases, adding the active nucleus is a
requirement for reproducing the mid-infrared data. In several
other cases however, no acceptable
respectively) to vary. Table 3
gives the best-fit parameters of these two-component fits, excluding
those for which no fit could be made, but including for completeness
those for which the fitting is under-constrained. Figures 6 to 10
show the best-fit SEDs,
as well as the best-fit starburst-only model for each
SHADES galaxy. In many cases, adding the active nucleus is a
requirement for reproducing the mid-infrared data. In several
other cases however, no acceptable ![]() could be found, because the submm and mm-wave data exceeded the range
given by the models. In these cases, a further cold cirrus
component may contribute significantly to the longest wavelengths.
could be found, because the submm and mm-wave data exceeded the range
given by the models. In these cases, a further cold cirrus
component may contribute significantly to the longest wavelengths.
Several galaxies are worth discussing in detail. The galaxies with an excess at submm/mm-wavelengths
are LOCK850.009, 011, 013, 031, 037B, 040, 043/043B, 053, 070, and 071. In addition, Lock850.076
has peculiar submm/mm-wave colours, perhaps due to incorrect flux deboosting in either the submm or mm-wave data. The ![]() m
flux in Lock850.003B may be contaminated by a nearby object. The SED
fits in some cases suggest particular identifications,
e.g. LOCK850.010B is preferred over LOCK850.010 (not plotted
since no acceptable fit could be made to the data), as is
LOCK850.015 over LOCK850.015B, LOCK850.035 over LOCK850.035B, and
LOCK850.073 over LOCK850.073B. The identifications for LOCK850.004,
LOCK850.009, LOCK850.043 and LOCK850.77 remain ambiguous.
m
flux in Lock850.003B may be contaminated by a nearby object. The SED
fits in some cases suggest particular identifications,
e.g. LOCK850.010B is preferred over LOCK850.010 (not plotted
since no acceptable fit could be made to the data), as is
LOCK850.015 over LOCK850.015B, LOCK850.035 over LOCK850.035B, and
LOCK850.073 over LOCK850.073B. The identifications for LOCK850.004,
LOCK850.009, LOCK850.043 and LOCK850.77 remain ambiguous.
Table 1: Optical and near-infrared AB magnitude photometry of SHADES galaxies in the Lockman hole east.
Table 2: Mid-infrared to radio photometry of SHADES galaxies in the Lockman hole east.
Table 3: Results of the SED fitting, with the parameters defined in the text.
5 Discussion and conclusions
Following the methodology of Serjeant et al. (2008),
we can estimate the contribution that clustering of the mid-infrared
population makes to the submm and mm-wave stacks, by integrating the
correlation function ![]() with respect to angle
with respect to angle ![]() :
:
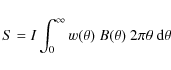
where B is the submm or mm-wave beam and I is the total background intensity. We argued in Serjeant et al. (2008) that the clustered contributions at
The observed ![]() m stacked signal of
m stacked signal of
![]() mJy at a
mJy at a ![]() m source combined with our observed surface density of 4950
m source combined with our observed surface density of 4950 ![]() 170
170 ![]() m galaxies per square degree (Poisson errors) corresponds to a
m galaxies per square degree (Poisson errors) corresponds to a ![]() m background contribution of
m background contribution of
![]() Jy deg-2. The estimated total background at
Jy deg-2. The estimated total background at ![]() m
is around 18 Jy deg-2 (e.g. Gispert et al. 2000). Given the contribution from clustering, we can set an upper limit of
m
is around 18 Jy deg-2 (e.g. Gispert et al. 2000). Given the contribution from clustering, we can set an upper limit of ![]() to the contributions from these
to the contributions from these ![]() m-selected galaxies to the
m-selected galaxies to the ![]() m extragalactic background light. Our
m extragalactic background light. Our ![]() m-selected sample is not as deep as the
m-selected sample is not as deep as the ![]() m-selected population used by Serjeant et al. (2008), but following the same methodology as we have applied at
m-selected population used by Serjeant et al. (2008), but following the same methodology as we have applied at ![]() m, we estimate background contributions of
m, we estimate background contributions of
![]() Jy deg-2 at
Jy deg-2 at ![]() m and 18.3
m and 18.3 ![]() 5.4 Jy deg-2 and
5.4 Jy deg-2 and ![]() m,
corresponding to
m,
corresponding to
![]() of the
of the ![]() m background and
m background and
![]() of the
of the ![]() m background. This is consistent with our results in Serjeant et al. (2008),
implying the populations which dominate the ultra-deep
confusion-limited maps expected with the SCUBA-2 instrument will
overlap substantially with populations already detected with AKARI and Spitzer.
m background. This is consistent with our results in Serjeant et al. (2008),
implying the populations which dominate the ultra-deep
confusion-limited maps expected with the SCUBA-2 instrument will
overlap substantially with populations already detected with AKARI and Spitzer.
The small background contribution at ![]() m is in stark contrast to our earlier results for the submm backgrounds (Serjeant et al. 2008) in which we found the majority of the
m is in stark contrast to our earlier results for the submm backgrounds (Serjeant et al. 2008) in which we found the majority of the ![]() m background is attributable to the
m background is attributable to the ![]() m-selected
population, and to claims from the Balloon-Borne Large Area Submm
Telescope (BLAST) data that the mid-infrared population is responsible
for all the
m-selected
population, and to claims from the Balloon-Borne Large Area Submm
Telescope (BLAST) data that the mid-infrared population is responsible
for all the
![]() m background (Devlin et al. 2009; Marsden et al. 2009). Taken in combination with the results in Serjeant et al. (2008), our results suggest strongly that other populations undetected by AKARI or Spitzer must dominate the
m background (Devlin et al. 2009; Marsden et al. 2009). Taken in combination with the results in Serjeant et al. (2008), our results suggest strongly that other populations undetected by AKARI or Spitzer must dominate the ![]() m and mm-wave background.
m and mm-wave background.
|
Figure 6: SED fits to submm-selected SHADES galaxies in the Lockman hole east, using models from Takagi et al. (2003, 2004) and Efstathiou & Rowan-Robinson (1995). |
| Open with DEXTER | |
|
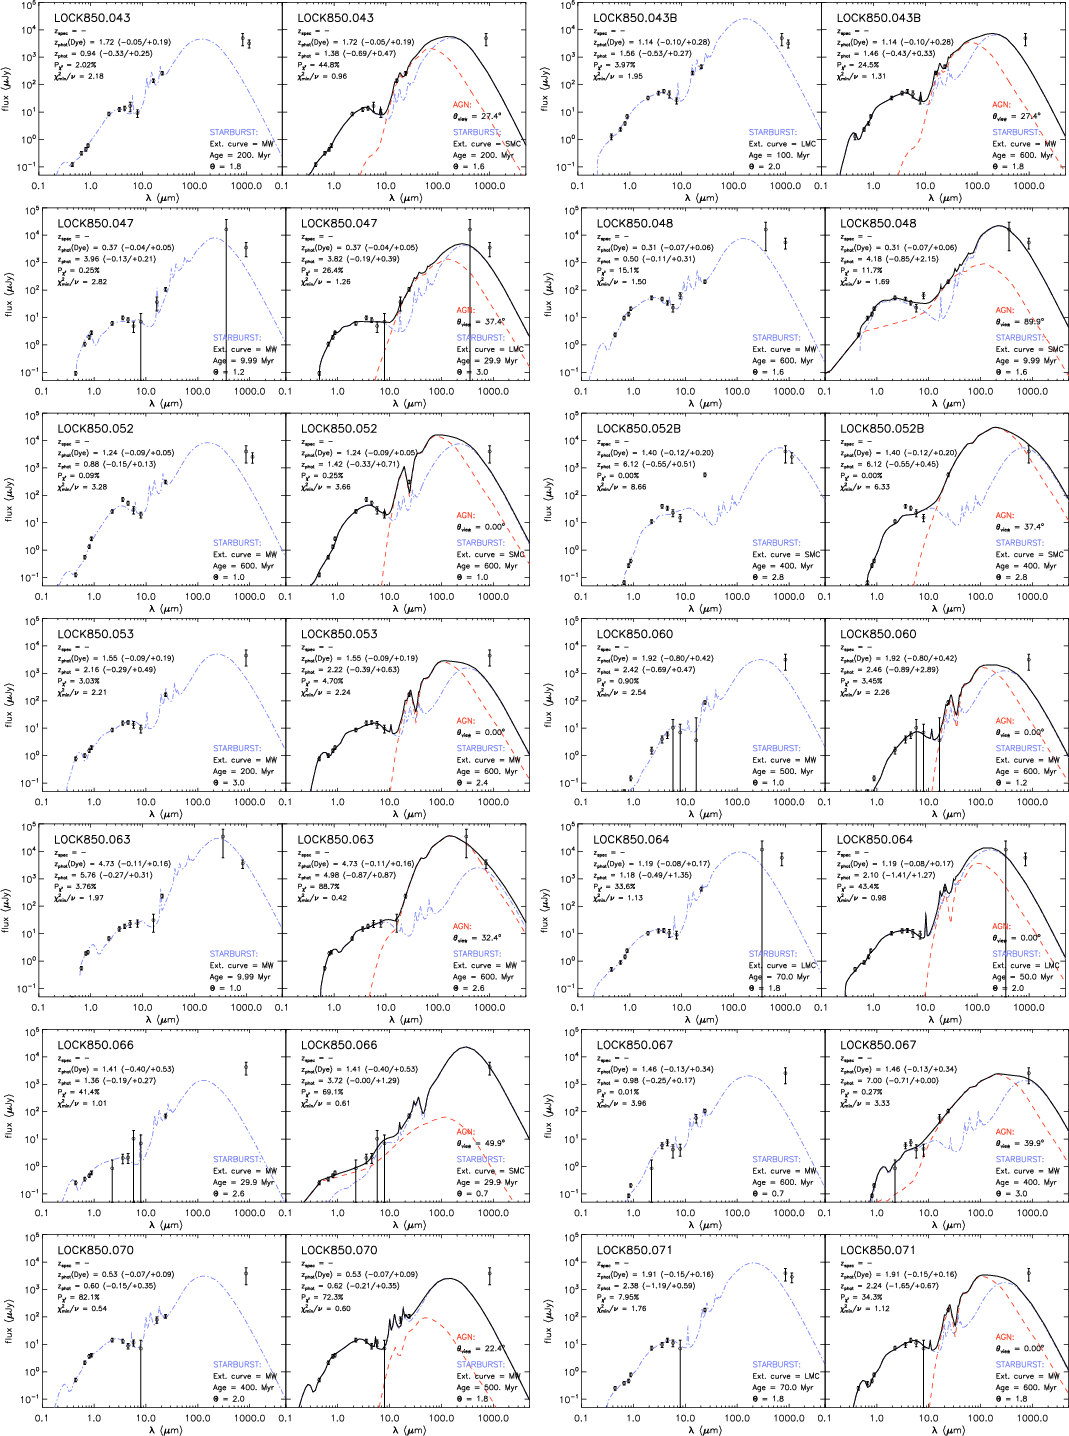
Figure 7: SED fits to submm-selected SHADES galaxies in the Lockman hole east, using models from Takagi et al. (2003, 2004) and Efstathiou & Rowan-Robinson (1995). |
| Open with DEXTER | |
|
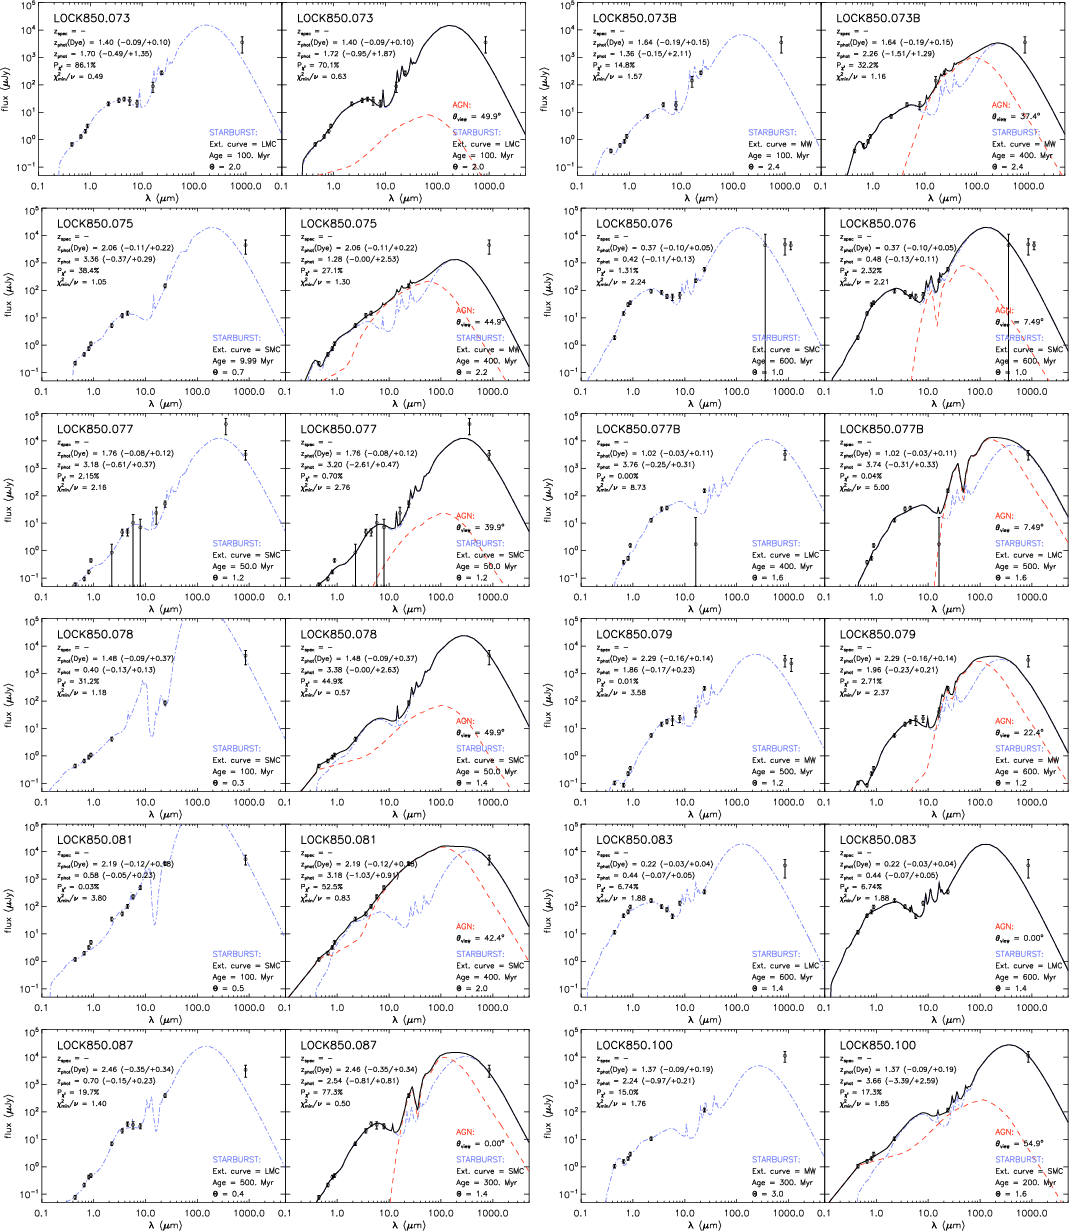
Figure 8: SED fits to submm-selected SHADES galaxies in the Lockman hole east, using models from Takagi et al. (2003, 2004) and Efstathiou & Rowan-Robinson (1995). |
| Open with DEXTER | |
|
Figure 9: SED fits to submm-selected SHADES galaxies in the Lockman hole east, using models from Takagi et al. (2003, 2004) and Efstathiou & Rowan-Robinson (1995). |
| Open with DEXTER | |
|
Figure 10: SED fits to submm-selected SHADES galaxies in the Lockman hole east, using models from Takagi et al. (2003, 2004) and Efstathiou & Rowan-Robinson (1995). |
| Open with DEXTER | |
Not all our sample has sufficient mid-infrared data to distinguish starburst and AGN mid-infrared contributions, but Table 3
gives the results where available. In total 41 SHADES galaxies
have sufficient data for this constraint, not counting multiple
identifications. Of these, we find that our models cannot reproduce the
far-infrared luminosity in 10 unambiguous identifications
(LOCK850.013, 031, 037B, 038, 040, 053, 060, 070, 071, 075) and in two
further ambiguous identifications (LOCK850.009, 043). One possibility
is that the spectral energy distributions have an additional cool
cirrus component not accounted for in the models, which would further
reduce an AGN bolometric contribution. Another possibility is that the
identifications are wrong, and the submm emission comes from objects
with larger far-infrared to optical/near-infrared luminosity ratios. Of
the remaining (apparently) unambiguously-identified objects, 12 have
AGN fractions >0.3 (LOCK850.001, 003, 016, 022, 027, 028, 041, 047,
052, 067, 079, 087), while 14 have starburst fractions >0.7
(LOCK850.010B, 014, 015, 024, 030, 033, 034, 048, 066, 073, 076, 078,
083, 100). For LOCK850.004 and LOCK850.077 the two candidate
identifications result in one starburst (
![]() )
and one AGN (
)
and one AGN (
![]() )
interpretation for each galaxy. Finally two further cases merit
individual attention. In LOCK850.060, the addition of the AGN component
created a worse fit in the submm; we opt to attribute greater weight to
this long-wavelength data point and include this galaxy among the
starburst. In LOCK850.076 there is additional mm-wave flux, which we
attribute to errors in the deboosting the submm or mm-wave data in this
individual object; this galaxy is also counted among the starbursts.
)
interpretation for each galaxy. Finally two further cases merit
individual attention. In LOCK850.060, the addition of the AGN component
created a worse fit in the submm; we opt to attribute greater weight to
this long-wavelength data point and include this galaxy among the
starburst. In LOCK850.076 there is additional mm-wave flux, which we
attribute to errors in the deboosting the submm or mm-wave data in this
individual object; this galaxy is also counted among the starbursts.
In summary therefore, considering only those galaxies in which sufficient data is available,
we have 12 galaxies with an unknown far-infrared excess relative to our models, 12 with AGN fractions
![]() ,
16 starburst-dominated (
,
16 starburst-dominated (
![]() ).
Note that we previously found that AGN bolometric fractions
above 0.3 cannot be reliably measured in this broad-band fitting
(Negrello et al. 2009). If we exclude the poorly-fit SEDs, we find that
).
Note that we previously found that AGN bolometric fractions
above 0.3 cannot be reliably measured in this broad-band fitting
(Negrello et al. 2009). If we exclude the poorly-fit SEDs, we find that
![]() of our submm-selected galaxies have
of our submm-selected galaxies have
![]() ;
alternatively, if we conservatively include the galaxies with far-infrared excesses as starburst-dominated, we find
;
alternatively, if we conservatively include the galaxies with far-infrared excesses as starburst-dominated, we find
![]() have AGN bolometric contributions above this threshold. We therefore treat the
have AGN bolometric contributions above this threshold. We therefore treat the ![]() range to be
range to be
![]() .
Pope et al. (2008) used mid-infrared spectroscopy of submm-selected galaxies and found that a fraction
.
Pope et al. (2008) used mid-infrared spectroscopy of submm-selected galaxies and found that a fraction
![]() (i.e. 2/13 galaxies in their sample) had an active nucleus
which contributes significantly to the mid-infrared. This is
slightly lower than found in our study, though only marginally
inconsistent given the small number statistics in both studies.
(i.e. 2/13 galaxies in their sample) had an active nucleus
which contributes significantly to the mid-infrared. This is
slightly lower than found in our study, though only marginally
inconsistent given the small number statistics in both studies.
Eight of our SHADES galaxies have been identified as having anomalous
610-1400 MHz spectral indices (Ibar et al.,
in preparation): LOCK850.001, 015, 018, 022, 024, 033, 040, 087.
Of these, LOCK850.001, 024 and 033 have flat radio spectra (
![]() ),
while
the remainder have unusually steep spectra, consistent with synchrotron
ageing of electrons in the radio lobes from active nuclei. We have
identified three of these eight securely as having AGN bolometric
contributions
),
while
the remainder have unusually steep spectra, consistent with synchrotron
ageing of electrons in the radio lobes from active nuclei. We have
identified three of these eight securely as having AGN bolometric
contributions
![]() ,
and three with
,
and three with
![]() .
This suggests that evidence of AGN in the radio is not necessarily an indicator of bolometrically-dominant active nuclei.
.
This suggests that evidence of AGN in the radio is not necessarily an indicator of bolometrically-dominant active nuclei.
The high star formation rates (several hundred ![]() /year, e.g. Hughes et al. 1998) and low number density of submm-selected galaxies (e.g. Scott et al. 2006; Coppin et al. 2006)
suggest that submm galaxies are short-lived. Indeed the steep number
counts of submm-selected galaxies necessarily imples that we sample
submm galaxies at around their peak phase of far-infrared luminosity.
Even a slowly-varying monochromatic luminosity will induce this effect:
in the models of Takagi et al. (2003, 2004), the submm luminosity varies by around a factor of 2-3 over a timescale of
/year, e.g. Hughes et al. 1998) and low number density of submm-selected galaxies (e.g. Scott et al. 2006; Coppin et al. 2006)
suggest that submm galaxies are short-lived. Indeed the steep number
counts of submm-selected galaxies necessarily imples that we sample
submm galaxies at around their peak phase of far-infrared luminosity.
Even a slowly-varying monochromatic luminosity will induce this effect:
in the models of Takagi et al. (2003, 2004), the submm luminosity varies by around a factor of 2-3 over a timescale of ![]() Myr. Denoting this for simplicity as
Myr. Denoting this for simplicity as
![]() ,
where
,
where ![]() measures the secular evolution and
measures the secular evolution and
![]() Myr is the timescale of the variation, we find that a power-law differential source counts of
Myr is the timescale of the variation, we find that a power-law differential source counts of
![]() gives an observed age distribution in a flux-limited sample of
gives an observed age distribution in a flux-limited sample of
|
(4) |
where
There have been suggestions from numerical simulations (e.g. di Matteo et al. 2005)
that feedback from active nuclei is capable of truncating star
formation activity. However quasars also have star-forming hosts (e.g.
Serjeant & Hatziminaoglou 2009)
which may pose challenges for models in which star formation is
truncated too abruptly by active nuclei (e.g. Narayanan et al. 2010).
Therefore we suggest that the energy input from active nuclei through
quasar-mode or radio-mode feedback does not immediately truncate star
formation, but rather suppresses it on the same timescales as the
quasar lifetime itself. We may also find that star-forming
far-infrared-luminous
populations selected at shorter wavelengths than SHADES have warmer
colour temperatures (e.g. Blain et al. 2003)
and higher AGN bolometric contributions. In this interpretation, these
would be later phases in the co-evolution of active nucleus and
starburst. This would also be consistent with the observation that the K-band Hubble diagram of hyperluminous starbursts is tight when the hyperluminous galaxies are selected at ![]() m (Serjeant et al. 2003b), but has a much higher dispersion when the hyperluminous galaxies are selected at submm-wavelengths (e.g. Smail et al. 2004).
m (Serjeant et al. 2003b), but has a much higher dispersion when the hyperluminous galaxies are selected at submm-wavelengths (e.g. Smail et al. 2004).
Finally, our models predict submm-selected galaxies have fluxes of
![]() mJy at an observed frame wavelength of
mJy at an observed frame wavelength of ![]() m. This was beyond the capabilities of both AKARI and Spitzer for direct detections, but is consistent with the Spitzer stacking analysis detection
by Dye et al. (2007) of
m. This was beyond the capabilities of both AKARI and Spitzer for direct detections, but is consistent with the Spitzer stacking analysis detection
by Dye et al. (2007) of
![]() mJy.
Direct detections at this depth may be accessible to Herschel at
shorter wavelengths, and would probe the hot dust components in
submm-selected galaxies, currently not strongly constrained.
mJy.
Direct detections at this depth may be accessible to Herschel at
shorter wavelengths, and would probe the hot dust components in
submm-selected galaxies, currently not strongly constrained.
This research is based on observations with AKARI, a JAXA project with the participation of ESA. This work was funded in part by STFC (grant PP/D002400/1), the Royal Society (2006/R4-IJP) and the Sasakawa Foundation (3108). J.S.D. thanks the Royal Society for a Wolfson Research Merit Award. M.I. was supported by the Korea Science and Engineering Foundation(KOSEF) grant No. 2009-0063616, funded by the Korea government(MEST). S.K. were supported by the Basic Science Research Programme through the National Research Foundation of Korea (NRF) funded by the Ministry of Education, Science and Technology 2009-0066892. We thank the anonymous referee for helpful comments.
References
- Alexander, D. M., Bauer, F. E., Chapman, S. C., et al. 2005, ApJ, 632, 736 Austermann, J. E., Dunlop, J. S., Perera, T. A., et al. 2010, MNRAS, 401, 160 [NASA ADS] [CrossRef] [Google Scholar]
- Aretxaga, I., Terlevich, R. J., & Boyle, B. J. 1998, MNRAS, 296, 643 [NASA ADS] [CrossRef] [Google Scholar]
- Aretxaga, I., Hughes, D. H., Coppin, K., et al. 2007, MNRAS, 379, 1571 [NASA ADS] [CrossRef] [Google Scholar]
- Barger, A. J., Cowie, L. L., Sanders, D. B., et al. 1998, Nature, 394, 248 [NASA ADS] [CrossRef] [Google Scholar]
- Baugh, C. M., Lacey, C. G., Frenk, C. S., et al. 2005, MNRAS, 356, 1191 [NASA ADS] [CrossRef] [Google Scholar]
- Bertoldi, F., & Cox, P. 2002, A&A, 384, L11 [Google Scholar]
- Bertoldi, F., Carilli, C. L., Cox, P., et al. 2003, A&A, 406, L55 [Google Scholar]
- Blain, A. W., Barnard, V. E., & Chapman, S. C. 2003, MNRAS, 338, 733 [NASA ADS] [CrossRef] [Google Scholar]
- Brotherton, M. S., van Breugel, W., Stanford, S. A., et al. 1999, ApJ, 520, L87 [NASA ADS] [CrossRef] [Google Scholar]
- Carilli, C. L., Bertoldi, F., Rupen, M. P., et al. 2001, ApJ, 555, 625 [NASA ADS] [CrossRef] [Google Scholar]
- Clements, D. L., Vaccari, M., Babbedge, T., et al. 2008, MNRAS, 387, 247 [NASA ADS] [CrossRef] [Google Scholar]
- Coppin, K., Halpern, M., Scott, D., et al. 2004, MNRAS, 354, 193 [NASA ADS] [CrossRef] [Google Scholar]
- Coppin, K., Chapin, E. L., Mortier, A. M. J., et al. 2006, MNRAS, 372, 1621 [NASA ADS] [CrossRef] [Google Scholar]
- Coppin, K., Halpern, M., Scott, D., et al. 2008, MNRAS, 384, 1597 [NASA ADS] [CrossRef] [Google Scholar]
- Devlin, M. J., Ade, P. A. R., Aretxaga, I., et al. 2009, Nature, 458, 737 [NASA ADS] [CrossRef] [PubMed] [Google Scholar]
- di Matteo, T., Springel, V., & Hernquist, L. 2005, Nature, 433, 604 [NASA ADS] [CrossRef] [PubMed] [Google Scholar]
- Dye, S., Eales, S. A., Ashby, M. L. N., et al. 2007, MNRAS, 375, 725 [NASA ADS] [CrossRef] [Google Scholar]
- Dey, A., Soifer, B. T., Desai, V., et al. 2008a, ApJ, 677, 943 [NASA ADS] [CrossRef] [Google Scholar]
- Dye, S., Eales, S. A., Aretxaga, I., et al. 2008b, MNRAS, 386, 1107 [NASA ADS] [CrossRef] [Google Scholar]
- Eddington, A. S. 1913, MNRAS, 73, 359 [Google Scholar]
- Efstathiou, A., & Rowan-Robinson, M. 1995, MNRAS, 273, 649 [NASA ADS] [CrossRef] [Google Scholar]
- Elbaz, D., Cesarsky, C. J., Fadda, D., et al. 1999, A&A, 351, L37 [Google Scholar]
- Fazio, G. G., Hora, J. L., Allen, L. E., et al. 2004, ApJS, 154, 10 [NASA ADS] [CrossRef] [Google Scholar]
- Ferrarese, L., & Merritt, S. 2000, ApJ, 539, L9 [NASA ADS] [CrossRef] [Google Scholar]
- Genzel, R., & Cezarsky, C. 2005, ARA&A, 38, 761 [Google Scholar]
- Gispert, R., Lagache, G., & Puget, J. L. 2000, A&A, 360, 1 [Google Scholar]
- Granato, G. L., Silva, L., Lapi, A., et al. 2006, MNRAS, 368, L72 [NASA ADS] [CrossRef] [Google Scholar]
- Greve, T. R., Weiss, A., Walter, F., et al. 2009, [arXiv:0904.0028] [Google Scholar]
- Hopwood, R. H., et al. 2009, ApJL, submitted [Google Scholar]
- Hughes, D. H., Dunlop, J. S., & Rawlings, S. 1997, MNRAS, 289, 766 [NASA ADS] [CrossRef] [Google Scholar]
- Hughes, D. H., Serjeant, S., Dunlop, J., et al. 1998, Nature, 394, 241 [NASA ADS] [CrossRef] [Google Scholar]
- Isaak, K. G., Priddey, R. S., McMahon, R. G., et al. 2002, MNRAS, 329, 149 [NASA ADS] [CrossRef] [Google Scholar]
- Ivison, R. J., Greve, T. R., Dunlop, J. S., et al. 2007, MNRAS, 380, 199 [Google Scholar]
- Lacey, C. G., Baugh, C. M., Frenk, C. S., et al. 2008, MNRAS, 385, 1155 [NASA ADS] [CrossRef] [Google Scholar]
- Lehnert, M. D., Heckman, T. M., Chambers, K. C., & Miley, G. K. 1992, ApJ, 393, 68 [NASA ADS] [CrossRef] [Google Scholar]
- Lutz, D., Sturm, E., Tacconi, L. J., et al. 2008, ApJ, 684, 853 [Google Scholar]
- Magorrian, J., Tremaine, S., Richstone, D., et al. 1998, AJ, 115, 2285 [NASA ADS] [CrossRef] [Google Scholar]
- Marsden, G., Ade, P. A. R., Bock, J. J., et al. 2009, ApJ, 707, 1729 [NASA ADS] [CrossRef] [Google Scholar]
- Martínez-Sansigre, A., Rawlings, S., Lacy, M., et al. 2005, Nature, 436, 666 [NASA ADS] [CrossRef] [Google Scholar]
- Menéndez-Delmestre, K., Blain, A. W., Smail, I., et al. 2009, ApJ, 699, 667 [NASA ADS] [CrossRef] [Google Scholar]
- Mortier, A. M. J., Serjeant, S., Dunlop, J. S., et al. 2005, MNRAS, 363, 563 [NASA ADS] [CrossRef] [MathSciNet] [Google Scholar]
- Mullaney, J. R., Alexander, D. M., Huynh, M., Goulding, A. D., & Frayer, D. 2010, MNRAS, 401, 995 [NASA ADS] [CrossRef] [Google Scholar]
- Narayanan, D., Hayward, C. C., Cox, T. J., et al. 2010, MNRAS, 401, 1613 [NASA ADS] [CrossRef] [MathSciNet] [Google Scholar]
- Negrello, M., Serjeant, S., Pearson, C., et al. 2009, MNRAS, 394, 375 [NASA ADS] [CrossRef] [Google Scholar]
- Oliver, S., Mann, R. G., Carballo, R., et al. 2002, MNRAS, 332, 536 [NASA ADS] [CrossRef] [Google Scholar]
- Omont, A., Cox, P., Bertoldi, F., et al. 2001, A&A, 374, 371 [Google Scholar]
- Omont, A., Beelen, A., Bertoldi, F., et al. 2003, A&A, 398, 857 [Google Scholar]
- Peacock, J. A. 1999, Cosmological Physics (Cambridge University Press) [Google Scholar]
- Peacock, J. A., Rowan-Robinson, M., Blain, A. W., et al. 2000, MNRAS, 318, 535 [NASA ADS] [CrossRef] [Google Scholar]
- Pearson, C. P. 2005, MNRAS, 358, 1417 [NASA ADS] [CrossRef] [Google Scholar]
- Pearson, C. P., Serjeant, S., Negrello, M., et al. 2010, A&A, 514, A9 [Google Scholar]
- Pope, A., Chary, R.-R., Alexander, D. M., et al. 2008, ApJ, 675, 1171 [Google Scholar]
- Priddey, R. S., Isaak, K. G., McMahon, R. G., & Omont, A. 2003a, MNRAS, 339, 1183 [NASA ADS] [CrossRef] [Google Scholar]
- Priddey, R. S., Isaak, K. G., McMahon, R. G., Robson, E. I., & Pearson, C. P. 2003b, MNRAS, 344, L74 [NASA ADS] [CrossRef] [Google Scholar]
- Rieke, G. H., Young, E. T., Engelbracht, C. W., et al. 2004, ApJS, 154, 25 [NASA ADS] [CrossRef] [Google Scholar]
- Rodighiero, G., Lari, C., Fadda, D., et al. 2004, A&A, 427, 773 [Google Scholar]
- Scott, S. E., Dunlop, J. S., & Serjeant, S. 2006, MNRAS, 370, 1057 [NASA ADS] [CrossRef] [Google Scholar]
- Scott, K. S., Austermann, J. E., Perera, T. A., et al. 2008, MNRAS, 385, 2225 [Google Scholar]
- Serjeant, S., & Hatziminaoglou, E. 2009, MNRAS, 397, 265 [NASA ADS] [CrossRef] [Google Scholar]
- Serjeant, S., Dunlop, J. S., Mann, R. G., et al. 2003a, MNRAS, 344, 887 [NASA ADS] [CrossRef] [Google Scholar]
- Serjeant, S., Farrah, D., Geach, J., et al. 2003b, MNRAS, 346, L51 [NASA ADS] [CrossRef] [Google Scholar]
- Serjeant, S., Mortier, A. M. J., Ivison, R. J., et al. 2004, ApJS, 154, 118 [NASA ADS] [CrossRef] [Google Scholar]
- Serjeant, S., Dye, S., Mortier, A., et al. 2008, MNRAS, 386, 1907 [NASA ADS] [CrossRef] [Google Scholar]
- Shi, Y., Rieke, G. H., Ogle, P., et al. 2009, ApJ, 703, 1107 [NASA ADS] [CrossRef] [Google Scholar]
- Smail, I., Ivison, R. J., & Blain, A. W. 1997, ApJ, 490, L5 [NASA ADS] [CrossRef] [Google Scholar]
- Smail, I., Chapman, S. C., Blain, A. W., & Ivison, R. J. 2004, ApJ, 616, 71 [NASA ADS] [CrossRef] [Google Scholar]
- Takagi, T., Arimoto, N., & Hanami, H. 2003, MNRAS, 340, 813 [NASA ADS] [CrossRef] [Google Scholar]
- Takagi, T., Hanami, H., & Arimoto, N. 2004, MNRAS, 355, 424 [NASA ADS] [CrossRef] [Google Scholar]
- Takagi, T., Mortier, A. M. J., Shimasaku, K., et al. 2007, MNRAS, 381, 1154 [NASA ADS] [CrossRef] [Google Scholar]
- Veilleux, S., Rupke, D. S. N., Kim, D.-C., et al. 2009, ApJS, 182, 628 [NASA ADS] [CrossRef] [Google Scholar]
- Wang, W.-H., Barger, A. J., & Cowie, L. L. 2007, ApJ, 690, 319 [Google Scholar]
- Willott, C., Rawlings, S., & Grimes, J. A. 2003, ApJ, 598, 909 [NASA ADS] [CrossRef] [Google Scholar]
- Yun, M. S., Aretxaga, I., Ashby, M. L. N., et al. 2008, MNRAS, 389, 333 [NASA ADS] [CrossRef] [Google Scholar]
All Tables
Table 1: Optical and near-infrared AB magnitude photometry of SHADES galaxies in the Lockman hole east.
Table 2: Mid-infrared to radio photometry of SHADES galaxies in the Lockman hole east.
Table 3: Results of the SED fitting, with the parameters defined in the text.
All Figures
|
|
Figure 1:
Comparison of |
| Open with DEXTER | |
| In the text | |
|
|
Figure 2:
The SHADES SCUBA |
| Open with DEXTER | |
| In the text | |
|
|
Figure 3:
The SHADES AzTEC |
| Open with DEXTER | |
| In the text | |
|
|
Figure 4:
Histograms of the submm and mm-wave fluxes in the regions with |
| Open with DEXTER | |
| In the text | |
|
|
Figure 5:
Stacked mm-wave and submm signal-to-noise postage stamps of |
| Open with DEXTER | |
| In the text | |
|
|
Figure 6: SED fits to submm-selected SHADES galaxies in the Lockman hole east, using models from Takagi et al. (2003, 2004) and Efstathiou & Rowan-Robinson (1995). |
| Open with DEXTER | |
| In the text | |
|
|
Figure 7: SED fits to submm-selected SHADES galaxies in the Lockman hole east, using models from Takagi et al. (2003, 2004) and Efstathiou & Rowan-Robinson (1995). |
| Open with DEXTER | |
| In the text | |
|
|
Figure 8: SED fits to submm-selected SHADES galaxies in the Lockman hole east, using models from Takagi et al. (2003, 2004) and Efstathiou & Rowan-Robinson (1995). |
| Open with DEXTER | |
| In the text | |
|
|
Figure 9: SED fits to submm-selected SHADES galaxies in the Lockman hole east, using models from Takagi et al. (2003, 2004) and Efstathiou & Rowan-Robinson (1995). |
| Open with DEXTER | |
| In the text | |
|
|
Figure 10: SED fits to submm-selected SHADES galaxies in the Lockman hole east, using models from Takagi et al. (2003, 2004) and Efstathiou & Rowan-Robinson (1995). |
| Open with DEXTER | |
| In the text | |
Copyright ESO 2010
Current usage metrics show cumulative count of Article Views (full-text article views including HTML views, PDF and ePub downloads, according to the available data) and Abstracts Views on Vision4Press platform.
Data correspond to usage on the plateform after 2015. The current usage metrics is available 48-96 hours after online publication and is updated daily on week days.
Initial download of the metrics may take a while.