| Issue |
A&A
Volume 513, April 2010
|
|
|---|---|---|
| Article Number | L2 | |
| Number of page(s) | 4 | |
| Section | Letters | |
| DOI | https://doi.org/10.1051/0004-6361/201014066 | |
| Published online | 14 April 2010 | |
LETTER TO THE EDITOR
Positions and sizes of X-ray solar flare sources
E. P. Kontar - N. L. S. Jeffrey
Department of Physics and Astronomy, University of Glasgow, G12 8QQ, UK
Received 14 January 2010 / Accepted 8 March 2010
Abstract
Aims. The positions and source sizes of X-ray sources taking into account Compton backscattering (albedo) are investigated.
Methods. Using a Monte Carlo simulation of X-ray photon
transport including photo-electric absorption and Compton scattering,
we calculate the apparent source sizes and positions of X-ray sources
at the solar disk for various source sizes, spectral indices and
directivities of the primary source.
Results. We show that the albedo effect can alter the true
source positions and substantially increase the measured source sizes.
The source positions are shifted by up to ![]() 0.5''
radially towards the disk centre and 5 arcsec source sizes can be
two times larger even for an isotropic source (minimum albedo effect)
at 1 Mm above the photosphere. The X-ray sources therefore should
have minimum observed sizes, and thus their FWHM source size (2.35 times second-moment) will be as large as
0.5''
radially towards the disk centre and 5 arcsec source sizes can be
two times larger even for an isotropic source (minimum albedo effect)
at 1 Mm above the photosphere. The X-ray sources therefore should
have minimum observed sizes, and thus their FWHM source size (2.35 times second-moment) will be as large as ![]() 7'' in the 20-50 keV range for a disk-centered point source at a height of 1 Mm (
7'' in the 20-50 keV range for a disk-centered point source at a height of 1 Mm (![]() 1.4'')
above the photosphere. The source size and position change is greater
for flatter primary X-ray spectra, a stronger downward anisotropy, for
sources closer to the solar disk centre, and between the energies
of 30 and 50 keV.
1.4'')
above the photosphere. The source size and position change is greater
for flatter primary X-ray spectra, a stronger downward anisotropy, for
sources closer to the solar disk centre, and between the energies
of 30 and 50 keV.
Conclusions. Albedo should be taken into account when X-ray
footpoint positions, footpoint motions or source sizes from e.g. RHESSI
or Yohkoh data are interpreted, and we suggest that footpoint sources
should be larger in X-rays than in either optical or EUV ranges.
Key words: Sun: flares - Sun: activity - Sun: X-rays, gamma rays - Sun: chromosphere
1 Introduction
Hard X-ray (HXR) emission produced via collisional bremsstrahlung from solar flares by non-thermal electrons is the primary diagnostic tool in the study of electron acceleration and transport. The spectral and spatial distributions of HXR sources can help us with vital clues to improve our current understanding of the underlying physics involved in energetic electron acceleration and transport. While recent (Hard X-ray Telescope (HXT) on Yohkoh, Kosugi et al. 1991), and modern (Reuven Ramaty High Energy Solar Spectroscopic Imager, Lin et al. 2002), solar HXR telescopes have achieved superb X-ray image resolutions, indirect imaging using either pairs of occultation grids on Yohkoh or rotating modulating collimators on RHESSI have (i) limited dynamic range and (ii) often provided inadequate spatial resolution of lengths exceeding the size of e.g. EUV footpoints or the vertical extent of the chromosphere. Thus RHESSI image resolution for the majority of solar flares is limited to about 7'', while the solar chromosphere is only about 3'' thick. Nevertheless, unprecedented spatial measurements can and have been achieved using the moments of X-ray distributions. The total flux (zeroth moment) from individual sources in various energy ranges has allowed us to perform imaging spectroscopy (e.g. Krucker & Lin 2002; Emslie et al. 2003; Saint-Hilaire et al. 2008; Battaglia & Benz 2007). The measurements of the X-ray source positions (first moments) pin-point source locations with 1'' or better accuracy and allow us to infer the chromospheric density structure (Kontar et al. 2008b; Aschwanden et al. 2002; Liu et al. 2006). The motions of HXR footpoint locations have been used to infer the reconnection rate in solar flares (Fivian et al. 2009; Fletcher & Hudson 2002; Krucker et al. 2003). Using X-ray visibilities (Schmahl et al. 2007; Hurford et al. 2002) Kontar et al. (2008b) have measured not only the positions but the HXR footpoint sizes (second moment) at various energies and heights and found that HXR sources decrease with energy and consequently with height above the photosphere. Xu et al. (2008) have measured coronal sources to infer acceleration region sizes. HXR images can also be inverted (e.g. Brown et al. 2006) to find the spatial electron distributions and hence the locations of electron centroids (e.g. Prato et al. 2009).Since the solar atmosphere above HXR sources is optically thin, X-rays are often directly related to the emitting electrons. However, the photons emitted downwards, toward the denser layers of the atmosphere interact with free or bound electrons and can also be scattered toward the observer (Santangelo et al. 1973; Tomblin 1972). Photons back-scattered and emerging back from the dense solar atmosphere to the observer create the albedo X-ray photons. Even for an isotropic X-ray source (the minimum albedo), the albedo flux can account for up to 40% of the detected flux in the range between 30 and 50 keV (Bai & Ramaty 1978; Zhang & Huang 2004; Kontar et al. 2006; Kasparová et al. 2007). Therefore, all X-ray sources at the solar disk are viewed as a combination of both the primary and backscattered fluxes. Accounting for the albedo effect is important for all X-ray solar observations, which can only view disk sources as a combination of the primary photon flux and the backscattered photon flux. The backscattered component taints the primary source properties such as electron angular, energy, and spatial distributions. Albedo changes the shape of the spatially integrated X-ray spectrum, which is flattened at lower energies up to around 20-30 keV and can even produce artificial spectral features in observed spectra (Kontar et al. 2008a), while at higher energies above around 70 keV, the the spectrum is steeper than the emitted (primary) spectrum. Kontar et al. (2006) have developed and implemented albedo correction for spectral X-ray RHESSI analysis using Green's functions approximations by Magdziarz & Zdziarski (1995). Since the reflected X-rays come from a rather large area (albedo patch), the surface brightness of the albedo patch at the solar surface is rather low (Bai & Ramaty 1978). This fact explains the difficulty in directly imaging the albedo patch (Schmahl & Hurford 2002), but this highlights the importance of the inclusion of albedo for understanding the measurements of the source positions and sizes (first and second moments), the quantities which are integrated over the full area of the source.
In this Letter, using Monte Carlo simulations of X-ray photon transport we demonstrate how the observed positions and source sizes are affected by the albedo effect for various anisotropies, primary source sizes and primary source spectra and show that on-disk HXR sources should have energy-dependent minimum observed sizes.
2 Spatial characteristics of the primary, backscattered and observed X-ray distributions
The backscattered flux and albedo effect are studied using a Monte Carlo simulation
starting with a hundred million photons per run. An unpolarized X-ray source was modeled
in space with a 2-dimensional circular Gaussian ![]()
![]() with width d, placed at the height h=1 Mm above the photosphere
(the photosphere is defined here as a layer with hydrogen number
density
with width d, placed at the height h=1 Mm above the photosphere
(the photosphere is defined here as a layer with hydrogen number
density
![]() cm-3 Vernazza et al. 1981).
This is the typical hard X-ray source height found
in footpoints (Kontar et al. 2008b; Aschwanden et al. 2002).
The energy spectrum for photons has a power law
cm-3 Vernazza et al. 1981).
This is the typical hard X-ray source height found
in footpoints (Kontar et al. 2008b; Aschwanden et al. 2002).
The energy spectrum for photons has a power law
![]() with a spectral index of
with a spectral index of ![]() ,
for energies between 3 keV and 300 keV,
typical for RHESSI. The code accounts
for the curvature of the Sun and the photons are assumed to move freely
until they reach the photospheric density
at a height
,
for energies between 3 keV and 300 keV,
typical for RHESSI. The code accounts
for the curvature of the Sun and the photons are assumed to move freely
until they reach the photospheric density
at a height
![]() ,
where
,
where
![]() cm is the solar radius.
Below this level photons can be either scattered or photo-electrically
absorbed. Similar to previous MC simulations (Bai & Ramaty 1978; Magdziarz & Zdziarski 1995),
the Klein-Nishina cross-section for unpolarized X-ray radiation was used
cm is the solar radius.
Below this level photons can be either scattered or photo-electrically
absorbed. Similar to previous MC simulations (Bai & Ramaty 1978; Magdziarz & Zdziarski 1995),
the Klein-Nishina cross-section for unpolarized X-ray radiation was used
where
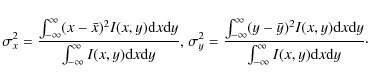
Using solar disk centered coordinates, the centroid position
of the source (![]() ,
,
![]() )
can be found by calculating
the first normalized moment of the distribution (mean)
)
can be found by calculating
the first normalized moment of the distribution (mean)

and the normalized variance of the distribution (second moment),
|
(3) |
Hereafter, following RHESSI measurements (Kontar et al. 2008b; Dennis & Pernak 2009; Prato et al. 2009) we will refer to the source sizes in terms of FWHM (Full Width Half Maximum),
| Figure 1:
The X-ray scatter distributions of the primary photons (red dots)
and the Compton back-scattered photons (blue dots) for a primary source
at h=1.0 Mm with d=1.5 Mm (
|
|
| Open with DEXTER | |
![\begin{figure}
\par\includegraphics[width=17.5cm,clip]{14066fg2.eps}
\end{figure}](/articles/aa/full_html/2010/05/aa14066-10/img29.png)
|
Figure 2:
Spectral index dependency (panels a)- d)):
the source position shift is in the radial direction
due to albedo (source |
| Open with DEXTER | |
The scattered X-ray flux depends on the cosine of the heliocentric angle of the
source (
![]() )
or equivalently on the position of the source
at the solar disk,
)
or equivalently on the position of the source
at the solar disk,
![]() .
A circular X-ray source located above the centre of the disk will
produce a circular albedo patch (Fig. 1a).
Naturally,
the location of the HXR source and albedo patch will coincide
at the disk centre, so albedo will not change
the source position. However, the albedo will make the source larger than it is
actually is (Fig. 1a). The albedo contribution becomes asymmetric
if the source is located away from the disk centre at a given heliocentric
angle
.
A circular X-ray source located above the centre of the disk will
produce a circular albedo patch (Fig. 1a).
Naturally,
the location of the HXR source and albedo patch will coincide
at the disk centre, so albedo will not change
the source position. However, the albedo will make the source larger than it is
actually is (Fig. 1a). The albedo contribution becomes asymmetric
if the source is located away from the disk centre at a given heliocentric
angle ![]() (Figs. 1b-d).
Due to the spherical symmetry of the Sun,
there are two distinct directions: radial - along the line connecting the centre of the Sun
and the X-ray source r, and perpendicular to the radial
(Figs. 1b-d).
Due to the spherical symmetry of the Sun,
there are two distinct directions: radial - along the line connecting the centre of the Sun
and the X-ray source r, and perpendicular to the radial ![]() .
There is no change in centroid position in the
.
There is no change in centroid position in the ![]() -direction for a spherically
symmetric primary source. In the r-direction, the albedo causes a centroid
shift towards the disk centre that rises from
-direction for a spherically
symmetric primary source. In the r-direction, the albedo causes a centroid
shift towards the disk centre that rises from ![]() 0at
0at ![]() and peaks shortly before falling to
and peaks shortly before falling to ![]() 0again at
0again at ![]() .
Figure 1 also shows how the source size varies
in the
.
Figure 1 also shows how the source size varies
in the ![]() direction, with the FWHM of the source generally
decreasing at lower
direction, with the FWHM of the source generally
decreasing at lower ![]() .
In the radial direction, the FWHM of the total
and primary sources decreases close to linear due to a simple projection effect.
The detailed 3D structure of the source is required before any physically meaningful predictions
can be made concerning the change in source size in the radial direction, and this is beyond the scope of the paper.
Therefore, we consider the source sizes in the
.
In the radial direction, the FWHM of the total
and primary sources decreases close to linear due to a simple projection effect.
The detailed 3D structure of the source is required before any physically meaningful predictions
can be made concerning the change in source size in the radial direction, and this is beyond the scope of the paper.
Therefore, we consider the source sizes in the ![]() direction and the source
position in the radial direction rather than along the East-West and
South-North directions. Similar to the spatially integrated albedo (Kontar et al. 2006),
the shift in centroid position and the growth of the source are also
energy and
direction and the source
position in the radial direction rather than along the East-West and
South-North directions. Similar to the spatially integrated albedo (Kontar et al. 2006),
the shift in centroid position and the growth of the source are also
energy and ![]() dependent. In the following, we consider the position
and source size changes for various a) spectra of the primary source, b) primary source size,
and c) X-ray directivity (the ratio of downward to upward emitted photons) separately.
The results are summarized in Fig. 2.
dependent. In the following, we consider the position
and source size changes for various a) spectra of the primary source, b) primary source size,
and c) X-ray directivity (the ratio of downward to upward emitted photons) separately.
The results are summarized in Fig. 2.
Spectral index (Figs. 2a-d) -
similar to the spectral results,
the albedo contribution from a smaller spectral index
produces the largest shift in position and a larger
total source size (Figs. 2a-d). An isotropic source
of
![]() for the lowest modeled spectral
index of
for the lowest modeled spectral
index of ![]() produces the greatest
shift of
produces the greatest
shift of ![]() 0.5'' at
0.5'' at
![]() and
and ![]() 30 keV. This spectral index also produces
the largest source size and has a
30 keV. This spectral index also produces
the largest source size and has a
![]() at
at ![]() ,
compared with the other spectral indices of
,
compared with the other spectral indices of
![]() modeled.
modeled.
Primary source size (Figs. 2e-h) -
for a fixed spectral index of ![]() ,
all primary
source sizes produce the same shift in centroid position.
The maximum shift in position occurs at
,
all primary
source sizes produce the same shift in centroid position.
The maximum shift in position occurs at
![]() and
and ![]() 30 keV
for all sources (Figs. 2e, g).
Although the FWHM of the total source grows with increasing
primary size, it is observed that the relative size
of the total to the primary source is smaller for a larger
primary source. This indicates that a larger primary source should
have a smaller relative size increase due to albedo.
Even an initial point source produces a total source
with a FWHM peaking around 7'' (Figs. 2f, h).
30 keV
for all sources (Figs. 2e, g).
Although the FWHM of the total source grows with increasing
primary size, it is observed that the relative size
of the total to the primary source is smaller for a larger
primary source. This indicates that a larger primary source should
have a smaller relative size increase due to albedo.
Even an initial point source produces a total source
with a FWHM peaking around 7'' (Figs. 2f, h).
Anisotropy (Figs. 2i-l) - the shift in centroid position
is larger for a higher initial downward anisotropy
(the ratio of downward flux to upward flux)
for all ![]() and energies (Figs. 2i, k).
All shifts follow the general trend and tend towards
zero at the centre (
and energies (Figs. 2i, k).
All shifts follow the general trend and tend towards
zero at the centre (![]() )
and the limb (
)
and the limb (![]() ).
Using
).
Using ![]() and a primary source of
and a primary source of
![]() ,
a directivity of 5 produces a peak difference of
,
a directivity of 5 produces a peak difference of ![]() 0.9'' and even
an isotropic source produces a peak difference of
0.9'' and even
an isotropic source produces a peak difference of ![]() 0.4''.
The shift in source position peaks near
0.4''.
The shift in source position peaks near
![]() and
and ![]() 30 keV for a downward
anisotropy of 2 and an isotropic source, but the shift peaks
at a lower
30 keV for a downward
anisotropy of 2 and an isotropic source, but the shift peaks
at a lower
![]() for a downward directivity of 5.
The stronger downward beaming of the primary
source also leads to larger apparent source sizes for all
for a downward directivity of 5.
The stronger downward beaming of the primary
source also leads to larger apparent source sizes for all ![]() and energies (Figs. 2j, l).
It should be observed that the total FWHM produced
for a directivity of 5 peaks at
and energies (Figs. 2j, l).
It should be observed that the total FWHM produced
for a directivity of 5 peaks at
![]() (Fig. 2p) giving an apparent
(Fig. 2p) giving an apparent
![]() .
Since the fraction of reflected photons
reduces with
.
Since the fraction of reflected photons
reduces with ![]() the FWHM in perpendicular direction
can be expected to slowly decrease from disk centre to limb,
but the FWHM actually increases, peaks at
the FWHM in perpendicular direction
can be expected to slowly decrease from disk centre to limb,
but the FWHM actually increases, peaks at
![]() and only
then starts to decrease. This effect is due to the angular dependence
of the Compton cross-section. The cross-section is anisotropic
and peaks at
and only
then starts to decrease. This effect is due to the angular dependence
of the Compton cross-section. The cross-section is anisotropic
and peaks at
![]() ,
which allows a larger number of photons
to scatter into an observer direction for flares close to the limb.
It is this anisotropy in the scattering of the photons
that causes the FWHM to peak at an angle smaller than
,
which allows a larger number of photons
to scatter into an observer direction for flares close to the limb.
It is this anisotropy in the scattering of the photons
that causes the FWHM to peak at an angle smaller than ![]() .
The observation of this effect is particularly clear in the
case of high downward directivity (Fig. 2l).
.
The observation of this effect is particularly clear in the
case of high downward directivity (Fig. 2l).
3 Discussion and conclusions
The results of the simulations show that albedo can substantially
affect the precise position and source size measurements of X-ray sources.
Therefore, the effect of albedo should always be (probably with the exception
of limb/occulted flares) considered when the sizes or positions of X-ray
sources are analyzed. The albedo displacement of the source position is
radially directed towards the disk centre and depends on the anisotropy of X-ray radiation,
the X-ray source size and the spectral index of the primary source. Similar to total
reflected flux, the displacement of HXR source position is energy dependent.
The largest displacement can be observed in the range between
30-50 keV at
![]() (heliocentric angle
(heliocentric angle ![]()
![]() ).
The shift in centroid position in this energy range is
0.1-0.5''for an isotropic (minimum albedo) source 1.4'' above the photosphere
and this can be up to
).
The shift in centroid position in this energy range is
0.1-0.5''for an isotropic (minimum albedo) source 1.4'' above the photosphere
and this can be up to ![]() 0.9'' for a downward beaming with factor of 5. Because
of the albedo, X-ray source sizes will be
energy dependent, larger in the perpendicular to radial
direction, and elliptical even for a spherically symmetric primary source.
In the perpendicular to radial direction, the largest growth in source
size occurs for sources close to the solar disk centre, in the energy range between 30-50 keV, where
albedo is the strongest. Thus, an isotropic
primary source with
0.9'' for a downward beaming with factor of 5. Because
of the albedo, X-ray source sizes will be
energy dependent, larger in the perpendicular to radial
direction, and elliptical even for a spherically symmetric primary source.
In the perpendicular to radial direction, the largest growth in source
size occurs for sources close to the solar disk centre, in the energy range between 30-50 keV, where
albedo is the strongest. Thus, an isotropic
primary source with
![]() at 1.4'' above the photosphere will
have an apparent FWHM size of
at 1.4'' above the photosphere will
have an apparent FWHM size of ![]() 9'' in the energy range
20-50 keV for sources in the wide range of heliocentric angles from
9'' in the energy range
20-50 keV for sources in the wide range of heliocentric angles from ![]() to
to ![]()
![]() .
.
The simulations demonstrate that X-ray sources will have a minimum size.
An isotropic point source at 1.0 Mm above the photosphere will be measured
by RHESSI as a source with a FWHM size of ![]() 7'' across.
This result can explain larger X-ray footpoint
sizes than EUV or optical ones (e.g. Kasparová et al. 2005).
Dennis & Pernak (2009) reported that the average semi-minor axis
of 18 double source flares is about 4'', while a few of the
X-ray source sizes were found to be consistent with line sources along
the flare ribbons. While the quantitative
comparison with the RHESSI observations requires additional work,
we note that zero sizes are either the artifacts of the algorithms
used or are caused by the very low source heights.
7'' across.
This result can explain larger X-ray footpoint
sizes than EUV or optical ones (e.g. Kasparová et al. 2005).
Dennis & Pernak (2009) reported that the average semi-minor axis
of 18 double source flares is about 4'', while a few of the
X-ray source sizes were found to be consistent with line sources along
the flare ribbons. While the quantitative
comparison with the RHESSI observations requires additional work,
we note that zero sizes are either the artifacts of the algorithms
used or are caused by the very low source heights.
The energy dependent character of albedo predicts that the source size
as measured by RHESSI should grow with energy from 10 keV up to ![]() 30 keV.
Considering a large primary source of 14.6'' across, e.g. a flaring loop,
we find that the source will grow up to
30 keV.
Considering a large primary source of 14.6'' across, e.g. a flaring loop,
we find that the source will grow up to ![]() 18'' at
18'' at ![]() 30 keV.
Noteworthy, Xu et al. (2008) have found that coronal source sizes
are growing with energy along both the field lines and across.
While the field line increase along the lines could be an indicator
of electron transport or of the acceleration region size, the cross-field increase
remains unexplained, but is consistent with the growth of the source size
due to the albedo. We note that the spatial changes of X-ray sources due to
albedo have a great diagnostic potential for purely known anisotropy
of energetic electrons.
30 keV.
Noteworthy, Xu et al. (2008) have found that coronal source sizes
are growing with energy along both the field lines and across.
While the field line increase along the lines could be an indicator
of electron transport or of the acceleration region size, the cross-field increase
remains unexplained, but is consistent with the growth of the source size
due to the albedo. We note that the spatial changes of X-ray sources due to
albedo have a great diagnostic potential for purely known anisotropy
of energetic electrons.
The authors are indebt to G. Hurford for insightful comments. E.P.K. work is supported by a STFC rolling grant, STFC Advanced Fellowship and the Leverhulme Trust grant. N.L.S.J. work was supported by The Nuffield Foundation and Cormack Bequest, Royal Society Edinburgh. The work has benefited from the international team grant from ISSI, Bern, Switzerland.
References
- Aschwanden, M. J., Brown, J. C., & Kontar, E. P. 2002, Sol. Phys., 210, 383 [NASA ADS] [CrossRef] [Google Scholar]
- Asplund, M., Grevesse, N., Sauval, A. J., & Scott, P. 2009, ARA&A, 47, 481 [NASA ADS] [CrossRef] [Google Scholar]
- Bai, T., & Ramaty, R. 1978, ApJ, 219, 705 [NASA ADS] [CrossRef] [Google Scholar]
- Balucinska-Church, M., & McCammon, D. 1992, ApJ, 400, 699 [NASA ADS] [CrossRef] [Google Scholar]
- Battaglia, M., & Benz, A. O. 2007, A&A, 466, 713 [NASA ADS] [CrossRef] [EDP Sciences] [Google Scholar]
- Brown, J. C., Emslie, A. G., Holman, G. D., et al. 2006, ApJ, 643, 523 [NASA ADS] [CrossRef] [Google Scholar]
- Dennis, B. R., & Pernak, R. L. 2009, ApJ, 698, 2131 [NASA ADS] [CrossRef] [Google Scholar]
- Emslie, A. G., Kontar, E. P., Krucker, S., & Lin, R. P. 2003, ApJ, 595, L107 [NASA ADS] [CrossRef] [Google Scholar]
- Fivian, M. D., Krucker, S., & Lin, R. P. 2009, ApJ, 698, L6 [NASA ADS] [CrossRef] [Google Scholar]
- Fletcher, L., & Hudson, H. S. 2002, Sol. Phys., 210, 307 [NASA ADS] [CrossRef] [Google Scholar]
- Henke, B. L., Lee, P., Tanaka, T. J., Shimabukuro, R. L., & Fujikawa, B. K. 1982, Atomic Data and Nuclear Data Tables, 27, 1 [Google Scholar]
- Hurford, G. J., Schmahl, E. J., Schwartz, R. A., et al. 2002, Sol. Phys., 210, 61 [NASA ADS] [CrossRef] [Google Scholar]
- Kasparová, J., Karlický, M., Kontar, E. P., Schwartz, R. A., & Dennis, B. R. 2005, Sol. Phys., 232, 63 [NASA ADS] [CrossRef] [Google Scholar]
- Kasparová, J., Kontar, E. P., & Brown, J. C. 2007, A&A, 466, 705 [NASA ADS] [CrossRef] [EDP Sciences] [Google Scholar]
- Kontar, E. P., Dickson, E., & Kasparová, J. 2008a, Sol. Phys., 252, 139 [NASA ADS] [CrossRef] [Google Scholar]
- Kontar, E. P., Hannah, I. G., & MacKinnon, A. L. 2008b, A&A, 489, L57 [NASA ADS] [CrossRef] [EDP Sciences] [Google Scholar]
- Kontar, E. P., MacKinnon, A. L., Schwartz, R. A., & Brown, J. C. 2006, A A, 446, 1157 [Google Scholar]
- Kosugi, T., Masuda, S., Makishima, K., et al. 1991, Sol. Phys., 136, 17 [NASA ADS] [CrossRef] [Google Scholar]
- Krucker, S., & Lin, R. P. 2002, Sol. Phys., 210, 229 [NASA ADS] [CrossRef] [Google Scholar]
- Krucker, S., Hurford, G. J., & Lin, R. P. 2003, ApJ, 595, L103 [NASA ADS] [CrossRef] [Google Scholar]
- Lin, R. P., Dennis, B. R., Hurford, G. J., et al. 2002, Sol. Phys., 210, 3 [Google Scholar]
- Liu, W., Liu, S., Jiang, Y. W., & Petrosian, V. 2006, ApJ, 649, 1124 [Google Scholar]
- Magdziarz, P., & Zdziarski, A. A. 1995, MNRAS, 273, 837 [NASA ADS] [CrossRef] [Google Scholar]
- Prato, M., Emslie, A. G., Kontar, E. P., Massone, A. M., & Piana, M. 2009, ApJ, 706, 917 [NASA ADS] [CrossRef] [Google Scholar]
- Saint-Hilaire, P., Krucker, S., & Lin, R. P. 2008, Sol. Phys., 250, 53 [NASA ADS] [CrossRef] [Google Scholar]
- Santangelo, N., Horstman, H., & Horstman-Moretti, E. 1973, Sol. Phys., 29, 143 [NASA ADS] [CrossRef] [Google Scholar]
- Schmahl, E. J., & Hurford, G. J. 2002, Sol. Phys., 210, 273 [NASA ADS] [CrossRef] [Google Scholar]
- Schmahl, E. J., Pernak, R. L., Hurford, G. J., Lee, J., & Bong, S. 2007, Sol. Phys., 240, 241 [NASA ADS] [CrossRef] [Google Scholar]
- Tomblin, F. F. 1972, ApJ, 171, 377 [NASA ADS] [CrossRef] [Google Scholar]
- Vernazza, J. E., Avrett, E. H., & Loeser, R. 1981, ApJS, 45, 635 [NASA ADS] [CrossRef] [Google Scholar]
- Xu, Y., Emslie, A. G., & Hurford, G. J. 2008, ApJ, 673, 576 [NASA ADS] [CrossRef] [Google Scholar]
- Zhang, J., & Huang, G. L. 2004, Sol. Phys., 219, 135 [NASA ADS] [CrossRef] [Google Scholar]
All Figures
| |
Figure 1:
The X-ray scatter distributions of the primary photons (red dots)
and the Compton back-scattered photons (blue dots) for a primary source
at h=1.0 Mm with d=1.5 Mm (
|
| Open with DEXTER | |
| In the text | |
|
|
Figure 2:
Spectral index dependency (panels a)- d)):
the source position shift is in the radial direction
due to albedo (source |
| Open with DEXTER | |
| In the text | |
Copyright ESO 2010
Current usage metrics show cumulative count of Article Views (full-text article views including HTML views, PDF and ePub downloads, according to the available data) and Abstracts Views on Vision4Press platform.
Data correspond to usage on the plateform after 2015. The current usage metrics is available 48-96 hours after online publication and is updated daily on week days.
Initial download of the metrics may take a while.