| Issue |
A&A
Volume 513, April 2010
|
|
|---|---|---|
| Article Number | A33 | |
| Number of page(s) | 5 | |
| Section | Planets and planetary systems | |
| DOI | https://doi.org/10.1051/0004-6361/200913535 | |
| Published online | 20 April 2010 | |
The activity of comet C/2007 D1 (LINEAR)
at 9.7 AU from the Sun![[*]](/icons/foot_motif.png)
E. Mazzotta Epifani1 - M. Dall'Ora1 - L. Di Fabrizio2 - J. Licandro3,4 - P. Palumbo5 - L. Colangeli1
1 - INAF-Osservatorio Astronomico di Capodimonte, via Moiariello 16,
80131 Napoli, Italy
2 - Fundación Galileo Galilei - INAF, Rambla José Ana Fernández Pérez,
7, 38712 Bre
![]() a Baja, TF, Spain
a Baja, TF, Spain
3 - Instituto de Astrofísica de Canarias, c/vía Láctea s/n, 38200, La
Laguna, Tenerife, Spain
4 - Departamento de Astrofísica, Universidad de La Laguna, 38205 La
Laguna, Tenerife, Spain
5 - Universitá Parthenope, Dip. Scienze Applicate, Centro Direzionale
Isola C4, 80143 Napoli, Italy
Received 23 October 2009 / Accepted 5 January 2010
Abstract
Aims. We report on the unusual distant activity of
the dynamically new comet C/2007 D1 (LINEAR), observed at ![]() AU
post-perihelion. This comet is particularly interesting because of its
quite large perihelion distance (
AU
post-perihelion. This comet is particularly interesting because of its
quite large perihelion distance (
![]() AU).
AU).
Methods. We analyse V and R
band images taken at
the TNG telescope to characterise the dust coma of the comet and
investigate its photometry, colours, and dust production.
Results. The colour of the dust is redder than the
Sun (
![]() at
the photometric aperture of radius 2.2
at
the photometric aperture of radius 2.2
![]() ). The
). The ![]() value is measured to be
value is measured to be ![]() cm
for an aperture of radius = 2.2
cm
for an aperture of radius = 2.2
![]() .
An upper limit to the cometary nucleus radius of
.
An upper limit to the cometary nucleus radius of ![]() km
is derived. A dust mass-loss rate of
km
is derived. A dust mass-loss rate of ![]() kg
s-1 is measured, which implies that C/2007 D1
(LINEAR) is a very active comet despite its quite large perihelion
distance.
kg
s-1 is measured, which implies that C/2007 D1
(LINEAR) is a very active comet despite its quite large perihelion
distance.
Key words: comets: individual: C/2007 D1 (LINEAR)
1 Introduction
Dynamically new comets (DNCs) are those observed on their first passage in the Solar System. They are thought to have formed in the region where giant planets presently orbit (the Jupiter-Neptune zone) and then been scattered towards the Oort cloud region, from which they are occasionally injected towards their first passage close to the Sun. These ``new'' comets were observed to be intrinsically more active at large distances from the Sun than the periodic (``old'') comets (Meech 1988, 1991). Very few DNCs have been studied at heliocentric distances r greater than 5-6 AU, where mechanisms other than the ``canonical'' sublimation of crystalline water ice must be invoked to explain cometary activity (Meech & Svoren 2004).
Table 1:
Photometry, ![]() ,
and colours of the comet C/2007 D1 (LINEAR).
,
and colours of the comet C/2007 D1 (LINEAR).
There is debate about the cause of activity at heliocentric distances both too far and cold for significant H2O sublimation. Several theoretical models of nucleus thermal evolution and internal differentiation (e.g., Tancredi et al. 1994; Coradini et al. 1997; Prialnik et al. 2004) show that even out to r = 5-6 AU there is sufficient gas flux from sublimating water ice to lift small grains off the surface. Beyond this region, the sublimation of hypervolatiles such as CO or CO2 has been invoked as the main driver for cometary activity, but it is unlikely that these more volatile ices condense out of the protosolar nebula in a pure form (Meech et al. 2009, and references therein). They will instead be trapped as gas in the cells of amorphous water ice (Laufer et al. 1987; Capria et al. 2000a,b), and post-perihelion activity beyond 5 AU could be caused by perihelion heat wave that penetrates into volatile-rich depths in the nucleus. This causes the amorphous-to-crystalline water ice transition (Notesco et al. 2003; Bar-Nun & Laufer 2003) and the following release of hypervolatile gas. Anyway, the discovery of active comets that have never been close to the Sun enough to experience significant heating requires a different mechanism.
This is exactly the case for comet C/2007 D1 (LINEAR)
(hereinafter C/2007 D1) (Lehmann et al. 2007),
which was discovered in February 2007 in the course of the LINEAR
(Lincoln Near-Earth Asteroid Research) project (Stokes et al. 2000). It is
recognised as a dynamically new comet coming directly from the Oort
cloud on an open orbit (e
= 1.001) with inclination ![]() and perihelion distance of q
= 8.79 AU (passed on June 2007). We observed it in the course
of
an observational program designed to investigate the distant dust
environment of a number of long period comets at very large
heliocentric distances, beyond the ``water'' zone.
and perihelion distance of q
= 8.79 AU (passed on June 2007). We observed it in the course
of
an observational program designed to investigate the distant dust
environment of a number of long period comets at very large
heliocentric distances, beyond the ``water'' zone.
2 Observations and data reduction
The comet C/2007 D1 was observed on May 29, 2009 with the
3.52 m
Telescopio Nazionale Galileo (TNG) at the Observatorio del Roque de los
Muchachos (La Palma, Canary Islands), when it was at the heliocentric
distance of r = 9.7 AU and the geocentric
distance of ![]() AU.
The comet was at the phase angle
AU.
The comet was at the phase angle ![]() and had a position angle (PA) of the extended Sun-target radius vector
of 117.5
and had a position angle (PA) of the extended Sun-target radius vector
of 117.5![]() .
.
The images were obtained with the DOLORES (Device Optimised
for the LOw
RESolution) instrument, a focal reducer instrument installed at the
Nasmyth B focus of the TNG. The detector is a
![]() E2V 4240 thinned back-illuminated, deep-depleted, Astro-BB coated CCD
with a pixel size of 13.5
E2V 4240 thinned back-illuminated, deep-depleted, Astro-BB coated CCD
with a pixel size of 13.5 ![]() m. The scale is 0.252 arcsec/px, which
yields a field of view of about
m. The scale is 0.252 arcsec/px, which
yields a field of view of about ![]() arcmin.
The instrument was equipped with the broadband filters V
and R of the Johnson-Cousin system.
arcmin.
The instrument was equipped with the broadband filters V
and R of the Johnson-Cousin system.
![\begin{figure}
\par\includegraphics[width=6.5cm,clip]{aa13535-09-fig1a.ps}\inclu...
...cludegraphics[width=6.5cm,clip]{aa13535-09-fig1d.ps}\vspace*{1.5mm}
\end{figure}](/articles/aa/full_html/2010/05/aa13535-09/img22.png)
|
Figure 1:
Coadded images of the comet C/2007 D1 (LINEAR) (sequence of first 5
single images, see text) in the V ( top)
and R ( bottom) filters,
together with the corresponding processed images with Laplace filter (
right panels) to enhance any high frequency spatial
structure. The linear scale for all images is |
| Open with DEXTER | |
Several long (600 s) exposures were obtained for the object,
the telescope tracking at the non-sidereal rate corresponding to the
predicted motion of the comet, with the following sequence: RRRRRVVVVVRRRVVV,
for a total of 8 R and 8 V
exposures. All the images were corrected for overscan, bias, and
flat-fielding in the standard manner, using tools available in IRAF![]() .
The overscan level was estimated from the overscan section of each
scientific image, while the bias value was obtained from an average of
several zero-exposure frames, each of them being corrected for the
overscan, taken at the beginning of the night. A masterflat for each
filter was obtained by averaging of several twilight exposures,
individually corrected for overscan and bias. To optimize the observing
time spent on the scientific targets, standard fields were observed at
only a single airmass to derive the photometric zero-points, while
extinction coefficents were estimated directly from the scientific
frames, which cover an airmass range between 1.13 and 1.50, and between
1.06 and 1.37 in the V and R
bands, respectively. To this aim, aperture stellar photometry was
performed on each scientific image using the DAOPHOT/ALLSTAR package
(Stetson 1987).
Instrumental magnitudes were therefore compared with DAOMATCH/DAOMASTER
(Stetson 1993).
This package computes a robust weighted average zero-point difference
between individual frames: since all the images in a given filter have
the same exposure time, the differences in the zero-point are mainly
related to the different airmass. The slope of the instrumental zero
points plotted against the airmass therefore corresponds to the
extinction coefficient. Photometric zero-points were finally computed
from the
Landolt's fields SA104 350 and PG1047 (Landolt 1992).
.
The overscan level was estimated from the overscan section of each
scientific image, while the bias value was obtained from an average of
several zero-exposure frames, each of them being corrected for the
overscan, taken at the beginning of the night. A masterflat for each
filter was obtained by averaging of several twilight exposures,
individually corrected for overscan and bias. To optimize the observing
time spent on the scientific targets, standard fields were observed at
only a single airmass to derive the photometric zero-points, while
extinction coefficents were estimated directly from the scientific
frames, which cover an airmass range between 1.13 and 1.50, and between
1.06 and 1.37 in the V and R
bands, respectively. To this aim, aperture stellar photometry was
performed on each scientific image using the DAOPHOT/ALLSTAR package
(Stetson 1987).
Instrumental magnitudes were therefore compared with DAOMATCH/DAOMASTER
(Stetson 1993).
This package computes a robust weighted average zero-point difference
between individual frames: since all the images in a given filter have
the same exposure time, the differences in the zero-point are mainly
related to the different airmass. The slope of the instrumental zero
points plotted against the airmass therefore corresponds to the
extinction coefficient. Photometric zero-points were finally computed
from the
Landolt's fields SA104 350 and PG1047 (Landolt 1992).
Despite the very large heliocentric distance, C/2007 D1 was easily identificable and appeared active in all the single exposures. To increase the SNR for the image analysis, we decided to coadd the R and V images in order to obtain two ``final'' images for each filter, one for the sequence of the first 5 and one for the last 3 exposures. We decided not to combine all the 8 images into one since the comet significantly changed its airmass during the whole sequence (see above). The position of C/2007 D1 optocentre in each single image selected for the coadding was determined by fitting a two-dimensional Gaussian to the innermost (64 and 81 for the R and V filter, respectively) pixels of the coma. The images were then recentred using this optocentre and summed. Sky correction was performed by subtracting a first-order polynomial sky approximation computed from the pixel areas containing no stars. The image processing and analysis was performed with the aid of the ESO's Munich Image Data Analysis System (MIDAS 1998). Two examples of the final coadded images are shown in Fig. 1 (obtained from the first 5 exposures for both filters).
3 Observational results
Despite its large heliocentric distance at the time of observation (r
= 9.7 AU), the comet C/2007 D1 appears to be a very active
object
with a well-developed coma and a broad tail-like structure, extending
in the S-E quadrant approximately in the anti-solar direction (PA of
the comet: 117.5![]() ).
The final images obtained in both filters were processed using a
Laplacian filtering (Boehnhardt & Birkle 1994)
to search for any non-spherical structure (e.g., jets, fans) in the
coma morphology. This method is sensitive to gradient changes on
different scales depending on the width of the spatial filter applied.
No clear structure was found, as shown in Fig. 1 for two of the
obtained final (coadded) images.
).
The final images obtained in both filters were processed using a
Laplacian filtering (Boehnhardt & Birkle 1994)
to search for any non-spherical structure (e.g., jets, fans) in the
coma morphology. This method is sensitive to gradient changes on
different scales depending on the width of the spatial filter applied.
No clear structure was found, as shown in Fig. 1 for two of the
obtained final (coadded) images.
The magnitudes of the comet, derived in different optical
apertures centred in the optocentre, are summarised in Table 1.
For each photometric aperture, these magnitude values are obtained as a
weighted mean between the two values derived from the 2 images
(coadditions of the first 5 exposures and the last 3). The photometric R
magnitude can be used to estimate the upper limit to the geometric
cross-section of the cometary nucleus, using the expression of Russell (1916), derived
for asteroids observed at large phase angle and conveniently
reformulated by Jewitt (1991),
which, in the case of a spherical object, is given by
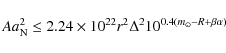
|
(1) |
where A is the geometric albedo,
The data obtained during the observations allow us to perform
an
analysis (at least partially) of the coma colours of C/2007 D1.
Table 1
summarises the (V - R)
colours obtained at different optical apertures centred in the
optocentre. The dust colour of the coma is slightly redder than the Sun
at all nucleus distances, and is
![]() at the photometric aperture of
at the photometric aperture of ![]() .
The colour of the dust can also be computed in terms of the reddening
(see e.g. Lara et al. 2003),
which indicates the percentage of change in the strength of the
continuum per 1000
.
The colour of the dust can also be computed in terms of the reddening
(see e.g. Lara et al. 2003),
which indicates the percentage of change in the strength of the
continuum per 1000 ![]() (when far from the Sun, the broadband filters V and
R used here are relatively free from strong gas
emission bands) given by
(when far from the Sun, the broadband filters V and
R used here are relatively free from strong gas
emission bands) given by
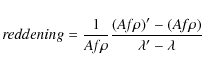
|
(2) |
where
Table 2: Model dust mass loss-rate of comet C/2007 D1 (LINEAR).
The ![]() value [cm] (A'Hearn et al. 1984),
where A is the average grain albedo, f
the filling factor in the aperture field of view, and
value [cm] (A'Hearn et al. 1984),
where A is the average grain albedo, f
the filling factor in the aperture field of view, and ![]() the linear radius of the aperture at the comet, i.e., the sky-plane
radius, is usually used as a proxy for the cometary dust production.
When the cometary coma is in a steady-state,
the linear radius of the aperture at the comet, i.e., the sky-plane
radius, is usually used as a proxy for the cometary dust production.
When the cometary coma is in a steady-state, ![]() is an aperture-independent parameter. It is formulated to take into
account the solar flux scattered by the cometary dust towards the
observer, and can be derived from the calculated photometric dust coma
magnitude
is an aperture-independent parameter. It is formulated to take into
account the solar flux scattered by the cometary dust towards the
observer, and can be derived from the calculated photometric dust coma
magnitude
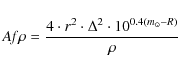
|
(3) |
where
The very high values of the cometary ![]() (e.g., 1983
(e.g., 1983 ![]() 81 cm for an aperture of
81 cm for an aperture of ![]() )
are consistent with a very active object. To obtain a first-order
quantitative
estimate of the dust mass-loss rate by comet C/2007 D1, we decided to
apply the same method used by
Jewitt (2009)
to compute the dust production rate of active Centaurs in the region
between 5 and 12 AU.
)
are consistent with a very active object. To obtain a first-order
quantitative
estimate of the dust mass-loss rate by comet C/2007 D1, we decided to
apply the same method used by
Jewitt (2009)
to compute the dust production rate of active Centaurs in the region
between 5 and 12 AU.
The method consists of computing the apparent magnitude of the
pure coma ![]() in an annulus between the inner
in an annulus between the inner ![]() (as defined above) and a conveniently chosen outer
(as defined above) and a conveniently chosen outer ![]() as
as ![]() ,
where R and R' are the
magnitudes within apertures of radii
,
where R and R' are the
magnitudes within apertures of radii ![]() and
and ![]() ,
respectively, and then computing the total cross-section of the coma
dust particles in the projected annulus. A value of
,
respectively, and then computing the total cross-section of the coma
dust particles in the projected annulus. A value of ![]() was adopted, derived from the aperture photometry applied to the final
(coadded) images. The dust cross-section
was adopted, derived from the aperture photometry applied to the final
(coadded) images. The dust cross-section ![]() derived from the photometry is related to the dust mass
derived from the photometry is related to the dust mass ![]() by means of the dust size distribution, for which a good approximation
is obtained by setting a power
law distribution with q = 3.5 in a dust grain size
range between
by means of the dust size distribution, for which a good approximation
is obtained by setting a power
law distribution with q = 3.5 in a dust grain size
range between ![]() m and a+
= 1 cm (Grün et al. 2001). The relation
is given by
m and a+
= 1 cm (Grün et al. 2001). The relation
is given by ![]() ,
where the size of the average dust grain scatterer is
,
where the size of the average dust grain scatterer is ![]() m,
consistent with the observation that the dust coma of C/2007 D1 is
reddish compared to the Sun (see above).
m,
consistent with the observation that the dust coma of C/2007 D1 is
reddish compared to the Sun (see above).
Following Jewitt (2009),
the dust-loss rate is derived by considering the time of residence ![]() of dust grains in the (projected) annulus between
of dust grains in the (projected) annulus between ![]() and
and ![]() equal to
equal to
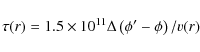
|
(4) |
where
4 Discussion and conclusions
The results described in the previous section are consistent with the
properties of a very active comet. When considering a proxy for the
dust production rate, the comet C/2007 D1 is found to have an ![]() value
of the same order or even larger than that measured at lower
heliocentric distances for some of the more active LPCs: e.g., C/2003
O1 (LONEOS), from
value
of the same order or even larger than that measured at lower
heliocentric distances for some of the more active LPCs: e.g., C/2003
O1 (LONEOS), from ![]() 600
to
600
to ![]() 1300 cm
at 7.02 AU (Mazzotta Epifani et al. 2009; Meech
et al. 2009),
and C/2001 G1 (LONEOS),
1300 cm
at 7.02 AU (Mazzotta Epifani et al. 2009; Meech
et al. 2009),
and C/2001 G1 (LONEOS), ![]() 1800
cm at 8.3 AU (Meech et al. 2009).
1800
cm at 8.3 AU (Meech et al. 2009).
The first-order photometric model (Jewitt 2009)
for the determination of the dust-loss rate that we applied to the
images, by using a realistic value of the dust grain velocity (see
above), inferred a quite high value of
![]() kg s-1.
This value is indicative of a very active comet, similar to the
``paradigm'' comet C/1995 O1 (Hale-Bopp), for which a
kg s-1.
This value is indicative of a very active comet, similar to the
``paradigm'' comet C/1995 O1 (Hale-Bopp), for which a ![]() kg s-1
was obtained by modelling at r = 13 AU
(Fulle et al. 1998).
For comparison, by applying the first-order photometric model to the
active Centaur 29P/S-W 3 at r = 5.8 AU,
Jewitt (2009)
obtained a dust production rate of
kg s-1
was obtained by modelling at r = 13 AU
(Fulle et al. 1998).
For comparison, by applying the first-order photometric model to the
active Centaur 29P/S-W 3 at r = 5.8 AU,
Jewitt (2009)
obtained a dust production rate of ![]() kg s-1,
while the application of the inverse tail model by Fulle
et al. (1992),
which reconstructed the dynamical dust environment (ejection velocity,
dust-loss rate, and reliable dust-grain size-distribution) of the
Centaur, resulted in a constant value of the dust production rate of
kg s-1,
while the application of the inverse tail model by Fulle
et al. (1992),
which reconstructed the dynamical dust environment (ejection velocity,
dust-loss rate, and reliable dust-grain size-distribution) of the
Centaur, resulted in a constant value of the dust production rate of
![]() kg s-1
during the three years spent by the Centaur at about the same
heliocentric distance. To a first-order approximation, if we apply the
same scaling factor of an order of magnitude to the upper limit to the
dust-loss rate (
kg s-1
during the three years spent by the Centaur at about the same
heliocentric distance. To a first-order approximation, if we apply the
same scaling factor of an order of magnitude to the upper limit to the
dust-loss rate (
![]() ,
see Table 2),
we would obtain for comet C/2007 D1 a dust-loss rate of
,
see Table 2),
we would obtain for comet C/2007 D1 a dust-loss rate of ![]() 500 kg s-1,
very similar to the value obtained using
the photometric model.
500 kg s-1,
very similar to the value obtained using
the photometric model.
We conclude that the post-perihelion activity of comet C/2007 D1 is very intense, despite, in its recent orbital history, it never having passed at heliocentric distances smaller than r= 8.8 AU. This poses interesting constraints on theoretical models that should be able to explain the distant activity of minor bodies orbiting in the outer part of the Solar System.
AcknowledgementsWe gratefully acknowledge funding from Italian Space Agency (ASI) under contract I/015/07/0. J.L. gratefully acknowledges support from the Spanish ``Ministerio de Ciencia e Innovación'' project AYA2008-06202-C03-02.
References
- Abell, P. A., Fernandez, Y. R., Pravec, P., et al. 2003, in Lunar and Planetary Science XXXIV, Abstract # 1253 (Houston: Lunar and Planetary Institute) [Google Scholar]
- A'Hearn, M. F., Schleicher, D. G., Feldman, P. D., Millis, R. L., & Thompson, D. T. 1984, AJ, 89, 579 [NASA ADS] [CrossRef] [Google Scholar]
- Bar-Nun, A., & Laufer D. 2003, Icarus, 161, 157 [NASA ADS] [CrossRef] [Google Scholar]
- Biver, N., Bockelée-Morvan, D., Colom, P., et al. 2002, EM&P 90, 1, 5 [NASA ADS] [Google Scholar]
- Boehnhardt, H., & Birkle, K. 1994, A&A, 107, 101 [Google Scholar]
- Capria, M. T., Coradini, A., De Sanctis, M. C., & Orosei, R. 2000a, A&A, 357, 359 [NASA ADS] [Google Scholar]
- Capria, M. T., Coradini, A., De Sanctis, M. C., & Orosei, R. 2000b, AJ, 119, 3112 [NASA ADS] [CrossRef] [Google Scholar]
- Coradini, A., Capaccioni, F., Capria, M. T., et al. 1997, Icarus, 129, 337 [NASA ADS] [CrossRef] [Google Scholar]
- Fulle, M. 1992, Nature, 359, 6390, 42 [NASA ADS] [CrossRef] [Google Scholar]
- Fulle, M., Cremonese, G., & Bóhm, C. 1998, AJ, 116, 1470 [NASA ADS] [CrossRef] [Google Scholar]
- Grün, E., Hanner, M. S., Peschke, S. B., et al., 2001, A&A, 377, 1098 [NASA ADS] [CrossRef] [EDP Sciences] [Google Scholar]
- Holmberg, J., Flynn, C., & Portinari, L. 2006, MNRAS, 367, 449 [NASA ADS] [CrossRef] [Google Scholar]
- Jewitt, D. C. 1991, in Comets in the Post-Halley Era, ed. R. L. Newburn, M. Neugebauer, & J. Rahe (Dordrecht: Kluwer Acad. Publ.), 1 [Google Scholar]
- Jewitt, D. C. 2009, AJ, 137, 4296 [NASA ADS] [CrossRef] [Google Scholar]
- Jorda, L., Lamy, P., Groussin, O., et al. 2000, in Proceedings of ISO Beyond Point Sources: Studies of Extended Infrared Emission, ed. R. J. Laureijs et al., ESA-SP, 455, Noordwijk, The Netherlands [Google Scholar]
- Lamy, P. L., Toth, I., Fernández, Y. R., & Weaver, H. A. 2004, in Comets II, ed. M. Festou, H. U. Keller, & H. A. Weaver (Tucson: Univ. Arizona Press) [Google Scholar]
- Landolt, A. U. 1992, AJ, 104, 1, 340 [NASA ADS] [CrossRef] [Google Scholar]
- Lara, L.-M., Licandro, J., Oscoz, A., & Motta, V. 2003, A&A, 399, 763 [NASA ADS] [CrossRef] [EDP Sciences] [Google Scholar]
- Lara, L.-M., Tozzi, G. P., Boehnhardt, H., DiMartino, M., & Schulz, R. 2004, A&A, 422, 717 [NASA ADS] [CrossRef] [EDP Sciences] [Google Scholar]
- Laufer, D., Kochavi, E., & Bar-Nun, A. 1987, Phys. Rev. B, 36, 9219 [NASA ADS] [CrossRef] [Google Scholar]
- Lehmann, G., Ticha, J., Tichy, M., et al. 2007, MPEC, 2007-D22 [Google Scholar]
- Mazzotta Epifani, E., Palumbo, P., Capria, M. T., et al. 2009, A&A, 502, 355 [NASA ADS] [CrossRef] [EDP Sciences] [Google Scholar]
- Meech, K. J. 1988, BAAS, 20, 835 [NASA ADS] [Google Scholar]
- Meech, K. J. 1991, in Comets in the Post-Halley Era, ed. R. L. Newburn Jr., M. Neugebauer, & J. Rahe (Kluwer Acad. Pub.) [Google Scholar]
- Meech, K. J., & Svoren, J. 2004, in Comets II, ed. M. Festou, H. U. Keller, & H. A. Weaver (Tucson: Univ. Arizona Press) [Google Scholar]
- Meech, K. J., Pittichova, J., Bar-Nun, A., et al. 2009, 201, 2, 719 [Google Scholar]
- Notesco, G. A., Bar-Nun, A., & Owen, T. 2003, Icarus, 162, 183 [NASA ADS] [CrossRef] [Google Scholar]
- Prialnik, D., Benkhoff, J., & Podolak, M. 2004, in Comets II, ed. M. Festou, H. U. Keller, & H. A. Weaver (Tucson: Arizona Press) [Google Scholar]
- Probstein, R. F. 1969, in Problems of Hydrodynamics and Continuum Mechanics, ed. F. Bisshopp et al. (Philadelphia: Soc. Indust. Appl. Math.), 568 [Google Scholar]
- Russell, H. N. 1916, ApJ, 43, 173 [NASA ADS] [CrossRef] [Google Scholar]
- Stetson, P. B. 1987, PASP, 99, 191 [NASA ADS] [CrossRef] [Google Scholar]
- Stetson, P. B. 1993, Stellar Photometry - Current Techniques and Future Developments, IAU Colloq., 136, 291 [Google Scholar]
- Stokes, G. H., Evans, J. B., Viggh, H. E. M., Shelly F. C., & Pearce E. C. 2000, Icarus, 148, 21 [NASA ADS] [CrossRef] [Google Scholar]
- Tancredi, G., Rickman, H., & Greemberg, J. M. 1994, A&A, 286, 659 [NASA ADS] [Google Scholar]
- Tozzi, G. P., Boehnhardt, H., & Lo Curto, G. 2003, A&A, 398, L41 [NASA ADS] [CrossRef] [EDP Sciences] [Google Scholar]
Footnotes
- ... Sun
- Based on observations collected at the Italian Telescopio Nazionale Galileo (TNG), operated on the island of La Palma by the Centro Galileo Galilei of the INAF (Istituto Nazionale di Astrofisica) at the Spanish Observatorio del Roque de los Muchachos of the Instituto de Astrofísica de Canarias.
- ... IRAF
- IRAF is distributed by the National Optical Astronomical Observatory, which is operated by the Association of Universities for Research in Astronomy, Inc., under cooperative agreement with the National Science Foundation.
All Tables
Table 1:
Photometry, ![]() ,
and colours of the comet C/2007 D1 (LINEAR).
,
and colours of the comet C/2007 D1 (LINEAR).
Table 2: Model dust mass loss-rate of comet C/2007 D1 (LINEAR).
All Figures
|
|
Figure 1:
Coadded images of the comet C/2007 D1 (LINEAR) (sequence of first 5
single images, see text) in the V ( top)
and R ( bottom) filters,
together with the corresponding processed images with Laplace filter (
right panels) to enhance any high frequency spatial
structure. The linear scale for all images is |
| Open with DEXTER | |
| In the text | |
Copyright ESO 2010
Current usage metrics show cumulative count of Article Views (full-text article views including HTML views, PDF and ePub downloads, according to the available data) and Abstracts Views on Vision4Press platform.
Data correspond to usage on the plateform after 2015. The current usage metrics is available 48-96 hours after online publication and is updated daily on week days.
Initial download of the metrics may take a while.