| Issue |
A&A
Volume 513, April 2010
|
|
|---|---|---|
| Article Number | A16 | |
| Number of page(s) | 11 | |
| Section | Galactic structure, stellar clusters, and populations | |
| DOI | https://doi.org/10.1051/0004-6361/200811245 | |
| Published online | 15 April 2010 | |
Study of Hubble Space Telescope counterparts to Chandra X-ray sources in the globular cluster M 71
R. H. H. Huang1 - W. Becker1 - P. D. Edmonds2 - R. F. Elsner3 - C. O. Heinke4 - B. C. Hsieh5
1 - Max-Planck-Institut für extraterrestrische Physik,
Giessenbachstrasse 1, 85748 Garching, Germany
2 - Harvard-Smithsonian Center for Astrophysics, Cambridge, MA 02138,
USA
3 - NASA Marshall Space Flight Center, Huntsville, AL 35812, USA
4 - Department of Physics, University of Alberta, Edmonton, Alberta,
Canada
5 - Institute of Astronomy and Astrophysics, Academia Sinica, Taipei
10617, Taiwan
Received 28 October 2008 / Accepted 2 December 2009
Abstract
Aims. We report on archival Hubble Space Telescope
(HST) observations of the globular cluster M 71
(NGC 6838).
Methods. These observations, covering the core of
the globular cluster, were performed by the Advanced Camera for Surveys
(ACS) and the Wide Field Planetary Camera 2 (WFPC2). Inside the
half-mass radius (
![]() )
of M 71, we find 33 candidate optical counterparts to 25 out
of 29 Chandra X-ray sources, while 6 possible optical counterparts to 4
X-ray sources are found outside the half-mass radius.
)
of M 71, we find 33 candidate optical counterparts to 25 out
of 29 Chandra X-ray sources, while 6 possible optical counterparts to 4
X-ray sources are found outside the half-mass radius.
Results. Based on the X-ray and optical properties
of the identifications, we find 1 certain and 7 candidate cataclysmic
variables (CVs). We also classify 2 X-ray sources as certain and 12 as
potential chromospherically active binaries (ABs), respectively. The
only star in the error circle of the known millisecond pulsar (MSP) is
inconsistent with being the optical counterpart.
Conclusions. The number of X-ray faint sources with
![]() erg s-1
(0.5-6.0 keV) found in M 71 is higher than
extrapolations from other clusters on the basis of either collision
frequency or mass. Since the core density of M 71 is
relatively low, we suggest that those CVs and ABs are primordial in
origin.
erg s-1
(0.5-6.0 keV) found in M 71 is higher than
extrapolations from other clusters on the basis of either collision
frequency or mass. Since the core density of M 71 is
relatively low, we suggest that those CVs and ABs are primordial in
origin.
Key words: globular clusters: individual: M 71 globular clusters: individual: NGC 6838
1 Introduction
There are 158 Galactic globular clusters (GGCs) found in the halo of our galaxy, and they typically contain 104-107 stars. They are very old and dense star systems that are tightly bound by gravity, which gives them their spherical shapes and relatively high stellar density toward the center. The dense stellar environment in globular clusters triggers various dynamical interactions, i.e., exchanges in encounters with binaries, direct collisions, destruction of binaries, and tidal capture. These dynamical interactions not only can change the evolution of individual stars, but can also produce tight binary systems (see, e.g., Ashman & Zepf 1998; Verbunt & Lewin 2004, for review).
One of the most powerful ways to probe the binary content of
globular clusters is by studying the X-ray source population. In the
early 1970 s, X-ray sources with luminosity greater than
![]() were
first detected by using the Uhuru and OSO-7 Observatories.
Following the Einstein and ROSAT era, the number of faint X-ray sources
(
were
first detected by using the Uhuru and OSO-7 Observatories.
Following the Einstein and ROSAT era, the number of faint X-ray sources
(
![]() )
was dramatically increased. Those bright X-ray sources have been
identified with low-mass X-ray binaries (LMXBs; Grindlay et al. 1984),
while the identification of the weaker sources remained limited by low
photon statistics and insufficient spatial resolution. The launch of
the Chandra X-ray Observatory ushered in a new age of studying the
crowded centers of Galactic globular clusters
with far greater sensitivity and resolving power than ever before
(e.g., Grindlay
et al. 2001a,b). With the aid of the
Hubble Space Telescope (HST), many of these faint X-ray sources were
identified as quiescent low-mass X-ray binaries (qLMXBs; in which a
neutron star accretes matter from its companion at a low rate),
cataclysmic variables (CVs; in which a white dwarf accretes from its
low-mass companion), and millisecond pulsars (MSPs), as well as
chromospherically active binaries (ABs; e.g., RS CVn and BY Dra
systems)
(e.g., Heinke
et al. 2005; Bassa et al. 2004; Edmonds
et al. 2003b; Kong et al. 2006; Pooley
et al. 2002; Edmonds et al. 2003a;
Bassa
et al. 2008; Lugger et al. 2007; Grindlay
et al. 2001b).
)
was dramatically increased. Those bright X-ray sources have been
identified with low-mass X-ray binaries (LMXBs; Grindlay et al. 1984),
while the identification of the weaker sources remained limited by low
photon statistics and insufficient spatial resolution. The launch of
the Chandra X-ray Observatory ushered in a new age of studying the
crowded centers of Galactic globular clusters
with far greater sensitivity and resolving power than ever before
(e.g., Grindlay
et al. 2001a,b). With the aid of the
Hubble Space Telescope (HST), many of these faint X-ray sources were
identified as quiescent low-mass X-ray binaries (qLMXBs; in which a
neutron star accretes matter from its companion at a low rate),
cataclysmic variables (CVs; in which a white dwarf accretes from its
low-mass companion), and millisecond pulsars (MSPs), as well as
chromospherically active binaries (ABs; e.g., RS CVn and BY Dra
systems)
(e.g., Heinke
et al. 2005; Bassa et al. 2004; Edmonds
et al. 2003b; Kong et al. 2006; Pooley
et al. 2002; Edmonds et al. 2003a;
Bassa
et al. 2008; Lugger et al. 2007; Grindlay
et al. 2001b).
The globular cluster M 71 (NGC 6838) lies
close to the Galactic plane with Galactic longitude
![]() and latitude
and latitude
![]() .
Similarly to 47 Tuc, it is a fairly metal-rich globular
cluster with metallicity of [Fe/H] = - 0.73. Its
relatively small distance (
.
Similarly to 47 Tuc, it is a fairly metal-rich globular
cluster with metallicity of [Fe/H] = - 0.73. Its
relatively small distance (![]() kpc) to Earth and
low central luminosity density (
kpc) to Earth and
low central luminosity density (
![]() )
makes M 71 a good target for both optical and X-ray
observations. The core, half-mass, and tidal radii are
)
makes M 71 a good target for both optical and X-ray
observations. The core, half-mass, and tidal radii are ![]() = 0
= 0
![]() 63,
63,
![]() = 1
= 1
![]() 65,
and
65,
and ![]() = 8
= 8
![]() 96,
respectively. M 71 shows no evidence of core collapse. Its
moderate optical reddening EB-V
= 0.25 may be converted into a nominal X-ray absorption column
of
96,
respectively. M 71 shows no evidence of core collapse. Its
moderate optical reddening EB-V
= 0.25 may be converted into a nominal X-ray absorption column
of
![]() (Predehl & Schmitt 1995).
The aforementioned parameters related to M 71 were obtained
from Harris (1996, updated 2003
(Predehl & Schmitt 1995).
The aforementioned parameters related to M 71 were obtained
from Harris (1996, updated 2003![]() ).
).
Table 1:
Spectral fits of the X-ray sources with source counts
![]() .
.
In this work we report on archival Chandra and HST
observations of the globular cluster M 71. We obtained a
52.4-kilosecond Chandra observation of M 71 taken with the
Advanced CCD Imaging Spectrometer (ACIS), reaching the limiting X-ray
luminosities of
![]() and
and ![]() in the energy ranges of 0.3-8.0 and 0.5-2.5 keV, respectively.
In Elsner et al. (2008),
we reported the identification of 29 X-ray sources within the
cluster half-mass radius, including the known millisecond pulsar PSR
J1953+1846A (M 71A), and their X-ray properties, and found
that
in the energy ranges of 0.3-8.0 and 0.5-2.5 keV, respectively.
In Elsner et al. (2008),
we reported the identification of 29 X-ray sources within the
cluster half-mass radius, including the known millisecond pulsar PSR
J1953+1846A (M 71A), and their X-ray properties, and found
that ![]() of these 29 sources are likely to be associated with
M 71 from a radial distribution analysis.
The present paper extends our study of the X-ray sources in
M 71 by using archival HST data to identify optical
counterparts to the majority of M 71's X-ray sources,
improving our understanding of their nature.
of these 29 sources are likely to be associated with
M 71 from a radial distribution analysis.
The present paper extends our study of the X-ray sources in
M 71 by using archival HST data to identify optical
counterparts to the majority of M 71's X-ray sources,
improving our understanding of their nature.
In Sect. 2 we discuss the Chandra X-ray observations and spectral analysis. HST observations, data reduction, and analysis are described in Sect. 3. In Sect. 4 we present the source identification. A discussion and comparison with other globular clusters is given in Sect. 5.
![\begin{figure}
\par\includegraphics[width=12.5cm,clip]{11245fg1.eps}
\vspace*{2mm}
\end{figure}](/articles/aa/full_html/2010/05/aa11245-08/img38.png)
|
Figure 1:
Chandra ACIS-S3 image of the globular cluster M 71 within the
energy range of 0.3-8.0 keV. The large circles are centered on
the nominal center of the cluster and have radii |
| Open with DEXTER | |
2 X-ray observations
Elsner et al. (2008)
described the Chandra X-ray observations of M 71. We note here
some relevant information for our analysis and extend the spectral
fitting in this paper to test alternative models besides the power laws
considered by Elsner
et al. (2008).
Only seven of the 29 detected X-ray sources have enough counts
(six sources with at least 50 source counts and one known MSP with
37.5 source counts![]() )
to warrant a detailed spectral analysis. We used the CIAO tool dmextract
to extract spectra of the brighter sources and the source-free
background regions near to those sources. Response files were
constructed by using the CIAO tool mkacisrmf and mkarf.
The extracted spectra were binned with at least 5 source
counts per bin. Background-subtracted spectral modeling was performed
with XSPEC using data in the energy band 0.3-8.0 keV. To
characterize the spectra of these sources, we fitted each of the
7 brightest X-ray sources with several different models (i.e.,
power law (PL), thermal bremsstrahlung (TB), and blackbody (BB))
by using Cash (1979)
statistics. Assuming all the X-ray sources within the half-mass radius
are associated with the globular cluster M 71, we fixed the
hydrogen column density to the value of
)
to warrant a detailed spectral analysis. We used the CIAO tool dmextract
to extract spectra of the brighter sources and the source-free
background regions near to those sources. Response files were
constructed by using the CIAO tool mkacisrmf and mkarf.
The extracted spectra were binned with at least 5 source
counts per bin. Background-subtracted spectral modeling was performed
with XSPEC using data in the energy band 0.3-8.0 keV. To
characterize the spectra of these sources, we fitted each of the
7 brightest X-ray sources with several different models (i.e.,
power law (PL), thermal bremsstrahlung (TB), and blackbody (BB))
by using Cash (1979)
statistics. Assuming all the X-ray sources within the half-mass radius
are associated with the globular cluster M 71, we fixed the
hydrogen column density to the value of
![]() from optical extinction to attempt spectral fitting.
from optical extinction to attempt spectral fitting.
In Table 1,
Col. 1 shows the Chandra source name given in Elsner et al. (2008),
and Col. 2 lists
the spectral model we used. (We omitted the models that could not
provide any physically acceptable description of the observed spectra.)
Column 3 gives the minimum number of counts used to group the
spectral data for fitting, column 4 shows the best-fit photon
index (![]() )
or the temperature (keV), Cols. 5, 6
gives the C-statistic and the number of PHA
)
or the temperature (keV), Cols. 5, 6
gives the C-statistic and the number of PHA![]() bins, and the last column lists the unabsorbed X-ray flux in units of
bins, and the last column lists the unabsorbed X-ray flux in units of
![]() in the energy bands 0.3-8.0 and 0.5-2.5 keV.
in the energy bands 0.3-8.0 and 0.5-2.5 keV.
The X-ray spectra discussed here can help us classify the
faint X-ray sources.
The brightest X-ray sources with
![]() in the energy band 0.5-2.5 keV and soft spectra (
in the energy band 0.5-2.5 keV and soft spectra (
![]() )
are mostly quiescent low-mass X-ray binaries (qLMXBs; Verbunt et al. 2008).
None of the X-ray sources in our sample shows this characteristic, and
we conclude that M 71 does not contain this kind of binary
system.
Cataclysmic variables (CVs) usually have hard spectra (power-law photon
indices
)
are mostly quiescent low-mass X-ray binaries (qLMXBs; Verbunt et al. 2008).
None of the X-ray sources in our sample shows this characteristic, and
we conclude that M 71 does not contain this kind of binary
system.
Cataclysmic variables (CVs) usually have hard spectra (power-law photon
indices ![]() )
and their X-ray luminosities are typically between a few 1030
and a few
)
and their X-ray luminosities are typically between a few 1030
and a few ![]() .
Most faint (
.
Most faint (
![]() )
sources with soft spectra belong to chromospherically active binaries
(ABs; Verbunt et al. 2008).
Looking at the brightest seven X-ray sources within the half-mass
radius, we see that three have soft spectra (
)
sources with soft spectra belong to chromospherically active binaries
(ABs; Verbunt et al. 2008).
Looking at the brightest seven X-ray sources within the half-mass
radius, we see that three have soft spectra (![]() ), three have hard spectra (
), three have hard spectra (![]() ), and one
(s20) is borderline with
), and one
(s20) is borderline with ![]() .
These spectra suggest that s05, s08, and s29 might be CVs,
AGN, or MSPs, while the softer spectra of s02, s15, s19
and s20 may indicate that these are ABs. Definitive
classifications require optical identification, which we turn to now.
.
These spectra suggest that s05, s08, and s29 might be CVs,
AGN, or MSPs, while the softer spectra of s02, s15, s19
and s20 may indicate that these are ABs. Definitive
classifications require optical identification, which we turn to now.
3 Optical observations
Two fields located inside the half-mass radius of the globular cluster
M 71 were observed with the Wide Field and Planetary Camera 2
(WFPC2) onboard the Hubble Space Telescope (HST) in 2000 and 2006. An
image of the observations is shown in Fig. 1. For these
observations, the PC camera was centered on the cluster center and the
F336W (similar to U, hence
![]() hereafter), F439W (
hereafter), F439W (
![]() ), and F555W (
), and F555W (
![]() )
filters were used. Exposure times were 800 s in F336W
(GO10524) and 240 s in F439W (GO8118). The two exposure times
corresponding to the F555W filter are 80 s and 63 s
for GO10524 and GO8118, respectively. GO10524 also contains F255W
images, which did not go deep enough to identify our targets. To
estimate whether the nondetections may be meaningful, we used Ferraro et al. (2000)
to estimate that CVs may be up to 3 mag brighter (absolute
magnitude) in F255W than V. Using Seaton (1979), we estimate the
extinction
)
filters were used. Exposure times were 800 s in F336W
(GO10524) and 240 s in F439W (GO8118). The two exposure times
corresponding to the F555W filter are 80 s and 63 s
for GO10524 and GO8118, respectively. GO10524 also contains F255W
images, which did not go deep enough to identify our targets. To
estimate whether the nondetections may be meaningful, we used Ferraro et al. (2000)
to estimate that CVs may be up to 3 mag brighter (absolute
magnitude) in F255W than V. Using Seaton (1979), we estimate the
extinction ![]() for M 71, and thus any CVs would be observed to be at least
3.2 mag fainter in F255W than V.
Using the WFPC2 exposure time calculator (ETC), we estimate that the
brightest CV candidate in our WFPC2 field, s29, could attain a
signal-to-noise ratio (S/N) of
1.4 in the F255W data if it showed the maximum F255W/V
excess, which many of Ferraro et al.'s UV-selected objects do
not. Therefore we do not discuss the F255W data further in this paper.
The 5-
for M 71, and thus any CVs would be observed to be at least
3.2 mag fainter in F255W than V.
Using the WFPC2 exposure time calculator (ETC), we estimate that the
brightest CV candidate in our WFPC2 field, s29, could attain a
signal-to-noise ratio (S/N) of
1.4 in the F255W data if it showed the maximum F255W/V
excess, which many of Ferraro et al.'s UV-selected objects do
not. Therefore we do not discuss the F255W data further in this paper.
The 5-![]() limiting magnitudes of
limiting magnitudes of ![]() ,
,
![]() ,
and
,
and ![]() for point sources are 21.09, 20.87, and 21.87,
respectively. M 71 was also observed with the HST Advanced
Camera for Surveys (ACS). The observations (GO10775)
consist of F606W (
for point sources are 21.09, 20.87, and 21.87,
respectively. M 71 was also observed with the HST Advanced
Camera for Surveys (ACS). The observations (GO10775)
consist of F606W (
![]() )
and F814W (
)
and F814W (
![]() )
images covering the entire half-mass radius of the cluster (see
Fig. 1).
The exposure times for the F606W and F814W filters were 304
and 324 s with 5-
)
images covering the entire half-mass radius of the cluster (see
Fig. 1).
The exposure times for the F606W and F814W filters were 304
and 324 s with 5-![]() limiting magnitudes of
limiting magnitudes of ![]() and
and ![]() for point sources. The median value of the point sources with the
for point sources. The median value of the point sources with the
![]() is used to define the 5-sigma limiting magnitude.
is used to define the 5-sigma limiting magnitude.
This section outlines the data reduction, photometry, and astrometry of the HST/WFPC2 and ACS images.
3.1 Data reduction and photometry
The HST/WFPC2 data obtained from the ESO archive were processed through
the WFPC2 Associations Science Products Pipeline![]() .
For each filter, single exposures were calibrated, including full bias
subtraction and flat-fielding, and combined to remove the cosmic-ray
events and correct the geometrical distortions
.
For each filter, single exposures were calibrated, including full bias
subtraction and flat-fielding, and combined to remove the cosmic-ray
events and correct the geometrical distortions![]() .
We also downloaded the archival HST/ACS drizzled images. Those images
were combined from two Wide Field Channel (WFC) images and calibrated
with MultiDrizzle package (Koekemoer
et al. 2002), which corrected for geometric
distortion and performed cosmic ray rejection.
.
We also downloaded the archival HST/ACS drizzled images. Those images
were combined from two Wide Field Channel (WFC) images and calibrated
with MultiDrizzle package (Koekemoer
et al. 2002), which corrected for geometric
distortion and performed cosmic ray rejection.
Although M 71 is a globular cluster, its stellar
surface density is not as dense as that of a typical globular cluster.
Even in the central region of M 71, the average distance
between stars is around
![]() ,
which is about 10 times more than the typical FWHMs of WFPC2
and ACS cameras. Therefore, a simple aperture photometry method with
the aperture correction is applicable to our data. We tested the flux
measurement using several different psf-fitting photometry methods and
the simple aperture photometry. We found that aperture photometry
method had a better S/N and less
magnitude error. Therefore, we decided to use aperture photometry to
measure the fluxes
of our data.
,
which is about 10 times more than the typical FWHMs of WFPC2
and ACS cameras. Therefore, a simple aperture photometry method with
the aperture correction is applicable to our data. We tested the flux
measurement using several different psf-fitting photometry methods and
the simple aperture photometry. We found that aperture photometry
method had a better S/N and less
magnitude error. Therefore, we decided to use aperture photometry to
measure the fluxes
of our data.
For the data taken with WFPC2, we basically followed the
instruction of aperture photometry described in Holtzman et al. (1995).
To deal with the PSF variances within each chip and between chips, we
separated the images further into 4 and 9 equal-size
regions for the PC and WF chips, respectively, and performed the
aperture photometry with aperture correction for each separated regions
individually.
We used an aperture with the size of
![]() in radius to measure fluxes, for all the objects with 3
in radius to measure fluxes, for all the objects with 3![]() detection found using the IRAF daofind task. There
is only less than 1% objects in each chip with a separation of
detection found using the IRAF daofind task. There
is only less than 1% objects in each chip with a separation of
![]()
![]() to their neighbors, so that using an aperture with the size of
to their neighbors, so that using an aperture with the size of
![]() does not suffer from the PSF overlapping problem. The local sky values
were measured using an inner sky annulus of 4 arcsecs with a
width of 2 arcsecs, and the aperture correction value was
calculated using the averages of the differences between the magnitudes
measured using apertures with sizes of
does not suffer from the PSF overlapping problem. The local sky values
were measured using an inner sky annulus of 4 arcsecs with a
width of 2 arcsecs, and the aperture correction value was
calculated using the averages of the differences between the magnitudes
measured using apertures with sizes of
![]() and
and ![]() in radius for 4 to 5 isolated stars in each separated
region. The aperture correction value is 0.11
in radius for 4 to 5 isolated stars in each separated
region. The aperture correction value is 0.11 ![]() 0.02 mag,
which is consistent with the value shown in Holtzman
et al. (1995). The final output magnitudes in the
VEGAMAG system were corrected for the appropriate zeropoints based upon
the sensitivity information in each header and the charge transfer
efficiency effect (Dolphin 2000).
0.02 mag,
which is consistent with the value shown in Holtzman
et al. (1995). The final output magnitudes in the
VEGAMAG system were corrected for the appropriate zeropoints based upon
the sensitivity information in each header and the charge transfer
efficiency effect (Dolphin 2000).
For the data taken with ACS, we performed the aperture
photometry based on the method described in Sirianni
et al. (2005). The method is very similar to what we
did for WFPC2. We also separated the ACS drizzled images into
9 equal-size regions to deal with the PSF variances. We used
an aperture size of
![]() in radius to measure the fluxes with sky annulus from
4 arcsecs to 6 arcsecs. The aperture correction value
is 0.08
in radius to measure the fluxes with sky annulus from
4 arcsecs to 6 arcsecs. The aperture correction value
is 0.08 ![]() 0.01,
which agrees with the values shown in Sirianni
et al. (2005). However, several optical
counterparts, e.g., s08, s19, suffer from the PSF overlapping problem
since the distances between them and their neighbors are
0.01,
which agrees with the values shown in Sirianni
et al. (2005). However, several optical
counterparts, e.g., s08, s19, suffer from the PSF overlapping problem
since the distances between them and their neighbors are ![]()
![]() .
To measure accurate fluxes for these counterparts, we first subtracted
their neighbors by using the PSF generated from isolated stars that are
close to the counterparts, and then performed the aperture photometry
on these sources. By doing this, we can minimize the photometric effect
from the PSF wings of neighbors.
.
To measure accurate fluxes for these counterparts, we first subtracted
their neighbors by using the PSF generated from isolated stars that are
close to the counterparts, and then performed the aperture photometry
on these sources. By doing this, we can minimize the photometric effect
from the PSF wings of neighbors.
A comparison with the photometry of M 71 kindly provided by Anderson et al. (2008) for the ACS images and reported by Piotto et al. (2002) for the WFPC2 B-band and V-band images shows that their results are consistent with what we have obtained by using aperture photometry, but have the main sequence and the giant branch with less noise. We therefore used their photometry in our study. In addition, for those possible optical counterparts undetected in their photometry, we used our own results for the magnitudes, which have been corrected for the appropriate zeropoint.
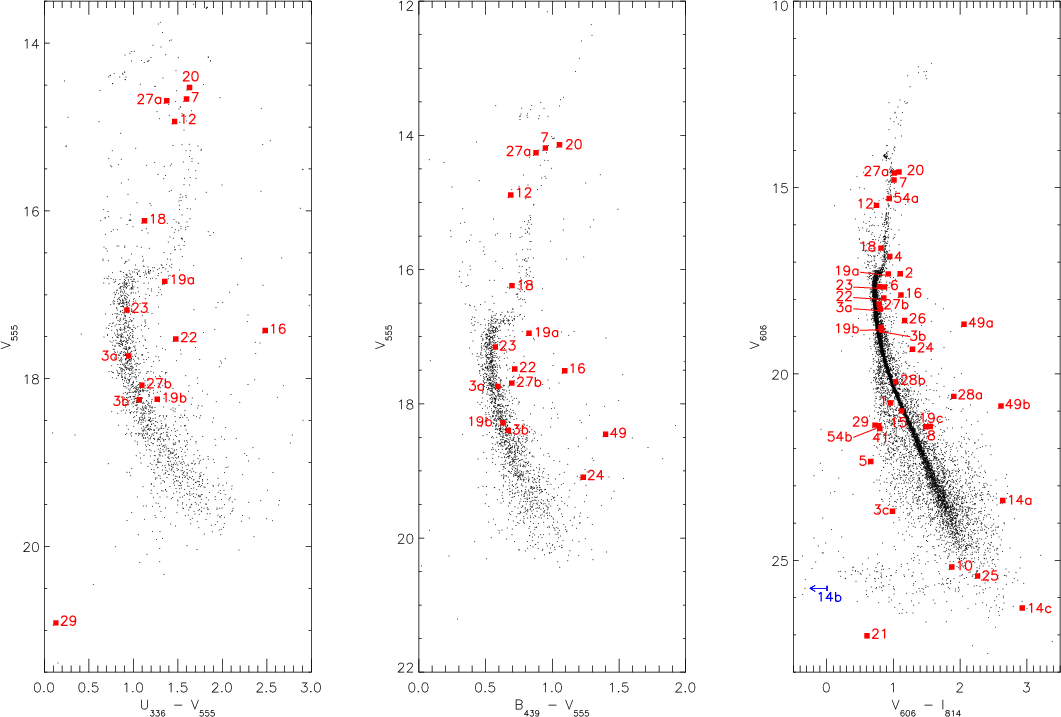
The most informative of these diagrams are shown in
Fig. 2,
on which all stars located within the 95![]() confidence error circles (see Sect. 2 and Table 1 of
Elsner et al. 2008) of the Chandra source positions are
indicated. Numbers have been assigned to all candidate counterparts
corresponding to the `s' designation given in Elsner
et al. (2008), with ``a'', ``b'', or ``c'' appended
if multiple potential optical counterparts exist.
confidence error circles (see Sect. 2 and Table 1 of
Elsner et al. 2008) of the Chandra source positions are
indicated. Numbers have been assigned to all candidate counterparts
corresponding to the `s' designation given in Elsner
et al. (2008), with ``a'', ``b'', or ``c'' appended
if multiple potential optical counterparts exist.
|
Figure 2:
Color magnitude diagrams (CMDs) for all the sources detected in the
WFPC2 and ACS field of view.
The HST candidate counterparts matched to the X-ray sources are
indicated by red squares. We note here s14b in the (V,
V-I) CMD is plotted as a
leftward-pointing arrow since its
|
| Open with DEXTER | |
3.2 Astrometry
To identify optical counterparts to the Chandra X-ray sources, we aim to place both the X-ray and the optical frames onto the International Celestial Reference System (ICRS). We use this approach to improve the astrometry of Chandra and HST images.For the X-ray sources, the positions listed in Elsner et al. (2008)
are already on the ICRS. In this paper, we aim to tie the HST pointing
to the ICRS by finding matches between stars appearing on HST images
and stars with accurate positions in the Two Micron All Sky Survey
(2MASS) Point Source Catalog (Skrutskie
et al. 2006). On the basis of the HST pointing
information contained in each image header, we used the WCSTools/imwcs![]() task on each corrected
image to do the cross-correlation. The resulting positions were matched
to those stars from the 2MASS catalog. There are hundreds of 2MASS
stars within each HST image. By using those 2MASS stars as reference,
the astrometric solution yielded root-mean-square residuals of
task on each corrected
image to do the cross-correlation. The resulting positions were matched
to those stars from the 2MASS catalog. There are hundreds of 2MASS
stars within each HST image. By using those 2MASS stars as reference,
the astrometric solution yielded root-mean-square residuals of
![]() in right ascension (RA) and
in right ascension (RA) and
![]() in declination (Dec) relative to the 2MASS astrometry for the ACS
images.
The resulting solution gave the residual errors of
in declination (Dec) relative to the 2MASS astrometry for the ACS
images.
The resulting solution gave the residual errors of
![]() and
and ![]() in RA and
in RA and
![]() and
and ![]() in Dec relative to the 2MASS astrometry for the PC and WF images,
respectively. The final uncertainties of the optical source position in
RA and Dec are the root of the square sum of the uncertainty of the
astrometry in 2MASS and HST image alignment and the general
uncertainties of 2MASS point source astrometry of typically
in Dec relative to the 2MASS astrometry for the PC and WF images,
respectively. The final uncertainties of the optical source position in
RA and Dec are the root of the square sum of the uncertainty of the
astrometry in 2MASS and HST image alignment and the general
uncertainties of 2MASS point source astrometry of typically ![]()
![]() relative
to the ICRS (Skrutskie
et al. 2006).
relative
to the ICRS (Skrutskie
et al. 2006).
4 Source identification and classification
To obtain optical identifications for the X-ray sources, we used the precise astrometry described in Sect. 3. We searched for optical counterparts within the 95% Chandra error circle of the source positions (see Table 1 of Elsner et al. 2008), which includes the positional uncertainty of X-ray sources reported by the wavelet source detection algorithm, the uncertainty in the X-ray boresight correction, and the uncertainty in the optical astrometry. Within the half-mass radius of M 71, there were 29 sources detected by Chandra and we suggest optical counterparts based on positional coincidence alone to 25 of them. In the case of multiple sources inside the X-ray error circle, we included all the candidates. The results of each candidate optical counterpart are summarized in Table 2, and finding charts are shown in Figs. 3 and 4.
![\begin{figure}
\par\includegraphics[width=18cm,clip]{11245fg3.eps}
\end{figure}](/articles/aa/full_html/2010/05/aa11245-08/img70.png)
|
Figure 3:
|
| Open with DEXTER | |
| Figure 4:
|
|
| Open with DEXTER | |
![\begin{figure}
\par\includegraphics[width=9cm,clip]{11245fg5.eps}
\vspace*{4mm}
\end{figure}](/articles/aa/full_html/2010/05/aa11245-08/img73.png)
|
Figure 5:
X-ray luminosity as a function of absolute magnitude, for
low-luminosity X-ray sources in globular clusters. Five types of X-ray
sources are shown, qLMXBs (diamonds), MSPs (crosses),
CVs (triangles), ABs (stars), and unclassified sources (squares). The
larger and numbered symbols in this figure correspond to the optically
identified X-ray sources in the
field of view of the Chandra observation of M 71, where we
compute absolute magnitude and X-ray luminosity under the assumption
that the sources are associated with M 71.
The smaller symbols in this figure indicate objects found in other
clusters, i.e. 47 Tuc, NGC 6397, NGC 6752,
M 4, NGC 288, M 55, and NGC 6366.
Ambiguous sources coming from other clusters were discarded in this
figure. The dashed line of constant X-ray to optical flux ratio given
by log
|
| Open with DEXTER | |
Table 2: Optical counterparts to Chandra X-ray sources within the HST/ACS field of view.
The first step in classifying faint (
![]() )
X-ray sources is to study their X-ray properties, e.g. their X-ray
luminosity and spectral behavior (see Sect. 2).
The second step in the identification process can be made when the
sources have other information coming from different wavelengths. The
coincidence between accurate radio-timing positions of millisecond
pulsars and the positions of X-ray sources can provide reliable
identification. In the optical band, the color-magnitude diagrams
(CMDs) of globular clusters have been studied for a long time because
they reflect the fundamental properties of these stars and the
evolutionary stage of the globular clusters. We extract further
information from the locations of the optical stars in the CMDs of
Fig. 2.
CVs usually lie much bluer than the main sequence stars in the (V,
U-V)
and (V, B-V)
CMDs, while the X-ray ABs may be located on or slightly above the main
sequence or on the giant branch. Stars on the main sequence in the V
vs. V-I CMD cannot be clearly
classified: they could either be CVs or ABs since their optical flux is
dominated by the donor stars or brighter stars of the binary systems.
)
X-ray sources is to study their X-ray properties, e.g. their X-ray
luminosity and spectral behavior (see Sect. 2).
The second step in the identification process can be made when the
sources have other information coming from different wavelengths. The
coincidence between accurate radio-timing positions of millisecond
pulsars and the positions of X-ray sources can provide reliable
identification. In the optical band, the color-magnitude diagrams
(CMDs) of globular clusters have been studied for a long time because
they reflect the fundamental properties of these stars and the
evolutionary stage of the globular clusters. We extract further
information from the locations of the optical stars in the CMDs of
Fig. 2.
CVs usually lie much bluer than the main sequence stars in the (V,
U-V)
and (V, B-V)
CMDs, while the X-ray ABs may be located on or slightly above the main
sequence or on the giant branch. Stars on the main sequence in the V
vs. V-I CMD cannot be clearly
classified: they could either be CVs or ABs since their optical flux is
dominated by the donor stars or brighter stars of the binary systems.
The ratio of X-ray to optical flux is also useful to
distinguish CVs from X-ray ABs (see Bassa
et al. 2004). In Fig. 5 we show the X-ray
luminosity as a function of the absolute magnitude for low-luminosity
X-ray sources from 47 Tuc, NGC 6397,
NGC 6752, M 4, NGC 288, M 55,
NGC 6366
(data from Bassa
et al. 2004; Grindlay et al. 2001a;
Pooley
et al. 2002; Kong et al. 2006; Edmonds
et al. 2003a; Taylor et al. 2001; Cool
et al. 1998; Bassa et al. 2008; Grindlay
et al. 2001b), and M 71. The large symbols
in this figure indicate the X-ray sources with possible optical
counterparts in the field of view of the Chandra observation of
M 71, while the smaller symbols show classified objects found
in other clusters. The absolute magnitudes and X-ray luminosities for
the sources in the observations were computed under the assumption that
they are cluster members. As discussed in Elsner
et al. (2008), we caution that ![]() 40% of the
29 X-ray sources within the half-mass radius are background or
foreground objects.
40% of the
29 X-ray sources within the half-mass radius are background or
foreground objects.
Now we turn to those stars unrelated to the globular clusters.
Foreground stars are likely to have counterparts that are not on the
main sequence, that have soft spectra, and that have low
![]() ratios (Krautter et al.
1999). For background active galactic nuclei (AGN), they will
also have counterparts not on the main sequence, but with hard spectra.
Their
ratios (Krautter et al.
1999). For background active galactic nuclei (AGN), they will
also have counterparts not on the main sequence, but with hard spectra.
Their ![]() ratios can be high (Krautter
et al. 1999). However, the AGN will not necessarily
be detected at all; in some cases, the only object in an error circle
may be a cluster main-sequence star that is not related to the X-ray
source.
ratios can be high (Krautter
et al. 1999). However, the AGN will not necessarily
be detected at all; in some cases, the only object in an error circle
may be a cluster main-sequence star that is not related to the X-ray
source.
We first consider those X-ray sources with only one suggested
counterpart in the Chandra error circle.
S08 is a known millisecond pulsar,
PSR J1953+1846A = M 71A, with a
spin period of 4.89 ms. It is in a 4.24 h eclipsing
binary system with a low-mass (![]() 0.032
0.032 ![]() )
companion. It was discovered with Arecibo
(Hessels
et al. 2007; Ransom et al. 2005,2003),
and its radio emission is partially eclipsed in the orbital phase
interval 0.18-0.36 for
approximately 20% of each orbit (Hessels
et al. 2007). The X-ray counterpart was detected by Elsner et al. (2008).
Within the Chandra error circle we find a possible optical counterpart
of this pulsar in the
)
companion. It was discovered with Arecibo
(Hessels
et al. 2007; Ransom et al. 2005,2003),
and its radio emission is partially eclipsed in the orbital phase
interval 0.18-0.36 for
approximately 20% of each orbit (Hessels
et al. 2007). The X-ray counterpart was detected by Elsner et al. (2008).
Within the Chandra error circle we find a possible optical counterpart
of this pulsar in the ![]() and
and ![]() band. The candidate optical counterpart to s08 lies on the
main sequence in our V-I CMD
with an absolute magnitude
band. The candidate optical counterpart to s08 lies on the
main sequence in our V-I CMD
with an absolute magnitude
![]() ,
which implies that it has a mass of about 0.5
,
which implies that it has a mass of about 0.5 ![]() .
The radio timing indicates a minimum mass of 0.03
.
The radio timing indicates a minimum mass of 0.03 ![]() (Hessels et al. 2007)
for the companion star. In order to allow for such a massive companion
(i.e.
(Hessels et al. 2007)
for the companion star. In order to allow for such a massive companion
(i.e. ![]() 0.5
0.5 ![]() ),
conceivably the orbit could be seen nearly face-on (within
4 degrees). However, in that (extremely unlikely) case we do
not expect regular radio eclipses, which are observed. M 71A's
radio properties are very similar to those of other very low-mass
binary pulsars such as PSR J1701-3006E (M 62E, Freire 2005), and therefore we
conclude that M 71A's companion is not this star. Although
this star's position agrees within
),
conceivably the orbit could be seen nearly face-on (within
4 degrees). However, in that (extremely unlikely) case we do
not expect regular radio eclipses, which are observed. M 71A's
radio properties are very similar to those of other very low-mass
binary pulsars such as PSR J1701-3006E (M 62E, Freire 2005), and therefore we
conclude that M 71A's companion is not this star. Although
this star's position agrees within
![]() with M 71A's position from radio timing (I. Stairs 2009,
private comm.), transferred with
with M 71A's position from radio timing (I. Stairs 2009,
private comm.), transferred with
![]() accuracy (1
accuracy (1![]() )
onto the 2MASS frame (Skrutskie
et al. 2006), this could be coincidence due to the
crowding in this field (Fig. 3);
alternatively, M 71A could be a hierarchical triple system.
Future radio timing may determine this.
)
onto the 2MASS frame (Skrutskie
et al. 2006), this could be coincidence due to the
crowding in this field (Fig. 3);
alternatively, M 71A could be a hierarchical triple system.
Future radio timing may determine this.
The star in the error circle of s02 is nearly located on the main-sequence turn-off point (MSTO) in the (V, V-I) CMD of Fig. 2 and slightly below the subgiant branch, which is similar to the ``red straggler'' active binaries seen as X-ray sources in other clusters (Albrow et al. 2001; Edmonds et al. 2003a; Bassa et al. 2008; Edmonds et al. 2003b). Its ratio of the X-ray to optical flux locates in the region of ABs in Fig. 5. Since s02 has a soft spectrum and shows significant time variability in the X-ray band (Elsner et al. 2008) we suggest that s02 is a chromospherically AB, and its temporal variation can be explained as flaring on the coronally active star. S04 and s18 are also believed to be in the same group as ABs since both of them are located slightly above the main-sequence turn-off point, have soft X-ray spectra, and have lower X-ray to optical flux ratios.
S05 is the brightest X-ray source within the half-mass radius
of M 71. It is worth noting that s05 is the only
X-ray source detected with ROSAT (Elsner et al. 2008; Panzera
et al. 2003) inside the half-mass radius. Its
optical counterpart is bluer than the main sequence, and it has a
relatively high X-ray luminosity (
![]() ).
It is unlikely to be an AB. Its X-ray spectrum is too hard to consider
it as a quiescent low-mass X-ray binary (qLMXB). S05 gives a
bremsstrahlung temperature consistent with
).
It is unlikely to be an AB. Its X-ray spectrum is too hard to consider
it as a quiescent low-mass X-ray binary (qLMXB). S05 gives a
bremsstrahlung temperature consistent with ![]() 10 keV,
as appropriate for luminous magnetic CVs (Mukai 2003; Eracleous
et al. 1991). During the 52.4 ks observation time,
it is not consistent with being steady at 99.9% confidence. We suggest
that a CV interpretation is plausible. In addition, s05 has a high
value of
10 keV,
as appropriate for luminous magnetic CVs (Mukai 2003; Eracleous
et al. 1991). During the 52.4 ks observation time,
it is not consistent with being steady at 99.9% confidence. We suggest
that a CV interpretation is plausible. In addition, s05 has a high
value of
![]() and the blue color, which implies this source could be a background
AGN. However, the power-law fit of its X-ray spectrum, with photon
index
and the blue color, which implies this source could be a background
AGN. However, the power-law fit of its X-ray spectrum, with photon
index ![]() ,
might be considered as arising from the intra-binary shock formed due
to interaction between the relativistic pulsar wind and material from
its companion star. An irradiated main-sequence companion could be this
blue; e.g. 47 Tuc W (Bogdanov
et al. 2005). MSPs with main-sequence companions of
the mass of
,
might be considered as arising from the intra-binary shock formed due
to interaction between the relativistic pulsar wind and material from
its companion star. An irradiated main-sequence companion could be this
blue; e.g. 47 Tuc W (Bogdanov
et al. 2005). MSPs with main-sequence companions of
the mass of ![]()
![]() have not yet been detected,
but may well be hidden from radio detection
by clouds of ionized gas from the companion (e.g. Freire et al. 2004).
Therefore, we cannot rule out the interpretation that it is a binary
MSP system though this unusual scenario must be judged unlikely.
have not yet been detected,
but may well be hidden from radio detection
by clouds of ionized gas from the companion (e.g. Freire et al. 2004).
Therefore, we cannot rule out the interpretation that it is a binary
MSP system though this unusual scenario must be judged unlikely.
The candidate cluster counterpart to s29 has ultraviolet
excess with respect to the main sequence (Fig. 2) and has a high
X-ray-to-optical flux ratio. The source can be well-fitted with a power
law model with a photon index of
![]() ,
and its X-ray luminosity is
,
and its X-ray luminosity is
![]() .
Its U-V color is far
too blue to be an AB, while the optical color is redder, almost on the
main sequence.
That indicates s29 is a CV with two spectral components, a
blue disk and a red companion star.
.
Its U-V color is far
too blue to be an AB, while the optical color is redder, almost on the
main sequence.
That indicates s29 is a CV with two spectral components, a
blue disk and a red companion star.
Source s15 is a good AB candidate since there is no evidence
of any blue color in the VI CMD and it has a soft X-ray spectrum (
![]() ).
On the other hand, without the information from the U-V
or B-V color, a CV
interpretation is still plausible. Its relatively high value of
log
).
On the other hand, without the information from the U-V
or B-V color, a CV
interpretation is still plausible. Its relatively high value of
log
![]() suggests
that s15 could be a CV, although it does not rule out
an AB.
suggests
that s15 could be a CV, although it does not rule out
an AB.
The star in the error circle of s20 lies on the giant branch and has a soft X-ray spectrum, which gives strong evidence that it is a chromospherically active binary containing a giant star (i.e., a RS CVn system). Its temporal variation in the X-ray band (Elsner et al. 2008) can be explained by magnetic activity. Since s07 and s12 are located on the giant branch and have relatively low X-ray-to-optical flux ratios, we believe that they are likely RS CVn systems as well.
The optical counterparts associated with those X-ray sources having lower photon statistics, s01, s06, and s23, are located on the main sequence and have lower X-ray-to-optical flux ratios. We then consider that all of them may be X-ray ABs. S22 exhibits rather interesting colors. In the V-I CMD it is on the main sequence, but as we shift to progressively bluer colors, its color gets redder and redder while in the U-V CMD it is way off the main sequence. Thus we suggest that it is either a foreground or background source, not associated with M 71.
We turn now to the sources with more than one possible counterpart in the error circle. We find two or three possible optical counterparts within each of the Chandra error circles for s03, s14, s19, s27, and s28.
S03a and s03b both fall on the main-sequence in the (V,
U-V), (V, B-V),
and (V, V-I)
CMDs. Their colors and low X-ray-to-optical flux ratios suggest that
either s03a or s03b is a chromospherically AB. However, the blue color
and the relatively high X-ray-to-optical flux ratio of s03c indicates
that it is a CV or a background AGN. S14a and s28a are located
far from the main sequence, suggesting that they do not belong to
M 71, while s28b located on the main sequence could be an
active binary system since it has the relatively low X-ray to optical
flux ratio. In Fig. 3,
we find two additional possible optical counterparts, s14b and s14c,
within the Chandra error circle of s14, which are fainter than the 5-![]() limiting magnitudes of
limiting magnitudes of ![]() and
and ![]() .
Based on the blue color and the high value of
.
Based on the blue color and the high value of
![]() ,
s14b could be either a CV or a background AGN. The optical-faint source
s14c is located near the downward-extended part of the main sequence,
suggesting that it could be a main-sequence star. However, it is
located in the
,
s14b could be either a CV or a background AGN. The optical-faint source
s14c is located near the downward-extended part of the main sequence,
suggesting that it could be a main-sequence star. However, it is
located in the ![]() vs.
vs. ![]() diagram in a region where no authentic cluster members have been found
if we compute its X-ray luminosity and absolute magnitude under the
assumption that it belongs to M 71. We then rule out the AB
interpretation. Therefore, due to its high X-ray-to-optical flux ratio
of this source, s14c is considered as either a good candidate for
background AGN with a optically faint object inside the error circle
not related to the X-ray source or a CV candidate with a secondary star
that dominates the optical flux in the (V, V-I)
CMD. There are three optical counterparts within the Chandra error
circle of s19. The position of s19a is near the MSTO point and
slightly below the subgiant branch, which is similar to the case
of s02, while s19b is located on the main sequence. Both of
their X-ray-to-optical flux ratios are located in the region that is
primarily populated by ABs (Fig. 5). For the third
optical counterpart, s19c, its location in the VI CMD and soft X-ray
spectrum indicate that s19c is an active binary as well. However,
without the information from the UV color, we cannot eliminate the CV
interpretation because of its relatively high X-ray-to-optical flux
ratio, which is similar to the case of s15. We suggest that
s19a is the most likely counterpart, as red stragglers are very often
associated with X-ray sources (e.g. Heinke
et al. 2005). According to the positions of two
possible optical counterparts to s27 in the CMDs and in the absolute
magnitude vs. X-ray luminosity diagram, we believe that either s27a or
s27b is likely to be an active binary.
diagram in a region where no authentic cluster members have been found
if we compute its X-ray luminosity and absolute magnitude under the
assumption that it belongs to M 71. We then rule out the AB
interpretation. Therefore, due to its high X-ray-to-optical flux ratio
of this source, s14c is considered as either a good candidate for
background AGN with a optically faint object inside the error circle
not related to the X-ray source or a CV candidate with a secondary star
that dominates the optical flux in the (V, V-I)
CMD. There are three optical counterparts within the Chandra error
circle of s19. The position of s19a is near the MSTO point and
slightly below the subgiant branch, which is similar to the case
of s02, while s19b is located on the main sequence. Both of
their X-ray-to-optical flux ratios are located in the region that is
primarily populated by ABs (Fig. 5). For the third
optical counterpart, s19c, its location in the VI CMD and soft X-ray
spectrum indicate that s19c is an active binary as well. However,
without the information from the UV color, we cannot eliminate the CV
interpretation because of its relatively high X-ray-to-optical flux
ratio, which is similar to the case of s15. We suggest that
s19a is the most likely counterpart, as red stragglers are very often
associated with X-ray sources (e.g. Heinke
et al. 2005). According to the positions of two
possible optical counterparts to s27 in the CMDs and in the absolute
magnitude vs. X-ray luminosity diagram, we believe that either s27a or
s27b is likely to be an active binary.
The optical counterparts of s16, s24, and s26 are located
farther above or to the right of the main sequence than the binary
sequence. We therefore believe that they are foreground objects and
unrelated to M 71. The positions of two faint optical
counterparts to s10 and s25 in the (V, V-I)
CMD and their relatively high X-ray-to-optical flux ratios are very
similar to the case of s14c so that s10 and s25 could be
either CVs or background AGN. The highest X-ray-to-optical flux ratio
among 39 possible counterparts and blue color suggests
that s21 is the most likely background AGN, although we cannot
eliminate the interpretation of a CV. Furthermore, the regions of the
X-ray sources, s09, s11, s13, and s17, were also observed with the
HST/WFPC2 and ACS, but we do not find any optical counterparts inside
their Chandra error circles. If we set the 5-![]() limiting magnitude of
limiting magnitude of ![]() as the upper limit for these sources, their X-ray-to-optical flux
ratios fall on a range of
as the upper limit for these sources, their X-ray-to-optical flux
ratios fall on a range of ![]() 0.2-0.6,
which are higher than the highest
0.2-0.6,
which are higher than the highest
![]() value known for an AB in a cluster, e.g. W64 in 47 Tuc (Edmonds et al. 2003a).
Therefore, an AB interpretation can be rejected. If we take their X-ray
colors into account, s11 and s17 are located near the
bottom-right corner and close to the position of s40 in the X-ray
color-color diagram shown in Fig. 4 of Elsner et al. (2008),
which implies they have very hard spectra with over half of their
counts above 2 keV. This infers a high intrinsic
value known for an AB in a cluster, e.g. W64 in 47 Tuc (Edmonds et al. 2003a).
Therefore, an AB interpretation can be rejected. If we take their X-ray
colors into account, s11 and s17 are located near the
bottom-right corner and close to the position of s40 in the X-ray
color-color diagram shown in Fig. 4 of Elsner et al. (2008),
which implies they have very hard spectra with over half of their
counts above 2 keV. This infers a high intrinsic ![]() ,
which strongly suggests that these are background AGN.
For the other three sources with medium X-ray colors, we then
tentatively classify them all as CVs, MSPs, or background AGN, though
AGN are probably the most likely category.
,
which strongly suggests that these are background AGN.
For the other three sources with medium X-ray colors, we then
tentatively classify them all as CVs, MSPs, or background AGN, though
AGN are probably the most likely category.
Outside the half-mass radius of M 71, we find 6
optical counterparts to X-ray sources, s41, s42, s49, and s54
in the ACS field-of-view. The candidate counterpart to s42,
located on the edge of the ACS, is saturated in the optical band, which
prevents us from obtaining a reliable magnitude of this optical source
or searching for any other faint optical sources inside the Chandra
error circle. There are 2 possible optical counterparts
to s49.
Both of them are located far from the main sequence, so we suggest that
they are not associated with M 71. Inside the error circle of
s54, the brighter object s54a is on the giant branch, while the fainter
one, s54b, is located blueward of the main sequence in the CMD and has
a relatively high X-ray-to-optical flux ratio, suggesting that s54b
might be a CV. However, s54b lies on the spikes produced by s54a, which
prevents us from obtaining an accurate magnitude for s54b. S41's color
is bluer than the main sequence, and its X-ray-to-optical flux ratio is
higher than that of an AB. We then suggest that s41 is a CV candidate.
Furthermore, a background AGN scenario is also plausible
for s41 and s54b due to their blue colors, high
![]() values, and their locations outside the half-mass radius of
M 71, where they are more likely to be background sources.
values, and their locations outside the half-mass radius of
M 71, where they are more likely to be background sources.
5 Summary and discussion
In summary, we find one certain CV (s29), seven possible candidate CVs (s05, s10, s14, s21, s25, s41, and s54), and two certain ABs (s02 and s20) and 12 good candidate ABs (s01, s03, s04, s06, s07, s12, s15, s18, s19, s23, s27, and s28) in the globular cluster M 71. Some of our candidate CVs (and/or candidate ABs) might be MSPs in binary systems or AGN, which often (but not always) show blue colors.
To interpret our results, understanding how many of our
objects are likely false matches will be critical. We calculated the
expected number of false matches in several ways. First, we shifted all
our X-ray source positions by 9
![]() and
18
and
18
![]() (somewhat
arbitrary, but chosen to be larger than the largest
uncertainties) in four directions, and searched for matches against the
(somewhat
arbitrary, but chosen to be larger than the largest
uncertainties) in four directions, and searched for matches against the
![]() frame. From
this exercise, we expect 11+4-8
false matches among our 39 possible matches, indicating that
frame. From
this exercise, we expect 11+4-8
false matches among our 39 possible matches, indicating that ![]() 70% of the
34 total X-ray sources in our field of view have a true match. By
chance, then, 70% of our false matches should occur with sources that
have a true match-suggesting that
70% of the
34 total X-ray sources in our field of view have a true match. By
chance, then, 70% of our false matches should occur with sources that
have a true match-suggesting that ![]() 7.7 sources should
have two possible optical counterparts. We see seven sources that have
two or more possible
7.7 sources should
have two possible optical counterparts. We see seven sources that have
two or more possible ![]() counterparts, which is nicely consistent.
counterparts, which is nicely consistent.
To know which sources are more likely to have false matches,
we calculated the probability of a chance coincidence in %
shown in Col. 10 of Table 2 by using
Eq. (3) from Elsner
et al. (2008)
(see also Verbunt et al. 2008). Within the half-mass radius,
there are 6 sources with a false alarm probability lower
than 1%, which indicates that those associations between X-ray
sources and optical counterparts have a >99% confidence level.
Adding up the false alarm probabilities gives a total expected number
of false matches of ![]() 5,
which is consistent with the expectation of
11+4-8 false matches
above. Among the 10 X-ray sources with optical counterparts
and
5,
which is consistent with the expectation of
11+4-8 false matches
above. Among the 10 X-ray sources with optical counterparts
and
![]() ,
adding the false alarm probabilities indicates that roughly one of them
is expected to be a false match. (We believe s08 to be a false
match, but to be a true cluster member; and that s19 has three
potential counterparts.)
,
adding the false alarm probabilities indicates that roughly one of them
is expected to be a false match. (We believe s08 to be a false
match, but to be a true cluster member; and that s19 has three
potential counterparts.)
Inside the half-mass radius of M 71, we find 14 X-ray
sources with
![]() ,
of which 10 have optical counterparts. Assuming that all X-ray
sources outside the half-mass radius are fore- or background sources,
we can estimate that
,
of which 10 have optical counterparts. Assuming that all X-ray
sources outside the half-mass radius are fore- or background sources,
we can estimate that ![]() 3.7+3.1-1.8
X-ray sources among 14 are unrelated to M 71. The error quote
here is from the Poisson statistic (Gehrels
1986). This is consistent with our estimate above that we
have identified true optical counterparts for
3.7+3.1-1.8
X-ray sources among 14 are unrelated to M 71. The error quote
here is from the Poisson statistic (Gehrels
1986). This is consistent with our estimate above that we
have identified true optical counterparts for ![]() 9 X-ray sources.
9 X-ray sources.
Pooley et al.
(2003) have shown that for 12 globular clusters
observed by Chandra, the number of globular cluster X-ray sources that
are above the lower limit of
![]() (0.5-6 keV)
can be approximately linearly fitted with the predicted stellar
encounter rate
(0.5-6 keV)
can be approximately linearly fitted with the predicted stellar
encounter rate
![]() ,
where
,
where ![]() is referred to as the collision number (Verbunt
2003). Here,
is referred to as the collision number (Verbunt
2003). Here, ![]() is the central density of the cluster, and
is the central density of the cluster, and ![]() is the core radius.
To examine if M 71 fits this relation, we compared its number
of X-ray sources and its collision number
is the core radius.
To examine if M 71 fits this relation, we compared its number
of X-ray sources and its collision number ![]() with those of some other clusters, NGC 6266, 47 Tuc,
M 28, M 4, NGC 6366, M 55, and
NGC 288 (see Fig. 6),
using the parameters listed in Table 3. The
core-collapsed globular clusters are not considered in our study since
their core parameters are generally uncertain, introducing strong
uncertainties into interaction rates derived from those parameters. The
encounter number for M 71 is
with those of some other clusters, NGC 6266, 47 Tuc,
M 28, M 4, NGC 6366, M 55, and
NGC 288 (see Fig. 6),
using the parameters listed in Table 3. The
core-collapsed globular clusters are not considered in our study since
their core parameters are generally uncertain, introducing strong
uncertainties into interaction rates derived from those parameters. The
encounter number for M 71 is ![]() 230 and
230 and ![]() 10 times
less than those of 47 Tuc and M 4, respectively. Pooley et al. (2003)
reports 41
10 times
less than those of 47 Tuc and M 4, respectively. Pooley et al. (2003)
reports 41 ![]() 2
sources above the lower luminosity limit in 47 Tuc, which are
revised by Heinke et al.
(2005) to
2
sources above the lower luminosity limit in 47 Tuc, which are
revised by Heinke et al.
(2005) to ![]() (for a distance of 4.5 kpc), with the uncertainty due to the
estimated number of background sources. Thus, if the number of sources
scales with the encounter rate, the presence of
(for a distance of 4.5 kpc), with the uncertainty due to the
estimated number of background sources. Thus, if the number of sources
scales with the encounter rate, the presence of ![]()
![]() sources with
sources with
![]() in M 71 is a very significant overabundance, even if we take
the errors due to Poissonian fluctuations into account. The same
conclusion is reached on the basis of comparison with any other
globular clusters listed in Table 3 except for
M 55 and NGC 288, in which the number of the X-ray
sources is also in excess of the predicted value.
This indicates that most of the sources in M 71,
M 55, and NGC 288 are not formed via stellar
encounters.
in M 71 is a very significant overabundance, even if we take
the errors due to Poissonian fluctuations into account. The same
conclusion is reached on the basis of comparison with any other
globular clusters listed in Table 3 except for
M 55 and NGC 288, in which the number of the X-ray
sources is also in excess of the predicted value.
This indicates that most of the sources in M 71,
M 55, and NGC 288 are not formed via stellar
encounters.
Table 3: Scaling parameters of NGC 6266, 47 Tuc, M 28, M 4, M 71, NGC 6366, M 55, and NGC 288.
![\begin{figure}
\par\hspace{-0.3cm}
\includegraphics[angle=-90,width=9.0 cm]{11245fg6.ps}
\vspace{8mm}
\end{figure}](/articles/aa/full_html/2010/05/aa11245-08/img115.png)
|
Figure 6:
Number of globular cluster X-ray sources (N) with
|
| Open with DEXTER | |
As suggested by Verbunt (2002),
ABs are most likely primordial binaries, so that to first order their
numbers should scale with mass. Following Kong
et al. (2006), we calculated the half masses with
10-0.4 MV,
assuming the visual mass-to-light ratio is the same for all clusters
listed in Table 3.
M 71 has the lowest half mass, containing only ![]() 30% of the
mass within the half-mass radius of M 4. Scaled by mass, the
predicted number of ABs with
30% of the
mass within the half-mass radius of M 4. Scaled by mass, the
predicted number of ABs with
![]() erg s-1
in M 71 should be similar to that of NGC 6366 and
smaller than those in any other cluster shown in Table 3, but this
contradicts our results.
erg s-1
in M 71 should be similar to that of NGC 6366 and
smaller than those in any other cluster shown in Table 3, but this
contradicts our results.
The scaling of source number with the collision number for the
sources with
![]() erg s-1
suggests that CVs are mostly
made via stellar encounters (Pooley
et al. 2003). If we assumed that all of the CVs in
M 71 were formed dynamically, we would not expect to find more
than one CV by scaling with the encounter numbers from any other
cluster listed in Table 3.
However, most of the globular clusters studied by Pooley et al. (2003)
have high
erg s-1
suggests that CVs are mostly
made via stellar encounters (Pooley
et al. 2003). If we assumed that all of the CVs in
M 71 were formed dynamically, we would not expect to find more
than one CV by scaling with the encounter numbers from any other
cluster listed in Table 3.
However, most of the globular clusters studied by Pooley et al. (2003)
have high ![]() numbers and many dynamically produced CVs. It is reasonable to suspect
that primordial CVs may dominate in the low-density clusters. According
to the computations by Davies (1997),
a cluster core with a star density of 1000 pc-3
allows most of the CV progenitors to evolve into a CV. This
could explain the existence of at least one (and several candidate) CV
within the half-mass radius of M 71.
numbers and many dynamically produced CVs. It is reasonable to suspect
that primordial CVs may dominate in the low-density clusters. According
to the computations by Davies (1997),
a cluster core with a star density of 1000 pc-3
allows most of the CV progenitors to evolve into a CV. This
could explain the existence of at least one (and several candidate) CV
within the half-mass radius of M 71.
It is interesting that in M 71 ![]() 7
optical counterparts to Chandra X-ray sources are classified as
potential RS CVn systems, in which X-ray emission is produced primarily
in (sub)giant flare outbursts. A couple of possible RS CVn X-ray
sources have been identified in 47 Tuc (Heinke et al. 2005)
and
7
optical counterparts to Chandra X-ray sources are classified as
potential RS CVn systems, in which X-ray emission is produced primarily
in (sub)giant flare outbursts. A couple of possible RS CVn X-ray
sources have been identified in 47 Tuc (Heinke et al. 2005)
and ![]() Centauri
(Cool et al. 2002),
but, besides M 71, only the low-density clusters M 55
and NGC 6366 (Bassa
et al. 2008) have significant fractions of X-ray
sources identified as possible RS CVns. Considering the even lower
density case, the total X-ray luminosity of the old open cluster
M 67 is dominated by binaries with giants (van den Berg et al. 2004).
From the ROSAT census, the X-ray emission of most globular clusters per
unit mass is lower than that of the old open cluster M 67 (Verbunt 2001,2002).
There are three possible explanations for this:
Centauri
(Cool et al. 2002),
but, besides M 71, only the low-density clusters M 55
and NGC 6366 (Bassa
et al. 2008) have significant fractions of X-ray
sources identified as possible RS CVns. Considering the even lower
density case, the total X-ray luminosity of the old open cluster
M 67 is dominated by binaries with giants (van den Berg et al. 2004).
From the ROSAT census, the X-ray emission of most globular clusters per
unit mass is lower than that of the old open cluster M 67 (Verbunt 2001,2002).
There are three possible explanations for this:
a) M 67 is a very sparse cluster, which is evaporating its
lowest-mass stars (Hurley
et al. 2005). Open clusters do not survive very
long. As a cluster evaporates its lowest-mass stars, it tends to retain
its heaviest systems - binaries - which are more likely to be X-ray
sources.
b) M 67 is a rather young cluster. Younger stars may produce
more X-rays (Randich 1997),
since they tend to be rotating faster than older stars.
c) A large fraction of binary systems are destroyed in globular
clusters (see Ivanova
et al. 2005), in particular those with longer
orbits. RS CVn systems involve giants that are spun up by stellar
companions. These systems must be relatively wide binaries, in order to
avoid the giant swallowing its companion as it evolves, but such wide
binaries are destroyed in globular clusters. Thus there are fewer
RS CVn binaries in globulars. Since RS CVn binaries tend to be
brighter than BY Dra binaries (main-sequence ABs), low-density clusters
can have startlingly high X-ray luminosities per unit mass.
To summarize the results of this paper, the number of X-ray
faint sources with
![]() erg s-1
found in M 71 is higher than the predicted value on the basis
of either the collision frequency or the half mass.
We suggest that those CVs and ABs in M 71 are primordial in
origin. The last interpretation above may explain the X-ray
overabundance of low-density clusters like M 71, where fewer
primordial binaries may have been destroyed through binary
interactions. Study of other low-density globular clusters will help us
better understand their evolution and dynamics.
erg s-1
found in M 71 is higher than the predicted value on the basis
of either the collision frequency or the half mass.
We suggest that those CVs and ABs in M 71 are primordial in
origin. The last interpretation above may explain the X-ray
overabundance of low-density clusters like M 71, where fewer
primordial binaries may have been destroyed through binary
interactions. Study of other low-density globular clusters will help us
better understand their evolution and dynamics.
This work made use of the Chandra and HST data archives. We acknowledge that Stairs et al. kindly provided the information of M 71A in advance of publication. We also thank Anderson et al. for the photometry. The first author thanks Albert K.H. Kong for some helpful suggestions and acknowledges the receipt of funding provided by the Max-Planck Society in the frame of the International Max-Planck Research School (IMPRS). COH acknowledges support from NASA Chandra grants, and funding from NSERC and the University of Alberta.
References
- Albrow, M. D., Gilliland, R. L., Brown, T. M., et al. 2001, ApJ, 559, 1060 [NASA ADS] [CrossRef] [Google Scholar]
- Anderson, J., Sarajedini, A., Bedin, L. R., et al. 2008, AJ, 135, 2055 [NASA ADS] [CrossRef] [Google Scholar]
- Ashman, K. M., & Zepf, S. E. 1998, Globular cluster systems (Cambridge University Press) [Google Scholar]
- Bassa, C., Pooley, D., Homer, L., et al. 2004, ApJ, 609, 755 [NASA ADS] [CrossRef] [Google Scholar]
- Bassa, C. G., Pooley, D., Verbunt, F., et al. 2008, A&A, 488, 921 [NASA ADS] [CrossRef] [EDP Sciences] [Google Scholar]
- Becker, W., Swartz, D. A., Pavlov, G. G., et al. 2003, ApJ, 594, 798 [NASA ADS] [CrossRef] [Google Scholar]
- Bogdanov, S., Grindlay, J. E., & van den Berg, M. 2005, ApJ, 630, 1029 [NASA ADS] [CrossRef] [Google Scholar]
- Cash, W. 1979, ApJ, 228, 939 [NASA ADS] [CrossRef] [Google Scholar]
- Cocozza, G., Ferraro, F. R., Possenti, A., et al. 2008, ApJ, 679, L105 [NASA ADS] [CrossRef] [Google Scholar]
- Cool, A. M., Grindlay, J. E., Cohn, H. N., Lugger, P. M., & Bailyn, C. D. 1998, ApJ, 508, L75 [NASA ADS] [CrossRef] [Google Scholar]
- Cool, A. M., Haggard, D., & Carlin, J. L. 2002, in Omega Centauri, A Unique Window into Astrophysics, ed. F. van Leeuwen, J. D. Hughes, & G. Piotto, ASP Conf. Ser., 265, 277 [Google Scholar]
- Davies, M. B. 1997, MNRAS, 288, 117 [NASA ADS] [CrossRef] [Google Scholar]
- Dolphin, A. E. 2000, PASP, 112, 1397 [NASA ADS] [CrossRef] [Google Scholar]
- Edmonds, P. D., Gilliland, R. L., Heinke, C. O., & Grindlay, J. E. 2003a, ApJ, 596, 1177 [NASA ADS] [CrossRef] [Google Scholar]
- Edmonds, P. D., Gilliland, R. L., Heinke, C. O., & Grindlay, J. E. 2003b, ApJ, 596, 1197 [NASA ADS] [CrossRef] [Google Scholar]
- Elsner, R. F., Heinke, C. O., Cohn, H. N., et al. 2008, ApJ, 687, 1019 [NASA ADS] [CrossRef] [Google Scholar]
- Eracleous, M., Halpern, J., & Patterson, J. 1991, ApJ, 382, 290 [NASA ADS] [CrossRef] [Google Scholar]
- Ferraro, F. R., Paltrinieri, B., Rood, R. T., Fusi Pecci, F., & Buonanno, R. 2000, ApJ, 537, 312 [NASA ADS] [CrossRef] [Google Scholar]
- Freire, P. C., Gupta, Y., Ransom, S. M., & Ishwara-Chandra, C. H. 2004, ApJ, 606, L53 [NASA ADS] [CrossRef] [Google Scholar]
- Freire, P. C. C. 2005, in Binary Radio Pulsars, ed. F. A. Rasio, & I. H. Stairs, ASP Conf. Ser., 328, 405 [Google Scholar]
- Gehrels, N. 1986, ApJ, 303, 336 [NASA ADS] [CrossRef] [Google Scholar]
- Grindlay, J. E., Hertz, P., Steiner, J. E., Murray, S. S., & Lightman, A. P. 1984, ApJ, 282, L13 [NASA ADS] [CrossRef] [Google Scholar]
- Grindlay, J. E., Heinke, C., Edmonds, P. D., & Murray, S. S. 2001a, Science, 292, 2290 [NASA ADS] [CrossRef] [PubMed] [Google Scholar]
- Grindlay, J. E., Heinke, C. O., Edmonds, P. D., Murray, S. S., & Cool, A. M. 2001b, ApJ, 563, L53 [NASA ADS] [CrossRef] [Google Scholar]
- Harris, W. E. 1996, AJ, 112, 1487 [NASA ADS] [CrossRef] [Google Scholar]
- Heinke, C. O., Grindlay, J. E., Edmonds, P. D., et al. 2005, ApJ, 625, 796 [NASA ADS] [CrossRef] [Google Scholar]
- Hessels, J. W. T., Ransom, S. M., Stairs, I. H., Kaspi, V. M., & Freire, P. C. C. 2007, ApJ, 670, 363 [NASA ADS] [CrossRef] [Google Scholar]
- Holtzman, J. A., Burrows, C. J., Casertano, S., et al. 1995, PASP, 107, 1065 [NASA ADS] [CrossRef] [Google Scholar]
- Hurley, J. R., Pols, O. R., Aarseth, S. J., & Tout, C. A. 2005, MNRAS, 363, 293 [NASA ADS] [CrossRef] [Google Scholar]
- Ivanova, N., Fregeau, J. M., & Rasio, F. A. 2005, in Binary Radio Pulsars, ed. F. A. Rasio, & I. H. Stairs, ASP Conf. Ser., 328, 231 [Google Scholar]
- Koekemoer, A. M., Fruchter, A. S., Hook, R. N., & Hack, W. 2002, in The 2002 HST Calibration Workshop: Hubble after the Installation of the ACS and the NICMOS Cooling System, ed. S. Arribas, A. Koekemoer, & B. Whitmore, 337 [Google Scholar]
- Kong, A. K. H., Bassa, C., Pooley, D., et al. 2006, ApJ, 647, 1065 [NASA ADS] [CrossRef] [Google Scholar]
- Krautter, J., Zickgraf, F.-J., Appenzeller, I., et al. 1999, A&A, 350, 743 [NASA ADS] [Google Scholar]
- Lugger, P. M., Cohn, H. N., Heinke, C. O., Grindlay, J. E., & Edmonds, P. D. 2007, ApJ, 657, 286 [NASA ADS] [CrossRef] [Google Scholar]
- Mukai, K. 2003, Adv. Space Res., 32, 2067 [NASA ADS] [CrossRef] [Google Scholar]
- Panzera, M. R., Campana, S., Covino, S., et al. 2003, A&A, 399, 351 [NASA ADS] [CrossRef] [EDP Sciences] [Google Scholar]
- Piotto, G., King, I. R., Djorgovski, S. G., et al. 2002, A&A, 391, 945 [NASA ADS] [CrossRef] [EDP Sciences] [Google Scholar]
- Pooley, D., Lewin, W. H. G., Homer, L., et al. 2002, ApJ, 569, 405 [NASA ADS] [CrossRef] [Google Scholar]
- Pooley, D., Lewin, W. H. G., Anderson, S. F., et al. 2003, ApJ, 591, L131 [NASA ADS] [CrossRef] [Google Scholar]
- Predehl, P., & Schmitt, J. H. M. M. 1995, A&A, 293, 889 [NASA ADS] [Google Scholar]
- Randich, S. 1997, Mem. Soc. Astron. Ital., 68, 971 [Google Scholar]
- Ransom, S., Hessels, J., Stairs, I., et al. 2005, in Binary Radio Pulsars, ed. F. A. Rasio, & I. H. Stairs, ASP Conf. Ser., 328, 199 [Google Scholar]
- Ransom, S. M., Hessels, J. W. T., Stairs, I. H., et al. 2003, in Radio Pulsars, ed. M. Bailes, D. J. Nice, & S. E. Thorsett, ASP Conf. Ser., 302, 371 [Google Scholar]
- Seaton, M. J. 1979, MNRAS, 187, 73P [NASA ADS] [CrossRef] [Google Scholar]
- Sirianni, M., Jee, M. J., Benítez, N., et al. 2005, PASP, 117, 1049 [NASA ADS] [CrossRef] [Google Scholar]
- Skrutskie, M. F., Cutri, R. M., Stiening, R., et al. 2006, AJ, 131, 1163 [NASA ADS] [CrossRef] [Google Scholar]
- Taylor, J. M., Grindlay, J. E., Edmonds, P. D., & Cool, A. M. 2001, ApJ, 553, L169 [NASA ADS] [CrossRef] [Google Scholar]
- Trepl, L. 2007, LMU Diploma Thesis [Google Scholar]
- van den Berg, M., Tagliaferri, G., Belloni, T., & Verbunt, F. 2004, A&A, 418, 509 [NASA ADS] [CrossRef] [EDP Sciences] [Google Scholar]
- Verbunt, F. 2001, A&A, 368, 137 [NASA ADS] [CrossRef] [EDP Sciences] [Google Scholar]
- Verbunt, F. 2002, in Omega Centauri, A Unique Window into Astrophysics, ed. F. van Leeuwen, J. D. Hughes, & G. Piotto, ASP Conf. Ser., 265, 289 [Google Scholar]
- Verbunt, F. 2003, ed. E. P. van den Heuvel, L. Kaper, E. Rol, & R. A. M. J. Wijers, ASP Conf. Ser., 308, 201 [Google Scholar]
- Verbunt, F., & Lewin, W. H. G. 2004 [arXiv:astro-ph/0404136] [Google Scholar]
- Verbunt, F., Pooley, D., & Bassa, C. 2008, in IAU Symp., 246, 301 [Google Scholar]
Footnotes
- ... 2003
![[*]](/icons/foot_motif.png)
- http://physwww.mcmaster.ca/ harris/Databases.html
- ... counts
- The number of source counts is a result of modeling the background and the PSF, and represents a background subtracted expectation value for the source counts within the detect cell.
- ... PHA
- PHA: pulse height analysis.
- ... Pipeline
- See http://archive.eso.org/archive/hst/wfpc2_asn/
- ... distortions
- See http://archive.stsci.edu/hst/wfpc2/pipeline.html
- ...
WCSTools/imwcs
- See http://tdc-www.harvard.edu/software/wcstools/index.html
All Tables
Table 1:
Spectral fits of the X-ray sources with source counts
![]() .
.
Table 2: Optical counterparts to Chandra X-ray sources within the HST/ACS field of view.
Table 3: Scaling parameters of NGC 6266, 47 Tuc, M 28, M 4, M 71, NGC 6366, M 55, and NGC 288.
All Figures
|
|
Figure 1:
Chandra ACIS-S3 image of the globular cluster M 71 within the
energy range of 0.3-8.0 keV. The large circles are centered on
the nominal center of the cluster and have radii |
| Open with DEXTER | |
| In the text | |
|
|
Figure 2:
Color magnitude diagrams (CMDs) for all the sources detected in the
WFPC2 and ACS field of view.
The HST candidate counterparts matched to the X-ray sources are
indicated by red squares. We note here s14b in the (V,
V-I) CMD is plotted as a
leftward-pointing arrow since its
|
| Open with DEXTER | |
| In the text | |
|
|
Figure 3:
|
| Open with DEXTER | |
| In the text | |
| |
Figure 4:
|
| Open with DEXTER | |
| In the text | |
|
|
Figure 5:
X-ray luminosity as a function of absolute magnitude, for
low-luminosity X-ray sources in globular clusters. Five types of X-ray
sources are shown, qLMXBs (diamonds), MSPs (crosses),
CVs (triangles), ABs (stars), and unclassified sources (squares). The
larger and numbered symbols in this figure correspond to the optically
identified X-ray sources in the
field of view of the Chandra observation of M 71, where we
compute absolute magnitude and X-ray luminosity under the assumption
that the sources are associated with M 71.
The smaller symbols in this figure indicate objects found in other
clusters, i.e. 47 Tuc, NGC 6397, NGC 6752,
M 4, NGC 288, M 55, and NGC 6366.
Ambiguous sources coming from other clusters were discarded in this
figure. The dashed line of constant X-ray to optical flux ratio given
by log
|
| Open with DEXTER | |
| In the text | |
|
|
Figure 6:
Number of globular cluster X-ray sources (N) with
|
| Open with DEXTER | |
| In the text | |
Copyright ESO 2010
Current usage metrics show cumulative count of Article Views (full-text article views including HTML views, PDF and ePub downloads, according to the available data) and Abstracts Views on Vision4Press platform.
Data correspond to usage on the plateform after 2015. The current usage metrics is available 48-96 hours after online publication and is updated daily on week days.
Initial download of the metrics may take a while.