| Issue |
A&A
Volume 512, March-April 2010
|
|
|---|---|---|
| Article Number | A29 | |
| Number of page(s) | 12 | |
| Section | Interstellar and circumstellar matter | |
| DOI | https://doi.org/10.1051/0004-6361/200913107 | |
| Published online | 25 March 2010 | |
Disk and outflow signatures in Orion-KL:
the power of high-resolution thermal infrared spectroscopy![[*]](/icons/foot_motif.png)
H. Beuther - H. Linz - A. Bik - M. Goto - Th. Henning
Max-Planck-Institute for Astronomy, Königstuhl 17, 69117 Heidelberg, Germany
Received 12 August 2009 / Accepted 4 January 2010
Abstract
Context. The Orion-KL region contains the closest
examples of high-mass accretion disk candidates. Studying their
properties is an essential step in studying high-mass star formation.
Aims. Resolving the molecular line emission at high
spatial and spectral resolution in the immediate environment of the
exciting sources to infer the physical properties of the associated
gas.
Methods. We used the CRIRES high-resolution
spectrograph mounted on the VLT to study the ro-vibrational 12CO,
13CO, the Pfund ![]() ,
and H2 emission between 4.59 and
4.72
,
and H2 emission between 4.59 and
4.72 ![]() m
wavelengths toward the BN object, the disk candidate source n,
and a proposed dust density enhancement IRC3.
m
wavelengths toward the BN object, the disk candidate source n,
and a proposed dust density enhancement IRC3.
Results. We detected CO absorption and emission
features toward all three targets. Toward the BN object, the
data partly confirm the results obtained more than 25 years
ago; however, we also identify several new features. While the
blue-shifted absorption is likely caused by outflowing gas, toward the
BN object we detect CO in emission extending in
diameter to ![]() 3300 AU
with a velocity structure close to the
3300 AU
with a velocity structure close to the ![]() .
Although at the observational spectral resolution limit, the 13CO
line width of that feature increases with energy levels, consistent
with a disk origin. If one also attributes the extended
CO emission to a disk origin, its extent is consistent with
other massive disk candidates in the literature. For source n,
we also find the blueshifted CO absorption likely from an outflow.
However, it also exhibits a narrower range of redshifted CO absorption
and adjacent weak CO emission, consistent with infalling
motions. We do not spatially resolve the emission for source n. For
both sources we conduct a Boltzmann analysis of the 13CO
absorption features and find temperatures between 100 and
160 K, and H2 column densities
of a few times 1023 cm-2.
The observational signatures from IRC3 are very different with only
weak absorption against a much weaker continuum source. However, the
CO emission is extended and shows wedge-like position velocity
signatures consistent with jet-entrainment of molecular gas,
potentially associated with the Orion-KL outflow system. We also
present and discuss the Pfund
.
Although at the observational spectral resolution limit, the 13CO
line width of that feature increases with energy levels, consistent
with a disk origin. If one also attributes the extended
CO emission to a disk origin, its extent is consistent with
other massive disk candidates in the literature. For source n,
we also find the blueshifted CO absorption likely from an outflow.
However, it also exhibits a narrower range of redshifted CO absorption
and adjacent weak CO emission, consistent with infalling
motions. We do not spatially resolve the emission for source n. For
both sources we conduct a Boltzmann analysis of the 13CO
absorption features and find temperatures between 100 and
160 K, and H2 column densities
of a few times 1023 cm-2.
The observational signatures from IRC3 are very different with only
weak absorption against a much weaker continuum source. However, the
CO emission is extended and shows wedge-like position velocity
signatures consistent with jet-entrainment of molecular gas,
potentially associated with the Orion-KL outflow system. We also
present and discuss the Pfund ![]() and H2 emission in the region.
and H2 emission in the region.
Conclusions. This analysis toward the closest
high-mass disk candidates outlines the power of high spectral and
spatial resolution mid-infrared spectroscopy for studying the gas
properties close to young massive stars. We will extend qualitatively
similar studies to larger samples of high-mass young stellar objects to
constrain the physical properties of the dense innermost gas structures
in more detail and in a statistical sense.
Key words: stars: formation - stars: early-type - accretion, accretion disks - techniques: spectroscopic - ISM: jets and outflows - stars: individual: Orion-BN, Orion source n
1 Introduction
Understanding the physical structure of massive accretion disks is one of the main unsolved problems in high-mass star formation. Although indirect, the main line of arguments for accretion disks stems from massive molecular outflow observations that identify collimated and energetic outflows from high-mass young stellar objects (YSOs, e.g., Beuther et al. 2002b; Henning et al. 2000; Zhang et al. 2005; Arce et al. 2007). Collimated jet-like outflow structures are usually attributed to massive accretion disks and magneto-centrifugal acceleration. Recent 2D and 3D magneto-hydrodynamical simulations of massive collapsing gas cores also result in the formation of massive accretion disks (Yorke & Sonnhalter 2002; Krumholz et al. 2009,2007). However, it is still unclear whether such massive disks are similar to their low-mass counterparts, hence dominated by the central YSO and in Keplerian rotation, or whether they are maybe self-gravitating non-Keplerian entities.
While studies at (sub)mm wavelengths are a powerful tool to mainly study the cold gas and dust components on spatial scales on the order of 1000 AU (e.g., Cesaroni et al. 2007), such observations are not that well suited to investigate the inner and warmer components of massive rotating structures. In contrast to that, mid-infrared spectral lines, e.g., ro-vibrationally excited CO emission lines, can trace these warm gas components. However, the spectral and/or spatial resolution was mostly lacking because absorption features were dominating, hence prohibiting the detection of the accretion disks in emission. Several recent studies have further demonstrated the power of high-spectral and high-spatial resolution CO mid-infrared spectroscopy for disks around low-mass YSOs and Herbig Ae stars (e.g., van der Plas et al. 2009; Pontoppidan et al. 2008; Goto et al. 2006).
To achieve the highest angular and spectral resolution
possible, we
observed some of the closest massive disk candidates in Orion at a
distance of 414 pc (Menten
et al. 2007) - Orion-BN (the
Becklin-Neugebauer Object), source n and IRC3 - in the
CO v=1-0 transitions around 4.65 ![]() m with the CRyogenic
high resolution InfraRed Echelle Spectrograph (CRIRES,
Käufl et al. 2004)
at the VLT. Both objects are well detected at
mid-infrared wavelengths exhibiting various kinds of disk-signatures.
m with the CRyogenic
high resolution InfraRed Echelle Spectrograph (CRIRES,
Käufl et al. 2004)
at the VLT. Both objects are well detected at
mid-infrared wavelengths exhibiting various kinds of disk-signatures.
The Becklin-Neugebauer Object: since its detection in the
1960s,
the BN object has been one of the archetypical high-mass YSOs
(Henning
et al. 1990; Becklin & Neugebauer 1967).
Scoville et al. (1983)
observed the
source in several frequency settings between 2 and 5 ![]() m and
detected molecular emission from several CO isotopologues (fundamental
and overtone emission), and they inferred that BN exhibits an
outflow/wind, as well as a highly confined region of molecular gas at
high densities and temperatures of
m and
detected molecular emission from several CO isotopologues (fundamental
and overtone emission), and they inferred that BN exhibits an
outflow/wind, as well as a highly confined region of molecular gas at
high densities and temperatures of ![]() 3500 K. The estimated
luminosity of the BN object is
3500 K. The estimated
luminosity of the BN object is ![]()
![]() corresponding
to a B0.5 main sequence star (Scoville
et al. 1983). More
recently, Jiang et al.
(2005) observed BN in polarized near-infrared
emission and identified signatures caused by an embedded accretion
disk. The BN object has a high velocity along the line of
sight of
corresponding
to a B0.5 main sequence star (Scoville
et al. 1983). More
recently, Jiang et al.
(2005) observed BN in polarized near-infrared
emission and identified signatures caused by an embedded accretion
disk. The BN object has a high velocity along the line of
sight of
![]() 21 km s-1
compared with the cloud velocity of around
5 km s-1 (Scoville et al. 1993).
This is consistent with the
measured high proper motions of that object (e.g.,
Plambeck et al. 1995).
Whether the BN object is expelled from the
Trapezium system or during a disintegration of a bound system once
containing source I, source n and the
BN object itself is still a
matter of debate (e.g., Gómez et al. 2005; Zapata
et al. 2009; Tan 2004).
21 km s-1
compared with the cloud velocity of around
5 km s-1 (Scoville et al. 1993).
This is consistent with the
measured high proper motions of that object (e.g.,
Plambeck et al. 1995).
Whether the BN object is expelled from the
Trapezium system or during a disintegration of a bound system once
containing source I, source n and the
BN object itself is still a
matter of debate (e.g., Gómez et al. 2005; Zapata
et al. 2009; Tan 2004).
Source n: based on a bipolar radio morphology and H2O
maser association, Menten &
Reid (1995) suggested that this source may be
one of the driving sources of the powerful molecular outflows within
Orion-KL. Extended mid-infrared emission was observed perpendicular to
the outflow axis (Greenhill
et al. 2004; Shuping et al. 2004),
and
Luhman (2000) detected CO
overtone emission. Both features are
interpreted as likely being due to an accretion disk. Source n is
believed to be in an evolutionary younger stage than the
BN object,
and the luminosity is estimated to be lower as well, on the order of
2000 ![]() (Greenhill et al. 2004).
(Greenhill et al. 2004).
IRC3: the source n observations serendipitously covered the
extended infrared source IRC3 (e.g., Dougados
et al. 1993) which we
present here as well. At 3.6 ![]() m wavelengths, IRC3 is elongated in
the northeast-southwest direction (Dougados
et al. 1993) and shows
highly polarized near- to mid-infrared emission (Minchin et al. 1991).
The observations are consistent with IRC3 being a dust density
enhancement reprocessing light from another source, potentially IRC2
(Downes
et al. 1981; Dougados et al. 1993;
Minchin
et al. 1991).
m wavelengths, IRC3 is elongated in
the northeast-southwest direction (Dougados
et al. 1993) and shows
highly polarized near- to mid-infrared emission (Minchin et al. 1991).
The observations are consistent with IRC3 being a dust density
enhancement reprocessing light from another source, potentially IRC2
(Downes
et al. 1981; Dougados et al. 1993;
Minchin
et al. 1991).
Figure 1 gives an overview of the region marking the sources discussed in the paper as well as the slit orientations (see also Sect. 2). The nominal absolute positions for the three sources are listed in Table 1.
![\begin{figure}
\par\includegraphics[width=8.5cm,clip]{13107f1.eps}
\end{figure}](/articles/aa/full_html/2010/04/aa13107-09/img19.png)
|
Figure 1:
Overview image of the region. The grey-scale |
| Open with DEXTER | |
Table 1: Source positions (from Dougados et al. 1993).
2 Observations
We obtained high-resolution spectra between 4.6 and 4.7 ![]() m with
CRIRES (Käufl et al. 2004)
mounted on UT1 at the VLT on Paranal, Chile.
Two grating settings were selected (12/-1/n,
m with
CRIRES (Käufl et al. 2004)
mounted on UT1 at the VLT on Paranal, Chile.
Two grating settings were selected (12/-1/n,
![]() and 12/-1/i,
and 12/-1/i, ![]() )
to observe the spectral interval covering the 12CO v=1-0[P(1)-P(5)/R(0)-R(8)] lines
without gaps.
)
to observe the spectral interval covering the 12CO v=1-0[P(1)-P(5)/R(0)-R(8)] lines
without gaps.
One slit covered the BN object with a position angle
of 126 degrees
east of north, whereas the second slit included source n and IRC3 with
a position angle of 110 degrees east of north. For the strong source
BN, only 40 secs (DIT = 2 secs,
NDIT = 10) were required. For the second
object with the weaker sources we had a total on-slit integration time
of 20 min (DIT = 10 secs,
NDIT = 2). For the BN observation a slit
width of ![]() was used while for the observation of source n a slit
with of
was used while for the observation of source n a slit
with of ![]() was selected which correspond to spectral resolving
powers
was selected which correspond to spectral resolving
powers ![]() of 100 000 and 50 000, respectively.
The non-AO mode was applied since no natural guide star is available
in the close environment. The infrared seeing measured from the
spectra was 0.35
of 100 000 and 50 000, respectively.
The non-AO mode was applied since no natural guide star is available
in the close environment. The infrared seeing measured from the
spectra was 0.35
![]() during the BN observation and 0.45
during the BN observation and 0.45
![]() for the source n observation. The nod-throw of all the observations
was set to 10
for the source n observation. The nod-throw of all the observations
was set to 10
![]() .
To correct for the telluric absorption lines,
attached to every science observation a telluric standard star
(HR 1666 with spectral type A3III) was observed.
.
To correct for the telluric absorption lines,
attached to every science observation a telluric standard star
(HR 1666 with spectral type A3III) was observed.
As extended emission in the CO lines was present in the observations, we corrected the frames for distortion in order to get a wavelength solution valid for the whole chip. Firstly, the chips are slightly rotated with respect to the slit (ranging from 0.05 degree for chip 3 to 0.45 degree in the case of chip 4). We measured the position of the brightest object as function of wavelength and calculate from the displacement in position the rotation angle. Secondly, after the rotation angle has been corrected, the curvature of the slit is corrected by measuring the position (central wavelength) of a sky-line as function of the spatial coordinate. This could be described with a 2nd degree polynomial. Using the IDL routines polywarp and poly_2d, the distortion was corrected.
After the distortion correction, the raw files are processed
by the
ESO CRIRES pipeline (version 1.10.1) in combination with the
Gasgano
software. The data are dark subtracted, flat field corrected as well
as corrected for non-linearity. The wavelength calibration is done
using the telluric emission lines in combination with a HITRAN model
spectrum (Rothman et al.
2005). A cross-correlation of the spectra with
the HITRAN spectra showed that the wavelength accuracy of the spectra
is ![]() 0.5 km s-1.
0.5 km s-1.
Two absorption lines are present in the standard star: the
Pfund ![]() and the Humphreys
and the Humphreys ![]() line. Due to the strong
telluric absorption, these lines are not trivial to remove. Therefore,
we first reduced the spectrum without correcting for the intrinsic
absorption lines of the standard star. In the final reduced spectrum
these lines become eminent as emission lines free from contamination
by the atmosphere. The Pfund
line. Due to the strong
telluric absorption, these lines are not trivial to remove. Therefore,
we first reduced the spectrum without correcting for the intrinsic
absorption lines of the standard star. In the final reduced spectrum
these lines become eminent as emission lines free from contamination
by the atmosphere. The Pfund ![]() line is also seen in our
science object. However, the Humphreys
line is also seen in our
science object. However, the Humphreys ![]() line is not present
in the science spectrum of BN before division by the standard star.
Therefore, it can be used to correct for the absorption lines of the
standard star. We used a high resolution Kurucz model spectrum from
an A0V star (http://kurucz.har vard.edu/stars.html) and scaled and
shifted the model spectrum such that the Humphreys
line is not present
in the science spectrum of BN before division by the standard star.
Therefore, it can be used to correct for the absorption lines of the
standard star. We used a high resolution Kurucz model spectrum from
an A0V star (http://kurucz.har vard.edu/stars.html) and scaled and
shifted the model spectrum such that the Humphreys ![]() profile
would fit that of the observed Humphreys
profile
would fit that of the observed Humphreys ![]() profile in the
standard star. Assuming that the Pfund
profile in the
standard star. Assuming that the Pfund ![]() line scales in the
same way as the Humphreys
line scales in the
same way as the Humphreys ![]() line does, we divided with the
model spectrum to remove the line contamination.
line does, we divided with the
model spectrum to remove the line contamination.
The spectra were corrected for the earth velocity to the local
standard of rest using rvcorrect in IRAF. The velocity
corrections
applied for the two observing dates were -3.8 km s-1
for the
BN data (observed on 21st October 2007) and
+43.2 km s-1 for
the source n/IRC3 observations (taken on 21st February 2008). The
velocity relative to the local standard of rest ![]() of
Orion varies between 2.5 and 9 km s-1
(e.g.,
Comito et al. 2005),
and we adopt the approximate value of
+5 km s-1.
of
Orion varies between 2.5 and 9 km s-1
(e.g.,
Comito et al. 2005),
and we adopt the approximate value of
+5 km s-1.
3 Results
![\begin{figure}
\par\includegraphics[angle=-90,width=17cm,clip]{13107f2.eps} %
\end{figure}](/articles/aa/full_html/2010/04/aa13107-09/img26.png)
|
Figure 2:
CRIRES observations of the R and P CO line series around 4.65 |
| Open with DEXTER | |
Toward all three sources we detected the whole suite of
12CO v=1-0 lines
present in the spectral window, the
13CO v=1-0 lines
from R(6) to R(13) that were not blended by
the 12CO v=1-0 lines,
as well as the Pfund ![]() line.
Figure 2
presents the complete spectrum toward the
BN object, and Table 2 gives an overview
of the covered
lines, their wavelengths
line.
Figure 2
presents the complete spectrum toward the
BN object, and Table 2 gives an overview
of the covered
lines, their wavelengths ![]() and the lower-level energy state of
the transitions (
and the lower-level energy state of
the transitions (
![]() ). In total, this setup covers
a
broad range of energy levels extending up to 504 K.
). In total, this setup covers
a
broad range of energy levels extending up to 504 K.
Table 2: Observed lines.
3.1 The BN object
3.1.1 CO absorption and emission
Figure 3
presents a zoom compilation of 12CO data
from the R(1) to R(8) line covering lower energy levels
between 5.5
and 199 K. If one ignores the telluric line feature at
![]() 3 km s-1
two broad absorption features can be identified
at approximately -14 and +8 km s-1.
Since all 12CO
lines are saturated, their peak absorption velocities are unreliable,
and we refer to the 13CO data (Fig. 4). The peak
velocity of the blue-shifted component is
3 km s-1
two broad absorption features can be identified
at approximately -14 and +8 km s-1.
Since all 12CO
lines are saturated, their peak absorption velocities are unreliable,
and we refer to the 13CO data (Fig. 4). The peak
velocity of the blue-shifted component is ![]() km s-1extending
from
km s-1extending
from ![]() -28 to
-28 to ![]() -8 km s-1.
The second
absorption feature has its peak at
-8 km s-1.
The second
absorption feature has its peak at ![]() 8 km s-1,
close to
the
8 km s-1,
close to
the ![]() of the cloud, and extends from
of the cloud, and extends from ![]() -8 to
-8 to ![]() 18 km s-1.
Furthermore, red-shifted from the absorption we
clearly identify a CO emission peaking in 12CO
and 13CO at
18 km s-1.
Furthermore, red-shifted from the absorption we
clearly identify a CO emission peaking in 12CO
and 13CO at
![]() 20 km s-1
and extending from
20 km s-1
and extending from ![]() 15
to
15
to
![]() 30 km s-1.
The overall extent of the 12CO absorption
and emission is from
30 km s-1.
The overall extent of the 12CO absorption
and emission is from ![]() -30
to
-30
to ![]() +30 km s-1.
It should
be noted that while the
+30 km s-1.
It should
be noted that while the ![]() of the different cloud
components for the Orion-KL region vary between
approximately 3 and
9 km s-1, Scoville et al. (1983)
inferred that the corresponding
velocity of the BN object is significantly higher around
21 km s-1 (consistent with the
different BN ejection scenarios,
e.g., Gómez
et al. 2005; Tan 2004). While the absorption
features stem
from the warmer protostellar envelopes and the surrounding cloud with
usual temperatures on the order of 100 K (see also Boltzmann
analysis
below), the ro-vibrational lines in emission can be caused by
different processes. For example, fluorescence via UV photons or
resonance scattering from strong infrared fields can excite these
lines without significantly heating the gas (e.g.,
Ryde
& Schöier 2001; Blake & Boogert 2004).
Alternatively, the ro-vibrational lines
could be caused by hotter gas components (see discussion in
Sect. 4).
We note that the critical densities of these lines are
on the order of 1013 cm-3
which practically implies that extended
gas components can be hardly responsible for the emission.
of the different cloud
components for the Orion-KL region vary between
approximately 3 and
9 km s-1, Scoville et al. (1983)
inferred that the corresponding
velocity of the BN object is significantly higher around
21 km s-1 (consistent with the
different BN ejection scenarios,
e.g., Gómez
et al. 2005; Tan 2004). While the absorption
features stem
from the warmer protostellar envelopes and the surrounding cloud with
usual temperatures on the order of 100 K (see also Boltzmann
analysis
below), the ro-vibrational lines in emission can be caused by
different processes. For example, fluorescence via UV photons or
resonance scattering from strong infrared fields can excite these
lines without significantly heating the gas (e.g.,
Ryde
& Schöier 2001; Blake & Boogert 2004).
Alternatively, the ro-vibrational lines
could be caused by hotter gas components (see discussion in
Sect. 4).
We note that the critical densities of these lines are
on the order of 1013 cm-3
which practically implies that extended
gas components can be hardly responsible for the emission.
Although the blue-shifted part of the spectrum with respect to
the
![]() of the molecular cloud is slightly broader than the
red-shifted part, nevertheless we clearly identify red-shifted
absorption as well. To first order, the blue-shifted gas seen in
absorption can be identified with outflowing gas from the region,
whereas the red-shifted features belong to gas infalling in the
direction of the central source. The outflowing gas with a maximum
velocity relative to the
of the molecular cloud is slightly broader than the
red-shifted part, nevertheless we clearly identify red-shifted
absorption as well. To first order, the blue-shifted gas seen in
absorption can be identified with outflowing gas from the region,
whereas the red-shifted features belong to gas infalling in the
direction of the central source. The outflowing gas with a maximum
velocity relative to the ![]() of
of ![]() 35 km s-1
is
consistent with outflow wings often observed at mm wavelengths from
young massive star-forming regions (e.g., Beuther
et al. 2002b). It
should be noted that the even broader outflow wings observed at mm
wavelength toward Orion-KL exceeding
35 km s-1
is
consistent with outflow wings often observed at mm wavelengths from
young massive star-forming regions (e.g., Beuther
et al. 2002b). It
should be noted that the even broader outflow wings observed at mm
wavelength toward Orion-KL exceeding ![]() 50 km s-1
(e.g.,
Chernin & Wright 1996)
are likely not related to the BN object but
rather to one or more sources about
50 km s-1
(e.g.,
Chernin & Wright 1996)
are likely not related to the BN object but
rather to one or more sources about ![]() south-east of BN (source I,
source n and/or SMA1, e.g.,
Beuther
& Nissen 2008; Greenhill et al. 2004;
Jiang
et al. 2005; Bally 2008).
south-east of BN (source I,
source n and/or SMA1, e.g.,
Beuther
& Nissen 2008; Greenhill et al. 2004;
Jiang
et al. 2005; Bally 2008).
How do these general features compare with the data published
by
Scoville et al. (1983)
which were observed during several observing runs
between December 1977 and February 1981, hence about 30 years
prior to
our observations. The general CO line structure with two
strong
absorption features plus one red-shifted emission peak are largely
the same. Also the overall extent of the emission is quite similar.
Compared to our measured values of ![]() -15,
-15, ![]() +9 and
+9 and ![]() 20 km s-1
for the three components, Scoville
et al. (1983)
report for the corresponding features velocities of -18, +9
and
+20 km s-1. While two
velocities agree well, the most
blue-shifted absorption peak appears to have shifted a little bit
between the two observations. However, given that their spectral
resolution was more than a factor 2 lower than that of the new
CRIRES
data (7 versus 3 km s-1), we
refrain from further
interpretation of this. Furthermore, Scoville
et al. (1983) identify two
more absorption features, one at -3 km s-1
and one at
+30 km s-1. Regarding the
-3 km s-1 component we are
not able to infer any changes because that features lies very close to
the telluric emission which obscures any reliable signature there.
However, Fig. 3
shows that we do not detect any
additional absorption feature blue-shifted from the
26.6 km s-1emission.
Therefore, the +30 km s-1
absorption dip reported by
Scoville et al. (1983)
was either a transient feature or not significant
with respect to the signal-to-noise ratio.
20 km s-1
for the three components, Scoville
et al. (1983)
report for the corresponding features velocities of -18, +9
and
+20 km s-1. While two
velocities agree well, the most
blue-shifted absorption peak appears to have shifted a little bit
between the two observations. However, given that their spectral
resolution was more than a factor 2 lower than that of the new
CRIRES
data (7 versus 3 km s-1), we
refrain from further
interpretation of this. Furthermore, Scoville
et al. (1983) identify two
more absorption features, one at -3 km s-1
and one at
+30 km s-1. Regarding the
-3 km s-1 component we are
not able to infer any changes because that features lies very close to
the telluric emission which obscures any reliable signature there.
However, Fig. 3
shows that we do not detect any
additional absorption feature blue-shifted from the
26.6 km s-1emission.
Therefore, the +30 km s-1
absorption dip reported by
Scoville et al. (1983)
was either a transient feature or not significant
with respect to the signal-to-noise ratio.
Since the 12CO data are so strongly
saturated, for the following
analysis we use the corresponding 13CO data
covering the R(6) to
R(13) transitions (Fig. 2).
Since the absorption depth
I/I0 is
related to the optical depth ![]() via
via
![]() we can directly estimate the optical depth
of the 13CO absorption lines shown in
Fig. 4
if the
lines are spectrally resolved. Since the full width at zero intensity
(FWZI) is on the order of 20 km s-1
(see above), this criterion is
fulfilled with our spectral resolution
we can directly estimate the optical depth
of the 13CO absorption lines shown in
Fig. 4
if the
lines are spectrally resolved. Since the full width at zero intensity
(FWZI) is on the order of 20 km s-1
(see above), this criterion is
fulfilled with our spectral resolution ![]() which
corresponds to a velocity resolution of 3 km s-1.
Except
of the lowest 13CO R(6) line component at
+9 km s-1 all
other observed 13CO absorption features have
optical depths below
1. This allows us to estimate rotational temperatures via Boltzmann
plots from the equivalent line width following the approach outlined
in Scoville et al. (1983)
also adopting their finite optical depth
corrections. Using their Eq. (A8), the column density Nl
of
the lower-level energy state is
which
corresponds to a velocity resolution of 3 km s-1.
Except
of the lowest 13CO R(6) line component at
+9 km s-1 all
other observed 13CO absorption features have
optical depths below
1. This allows us to estimate rotational temperatures via Boltzmann
plots from the equivalent line width following the approach outlined
in Scoville et al. (1983)
also adopting their finite optical depth
corrections. Using their Eq. (A8), the column density Nl
of
the lower-level energy state is
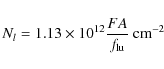
with F, A and
with gl the statistical weight of the lower-level transition and Q(T) the partition function at the given temperature.
![\begin{figure}
\par\includegraphics[angle=-90,width=8cm,clip]{13107f3.eps}
\end{figure}](/articles/aa/full_html/2010/04/aa13107-09/img38.png)
|
Figure 3:
The 12CO R(8) to R(1) lines from top
to bottom toward the BN object. Telluric and |
| Open with DEXTER | |
![\begin{figure}
\par\includegraphics[angle=-90,width=16cm,clip]{13107f4.eps}
\end{figure}](/articles/aa/full_html/2010/04/aa13107-09/img39.png)
|
Figure 4: 13CO optical depths toward the BN object. |
| Open with DEXTER | |
Table 3: 13CO values for Boltzmann plots.
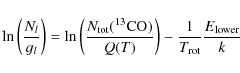
Figure 5
presents the corresponding Boltzmann plot
where the lower-state column density Nl
divided by the statistical
weight gJ
is plotted against the lower-state energy
![]() divided by k. A linear fit to the data
gives the
rotational temperature
divided by k. A linear fit to the data
gives the
rotational temperature
![]() and the column density of
13CO divided by the partition function Q(T).
For the
-15 km s-1 13CO
component the fitted
and the column density of
13CO divided by the partition function Q(T).
For the
-15 km s-1 13CO
component the fitted ![]() is
is
![]()
![]() K.
Scoville et al. (1983)
calculated the rotation
temperature for the more blue-shifted absorption component from the
12CO v=2-0
transitions, and they find
K.
Scoville et al. (1983)
calculated the rotation
temperature for the more blue-shifted absorption component from the
12CO v=2-0
transitions, and they find ![]() 150 K
there,
which is approximately consistent with our new determination. The
other fitted parameter is
150 K
there,
which is approximately consistent with our new determination. The
other fitted parameter is ![]() cm-2.
For 2-atomic molecules like 13CO
the partition function can be approximated by
cm-2.
For 2-atomic molecules like 13CO
the partition function can be approximated by ![]() (where B is the rotation constant), and we
get a
13CO column density of
(where B is the rotation constant), and we
get a
13CO column density of ![]()
![]() cm-2.
Using
furthermore the 12CO to 13CO
isotopologic ratio of 69 (e.g.,
Sheffer et al. 2007),
we derive a total CO column density of the
-15 km s-1 component toward
Orion-BN of
cm-2.
Using
furthermore the 12CO to 13CO
isotopologic ratio of 69 (e.g.,
Sheffer et al. 2007),
we derive a total CO column density of the
-15 km s-1 component toward
Orion-BN of ![]()
![]() cm-2.
These column density estimates are in excellent
agreement with the results derived by Scoville
et al. (1983) from the
12CO v=2-0 lines.
cm-2.
These column density estimates are in excellent
agreement with the results derived by Scoville
et al. (1983) from the
12CO v=2-0 lines.
How do these values compare to other observations? The
BN object was
detected at 1.3 mm wavelength by Blake
et al. (1996) at a 0.15 Jy
level with a spatial resolution of ![]() .
Following
Plambeck et al. (1995),
about 50 mJy of that flux can be attributed to
circumstellar dust emission. Assuming optically thin dust emission,
an average dust temperature of 100 K, a dust opacity
index
.
Following
Plambeck et al. (1995),
about 50 mJy of that flux can be attributed to
circumstellar dust emission. Assuming optically thin dust emission,
an average dust temperature of 100 K, a dust opacity
index ![]() of 2 and a standard gas-to-dust ratio of 100, we can
calculate the total
H2 column density
(Beuther
et al. 2002a; Draine et al. 2007; Ossenkopf
& Henning 1994; Hildebrand 1983; Beuther
et al. 2005a; Henning et al. 1995).
The derived H2 column density and mass within
their
of 2 and a standard gas-to-dust ratio of 100, we can
calculate the total
H2 column density
(Beuther
et al. 2002a; Draine et al. 2007; Ossenkopf
& Henning 1994; Hildebrand 1983; Beuther
et al. 2005a; Henning et al. 1995).
The derived H2 column density and mass within
their ![]() synthesized beam are then
synthesized beam are then ![]() cm-2and
0.1
cm-2and
0.1 ![]() ,
respectively. For comparison, using a standard
CO-to-H2 ratio of
,
respectively. For comparison, using a standard
CO-to-H2 ratio of ![]() ,
the H2 column density
estimated here from the CO IR spectroscopy data is
,
the H2 column density
estimated here from the CO IR spectroscopy data is ![]()
![]() cm-2.
While the mm continuum data trace all velocity
components along the line of sight, the near-infrared data trace
selected velocity components. Judging from Figs. 3 and 4, where we see
more than 1 velocity component, the
total column density traced by the CO data is more than a
factor 2
higher. Furthermore, the CO absorption only traces the gas in the
foreground of the near-infrared source reducing the traced gas by
another factor 2. While both approaches are affected by
systematics
- e.g., the mm derived column densities can be wrong by a
factor 5
depending on the assumptions on the dust properties and temperatures
- other reasons are more important for some of the differences. In
particular, the mm continuum emission is sensitive to the cold and
warm dust emission whereas the near-infrared absorption of the
13CO transitions useable for our
analysis traces mainly the
warmer gas. Therefore, these data indicate that a large fraction of
the gas is at relatively low temperatures.
cm-2.
While the mm continuum data trace all velocity
components along the line of sight, the near-infrared data trace
selected velocity components. Judging from Figs. 3 and 4, where we see
more than 1 velocity component, the
total column density traced by the CO data is more than a
factor 2
higher. Furthermore, the CO absorption only traces the gas in the
foreground of the near-infrared source reducing the traced gas by
another factor 2. While both approaches are affected by
systematics
- e.g., the mm derived column densities can be wrong by a
factor 5
depending on the assumptions on the dust properties and temperatures
- other reasons are more important for some of the differences. In
particular, the mm continuum emission is sensitive to the cold and
warm dust emission whereas the near-infrared absorption of the
13CO transitions useable for our
analysis traces mainly the
warmer gas. Therefore, these data indicate that a large fraction of
the gas is at relatively low temperatures.
3.1.2 Potential signatures from the BN disk?
While most of the observed emission is spatially unresolved, we find
weak extended 12CO emission toward the
BN object. Figure 6
presents a position-velocity diagram along the slit
direction (PA of 126
![]() east of north, see Sect. 2)
which corresponds to the proposed disk orientation (Jiang et al. 2005).
We find CO emission around the rest velocity of the BN object
of
east of north, see Sect. 2)
which corresponds to the proposed disk orientation (Jiang et al. 2005).
We find CO emission around the rest velocity of the BN object
of ![]() 21 km s-1
extending approximately
21 km s-1
extending approximately ![]()
![]() in both
directions. Since we do not identify any strong velocity dispersion,
this extended emission is unlikely to be due to an outflow, but it may
potentially come from the proposed disk (Jiang
et al. 2005). The
measured extent of
in both
directions. Since we do not identify any strong velocity dispersion,
this extended emission is unlikely to be due to an outflow, but it may
potentially come from the proposed disk (Jiang
et al. 2005). The
measured extent of ![]()
![]() would then correspond at the given
distance of Orion of 414 pc to an approximate disk diameter of
would then correspond at the given
distance of Orion of 414 pc to an approximate disk diameter of
![]() 3300 AU
or a disk radius of 1650 AU. While such disk size would be
comparably large with respect to typical low-mass disks (e.g., several
reviews in Reipurth
et al. 2007), it is consistent with measured
sizes of rotating structures in other high-mass star-forming regions
(e.g., Beuther
& Walsh 2008; Beltrán et al. 2006;
Cesaroni
et al. 2005; Schreyer et al. 2002).
3300 AU
or a disk radius of 1650 AU. While such disk size would be
comparably large with respect to typical low-mass disks (e.g., several
reviews in Reipurth
et al. 2007), it is consistent with measured
sizes of rotating structures in other high-mass star-forming regions
(e.g., Beuther
& Walsh 2008; Beltrán et al. 2006;
Cesaroni
et al. 2005; Schreyer et al. 2002).
![\begin{figure}
\par\includegraphics[angle=-90,width=9cm]{13107f5.eps}
\end{figure}](/articles/aa/full_html/2010/04/aa13107-09/img58.png)
|
Figure 5: Boltzmann plot for the 13CO v=1-0 lines toward the BN object. The x-axis shows the lower-level energies of the transitions and the y-axis presents the natural logarithm of the corresponding column densities divided by their statistical weights. |
| Open with DEXTER | |
![\begin{figure}
\par\includegraphics[width=6cm,clip]{13107f6.eps}
\end{figure}](/articles/aa/full_html/2010/04/aa13107-09/img59.png)
|
Figure 6:
Position velocity diagram of the 12CO (R0) line
toward the BN object along the slit direction (PA of 126
|
| Open with DEXTER | |
While we do not identify extended emission is the rarer 13CO
isotopologue, the CO and 13CO emission feature
around
20 km s-1 exhibits an
additional interesting feature in the
13CO data (Fig. 4): while the
emission feature is at
the edge of the bandpass for the 13CO R(6)
line, it remains
undetected for the R(7) line and only comes up for the lines greater
R(9). This emission feature is also visible in all 12CO lines
(R(1) to R(8)) shown in Fig. 3, but it does
not
exhibit any significant shape change there. Likely, the 12CO emission
is optically thick and traces only an outer envelope that
does not show big variations with excitation temperature. In contrast
to that, the measured Gaussian line width of that component for the
more optically thin 13CO R(9), R(10), R(11),
R(12) and R(13)
lines are 4.3, 5.3, 6.5, 6.4 and 6.6 km s-1,
respectively.
Although errors on the line width are difficult to quantify because
the emission is at the flank of the strong absorption feature, and
furthermore our spectral resolution is only 3 km s-1,
the data
are indicative of a line width increase with excitation temperature
of the line that appears to saturate for the highest detectable
transitions R(11) to R(13). While for a centrifugally supported disk
with a central mass of ![]() 10
10 ![]() the circular velocity at
3300 AU is relatively low on the order of
the circular velocity at
3300 AU is relatively low on the order of ![]() 1.6 km s-1,
the
measured line width increase is consistent with a rotating disk
structure because the inner region with higher rotation velocities
should have higher temperatures caused by the exciting central star.
One has to keep in mind that for purely thermal excitation, rotation
would not cause such an effect because the upper levels - all in the
3000 K regime - do not exhibit big relative excitation
differences.
Hence, they do not trace significantly different regions of a disk
then. In contrast to that, for lines that are excited by UV
fluorescence such an effect is possible because the excitation
mechanism via an electronic excited state tends to preserve the level
population of the v=0 rotational states (e.g.,
Brittain et al. 2009).
Therefore, in this case the R(9) to R(13)
lines are sensitive to gas temperatures in a relatively broader range
between 150 and 500 K (Table 2). An exact
reproduction of
the line width increase would require a detailed disk model, including
its density and temperature structure. Since we cannot constrain
these parameters well from our data, this is beyond the scope of this
paper. Although the line width increase is below our nominal spectral
resolution element, qualitatively the observations are consistent with
a rotating disk structure.
1.6 km s-1,
the
measured line width increase is consistent with a rotating disk
structure because the inner region with higher rotation velocities
should have higher temperatures caused by the exciting central star.
One has to keep in mind that for purely thermal excitation, rotation
would not cause such an effect because the upper levels - all in the
3000 K regime - do not exhibit big relative excitation
differences.
Hence, they do not trace significantly different regions of a disk
then. In contrast to that, for lines that are excited by UV
fluorescence such an effect is possible because the excitation
mechanism via an electronic excited state tends to preserve the level
population of the v=0 rotational states (e.g.,
Brittain et al. 2009).
Therefore, in this case the R(9) to R(13)
lines are sensitive to gas temperatures in a relatively broader range
between 150 and 500 K (Table 2). An exact
reproduction of
the line width increase would require a detailed disk model, including
its density and temperature structure. Since we cannot constrain
these parameters well from our data, this is beyond the scope of this
paper. Although the line width increase is below our nominal spectral
resolution element, qualitatively the observations are consistent with
a rotating disk structure.
3.1.3 The
Pfund  line toward the BN object and H2 emission nearby
BN
line toward the BN object and H2 emission nearby
BN
Figure 7
presents a zoom into the Pfund ![]() line.
The line shape consists of two components, one central Gaussian
component and broad line wings. It is possible to fit the whole
profile relatively well with a two-component Gaussian fit where the
central component has a FWHM
line.
The line shape consists of two components, one central Gaussian
component and broad line wings. It is possible to fit the whole
profile relatively well with a two-component Gaussian fit where the
central component has a FWHM ![]() km s-1
and the
broad component has a FWHM of
km s-1
and the
broad component has a FWHM of ![]() km s-1.
The
full width down to zero intensity is approximately
340 km s-1(between -170 and
170 km s-1). Close to the peak
of the profile
at around 25 km s-1, the
spectrum exhibits a small dip which is
likely an artifact from the telluric corrections (see Sect. 2). Considering this,
the peak of the central Gaussian fit at
km s-1.
The
full width down to zero intensity is approximately
340 km s-1(between -170 and
170 km s-1). Close to the peak
of the profile
at around 25 km s-1, the
spectrum exhibits a small dip which is
likely an artifact from the telluric corrections (see Sect. 2). Considering this,
the peak of the central Gaussian fit at
![]() 16.5 km s-1
is still consistent with the velocity derived
for the BN object by Scoville
et al. (1983) of
16.5 km s-1
is still consistent with the velocity derived
for the BN object by Scoville
et al. (1983) of ![]() 21 km s-1.
21 km s-1.
![\begin{figure}
\par\includegraphics[angle=-90,width=9cm,clip]{13107f7.eps}
\end{figure}](/articles/aa/full_html/2010/04/aa13107-09/img62.png)
|
Figure 7:
Hydrogen recombination Pfund |
| Open with DEXTER | |
Figure 7
also presents as thick dots the best fit
obtained by Scoville
et al. (1983) for the Br![]() line (their
Fig. 7 re-scaled to our normalized spectrum). Their model
consists of a
supersonic, optically thin decelerating outflow with a velocity law of
line (their
Fig. 7 re-scaled to our normalized spectrum). Their model
consists of a
supersonic, optically thin decelerating outflow with a velocity law of
![]() .
It is remarkable how well the shape of their
Br
.
It is remarkable how well the shape of their
Br![]() line obtained
line obtained ![]() 30 years
ago corresponds to the shape
of the newly observed Pfund
30 years
ago corresponds to the shape
of the newly observed Pfund ![]() line. Hence, these
Pfund
line. Hence, these
Pfund ![]() data
are also consistent with their outflow model.
data
are also consistent with their outflow model.
![\begin{figure}
\par\includegraphics[width=8.5cm,clip]{13107f8.eps}
\end{figure}](/articles/aa/full_html/2010/04/aa13107-09/img63.png)
|
Figure 8:
Position velocity digram of the H2 emission
|
| Open with DEXTER | |
Furthermore, approximately ![]() south-east of the BN object we detect
H2 emission from the H2 0-0 S9
transition with
south-east of the BN object we detect
H2 emission from the H2 0-0 S9
transition with
![]() K.
This H2 emission feature is spatially
associated with the corresponding H2 knot in
near-infrared H2images (e.g., Nissen et al. 2007) as
well as with the mid-infrared
source IRc15 reported by Shuping
et al. (2004). Figure 8 shows
a position velocity diagram of this feature. While we do not resolve
any spatial structure of the H2 knot, it shows a
very broad
velocity extent going to blue-shifted velocities of
K.
This H2 emission feature is spatially
associated with the corresponding H2 knot in
near-infrared H2images (e.g., Nissen et al. 2007) as
well as with the mid-infrared
source IRc15 reported by Shuping
et al. (2004). Figure 8 shows
a position velocity diagram of this feature. While we do not resolve
any spatial structure of the H2 knot, it shows a
very broad
velocity extent going to blue-shifted velocities of ![]() -80 km s-1,
in excess of the CO absorption features measured
toward the BN object. Since we are mainly interested in the
BN object,
source n and IRC3, we refrain from further analysis of this
offset
H2 emission.
-80 km s-1,
in excess of the CO absorption features measured
toward the BN object. Since we are mainly interested in the
BN object,
source n and IRC3, we refrain from further analysis of this
offset
H2 emission.
3.2 Source n
3.2.1 CO absorption and emission
Due to the different observing dates, for source n (and IRC3
in the
following section) the telluric lines are almost entirely shifted out
of the CO spectrum. Figures 9
and 10
present the corresponding 12CO R-series lines
and the detected 13CO lines with their
associated optical depths.
In comparison to the previous BN data, for source n we only
identify
one broad absorption feature in the 12CO data
which is dominated
by blue-shifted outflowing gas. It is interesting to note that the
most blue-shifted absorption does not have a Gaussian shape but rather
a more extended wing-like structure. In the framework of accelerated
winds with distance from the driving star or disk, such a spectral
behavior would be expected. These accelerated winds increase in
velocity with distance from the star. Simultaneously, with increasing
distance from the driving source the density of the surrounding gas
and dust envelope also decreases, lowering the corresponding
absorption depth at those velocities. Hence, in this picture,
higher-velocity gas should show shallower absorption features in the
spectra (e.g., Lamers &
Cassinelli 1999). Furthermore, we also identify a
red-shifted emission component at ![]() +15 km s-1.
However,
compared to the BN object, where the emission feature can be
identified in all transitions, for source n it is more prominent in
the higher excited lines. The total width of the CO absorption and
emission is
+15 km s-1.
However,
compared to the BN object, where the emission feature can be
identified in all transitions, for source n it is more prominent in
the higher excited lines. The total width of the CO absorption and
emission is ![]() 90 km s-1
ranging from approximately
90 km s-1
ranging from approximately
![]() -65 to
-65 to ![]() +25 km s-1
(broader than for BN). The
blue-shifted end is less well determined because of telluric line
contamination. Nevertheless the blue-shifted outflow part of the
spectrum extends
+25 km s-1
(broader than for BN). The
blue-shifted end is less well determined because of telluric line
contamination. Nevertheless the blue-shifted outflow part of the
spectrum extends ![]() 70 km s-1
from the assumed
70 km s-1
from the assumed
![]() of +5 km s-1. This value
exceeds that measured
toward BN by about 20 km s-1.
Although at the edge of the
telluric line contamination, we tentatively identify an additional
discrete absorption feature at
of +5 km s-1. This value
exceeds that measured
toward BN by about 20 km s-1.
Although at the edge of the
telluric line contamination, we tentatively identify an additional
discrete absorption feature at ![]() -35 km s-1.
-35 km s-1.
![\begin{figure}
\par\includegraphics[angle=-90,width=8cm,clip]{13107f9.eps}
\end{figure}](/articles/aa/full_html/2010/04/aa13107-09/img65.png)
|
Figure 9:
The 12CO R(8) to R(1) lines from top
to bottom toward source n. Telluric and |
| Open with DEXTER | |
Since the 12CO line is again always saturated
(Fig. 9),
for the additional analysis we use the
corresponding 13CO data (Fig. 10). Because
of
line-blending and telluric emission, we only measure five 13CO
lines for source n. The broad, saturated 12CO
absorption feature
is clearly resolved into two components with approximate velocities at
![]() -7 km s-1
and
-7 km s-1
and ![]() +5 km s-1.
While the
+5 km s-1.
While the
![]() +5 km s-1
shows the deeper absorption features for the
lower energy R-lines, it is interesting to note that the single
absorption peak observed for the 13CO
R(13) line is associated
with the
+5 km s-1
shows the deeper absorption features for the
lower energy R-lines, it is interesting to note that the single
absorption peak observed for the 13CO
R(13) line is associated
with the ![]() -7 km s-1
component, indicating hotter gas at
more blue-shifted velocities. Following the approach outlined for BN
in Sect. 3.1.1,
the derived optical depth of 13CO is
-7 km s-1
component, indicating hotter gas at
more blue-shifted velocities. Following the approach outlined for BN
in Sect. 3.1.1,
the derived optical depth of 13CO is
![]() 0.6 at its
highest.
0.6 at its
highest.
Since the telluric lines are far away in velocity space (see
Fig. 9),
for source n we can conduct the
Boltzmann analysis for both absorption components separately. The
measured equivalent widths A for both
components are listed in Table 3![]() . Again
calculating the 13CO v=1
column densities (Table 3)
and producing Boltzmann plots (Fig. 11), we find
that
for both velocity components fits to all 5 data points are less good
than in the case of the BN object. This is likely due to the
fact that
fitting 2 Gaussians to the broad R(13) line, which does not show two
well separated absorption features anymore, may overestimate the
contribution of the
. Again
calculating the 13CO v=1
column densities (Table 3)
and producing Boltzmann plots (Fig. 11), we find
that
for both velocity components fits to all 5 data points are less good
than in the case of the BN object. This is likely due to the
fact that
fitting 2 Gaussians to the broad R(13) line, which does not show two
well separated absorption features anymore, may overestimate the
contribution of the ![]() -7 km s-1
component and hence
underestimate the contribution from the
-7 km s-1
component and hence
underestimate the contribution from the ![]() +5 km s-1component.
Therefore, we also fit only the 4 lower-energy transitions
between R(7) and R(12) resulting in better fits
(Fig. 11).
As expected from the different behavior of
the two absorption components with increasing energy levels, the
derived rotation temperatures using the 4 lower energy lines
of the
+5 km s-1component.
Therefore, we also fit only the 4 lower-energy transitions
between R(7) and R(12) resulting in better fits
(Fig. 11).
As expected from the different behavior of
the two absorption components with increasing energy levels, the
derived rotation temperatures using the 4 lower energy lines
of the
![]() -7 km s-1
and
-7 km s-1
and ![]() +5 km s-1
are
+5 km s-1
are ![]()
![]() K
and
K
and ![]()
![]() K,
respectively. As a comparison,
rotational temperatures measured at submm wavelength from CH3OH
emission lines toward source n are around 200 K (Beuther et al. 2005b).
Considering that these measurements are conducted with different
molecules and very different observational techniques, the overall
range of similar temperatures derived at mid-infrared and submm
wavelengths is reassuring for the complementarity of such
multi-wavelengths observations.
K,
respectively. As a comparison,
rotational temperatures measured at submm wavelength from CH3OH
emission lines toward source n are around 200 K (Beuther et al. 2005b).
Considering that these measurements are conducted with different
molecules and very different observational techniques, the overall
range of similar temperatures derived at mid-infrared and submm
wavelengths is reassuring for the complementarity of such
multi-wavelengths observations.
![\begin{figure}
\par\includegraphics[angle=-90,width=16.5cm,clip]{13107f10.eps}
\end{figure}](/articles/aa/full_html/2010/04/aa13107-09/img68.png)
|
Figure 10:
13CO optical depths toward
source n. The absorption feature at |
| Open with DEXTER | |
3.2.2 The
Pfund
line
The Pfund ![]() line is also detected toward source n
(Fig. 12),
and we can fit a Gaussian to the
recombination line with FWHM of
line is also detected toward source n
(Fig. 12),
and we can fit a Gaussian to the
recombination line with FWHM of ![]() km s-1,
a width down to 0 intensity of
km s-1,
a width down to 0 intensity of ![]() 70 km s-1
(from
70 km s-1
(from ![]() -35 to
-35 to ![]() +35 km s-1)
and a central velocity of
+35 km s-1)
and a central velocity of
![]() 0 km s-1.
The line is covered by 2 CRIRES chips, and
while the general Pfund
0 km s-1.
The line is covered by 2 CRIRES chips, and
while the general Pfund ![]() line shape is the
same for both
chips, the central dip at
line shape is the
same for both
chips, the central dip at ![]() 0 km s-1
cannot independently
be reproduced. Therefore, the dip is likely only an artifact due to
insufficient signal to noise.
0 km s-1
cannot independently
be reproduced. Therefore, the dip is likely only an artifact due to
insufficient signal to noise.
The thermal line width of a 104 K
hydrogen gas is
![]() 21.4 km s-1.
Convolving that with the 6 km s-1spectral
resolution, the observable thermal line width should be
21.4 km s-1.
Convolving that with the 6 km s-1spectral
resolution, the observable thermal line width should be
![]() 22.2 km s-1.
Therefore, the measured line width does not
exceed much the thermal line width of an H II region.
Hence, the
Pfund
22.2 km s-1.
Therefore, the measured line width does not
exceed much the thermal line width of an H II region.
Hence, the
Pfund ![]() emission from source n does not exhibit strong
signatures from a wind but is rather consistent with a thermal H II region.
We also cannot exclude that the Pfund
emission from source n does not exhibit strong
signatures from a wind but is rather consistent with a thermal H II region.
We also cannot exclude that the Pfund ![]() emission
toward source n is contaminated by more broadly distributed Orion
nebula emission.
emission
toward source n is contaminated by more broadly distributed Orion
nebula emission.
![\begin{figure}
\par\mbox{\includegraphics[angle=-90,width=8cm,clip]{1310711a.eps}\hskip5mm
\includegraphics[angle=-90,width=8cm,clip]{1310711b.eps} }\end{figure}](/articles/aa/full_html/2010/04/aa13107-09/img81.png)
|
Figure 11:
Boltzmann plots for the 13CO v=1-0
lines toward source n for the |
| Open with DEXTER | |
3.3 IRC3
As outlined in the Introduction, in contrast to the BN object and source n, the source IRC3 is unlikely to be a YSO, and it is not prominent in any typical hot core tracer (e.g., Blake et al. 1996; Beuther et al. 2005b). The source rather resembles a more extended dust density enhancement that reprocesses light from other sources, potentially IRC2. Figure 13 presents a part of the 2D slit spectrum clearly showing the extended nature of the CO emission toward IRC3 in contrast to the point-like continuum structure from source n. The continuum emission from IRC3 is very weak compared to that from source n.
Figure 14
shows the CO lines extracted as an average
spectrum of length ![]() toward IRC3. While we again see a broad
absorption feature against the weaker background extending from
toward IRC3. While we again see a broad
absorption feature against the weaker background extending from ![]() -5 km s-1
out to the telluric contamination at about
-40 km s-1, IRC3 shows a broad
and strong emission feature
peaking at
-5 km s-1
out to the telluric contamination at about
-40 km s-1, IRC3 shows a broad
and strong emission feature
peaking at ![]() 2 km s-1.
Since this emission is extended
over several arcseconds, Fig. 15 presents the
position
velocity diagrams of selected 12CO and all 13CO
lines. In
contrast to the BN object where the extended CO emission is
just
around the rest velocity of the star (Fig. 6), here we see a
clear trend of increasing velocity with increasing distance from the
continuum peak (the so-called Hubble law of outflows). Furthermore, in
particular the 12CO position velocity diagrams
show a twofold
structure with one velocity increase to values
>10 km s-1 at
offsets of
2 km s-1.
Since this emission is extended
over several arcseconds, Fig. 15 presents the
position
velocity diagrams of selected 12CO and all 13CO
lines. In
contrast to the BN object where the extended CO emission is
just
around the rest velocity of the star (Fig. 6), here we see a
clear trend of increasing velocity with increasing distance from the
continuum peak (the so-called Hubble law of outflows). Furthermore, in
particular the 12CO position velocity diagrams
show a twofold
structure with one velocity increase to values
>10 km s-1 at
offsets of ![]()
![]() and another increase to similar velocities at
and another increase to similar velocities at
![]()
![]() offset
from the main continuum peak. To guide the eye,
these wedge-like structures are sketched in the top-right panel of
Fig. 15).
Such multiple wedge position velocity
structures are what jet-bow-shock entrainment models for molecular
outflows predict (e.g., Arce
et al. 2007). Furthermore, similar to
source n, the CO absorption shows also for IRC3 the extended
wing-like
features toward the most blue-shifted absorption. Similar to the
pv-diagrams, where we see acceleration of the gas with distance from
the source, these wing-like absorption can also be interpreted in the
framework of accelerated winds (see also Sect. 3.2.1 or
Lamers & Cassinelli 1999).
offset
from the main continuum peak. To guide the eye,
these wedge-like structures are sketched in the top-right panel of
Fig. 15).
Such multiple wedge position velocity
structures are what jet-bow-shock entrainment models for molecular
outflows predict (e.g., Arce
et al. 2007). Furthermore, similar to
source n, the CO absorption shows also for IRC3 the extended
wing-like
features toward the most blue-shifted absorption. Similar to the
pv-diagrams, where we see acceleration of the gas with distance from
the source, these wing-like absorption can also be interpreted in the
framework of accelerated winds (see also Sect. 3.2.1 or
Lamers & Cassinelli 1999).
![\begin{figure}
\par\includegraphics[angle=-90,width=9cm,clip]{13107f12.eps}
\end{figure}](/articles/aa/full_html/2010/04/aa13107-09/img84.png)
|
Figure 12:
Hydrogen recombination Pfund |
| Open with DEXTER | |
| Figure 13:
Original data from the slit covering source n and IRC3. Source n is the
bright continuum source at offset |
|
| Open with DEXTER | |
4 Discussion and conclusion
High spectral resolution mid-infrared observations allow us to infer
several important characteristics of some of the major sources within
the Orion-KL region. The fundamental CO lines are largely dominated by
absorption from the individual YSO envelopes and their surrounding gas
cloud. These absorption features are blue- and red-shifted with
respect to the ![]() of the molecular cloud indicating that
outflowing and inflowing gas are simultaneously present toward our
target sources. However, we also identify interesting emission
features. Together they confirm the youth of the sources where infall
and likely accretion are still ongoing.
of the molecular cloud indicating that
outflowing and inflowing gas are simultaneously present toward our
target sources. However, we also identify interesting emission
features. Together they confirm the youth of the sources where infall
and likely accretion are still ongoing.
![\begin{figure}
\vspace*{5.3cm}
\includegraphics[angle=-90,width=8.8cm,clip]{13107f14.eps}
\end{figure}](/articles/aa/full_html/2010/04/aa13107-09/img87.png)
|
Figure 14:
The 12CO R(8) to R(1) lines (except of the R(4)
line from top to bottom toward IRC3. Since the
emission is extended, this spectrum is an average over |
| Open with DEXTER | |
BN object:
for the BN object, our data confirm, at double the spectral resolution, several of the assessments conducted already by Scoville et al. (1983). However, also discrepancies arise. For example, an absorption feature reported previously around +30 km s-1 is not found in the new data, indicating either transient components or poor signal-to-noise in the older data. From a Boltzmann analysis, the rotational temperature is around 112 K, and we derive CO column densities of several times 1018 cm-2, well in agreement with the older results based on 12CO v=2-0 by Scoville et al. (1983). Using standard CO-to-H2 conversion factors, these column densities are about an order of magnitude below H2column density estimates based on mm continuum emission. As discussed in Sect. 3.1.1, while systematics may account for some of this discrepancy, the main difference is that the mm continuum emission is sensitive to cold and warm dust, whereas the near-infrared absorption lines trace only the warm gas components.![\begin{figure}
\par\includegraphics[width=18cm,clip]{13107f15.eps}
\end{figure}](/articles/aa/full_html/2010/04/aa13107-09/img88.png)
|
Figure 15:
Position velocity cuts along the slit axis for IRC3 with a PA of
110 degrees east of north. The top row shows diagrams for
selected 12CO lines, and the bottom
row presents the 13CO data. For 13CO
the scaling is adapted to highlight the weaker extended emission in
contrast to the continuum at offset
|
| Open with DEXTER | |
Source n:
while bright sources like the BN object were already feasible to be observed a while ago (e.g., Scoville et al. 1983) weaker sources like source n or IRC3 were only possible to observe with reasonable high-spectral-resolution spectroscopy since the advent of recent instruments like CRIRES on the VLT. The general picture for source n is relatively similar. A single broad absorption feature extending approximately to -65 km s-1 traces mainly the molecular outflow whereas red-shifted emission likely stems from an inner infalling and accreting envelope/disk. This picture is consistent with disk/outflow proposals for this source deduced from cm and mid-infrared wavelength imaging projects (e.g., Menten & Reid 1995; Greenhill et al. 2004; Shuping et al. 2004). The clearly resolved double-peaked 13CO structure allows to conduct the Boltzmann analysis for both components. We find that the colder component has higher H2 column densities (IRC3:
the observational signatures from the dust density enhancement IRC3 are very different compared to the two previously discussed sources. The continuum from IRC3 is much weaker, nevertheless we detect CO absorption betweenLimitations and future:
one shortcoming of the data is that for our primary targets, the BN object and source n, we could not spatially resolve the inner region of the emission as done in the lower-mass case presented in Goto et al. (2006). The reasons may be different for the two sources. Source n is probably still too young and too deeply embedded so that the envelope overwhelms any emission from the embedded disk itself. The BN object has the advantage that its velocity of rest is offset from that of the cloud by more than 10 km -1, and hence absorption could be less of a problem for such kind of source. However, BN is likely significantly more evolved, and the continuum-to-line ratio is so high that we cannot reasonably filter out the continuum emission. Hence, we cannot well study the inner region of the proposed disk. Nevertheless, observing higher J-transitions as well as the CO overtone emission with todays higher sensitivity compared to the Scoville et al. (1983) observations will likely constrain the proposed disk structure in more detail.How to proceed now if one wants to do similar-type fundamental CO line studies of disks in high-mass star formation? On the one hand, it is important to not select too young sources because their envelopes will likely almost always ``destroy'' the emission signatures. There may exist exceptions where one views straight through the outflow cavity face-on toward the disk. On the other hand, for more evolved regions, the continuum emission can be very strong or maybe the remaining disk size can be reduced again making the spatial resolution a problem. Therefore, in addition to very careful target selections, adding AO to achieve the best spatial resolution will be a crucial element for such kind of studies in the coming years. Furthermore, in particular for the mostly saturated 12CO lines, it will be important to extend the spectral coverage to also observe higher excited CO lines, that will likely not saturate anymore, as well as CO overtone emission. This will allow us to better assess the hotter gas components and hence to conduct a more detailed analysis of the 12CO data themselves. On longer time-scales, the ELT with its proposed mid-infrared instrument METIS promises orders of magnitude progress in this field based on its superior sensitivity and spatial resolution. With this instrument, we will be truly capable to resolve the gas signatures of accretion disks around (high-mass) YSOs.
AcknowledgementsWe like to thank a lot the anonymous referee as well as the Editor Malcolm Walmsley for thorough reviews which helped improving the paper. H.B. acknowledges financial support by the Emmy-Noether-Program of the Deutsche Forschungsgemeinschaft (DFG, grant BE2578).
References
- Arce, H. G., Shepherd, D., Gueth, F., et al. 2007, in Protostars and Planets V, ed. B. Reipurth, D. Jewitt, & K. Keil, 245 [Google Scholar]
- Bally, J. 2008, in Massive Star Formation: Observations Confront Theory, ed. H. Beuther, H. Linz, & T. Henning, ASP Conf. Ser., 387, 158 [Google Scholar]
- Becklin, E. E., & Neugebauer, G. 1967, ApJ, 147, 799 [NASA ADS] [CrossRef] [Google Scholar]
- Beltrán, M. T., Cesaroni, R., Codella, C., et al. 2006, Nature, 443, 427 [NASA ADS] [CrossRef] [PubMed] [Google Scholar]
- Beuther, H., & Nissen, H. D. 2008, ApJ, 679, L121 [NASA ADS] [CrossRef] [Google Scholar]
- Beuther, H., & Walsh, A. J. 2008, ApJ, 673, L55 [NASA ADS] [CrossRef] [Google Scholar]
- Beuther, H., Schilke, P., Menten, K. M., et al. 2002a, ApJ, 566, 945 [NASA ADS] [CrossRef] [Google Scholar]
- Beuther, H., Schilke, P., Sridharan, T. K., et al. 2002b, A&A, 383, 892 [NASA ADS] [CrossRef] [EDP Sciences] [Google Scholar]
- Beuther, H., Zhang, Q., Greenhill, L. J., et al. 2004, ApJ, 616, L31 [Google Scholar]
- Beuther, H., Schilke, P., Menten, K. M., et al. 2005a, ApJ, 633, 535 [NASA ADS] [CrossRef] [Google Scholar]
- Beuther, H., Zhang, Q., Greenhill, L. J., et al. 2005b, ApJ, 632, 355 [NASA ADS] [CrossRef] [Google Scholar]
- Blake, G. A., & Boogert, A. C. A. 2004, ApJ, 606, L73 [NASA ADS] [CrossRef] [Google Scholar]
- Blake, G. A., Mundy, L. G., Carlstrom, J. E., et al. 1996, ApJ, 472, L49 [NASA ADS] [CrossRef] [Google Scholar]
- Brittain, S. D., Najita, J. R., & Carr, J. S. 2009, ApJ, 702, 85 [NASA ADS] [CrossRef] [Google Scholar]
- Cesaroni, R., Neri, R., Olmi, L., et al. 2005, A&A, 434, 1039 [NASA ADS] [CrossRef] [EDP Sciences] [Google Scholar]
- Cesaroni, R., Galli, D., Lodato, G., Walmsley, C. M., & Zhang, Q. 2007, in Protostars and Planets V, ed. B. Reipurth, D. Jewitt, & K. Keil, 197 [Google Scholar]
- Chernin, L. M., & Wright, M. C. H. 1996, ApJ, 467, 676 [NASA ADS] [CrossRef] [Google Scholar]
- Comito, C., Schilke, P., Phillips, T. G., et al. 2005, ApJS, 156, 127 [NASA ADS] [CrossRef] [Google Scholar]
- Dougados, C., Lena, P., Ridgway, S. T., Christou, J. C., & Probst, R. G. 1993, ApJ, 406, 112 [NASA ADS] [CrossRef] [Google Scholar]
- Downes, D., Genzel, R., Becklin, E. E., & Wynn-Williams, C. G. 1981, ApJ, 244, 869 [NASA ADS] [CrossRef] [Google Scholar]
- Draine, B. T., Dale, D. A., Bendo, G., et al. 2007, ApJ, 663, 866 [NASA ADS] [CrossRef] [Google Scholar]
- Gómez, L., Rodríguez, L. F., Loinard, L., et al. 2005, ApJ, 635, 1166 [NASA ADS] [CrossRef] [Google Scholar]
- Goto, M., Usuda, T., Dullemond, C. P., et al. 2006, ApJ, 652, 758 [NASA ADS] [CrossRef] [Google Scholar]
- Greenhill, L. J., Gezari, D. Y., Danchi, W. C., et al. 2004, ApJ, 605, L57 [NASA ADS] [CrossRef] [Google Scholar]
- Henning, T., Pfau, W., & Altenhoff, W. J. 1990, A&A, 227, 542 [NASA ADS] [Google Scholar]
- Henning, T., Michel, B., & Stognienko, R. 1995, Planet. Space Sci., 43, 1333 [NASA ADS] [CrossRef] [Google Scholar]
- Henning, T., Schreyer, K., Launhardt, R., & Burkert, A. 2000, A&A, 353, 211 [NASA ADS] [Google Scholar]
- Hildebrand, R. H. 1983, QJRAS, 24, 267 [NASA ADS] [Google Scholar]
- Jiang, Z., Tamura, M., Fukagawa, M., et al. 2005, Nature, 437, 112 [NASA ADS] [CrossRef] [PubMed] [Google Scholar]
- Käufl, H.-U., Ballester, P., Biereichel, P., et al. 2004, in SPIE Conf. Ser., 5492, ed. A. F. M. Moorwood, & M. Iye, 1218 [Google Scholar]
- Krumholz, M. R., Klein, R. I., & McKee, C. F. 2007, ApJ, 656, 959 [NASA ADS] [CrossRef] [Google Scholar]
- Krumholz, M. R., Klein, R. I., McKee, C. F., Offner, S. S. R., & Cunningham, A. J. 2009, Science, 323, 754 [NASA ADS] [CrossRef] [PubMed] [Google Scholar]
- Lamers, H. J. G. L. M., & Cassinelli, J. P. 1999, Introduction to Stellar Winds (Cambridge University Press) [Google Scholar]
- Lawrence, A., Warren, S. J., Almaini, O., et al. 2007, MNRAS, 379, 1599 [NASA ADS] [CrossRef] [MathSciNet] [Google Scholar]
- Luhman, K. L. 2000, ApJ, 544, 1044 [NASA ADS] [CrossRef] [Google Scholar]
- Menten, K. M., & Reid, M. J. 1995, ApJ, 445, L157 [NASA ADS] [CrossRef] [Google Scholar]
- Menten, K. M., Reid, M. J., Forbrich, J., & Brunthaler, A. 2007, A&A, 474, 515 [NASA ADS] [CrossRef] [EDP Sciences] [Google Scholar]
- Minchin, N. R., Hough, J. H., McCall, A., et al. 1991, MNRAS, 248, 715 [NASA ADS] [Google Scholar]
- Nissen, H. D., Gustafsson, M., Lemaire, J. L., et al. 2007, A&A, 466, 949 [NASA ADS] [CrossRef] [EDP Sciences] [Google Scholar]
- Ossenkopf, V., & Henning, T. 1994, A&A, 291, 943 [NASA ADS] [Google Scholar]
- Plambeck, R. L., Wright, M. C. H., Mundy, L. G., & Looney, L. W. 1995, ApJ, 455, L189 [NASA ADS] [CrossRef] [Google Scholar]
- Pontoppidan, K. M., Boogert, A. C. A., Fraser, H. J., et al. 2008, ApJ, 678, 1005 [NASA ADS] [CrossRef] [Google Scholar]
- Reipurth, B., Jewitt, D., & Keil, K. 2007, Protostars and Planets V [Google Scholar]
- Rothman, L., Jacquemart, D., Barbe, A., et al. 2005, J. Quant. Spec. Radiat. Transf., 96, 139 [Google Scholar]
- Ryde, N., & Schöier, F. L. 2001, ApJ, 547, 384 [NASA ADS] [CrossRef] [Google Scholar]
- Schreyer, K., Henning, T., van der Tak, F. F. S., Boonman, A. M. S., & van Dishoeck, E. F. 2002, A&A, 394, 561 [NASA ADS] [CrossRef] [EDP Sciences] [Google Scholar]
- Scoville, N., Kleinmann, S. G., Hall, D. N. B., & Ridgway, S. T. 1983, ApJ, 275, 201 [NASA ADS] [CrossRef] [Google Scholar]
- Scoville, N. Z., Carlstrom, J. E., Chandler, C. J., et al. 1993, PASP, 105, 1482 [NASA ADS] [CrossRef] [Google Scholar]
- Sheffer, Y., Rogers, M., Federman, S. R., Lambert, D. L., & Gredel, R. 2007, ApJ, 667, 1002 [NASA ADS] [CrossRef] [Google Scholar]
- Shuping, R. Y., Morris, M., & Bally, J. 2004, AJ, 128, 363 [NASA ADS] [CrossRef] [Google Scholar]
- Tan, J. C. 2004, ApJ, 607, L47 [NASA ADS] [CrossRef] [Google Scholar]
- van der Plas, G., van den Ancker, M. E., Acke, B., et al. 2009, A&A, 500, 1137 [NASA ADS] [CrossRef] [EDP Sciences] [Google Scholar]
- Yorke, H. W., & Sonnhalter, C. 2002, ApJ, 569, 846 [NASA ADS] [CrossRef] [Google Scholar]
- Zapata, L. A., Schmid-Burgk, J., Ho, P. T. P., Rodríguez, L. F., & Menten, K. M. 2009, ApJ, 704, L45 [NASA ADS] [CrossRef] [Google Scholar]
- Zhang, Q., Hunter, T. R., Brand, J., et al. 2005, ApJ, 625, 864 [NASA ADS] [CrossRef] [Google Scholar]
Footnotes
- ... spectroscopy
- Based on observations of the ESO program 380.C-0380(A).
- ...
- The equivalent width A is measured by simultaneous Gaussian fits to both absorption features.
All Tables
Table 1: Source positions (from Dougados et al. 1993).
Table 2: Observed lines.
Table 3: 13CO values for Boltzmann plots.
All Figures
|
|
Figure 1:
Overview image of the region. The grey-scale |
| Open with DEXTER | |
| In the text | |
|
|
Figure 2:
CRIRES observations of the R and P CO line series around 4.65 |
| Open with DEXTER | |
| In the text | |
|
|
Figure 3:
The 12CO R(8) to R(1) lines from top
to bottom toward the BN object. Telluric and |
| Open with DEXTER | |
| In the text | |
|
|
Figure 4: 13CO optical depths toward the BN object. |
| Open with DEXTER | |
| In the text | |
|
|
Figure 5: Boltzmann plot for the 13CO v=1-0 lines toward the BN object. The x-axis shows the lower-level energies of the transitions and the y-axis presents the natural logarithm of the corresponding column densities divided by their statistical weights. |
| Open with DEXTER | |
| In the text | |
|
|
Figure 6:
Position velocity diagram of the 12CO (R0) line
toward the BN object along the slit direction (PA of 126
|
| Open with DEXTER | |
| In the text | |
|
|
Figure 7:
Hydrogen recombination Pfund |
| Open with DEXTER | |
| In the text | |
|
|
Figure 8:
Position velocity digram of the H2 emission
|
| Open with DEXTER | |
| In the text | |
|
|
Figure 9:
The 12CO R(8) to R(1) lines from top
to bottom toward source n. Telluric and |
| Open with DEXTER | |
| In the text | |
|
|
Figure 10:
13CO optical depths toward
source n. The absorption feature at |
| Open with DEXTER | |
| In the text | |
|
|
Figure 11:
Boltzmann plots for the 13CO v=1-0
lines toward source n for the |
| Open with DEXTER | |
| In the text | |
|
|
Figure 12:
Hydrogen recombination Pfund |
| Open with DEXTER | |
| In the text | |
| |
Figure 13:
Original data from the slit covering source n and IRC3. Source n is the
bright continuum source at offset |
| Open with DEXTER | |
| In the text | |
|
|
Figure 14:
The 12CO R(8) to R(1) lines (except of the R(4)
line from top to bottom toward IRC3. Since the
emission is extended, this spectrum is an average over |
| Open with DEXTER | |
| In the text | |
|
|
Figure 15:
Position velocity cuts along the slit axis for IRC3 with a PA of
110 degrees east of north. The top row shows diagrams for
selected 12CO lines, and the bottom
row presents the 13CO data. For 13CO
the scaling is adapted to highlight the weaker extended emission in
contrast to the continuum at offset
|
| Open with DEXTER | |
| In the text | |
Copyright ESO 2010
Current usage metrics show cumulative count of Article Views (full-text article views including HTML views, PDF and ePub downloads, according to the available data) and Abstracts Views on Vision4Press platform.
Data correspond to usage on the plateform after 2015. The current usage metrics is available 48-96 hours after online publication and is updated daily on week days.
Initial download of the metrics may take a while.