| Issue |
A&A
Volume 512, March-April 2010
|
|
|---|---|---|
| Article Number | A31 | |
| Number of page(s) | 10 | |
| Section | Interstellar and circumstellar matter | |
| DOI | https://doi.org/10.1051/0004-6361/200913098 | |
| Published online | 25 March 2010 | |
Abundance anomaly of the  C species of
CCH
C species of
CCH
N. Sakai1 - O. Saruwatari1 - T. Sakai2 - S. Takano3 - S. Yamamoto1
1 - Department of Physics and Research Center for the Early Universe,
The University of Tokyo, Bunkyo-ku, Tokyo 113-0033, Japan
2 - Institute of Astronomy, The University of Tokyo, Osawa, Mitaka,
Tokyo, 181-8588, Japan
3 - Nobeyama Radio Observatory and Graduate University for Advanced
Studies, Minamimaki, Minamisaku, Nagano 384-1305, Japan
Received 10 August 2009 / Accepted 15 December 2009
Abstract
Aims. We have observed the N=1-0
lines of CCH and its 13C isotopic species
toward a cold dark cloud, TMC-1 and a star-forming region, L1527, to
investigate the 13C abundances and formation
pathways of CCH.
Methods. The observations have been carried out with
the IRAM 30 m telescope.
Results. We have successfully detected the lines of 13CCH
and C13CH toward the both sources and found a
significant intensity difference between the two 13C
isotopic species. The [C13CH]/[13CCH]
abundance ratios are ![]() (3
(3![]() )
and
)
and ![]() (3
(3![]() )
for TMC-1 and L1527, respectively. The abundance difference between C13CH
and 13CCH means that the two carbon atoms of
CCH are not equivalent in the formation pathway. On the other hand, the
[CCH]/[C13CH] and [CCH]/[13CCH]
ratios are evaluated to be larger than 170 and 250 toward TMC-1, and to
be larger than 80 and 135 toward L1527, respectively. Therefore, both
of the 13C species are significantly diluted in
comparison with the interstellar 12C/13C
ratio of 60. The dilution is discussed in terms of a behavior of 13C
in molecular clouds.
)
for TMC-1 and L1527, respectively. The abundance difference between C13CH
and 13CCH means that the two carbon atoms of
CCH are not equivalent in the formation pathway. On the other hand, the
[CCH]/[C13CH] and [CCH]/[13CCH]
ratios are evaluated to be larger than 170 and 250 toward TMC-1, and to
be larger than 80 and 135 toward L1527, respectively. Therefore, both
of the 13C species are significantly diluted in
comparison with the interstellar 12C/13C
ratio of 60. The dilution is discussed in terms of a behavior of 13C
in molecular clouds.
Key words: astrochemistry - ISM: molecules - ISM: abundances - ISM: individual objects: TMC-1 - ISM: individual objects: L1527
1 Introduction
The 13C isotopic species of various abundant molecules have been detected in interstellar space. Their spectral lines are often employed to estimate the optical depths of the normal species lines, where the abundance ratio of the 13C species relative to the normal species is assumed to be the same as the elemental abundance ratio of 12C/13C. In reality, the ratio can differ from molecule to molecule, and the 12C/13C ratios of molecules should contain rich information on formation processes of molecules, as in the case of deuterium fractionation (e.g. Watson 1974; Millar et al. 1989; Hirota et al. 2001; Caselli et al. 2002). However, few works have been reported on this aspect of the 12C/13C ratio. The only exception is the observation of the three 13C species of HC3N reported by Takano et al. (1998). They found that the abundance of HCC13CN is significantly higher than the one for H13CCCN and HC13CCN in TMC-1, indicating that three carbon atoms are not equivalent in the formation pathways of HC3N. This result supports the assumption that the neutral-neutral reaction between C2H2 and CN plays an important role in the production of HC3N.
Table 1: Observed line parameters in TMC-1 and L1527.
We recently reported on the abundance anomaly of the 13C
species of CCS in the young starless cores TMC-1 and L1521E (Sakai
et al. 2007a).
The abundance ratio of [CCS]/[C13CS] in TMC-1 is
determined to be 54 ![]() 5 (3
5 (3![]() ), which is
almost consistent with the interstellar [12C]/[13C]
ratio of 60 (Lucas & Liszt 1998). On the
other hand, the [CCS]/[13CCS] ratio is found to
be as high as 230
), which is
almost consistent with the interstellar [12C]/[13C]
ratio of 60 (Lucas & Liszt 1998). On the
other hand, the [CCS]/[13CCS] ratio is found to
be as high as 230 ![]() 130 (3
130 (3![]() ), the [C13CS]/[13CCS]
ratio being 4.2
), the [C13CS]/[13CCS]
ratio being 4.2![]() 2.3(3
2.3(3![]() ). This
indicates that the two carbon atoms of CCS are nonequivalent in the
main production process. For the nonequivalent processes, S + CCH, S+
+ CCH, and CH + CS can be considered. If the reactions including CCH
are mainly responsible, the abundances of 13CCH
and C13CH must be different as in the case of 13CCS
and C13CS. However, Sakai et al. (2007a) could not
confirm this because of the lack of observational data of 13CCH
and C13CH, so that the reactions including CCH
were not completely ruled out as the main production process. Since the
CCS molecule is now widely used to study the chemical evolution of
starless cores (e.g. Suzuki et al. 1992; Benson
et al. 1998;
Ohashi et al. 1999;
Aikawa et al. 2003),
a detailed understanding of its production pathways is very important
both for astrophysics and astrochemistry. For this purpose, the
observation of the 13C species of CCH is
essential. In addition, it is also useful for constraining the main
production pathway of CCH itself, which is crucial for a quantitative
test of chemical models of dense clouds.
). This
indicates that the two carbon atoms of CCS are nonequivalent in the
main production process. For the nonequivalent processes, S + CCH, S+
+ CCH, and CH + CS can be considered. If the reactions including CCH
are mainly responsible, the abundances of 13CCH
and C13CH must be different as in the case of 13CCS
and C13CS. However, Sakai et al. (2007a) could not
confirm this because of the lack of observational data of 13CCH
and C13CH, so that the reactions including CCH
were not completely ruled out as the main production process. Since the
CCS molecule is now widely used to study the chemical evolution of
starless cores (e.g. Suzuki et al. 1992; Benson
et al. 1998;
Ohashi et al. 1999;
Aikawa et al. 2003),
a detailed understanding of its production pathways is very important
both for astrophysics and astrochemistry. For this purpose, the
observation of the 13C species of CCH is
essential. In addition, it is also useful for constraining the main
production pathway of CCH itself, which is crucial for a quantitative
test of chemical models of dense clouds.
![\begin{figure}
\par\includegraphics[width=14.8cm,clip]{13098fg1.eps}
\end{figure}](/articles/aa/full_html/2010/04/aa13098-09/img27.png)
|
Figure 1: Observed line profiles of the hyperfine components of the N=1-0 transitions of C13CH and 13CCH in TMC-1. |
| Open with DEXTER | |
However, observations of the 13C species of CCH
have been limited so far. Saleck et al. (1994) detected
the C13CH and 13CCH (N=2-1)
lines toward the Orion A molecular cloud. They reported that the [C13CH]/[13CCH]
ratio is ![]() by comparing the observed intensities, although they claimed that the
result may suffer from calibration uncertainties. Turner (2001) detected
the N=1-0 lines of C13CH and
13CCH toward TMC-1. According to their data, the
C13CH line is more intense than the 13CCH
line by a factor of 2. In these previous reports, a possible difference
between the abundances of the two 13C isotopic
species is not seriously considered, because the S/N ratio is not high
enough to discuss the [C13CH]/[13CCH]
ratio accurately. Therefore we have conducted sensitive observations of
the C13CH and 13CCH
lines toward a young starless core, TMC-1, and a star-forming core
exibiting warm carbon-chain chemistry (Sakai et al. 2008), L1527,
both of which are bright sources of CCH.
by comparing the observed intensities, although they claimed that the
result may suffer from calibration uncertainties. Turner (2001) detected
the N=1-0 lines of C13CH and
13CCH toward TMC-1. According to their data, the
C13CH line is more intense than the 13CCH
line by a factor of 2. In these previous reports, a possible difference
between the abundances of the two 13C isotopic
species is not seriously considered, because the S/N ratio is not high
enough to discuss the [C13CH]/[13CCH]
ratio accurately. Therefore we have conducted sensitive observations of
the C13CH and 13CCH
lines toward a young starless core, TMC-1, and a star-forming core
exibiting warm carbon-chain chemistry (Sakai et al. 2008), L1527,
both of which are bright sources of CCH.
2 Observations
Observations of the N=1-0 lines of CCH and its 13C
isotopic species were carried out with the IRAM 30 m telescope at Pico
Veleta![]() in July 11-14, 2007.
Transition frequencies and quantum numbers of the observed lines are
listed in Table 1.
The observed position was
in July 11-14, 2007.
Transition frequencies and quantum numbers of the observed lines are
listed in Table 1.
The observed position was ![]() for the cyanopolyyne peak of TMC-1 (hereafter TMC-1) and
for the cyanopolyyne peak of TMC-1 (hereafter TMC-1) and ![]() for L1527. Two 3 mm SIS receivers (A100 and B100) were
simultaneously used as frontends, whose system noise temperatures
ranged from 75 K to 105 K for A100 and from
90 K to 130 K for B100. The beam size and the
effective main-beam efficiency (
for L1527. Two 3 mm SIS receivers (A100 and B100) were
simultaneously used as frontends, whose system noise temperatures
ranged from 75 K to 105 K for A100 and from
90 K to 130 K for B100. The beam size and the
effective main-beam efficiency (
![]() /
/
![]() )
of the telescope at 85 GHz are 29
)
of the telescope at 85 GHz are 29
![]() and 0.82, respectively (
and 0.82, respectively (
![]() and
and ![]() are the main beam efficiency (0.78) and forward efficiency (0.95),
respectively). The telescope pointing was checked every hour by
observing nearby continuum sources and was maintained to be better than
4
are the main beam efficiency (0.78) and forward efficiency (0.95),
respectively). The telescope pointing was checked every hour by
observing nearby continuum sources and was maintained to be better than
4
![]() .
The backend was an autocorrelator, VESPA, which was divided into
12 parts to cover hyperfine components. We set the individual
bandwidth and resolution to be 20 MHz and 20 kHz,
respectively. The frequency resolution corresponds to the velocity
resolution of 0.07 km s-1.
.
The backend was an autocorrelator, VESPA, which was divided into
12 parts to cover hyperfine components. We set the individual
bandwidth and resolution to be 20 MHz and 20 kHz,
respectively. The frequency resolution corresponds to the velocity
resolution of 0.07 km s-1.
The position-switching mode was employed for the observation
of the normal species (CCH) toward L1527, where the off position was
taken at ![]() ,
,
![]() .
On the other hand, the other observations were made in the
frequency-switching mode with a frequency offset of 2 MHz.
Since the line width is much narrower (
.
On the other hand, the other observations were made in the
frequency-switching mode with a frequency offset of 2 MHz.
Since the line width is much narrower (![]() 0.5 km s-1)
than the period of the baseline ripple (
0.5 km s-1)
than the period of the baseline ripple (![]() 30 km s-1),
we can readily subtract the baseline for the 20 km s-1
span with the second or third order polynomial. For the observations of
the 13C isotopomers, we first used the two
3 mm band receivers simultaneously, one for 13CCH
and the other for C13CH, to minimize the
pointing error and the telescope efficiency variation on the observed
abundance ratio. We extended the observation of the 13CCH
lines toward L1527 with the two receivers to improve the S/N ratio
after good quality spectra were obtained for the C13CH
lines in the simultaneous observation. In this case, the intensity
scale of the 13CCH lines was confirmed by
comparing the intensities of the nearby strong lines (c-H13CCCH
212-101
and DC3N J=10-9) with those
observed in the simultaneous observation of 13CCH
and C13CH. Basic data reduction was carried out
by the CLASS software.
30 km s-1),
we can readily subtract the baseline for the 20 km s-1
span with the second or third order polynomial. For the observations of
the 13C isotopomers, we first used the two
3 mm band receivers simultaneously, one for 13CCH
and the other for C13CH, to minimize the
pointing error and the telescope efficiency variation on the observed
abundance ratio. We extended the observation of the 13CCH
lines toward L1527 with the two receivers to improve the S/N ratio
after good quality spectra were obtained for the C13CH
lines in the simultaneous observation. In this case, the intensity
scale of the 13CCH lines was confirmed by
comparing the intensities of the nearby strong lines (c-H13CCCH
212-101
and DC3N J=10-9) with those
observed in the simultaneous observation of 13CCH
and C13CH. Basic data reduction was carried out
by the CLASS software.
![\begin{figure}
\par\includegraphics[width=14.8cm,clip]{13098fg2.eps}
\end{figure}](/articles/aa/full_html/2010/04/aa13098-09/img37.png)
|
Figure 2:
Observed line profiles of the hyperfine components of the N=1-0
transitions of C13CH and 13CCH
in L1527. Negative features indicated by arrows are frequency-switch
artifacts of nearby lines. The line at |
| Open with DEXTER | |
3 Results
3.1 Detection of hyperfine components of C13CH and 13CCH
We successfully detected the hyperfine component lines of C13CH
and 13CCH toward TMC-1 and L1527
(Table 1).
We detected seven hyperfine components for each species in L1527, while
in TMC-1 we detected five and three hyperfine components for C13CH
and 13CCH, respectively. The line profiles in
TMC-1 and L1527 are shown in Figs. 1 and 2, respectively. In the line
assignment, we found that the ![]() values of the (
J=1/2-1/2,
F1=1-1, F=3/2-3/2)
and (
J=1/2-1/2,
F1=0-1, F=1/2-1/2)
lines of C13CH are shifted by 0.9 and
1.1 km s-1, respectively, from
the typical
values of the (
J=1/2-1/2,
F1=1-1, F=3/2-3/2)
and (
J=1/2-1/2,
F1=0-1, F=1/2-1/2)
lines of C13CH are shifted by 0.9 and
1.1 km s-1, respectively, from
the typical ![]() value of L1527 (
5.85-5.95 km s-1)
when we employed the rest frequencies listed in CDMS (M
value of L1527 (
5.85-5.95 km s-1)
when we employed the rest frequencies listed in CDMS (M
![]() ller et al. 2005; McCarthy
et al. 1995).
A shift in the (
J=1/2-1/2,
F1=1-1, F=3/2-3/2)
line is also seen in TMC-1. These shifts seem to originate from
uncertainties in the rest frequencies. In order to confirm this, we
further checked the data of the same lines observed in the course of
the line survey toward L1527 with the Nobeyama 45 m telescope
ller et al. 2005; McCarthy
et al. 1995).
A shift in the (
J=1/2-1/2,
F1=1-1, F=3/2-3/2)
line is also seen in TMC-1. These shifts seem to originate from
uncertainties in the rest frequencies. In order to confirm this, we
further checked the data of the same lines observed in the course of
the line survey toward L1527 with the Nobeyama 45 m telescope![]() (e.g. Sakai
et al. 2008).
The
(e.g. Sakai
et al. 2008).
The ![]() values of the above two lines were also found to be shifted by the same
magnitudes as in the IRAM 30 m observation. Therefore it was
confirmed that the rest frequencies are not accurate enough to analyze
our C13CH data, and we refined some molecular
constants of C13CH by fitting the line
frequencies observed in L1527. Details of this procedure are described
in Appendix A. The
values of the above two lines were also found to be shifted by the same
magnitudes as in the IRAM 30 m observation. Therefore it was
confirmed that the rest frequencies are not accurate enough to analyze
our C13CH data, and we refined some molecular
constants of C13CH by fitting the line
frequencies observed in L1527. Details of this procedure are described
in Appendix A. The ![]() value finally determined for L1527 is
value finally determined for L1527 is ![]() km s-1,
which is consistent with those for other molecules (e.g. Sakai
et al. 2008).
The frequencies of the hyperfine components are calculated from newly
determined molecular constants and are used to derive the line
parameters of C13CH in TMC-1 (Table 1).
km s-1,
which is consistent with those for other molecules (e.g. Sakai
et al. 2008).
The frequencies of the hyperfine components are calculated from newly
determined molecular constants and are used to derive the line
parameters of C13CH in TMC-1 (Table 1).
3.2 Abundance anomaly of the 13C species of CCH
As shown in Fig. 1,
the intensity of the strongest hyperfine component (
![]() )
of C13CH in TMC-1 is found to be significantly
stronger than that of 13CCH. A fraction of the
line intensity of the strongest hyperfine component relative to the
total intensity of the all hyperfine components of the N=1-0
transition is exactly the same for C13CH and 13CCH,
although those of the other components vary between the two isotopic
species. Since the excitation conditions can be regarded to be the same
for C13CH and 13CCH, the
intensity difference found for the strongest hyperfine components
should directly reflect the difference in abundance of the two isotopic
species. Note that the C13CH and 13CCH
lines are optically thin, because the observed intensity ratios of the
hyperfine components are close to the theoretical ones. Consequently we
can accurately estimate the abundance ratio of [C13CH]/[13CCH]
from the observed integrated intensity ratio as long as the same
excitation temperature is assumed for the both species. The [C13CH]/[13CCH]
ratio is found to be
)
of C13CH in TMC-1 is found to be significantly
stronger than that of 13CCH. A fraction of the
line intensity of the strongest hyperfine component relative to the
total intensity of the all hyperfine components of the N=1-0
transition is exactly the same for C13CH and 13CCH,
although those of the other components vary between the two isotopic
species. Since the excitation conditions can be regarded to be the same
for C13CH and 13CCH, the
intensity difference found for the strongest hyperfine components
should directly reflect the difference in abundance of the two isotopic
species. Note that the C13CH and 13CCH
lines are optically thin, because the observed intensity ratios of the
hyperfine components are close to the theoretical ones. Consequently we
can accurately estimate the abundance ratio of [C13CH]/[13CCH]
from the observed integrated intensity ratio as long as the same
excitation temperature is assumed for the both species. The [C13CH]/[13CCH]
ratio is found to be ![]() (3
(3![]() )
for TMC-1, where the error represents three times the standard
deviation. A similar intensity difference is also observed for L1527,
as shown in Fig. 2.
In L1527, the [C13CH]/[13CCH]
ratio is derived to be
)
for TMC-1, where the error represents three times the standard
deviation. A similar intensity difference is also observed for L1527,
as shown in Fig. 2.
In L1527, the [C13CH]/[13CCH]
ratio is derived to be ![]() (3
(3![]() ). Although
we made a more detailed integration for 13CCH
than for C13CH toward L1527 to improve the S/N
ratio, we confirmed that the line intensities of 13CCH
observed simultaneously with the C13CH lines are
consistent with those finally obtained after the extended observation.
Hence it is clearly established that the abundances of the two 13C
isotopic species are different, as in the case of HC3N
(Takano et al. 1998)
and CCS (Sakai et al. 2007a).
Since the H2 densities of TMC-1 and L1527 are
). Although
we made a more detailed integration for 13CCH
than for C13CH toward L1527 to improve the S/N
ratio, we confirmed that the line intensities of 13CCH
observed simultaneously with the C13CH lines are
consistent with those finally obtained after the extended observation.
Hence it is clearly established that the abundances of the two 13C
isotopic species are different, as in the case of HC3N
(Takano et al. 1998)
and CCS (Sakai et al. 2007a).
Since the H2 densities of TMC-1 and L1527 are ![]() (Sect. 3.3) and
> 106 cm-3
(Sakai et al. 2008),
respectively, the result suggests that the [C13CH]/[13CCH]
ratio does not strongly depend on the H2
density.
(Sect. 3.3) and
> 106 cm-3
(Sakai et al. 2008),
respectively, the result suggests that the [C13CH]/[13CCH]
ratio does not strongly depend on the H2
density.
As mentioned in the introduction, Saleck et al. (1994) reported
the [C13CH]/[13CCH] ratio
of ![]() in the Orion A molecular cloud, although they claimed that their result
may suffer from calibration uncertainty. According to the C13CH
and 13CCH observations toward TMC-1 by Turner (2001), we can
estimate the intensity ratio of the strongest hyperfine components to
be two. Unfortunately, it is impossible to estimate the error because
of a lack of information about uncertainties in the intensities, and
hence we cannot judge whether this ratio is significant or not. In
spite of the poor accuracy of the previous measurements, the trend that
C13CH is more abundant than 13CCH
seems to be consistent with our result.
in the Orion A molecular cloud, although they claimed that their result
may suffer from calibration uncertainty. According to the C13CH
and 13CCH observations toward TMC-1 by Turner (2001), we can
estimate the intensity ratio of the strongest hyperfine components to
be two. Unfortunately, it is impossible to estimate the error because
of a lack of information about uncertainties in the intensities, and
hence we cannot judge whether this ratio is significant or not. In
spite of the poor accuracy of the previous measurements, the trend that
C13CH is more abundant than 13CCH
seems to be consistent with our result.
![\begin{figure}
\par\includegraphics[width=14.8cm,clip]{13098fg3.eps}
\end{figure}](/articles/aa/full_html/2010/04/aa13098-09/img41.png)
|
Figure 3: Observed line profiles of the hyperfine components of the N=1-0 transitions of CCH in TMC-1 and L1527. Negative features indicated by arrows are frequency switch artifacts of nearby lines. |
| Open with DEXTER | |
3.3 C 13CH and 13CCH abundances relative to CCH
In order to derive the abundance ratios of [CCH]/[C13CH] and [CCH]/[13CCH], the N=1-0 lines of CCH were observed toward TMC-1 and L1527, as were those of C13CH and 13CCH. In both sources, all hyperfine components except for the two weakest ones apparently look optically thick, judging from their line shapes and the intensity ratios among the hyperfine components (Table 1, Fig. 3). In particular, self-absorption dips are obvious in a few stronger components observed toward L1527, so even the weakest hyperfine components may not be optically thin. We then derived the lower limit of the column density of CCH from the integrated intensities of the weakest hyperfine components ( J=1/2-1/2, F=1-0 and J=3/2-1/2, F=1-1). On the other hand, we used all the available hyperfine component data to derive the column densities of C13CH and 13CCH.
In derivation of the column densities of CCH and its 13C species, we employed the one-zone large velocity gradient (LVG) model for excitation calculations (Goldreich & Kwan 1974). As mentioned above, the optical depths of the CCH lines are very different from those of the 13C species, so that their excitation temperatures can be different. In this case, the LTE approximation with the common excitation temperature may introduce a systematic error in the derived abundance ratios. This renders a statistical equilibrium calculation like the LVG model indispensable. Since the collisional cross sections are not reported for CCH, we adopted the corresponding values of a similar-sized molecule, HCN (Green & Thaddeus 1974). We fully considered the fine- and hyperfine-structure levels up to N=10 (42 and 82 for CCH and its 13C species, respectively), and evaluated the collisional cross sections between two hyperfine levels by the method described in Appendix B. We employed the photon escape probability for a spherical cloud. The dipole moment is assumed to be 0.8 D for all the three isotopic species (CCH, 13CCH, C13CH). The velocity width of 0.6 km s-1 is employed for the velocity gradient for the both sources.
The column density of CCH toward TMC-1 is determined to be ![]() cm-2 from the intensities of the two weakest
hyperfine components by a least-squares method, where the H2
density and the gas kinetic temperature are assumed to be
cm-2 from the intensities of the two weakest
hyperfine components by a least-squares method, where the H2
density and the gas kinetic temperature are assumed to be ![]() cm-3
and 10 K, respectively. The optical depth of the weakest
component, J=1/2-1/2
F=1-0, is calculated to be 0.4. The column densities
of C13CH and 13CCH in
TMC-1 are also evaluated by a least-squares method from the observed
intensities of all the hyperfine components to be
cm-3
and 10 K, respectively. The optical depth of the weakest
component, J=1/2-1/2
F=1-0, is calculated to be 0.4. The column densities
of C13CH and 13CCH in
TMC-1 are also evaluated by a least-squares method from the observed
intensities of all the hyperfine components to be ![]() cm-2
and
cm-2
and ![]() cm-2,
respectively. Here the errors represent three times the standard
deviation. The column density of CCH is regarded as a lower limit,
considering the possible self absorption effect due to the foreground
gas, as mentioned above. Then, we can set the lower limits to the
abundance ratios of [CCH]/[C13CH] and [CCH]/[13CCH]
to be 170 and 250, respectively, from the obtained column densities. On
the other hand, the [C13CH]/[13CCH]
ratio is derived to be
cm-2,
respectively. Here the errors represent three times the standard
deviation. The column density of CCH is regarded as a lower limit,
considering the possible self absorption effect due to the foreground
gas, as mentioned above. Then, we can set the lower limits to the
abundance ratios of [CCH]/[C13CH] and [CCH]/[13CCH]
to be 170 and 250, respectively, from the obtained column densities. On
the other hand, the [C13CH]/[13CCH]
ratio is derived to be ![]() ,
which is consistent with the ratio derived from the integrated
intensities in Sect. 3.2.
,
which is consistent with the ratio derived from the integrated
intensities in Sect. 3.2.
The dependence of these values on the assumed H2
density is shown in Fig. 4a.
In the density range between 104 cm-3
and 105 cm-3, which is
appropriate for TMC-1 (Hirahara et al. 1992; Hirota
et al. 1998),
the abundance ratios [CCH]/[C13CH] and [CCH]/[13CCH]
increase as a function of the density, whereas the [C13CH]/[13CCH]
ratio almost remains constant. From Fig. 4a, the abundance
ratios of [CCH]/[C13CH] and [CCH]/[13CCH]
are higher than 130 and 190, respectively, even if the density is as
low as 104 cm-3. These
values are much higher than the interstellar [12C]/[13C]
ratio of 60 (Lucus & Liszt 1998). This means
that both the 13C species of CCH are heavily
diluted in TMC-1, as in the case of 13CCS (
![]() )
(Sakai et al. 2007a).
To confirm this, we derived the abundance ratios of [CCH]/[C13CH]
and [CCH]/[13CCH] under the assumption of LTE
conditions with the excitation temperature of 6.7 K, which is
reported for C6H in TMC-1 (Sakai et al.
2007b). The
[CCH]/[C13CH] and [CCH]/[13CCH]
ratios are derived to be 160
+50-20
and 250
+80-50,
respectively, from the obtained column densities, where the column
density of CCH is evaluated from the intensities of the two weakest
hyperfine components. These are almost consistent with those derived
from the LVG model analysis.
)
(Sakai et al. 2007a).
To confirm this, we derived the abundance ratios of [CCH]/[C13CH]
and [CCH]/[13CCH] under the assumption of LTE
conditions with the excitation temperature of 6.7 K, which is
reported for C6H in TMC-1 (Sakai et al.
2007b). The
[CCH]/[C13CH] and [CCH]/[13CCH]
ratios are derived to be 160
+50-20
and 250
+80-50,
respectively, from the obtained column densities, where the column
density of CCH is evaluated from the intensities of the two weakest
hyperfine components. These are almost consistent with those derived
from the LVG model analysis.
![\begin{figure}
\par\includegraphics[width=8cm,clip]{13098fg4.eps}
\end{figure}](/articles/aa/full_html/2010/04/aa13098-09/img48.png)
|
Figure 4: Results of the LVG model calculations for TMC-1 a) and L1527 b). The solid lines represent the [CCH]/[C13CH] and [CCH]/[13CCH] ratios, whereas the dashed line represents the [C13CH]/[13CCH] ratio. Shaded areas are appropriate density ranges for the sources. The error bars denote three times the standard deviations. |
| Open with DEXTER | |
The column densities of CCH, C13CH and 13CCH
are also determined for L1527 by the use of the LVG model. For L1527,
the H2 density and the gas kinetic temperature
are assumed to be 106 cm-3
and 15 K, respectively (Sakai et al. 2008). The column
density of CCH is determined to be ![]() cm-2 from the two weakest hyperfine components,
whereas those of C13CH and 13CCH
are
cm-2 from the two weakest hyperfine components,
whereas those of C13CH and 13CCH
are ![]() and
and ![]() cm-2,
respectively. The optical depth of the weakest component of CCH, J=1/2-1/2
F=1-0, is calculated to be 0.2. The [CCH]/[C13CH]
and [CCH]/[13CCH] ratios are thus derived to be
80 and 135, respectively. Since the CCH lines may suffer from the self
absorption effect due to the foreground gas, the ratios should be
regarded as the lower limits. On the other hand, the [C13CH]/[13CCH]
ratio is derived to be
cm-2,
respectively. The optical depth of the weakest component of CCH, J=1/2-1/2
F=1-0, is calculated to be 0.2. The [CCH]/[C13CH]
and [CCH]/[13CCH] ratios are thus derived to be
80 and 135, respectively. Since the CCH lines may suffer from the self
absorption effect due to the foreground gas, the ratios should be
regarded as the lower limits. On the other hand, the [C13CH]/[13CCH]
ratio is derived to be ![]() ,
which is consistent with the ratio derived from the integrated
intensities. The density dependence of the ratios is shown in
Fig. 4b.
For the density range from
,
which is consistent with the ratio derived from the integrated
intensities. The density dependence of the ratios is shown in
Fig. 4b.
For the density range from ![]() cm-3
to
cm-3
to ![]() cm-3,
the ratios slightly decrease as the density increases. Even for the
density of
cm-3,
the ratios slightly decrease as the density increases. Even for the
density of ![]() cm-3,
the [CCH]/[C13CH] and [CCH]/[13CCH]
ratios are 75 and 130, respectively. Thus, it is very likely that the
ratios in L1527 are larger than the interstellar [12C]/[13C]
ratio of 60, as in the case of TMC-1. For confirmation, we also
calculated the [CCH]/[C13CH] and [CCH]/[13CCH]
ratios to be 88
+8-9
and
cm-3,
the [CCH]/[C13CH] and [CCH]/[13CCH]
ratios are 75 and 130, respectively. Thus, it is very likely that the
ratios in L1527 are larger than the interstellar [12C]/[13C]
ratio of 60, as in the case of TMC-1. For confirmation, we also
calculated the [CCH]/[C13CH] and [CCH]/[13CCH]
ratios to be 88
+8-9
and ![]() under the assumption of LTE conditions. Here we assume the excitation
temperature of 12.3 K reported for C4H2
(Sakai et al. 2008).
These ratios are consistent with those derived by the LVG analysis.
under the assumption of LTE conditions. Here we assume the excitation
temperature of 12.3 K reported for C4H2
(Sakai et al. 2008).
These ratios are consistent with those derived by the LVG analysis.
Table 3 summarizes the [CCH]/[C13CH] and [CCH]/ [13CCH] ratios obtained with the LVG analyses. As for the [C13CH]/[13CCH] ratio, we adopt the values derived from the integrated intensity ratios of the strongest hyperfine components (Sect. 3.2).
Table 2: The column densities of CCH and its 13C isotopic species.
Table 3: The abundance ratio of CCH and its 13C isotopic species.
4 Discussion
4.1
Abundance difference between CCH and CCH
We have found that the abundances of C13CH and 13CCH are different from each other both in TMC-1 and L1527. Here we discuss two possible mechanisms; one is related to the main production pathway of CCH, and the other is the exchange of the 13C position after formation of CCH.
As for the production mechanisms of CCH, the following major
pathways have been considered. The first scheme is based on
ion-molecule reactions, where CCH is mainly produced by electron
recombination reactions of the precursor ions C2H2+
and C2H3+
as
| (1a) |
and
| (1b) |
The second scheme is a neutral-neutral reaction (e.g. Turner et al. 2000)
| (2) |
However, their relative importance has not been established observationally. In the ion-molecule reaction scheme, the two carbon atoms are identical. Note that C2H3+ has a non classical structure with the two identical carbon atoms (Crofton et al. 1989). In contrast, two carbon atoms are not equivalent for the neutral-neutral reaction (2). Therefore the difference in the abundances of C13CH and 13CCH would reflect the significant contribution of reaction (2).
Yet there are two possibilities which would change the [C13CH]/[13CCH]
ratio after the formation of CCH. One is the proton transfer reaction
from protonated ions like HCO+ and H3+.
With this reaction followed by the dissociative electron recombination
reaction of H13CCH+, the
abundances of C13CH and 13CCH
are equalized, because the branching ratio to C13CH
and 13CCH of the electron recombination
reaction should be the same. The other is the neutral-neutral reaction
with the atomic hydrogen
| (3) |
Since C13CH is more stable than 13CCH by 8.1 K (Tarroni, private communication; Tarroni & Carter 2003), this reaction would enhance the abundance of C13CH relative to that of 13CCH. However, it is not clear whether this reaction actually happens in a cold cloud like TMC-1 or not. According to Rodgers & Millar (1996) and Schilke et al. (1992), a related reaction,
| (4) |
has an activation barrier of 250 K. If so, reaction (3) should also have an activation barrier of the same magnitude. In this case, reaction (3) does not contribute to the abundance difference between C13CH and 13CCH. Even if it has no activation barrier, a simplified chemical model considering reaction (3) does not reproduce the observed [C13CH]/[13CCH] ratio for L1527, as described in Appendix C. This is because reaction (3) is slower than the destruction reaction of CCH with the oxygen atom. Therefore, reaction (3) is not the main process to produce the abundance difference between C13CH and 13CCH, and the abundance differences reflect the contribution of reaction (2), as described above.
4.2 Implications to production pathways of CCS
As described in the introduction, we recently discovered the abundance
difference between C13CS and 13CCS
in TMC-1 and L1521E (Sakai et al. 2007a). The [C13CS]/[13CCS]
ratio is ![]() (3
(3![]() )
in TMC-1, indicating that the two carbon atoms in CCS are not
equivalent in the main production pathways. Thus the S+
+ C2H2 reaction, which
has long been thought to be important, is ruled out as the main
process. As for the other routes, reactions involving CCH have been
thought to be
)
in TMC-1, indicating that the two carbon atoms in CCS are not
equivalent in the main production pathways. Thus the S+
+ C2H2 reaction, which
has long been thought to be important, is ruled out as the main
process. As for the other routes, reactions involving CCH have been
thought to be
| (5a) | |||
| (5b) | |||
| CCS + H | (5c) |
and
| (6) |
Sakai et al. (2007a) considered that the difference in the abundances of C13CH and 13CCH might be transferred to CCS, but they could not discuss this further because of a lack of accurate observational data of the [C13CH]/[13CCH] ratio. Now the abundances of C13CH and 13CCH are determined accurately and we can examine the contribution of reactions (5) and (6) for production of CCS. In reaction (6), the sulfur atom will attack the end carbon atom of CCH to form the CCS structure, because the unpaired electron is on the end carbon atom (Yamada et al. 2002). The reaction (5a) is expected to occur in a similar way. Therefore the carbon atom next to the sulfur atom in CCS comes from the end carbon atom of CCH, as far as no migration of the carbon atoms does occur. This means that 13CCS and C13CS are produced from C13CH and 13CCH, respectively. If the reactions including CCH are mainly responsible for the CCS production, the [C13CH]/[13CCH] ratio should be lower than 1/4.2. However, the [C13CH]/[13CCH] ratio in TMC-1 is much different (
Here it should be noted that the following exchange reaction
could enhance the abundance of C13CS relative to
that of 13CCS after the formation of CCS
| (7) |
This reaction is exothermic due to the difference in the zero-point vibrational energy (Y. Osamura, private communication). However, it is not obvious whether this reaction occurs in a cold cloud. This exchange reaction competes with the reaction producing 13CS and CS. Furthermore, reaction (7) also competes with the destruction reactions of CCS by C+, He+, and H+, and hence it would be difficult to realize the large abundance difference observed for C13CS and 13CCS. If CCS is produced from CCH and the exchange reaction (7) works, all 13C atoms in CCH should go to C13CS. Even in this extreme case, the [CCS]/[C13CS] ratio is expected to be about 100, which is twice as large as the observed ratio (54). Although the contributions of reaction (7) to the [C13CS]/[13CCS] ratio is considered to be small for the above reasons, reaction (7) should be carefully studied by quantum chemical calculations.
4.3 13C dilution in CCH
The present results clearly show the dilution of 13C in CCH. This is particularly significant in TMC-1. Here we discuss the mechanism of the dilution.
In dense molecular clouds where the interstellar UV radiation
is well shielded, the main reservoir of 13C is 13CO,
which is the most abundant carbon-bearing molecule. Note that the
isotope selective photodissociation of CO is ineffective in this
condition. The 13C+ ion
is formed from 13CO by the reaction with He+,
as 12C+ is formed from 12CO.
The 13C+ ion thus formed
immediately reacts with 12CO through the
exothermic reaction as
| (8) |
Since the backward reaction of (8) is slow for a cold cloud, the [12C+]/[13C+] ratio becomes high due to a loss of 13C+ through reaction (8). This means that 13C is diluted in C+. Hence various organic molecules including CCH produced from C+ in the gas phase would show the dilution of the 13C species (Fig. 5). On the other hand, the [12CO]/[13CO] ratio almost remains at the 12C/13C interstellar ratio of 60. The HCO+ and CO2 molecules, which are produced from CO, would also have the similar ratios. This was pointed out many years ago by Langer et al. (1984). Its observational confirmation has been very difficult so far because of observational difficulties such as weak intensities of the 13C species lines and heavy saturation of the normal species lines. The present result for CCH is a clear evidence supporting their theoretical prediction.
| Figure 5: Formation pathways of CCH. |
|
| Open with DEXTER | |
So far the 12C/13C
ratios have been reported for a few carbon-chain molecules in TMC-1.
Takano et al. (1998)
reported the [HC3N]/[H13CCCN],
[HC3N]/[HC13CCN], and [HC3N]/[HCC13CN]
ratio to be ![]() ,
,
![]() ,
and
,
and ![]() (1
(1![]() ),
respectively. Takano et al. (1990) derived
the 12C/13C ratios for
the five 13C species of HC5N
to be 79-103. Recently, Langston & Turner (2007) reported
the average 12C/13C
ratios of HC7N to be 87
+35-19
(1
),
respectively. Takano et al. (1990) derived
the 12C/13C ratios for
the five 13C species of HC5N
to be 79-103. Recently, Langston & Turner (2007) reported
the average 12C/13C
ratios of HC7N to be 87
+35-19
(1![]() )
respectively. Sakai et al. (2007a) also found
the [CCS]/[C13CS] and [CCS]/[13CCS]
ratios to be
)
respectively. Sakai et al. (2007a) also found
the [CCS]/[C13CS] and [CCS]/[13CCS]
ratios to be ![]() and
and ![]() (3
(3![]() ),
respectively. These results would suggest the dilution of 13C
in comparison with the interstellar 12C/13C
ratio of 60 except for [HC3N]/[HCC13CN]
and [CCS]/[C13CS]. However, the dilution has not
been discussed seriously, although Sakai et al. (2007a) considered
an effect of the isotope selective photodissociation for the 13CCS
case. Our result for CCH along with these early results now establishes
that the 13C species of the carbon-chain
molecules are heavily diluted in TMC-1. Furthermore, these results mean
that it is not possible to determine the elemental 12C/13C
ratio from carbon-chain molecules.
),
respectively. These results would suggest the dilution of 13C
in comparison with the interstellar 12C/13C
ratio of 60 except for [HC3N]/[HCC13CN]
and [CCS]/[C13CS]. However, the dilution has not
been discussed seriously, although Sakai et al. (2007a) considered
an effect of the isotope selective photodissociation for the 13CCS
case. Our result for CCH along with these early results now establishes
that the 13C species of the carbon-chain
molecules are heavily diluted in TMC-1. Furthermore, these results mean
that it is not possible to determine the elemental 12C/13C
ratio from carbon-chain molecules.
A recent chemical model calculation by Woods & Willacy (2009) predicts the dilution of the 13C species for various organic molecules except for CO and CO2. For instance, the 12C/13C ratio for CCH is 118, although they do not treat two 13C isotopic species separately. Unfortunately they do not provide the results using the best physical parameters for TMC-1 and L1527, because their purposes are to derive the initial condition for a simulation of the 13C species in protoplanetary disks. Nevertheless, our results are roughly consistent with theirs.
As described in Sect. 3.2, C13CH is more abundant than 13CCH. If the reaction (2) is responsible for the difference, the 12C/13C ratio in C should be higher than that in CH2. Although such a difference would be possible in general, quantitative interpretation of this result requires a detailed chemical model treating two 13C species separately, and is left for future studies.
As shown in Table 3, the [CCH]/[13CCH] and [CCH]/ [C13CH] ratios seem to be higher for TMC-1 than for L1527, although the derived ratios are all lower limits. The difference between the two sources, if it exists, is very important. It may reflect the chemical evolutionary effect or can be related to the nature of each source. Langer & Graedel (1989) modeled the time evolution of the 12C/13C ratios of various species and found that the ratios increase as a function of time toward the steady-state. This is in contrast to the observation, since L1527 should be more evolved than TMC-1. Still, a depletion of CO onto dust grains is not incorporated in the model by Langer and Graedel, which may affect the 12C/13C ratio in the later stage. Alternatively, it is known that L1527 is a unique star-forming region showing warm carbon-chain chemistry (WCCC), where various carbon-chain molecules are abundant around the protostar (Sakai et al. 2008). A contribution of WCCC to the 12C/13C ratios is still unknown. Furthermore, the effect of the isotope selective photodissociation (e.g. Sonnentrucker et al. 2007) might have to be considered when we discuss the 13C abundances during cloud formation and evolution. Therefore, detailed gas-grain chemical models considering gravitational contraction would be necessary toward a full understanding of a behavior of 13C species in molecular clouds.
4.4 Summary
The N=1-0 spectral lines of 13CCH and C13CH have been detected toward a cold dark cloud, TMC-1, and a low-mass star forming region, L1527. The principal results are as follows.
- 1.
- The abundance ratio of [C13CH]/[13CCH]
is determined to be
 (3
(3 )
and
)
and  (3)
for TMC-1 and L1527, respectively, from the integrated intensity ratios
of the strongest hyperfine components, where the errors quoted
represent three times the standard deviation. It is now established
that the abundances of C13CH and 13CCH
are significantly different.
(3)
for TMC-1 and L1527, respectively, from the integrated intensity ratios
of the strongest hyperfine components, where the errors quoted
represent three times the standard deviation. It is now established
that the abundances of C13CH and 13CCH
are significantly different.
- 2.
- The difference between the C13CH and 13CCH abundances most likely originates from production pathways of CCH in TMC-1 and L1527. In this case, two carbon atoms must be nonequivalent in the production mechanism. Hence, the electron recombination reactions of C2H2+ and C2H3+ cannot explain the difference because of the equivalence of two carbon atoms in these ions. The neutral-neutral reaction, C + CH2, would significantly contribute to the formation of CCH.
- 3.
- The [CCH]/[C13CH] and [CCH]/[13CCH] ratios are found to be larger than 170 and 250, respectively, for TMC-1, and to be larger than 80 and 135, respectively for L1527. These ratios are larger than the interstellar 12C/13C ratio of 60 for both of the sources, the 13C isotope being diluted in CCH.
- 4.
- A similar trend of the 13C dilution can be seen in the literature for some carbon-chain molecules like HC3N, HC5N, HC7N, and CCS. However, it has not been seriously considered in previous observational studies. The dilution is now established observationally, which is consistent with the theoretical predictions by Langer et al. (1984) and Woods & Willacy (2009). Furthermore, the present results suggest that it is impossible to determine the 12C/13C elemental ratio from the carbon-chain molecules because of the positional differences and the heavy dilution.
- 5.
- The abundance difference between C13CH and 13CCH and a source-to-source variation of the 13C dilution are important problems left for future observational and theoretical studies.
The authors wish to thank Riccardo Tarroni for providing the zero-point vibrational energies of C13CH and 13CCH, and Yoshihiro Osamura and Evelyne Roueff for valuable discussions. The authors are grateful to staff of the IRAM 30 M telescope for excellent support. This study is supported by Grant-in-Aids from the Ministry of Education, Culture, Sports, Science, and Technologies (21224002, 21740132, 15071201, and 19-6825).
Appendix
A: Frequency of CCH
The frequencies of the fine and hyperfine component lines of C13CH
(N=1-0) observed in L1527 are used to refine the
fine and hyperfine structure constants. In the analysis, the Hund's
case b
![]() basis set (see Appendix B) is used to construct the Hamiltonian matrix,
where all the off-diagonal matrix elements are included. The energy
levels are obtained by direct diagonalization of the matrix. The fine
and hyperfine structure constants are determined by a least-squares
analysis. The spin-rotation interaction constant
basis set (see Appendix B) is used to construct the Hamiltonian matrix,
where all the off-diagonal matrix elements are included. The energy
levels are obtained by direct diagonalization of the matrix. The fine
and hyperfine structure constants are determined by a least-squares
analysis. The spin-rotation interaction constant ![]() ,
the Fermi contact term (b) and the dipolar
interaction term (c) for the 13C
and H nuculei are determined. Since the rotational and centrifugal
distortion constants are accurately reported, they are fixed in the
analysis. Instead, we optimize the correction for
,
the Fermi contact term (b) and the dipolar
interaction term (c) for the 13C
and H nuculei are determined. Since the rotational and centrifugal
distortion constants are accurately reported, they are fixed in the
analysis. Instead, we optimize the correction for ![]() as a parameter in the analyses. Seven lines listed in Table A.1 are
successfully fitted within the observational errors. The standard
deviation of the fit is 3.3 kHz. The result of the fit is shown in
Table A.1,
whereas the determined parameters are listed in Table A.2. The obtained
constants are similar to those reported previously (McCarthy
et al. 1995),
and are used to calculate the rest frequencies of the hyperfine
components (Table 1).
as a parameter in the analyses. Seven lines listed in Table A.1 are
successfully fitted within the observational errors. The standard
deviation of the fit is 3.3 kHz. The result of the fit is shown in
Table A.1,
whereas the determined parameters are listed in Table A.2. The obtained
constants are similar to those reported previously (McCarthy
et al. 1995),
and are used to calculate the rest frequencies of the hyperfine
components (Table 1).
Table A.1: Observed and calculated frequencies of C13CH (N=1-0).
Table A.2: Molecular constants for C13CH.
Appendix B: Collisional cross section of CCH
CCH is a free radical with an unpaired electron and has a ![]() ground electronic state. Because of the presence of both an electron
spin and a nuclear spin of the hydrogen nucleus, the rotational energy
levels are split into the fine and hyperfine structure levels. For the 13C
species of CCH, the levels are also split by the nuclear spin of 13C.
Here we briefly describe the calculations of the collisional transition
rates among these energy levels, which are necessary for the LVG model
calculation.
ground electronic state. Because of the presence of both an electron
spin and a nuclear spin of the hydrogen nucleus, the rotational energy
levels are split into the fine and hyperfine structure levels. For the 13C
species of CCH, the levels are also split by the nuclear spin of 13C.
Here we briefly describe the calculations of the collisional transition
rates among these energy levels, which are necessary for the LVG model
calculation.
The following coupling scheme of the angular momenta (Hund![]() s case b
s case b
![]() )
is employed for CCH in the present calculation
)
is employed for CCH in the present calculation

and

where

and

where
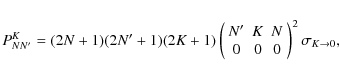
The collisional cross sections between two energy levels are
calculated under the assumption of the infinite order-sudden (IOS)
approximation (Alexander 1982;
Alexander & Dagdigian 1985). In
this calculation, the mixing of the Hund![]() s case b
s case b
![]() wavefunctions is not considered for simplicity. The cross sections can
be represented for CCH as
wavefunctions is not considered for simplicity. The cross sections can
be represented for CCH as
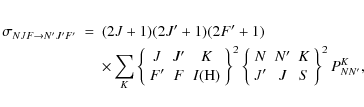
whereas they are given for the 13C species of CCH as

The latter equation is derived by a standard procedure for deriving reduced matrix elements under a coupled base (Edmonds 1957). In these equations,
where
Appendix C: Simplified chemical model
A simplified chemical model shown in Fig. C.1 is considered to
investigate an effect of the exchange reaction (3). According
to Fig. C.1,
the following rate equations are derived for C13CH
and 13CCH:
![\begin{eqnarray*}\frac{{\rm d}[\rm {C}^{13}\rm {CH}]}{{\rm d}t} &=& \it {k}_{\rm...
...CCH}][H]
\\
&& - \it {k}_{\rm ex}^{(b)} [\rm {C^{13}CH}][H],
\end{eqnarray*}](/articles/aa/full_html/2010/04/aa13098-09/img105.png)
and
![\begin{eqnarray*}\frac{{\rm d}[^{13}\rm {CCH}]}{{\rm d}t} &=& \it {k}_{\rm r} [\...
...m {CCH}][H]\\
&& + \it {k}_{\rm ex}^{(b)} [\rm {C^{13}CH}][H],
\end{eqnarray*}](/articles/aa/full_html/2010/04/aa13098-09/img106.png)
where we consider the destruction of CCH by the reaction with the oxygen atom. [X] denotes the fractional abundance of X relative to H2. Here,

where
| Figure C.1: Exchange reactions between 13CCH and C13CH. HA+ can be any ions including H3+ and HCO+, where the proton affinity of A is lower than that of CCH. |
|
| Open with DEXTER | |
From these relations, the abundance ratio can be expressed under the
steady-state approximation as
![\begin{eqnarray*}\frac{[\rm {C}^{13}\rm {CH}]}{[^{13}\rm {CCH}]} = \frac{2 k_{\r...
... ex}^{(b)} {\rm [H]} + k_{\rm d}[{\rm O}] + k[{\rm HA^+}]}\cdot
\end{eqnarray*}](/articles/aa/full_html/2010/04/aa13098-09/img114.png)
In this equation,
![\begin{eqnarray*}\frac{[\rm {C}^{13}\rm {CH}]}{[^{13}\rm {CCH}]} =
\frac{2 k_{\...
...rm O}]}{2 k_{\rm ex}^{(b)} {\rm [H]} + k_{\rm d}[{\rm O}]}\cdot
\end{eqnarray*}](/articles/aa/full_html/2010/04/aa13098-09/img117.png)
Since
References
- Aikawa, Y., Ohashi, N., & Herbst, E. 2003, ApJ, 593, 906 [NASA ADS] [CrossRef] [Google Scholar]
- Alexander, M. H. 1982, J. Chem. Phys., 76, 3637 [NASA ADS] [CrossRef] [Google Scholar]
- Alexander, M. H., & Dagdigian, P. J. 1985, J. Chem. Phys., 83, 2191 [NASA ADS] [CrossRef] [Google Scholar]
- Benson, P. J., Caselli, P., & Myers P. C. 1998, ApJ, 506, 743 [NASA ADS] [CrossRef] [Google Scholar]
- Caselli, P., Walmsley, C. M., Zucconi, A., et al. 2002, ApJ, 565, 344 [NASA ADS] [CrossRef] [Google Scholar]
- Crofton, M. W., Jagod, M.-F., Rehfuss, B. D., & Oka, T. 1989, J. Chem. Phys., 91, 5139 [NASA ADS] [CrossRef] [Google Scholar]
- Edmonds, A. R. 1957, Angular Momentum in Quantum Mechanics, Princeton, New Jergey, 109 [Google Scholar]
- Goldreich, P., & Kwan, J. 1974, ApJ, 189, 441 [NASA ADS] [CrossRef] [Google Scholar]
- Green, S., & Thaddeus, P. 1974, ApJ, 191, 653 [NASA ADS] [CrossRef] [Google Scholar]
- Hirahara, Y., Suzuki, H., Yamamoto, S., et al. 1992, ApJ, 394, 539 [NASA ADS] [CrossRef] [Google Scholar]
- Hirota, T., Yamamoto, S., Mikami, H., & Ohishi, M. 1998, ApJ, 503, 717 [NASA ADS] [CrossRef] [Google Scholar]
- Hirota, T., Ikeda, M., & Yamamoto, S. 2001, ApJ, 547, 814 [NASA ADS] [CrossRef] [Google Scholar]
- Langer, W. D., & Graedel, T. E. 1989, ApJS, 69, 241 [NASA ADS] [CrossRef] [Google Scholar]
- Langer, W. D., Graedel, T. E., Frerking, M. A., & Armentrout, P. B. 1984, ApJ, 277, 581 [NASA ADS] [CrossRef] [Google Scholar]
- Langston, G., & Turner, B. 2007, ApJ, 658, 455 [NASA ADS] [CrossRef] [Google Scholar]
- Leung, C. M., Herbst, E., & Huebner, W. F. 1984, ApJS, 56, 231 [NASA ADS] [CrossRef] [Google Scholar]
- Lucas, R., & Liszt, H. 1998, A&A, 337, 246 [NASA ADS] [Google Scholar]
- McCarthy M. C., Gottlieb C. A., & Thaddeus P. 1995, JMS, 173, 303 [Google Scholar]
- Millar, T. J., Bennett, A., & Herbst, E. 1989, ApJ, 340, 906 [NASA ADS] [CrossRef] [Google Scholar]
-
M
 ller, H. S. P., Klaus, T., & Winnewisser, G. 2000, A&A, 357, L65
[NASA ADS]
[Google Scholar]
ller, H. S. P., Klaus, T., & Winnewisser, G. 2000, A&A, 357, L65
[NASA ADS]
[Google Scholar]
-
M ller, H. S. P., Schl
 der, F., Stutzki, J., & Winnewisser, G. 2005, J. Mol. Struct., 742, 215
[NASA ADS]
[CrossRef]
[Google Scholar]
der, F., Stutzki, J., & Winnewisser, G. 2005, J. Mol. Struct., 742, 215
[NASA ADS]
[CrossRef]
[Google Scholar]
- Ohashi, N., Lee, S. W., Wilner, D. J., & Hayashi, M. 1999, ApJ, 518, L41 [Google Scholar]
- Petrie, S. 1996, MNRAS, 281, 666 [NASA ADS] [Google Scholar]
- Rodgers, S. D., & Millar, T. J. 1996, MNRAS, 280, 1046 [NASA ADS] [CrossRef] [Google Scholar]
- Sakai, N., Ikeda, M., Morita, M., et al. 2007a, ApJ, 663, 1174 [NASA ADS] [CrossRef] [Google Scholar]
- Sakai, N., Sakai, T., Osamura, Y. & Yamamoto, S. 2007b, ApJ, 667, L65 [NASA ADS] [CrossRef] [Google Scholar]
- Sakai, N., Sakai, T., Hitora, T., & Yamamoto, S. 2008, ApJ, 672, 371 [NASA ADS] [CrossRef] [Google Scholar]
- Saleck, A. H., Simon, R., Winnewisser, G., & Wouterloot, J. G. A. 1994, Can. J. Phys., 72, 747 [Google Scholar]
-
Schilke, P., Warmsley, C. M., Pineau des For
 ts, G., et al. 1992, A&A, 256, 595
[NASA ADS]
[Google Scholar]
ts, G., et al. 1992, A&A, 256, 595
[NASA ADS]
[Google Scholar]
- Sonnentrucker, P., Welty, D. E., Thorburn, J. A., & York, D. G. 2007, ApJ, 168, 58 [NASA ADS] [Google Scholar]
- Suzuki, H., Yamamoto, S., Ohishi, M., et al. 1992, ApJ, 392, 551 [NASA ADS] [CrossRef] [Google Scholar]
- Takano, S., Suzuki, H., Ohishi, M., et al. 1990, ApJ, 361, L15 [NASA ADS] [CrossRef] [Google Scholar]
- Takano, S., Masuda, A., Hirahara, Y., et al. 1998, A&A, 329, 1156 [NASA ADS] [Google Scholar]
- Tarroni, R., & Carter, S. 2003, J. Chem. Phys., 119, 12878 [NASA ADS] [CrossRef] [Google Scholar]
- Turner, B. E. 2001, ApJ, 136, 579 [NASA ADS] [CrossRef] [Google Scholar]
- Turner, B. E., Herbst, E., & Terzieva, R. 2000, ApJS, 126, 427 [NASA ADS] [CrossRef] [Google Scholar]
- Watson, W.D. 1974, ApJ, 188, 35 [NASA ADS] [CrossRef] [Google Scholar]
- Woods, P. M., & Willacy, K. 2009, ApJ, 693, 1360 [NASA ADS] [CrossRef] [Google Scholar]
- Yamada, M., Osamura, Y., & Kaiser, R.I. 2002, A&A, 395, 1031 [NASA ADS] [CrossRef] [EDP Sciences] [Google Scholar]
Footnotes
- ... Veleta
![[*]](/icons/foot_motif.png)
- IRAM is supported by INSU/CNRS (France), MPG (Germany), and IGN (Spain).
- ... telescope
- Nobeyama Radio Observatory is a branch of the National Astronomical Observatory of Japan, National Institutes of Natural Sciences, Japan.
All Tables
Table 1: Observed line parameters in TMC-1 and L1527.
Table 2: The column densities of CCH and its 13C isotopic species.
Table 3: The abundance ratio of CCH and its 13C isotopic species.
Table A.1: Observed and calculated frequencies of C13CH (N=1-0).
Table A.2: Molecular constants for C13CH.
All Figures
|
|
Figure 1: Observed line profiles of the hyperfine components of the N=1-0 transitions of C13CH and 13CCH in TMC-1. |
| Open with DEXTER | |
| In the text | |
|
|
Figure 2:
Observed line profiles of the hyperfine components of the N=1-0
transitions of C13CH and 13CCH
in L1527. Negative features indicated by arrows are frequency-switch
artifacts of nearby lines. The line at |
| Open with DEXTER | |
| In the text | |
|
|
Figure 3: Observed line profiles of the hyperfine components of the N=1-0 transitions of CCH in TMC-1 and L1527. Negative features indicated by arrows are frequency switch artifacts of nearby lines. |
| Open with DEXTER | |
| In the text | |
|
|
Figure 4: Results of the LVG model calculations for TMC-1 a) and L1527 b). The solid lines represent the [CCH]/[C13CH] and [CCH]/[13CCH] ratios, whereas the dashed line represents the [C13CH]/[13CCH] ratio. Shaded areas are appropriate density ranges for the sources. The error bars denote three times the standard deviations. |
| Open with DEXTER | |
| In the text | |
| |
Figure 5: Formation pathways of CCH. |
| Open with DEXTER | |
| In the text | |
| |
Figure C.1: Exchange reactions between 13CCH and C13CH. HA+ can be any ions including H3+ and HCO+, where the proton affinity of A is lower than that of CCH. |
| Open with DEXTER | |
| In the text | |
Copyright ESO 2010
Current usage metrics show cumulative count of Article Views (full-text article views including HTML views, PDF and ePub downloads, according to the available data) and Abstracts Views on Vision4Press platform.
Data correspond to usage on the plateform after 2015. The current usage metrics is available 48-96 hours after online publication and is updated daily on week days.
Initial download of the metrics may take a while.