| Issue |
A&A
Volume 511, February 2010
|
|
|---|---|---|
| Article Number | L1 | |
| Number of page(s) | 4 | |
| Section | Letters | |
| DOI | https://doi.org/10.1051/0004-6361/201014139 | |
| Published online | 24 February 2010 | |
LETTER TO THE EDITOR
Strong starlight suppression sufficient to enable
direct detection of exoplanets in the habitable zone![[*]](/icons/foot_motif.png)
S. R. Martin1 - A. J. Booth2
1 - Jet Propulsion Laboratory, California Institute of Technology, 4800 Oak Grove Drive, Pasadena, California 91109, USA
2 -
Sigma Space Corp., 4801 Forbes Boulevard, Lanham, MD 20706, USA
Received 26 January 2010 / Accepted 4 February 2010
Abstract
Direct detection of photons from exoplanets in the habitable zone around nearby
stars is challenging because of the much higher photon flux and close angular
proximity of the star. At mid-infrared wavelengths, around 10 ![]() m, the flux
contrast ratio between a sun-like star and an earth-size planet is several million to
one, favorable compared to the visible range, while the angular separation of the
bodies is less than 1
m, the flux
contrast ratio between a sun-like star and an earth-size planet is several million to
one, favorable compared to the visible range, while the angular separation of the
bodies is less than 1 ![]() radian.
The wavelength range between 7 and 20
radian.
The wavelength range between 7 and 20 ![]() m is worthy
of study because it can yield information on the planetary atmospheric
composition, particularly as it contains absorption lines for CO2,
ozone and water, which together can be considered a biomarker under
some conditions. To achieve observations of the spectrum, strong and
stable
suppression of the excess starlight is required along with suppression
of the local
and exo-Zodiacal light, which also have much higher fluxes than the
exoplanet signal. Here we show in the laboratory with nulling
interferometry, the suppression of
artificial starlight by almost eight orders of magnitude, which is
sufficient to detect a planet
some three million times fainter than the star. The results show that a
combination of
starlight suppression techniques enables the detection of medium-sized
planets in the habitable zone around nearby stars. Large space
telescopes planned
for future exoplanet studies will employ these techniques and one
additional
method, which brings earth-size planets within reach to obtain
compelling data on
the atmospheres of nearby exoplanets.
m is worthy
of study because it can yield information on the planetary atmospheric
composition, particularly as it contains absorption lines for CO2,
ozone and water, which together can be considered a biomarker under
some conditions. To achieve observations of the spectrum, strong and
stable
suppression of the excess starlight is required along with suppression
of the local
and exo-Zodiacal light, which also have much higher fluxes than the
exoplanet signal. Here we show in the laboratory with nulling
interferometry, the suppression of
artificial starlight by almost eight orders of magnitude, which is
sufficient to detect a planet
some three million times fainter than the star. The results show that a
combination of
starlight suppression techniques enables the detection of medium-sized
planets in the habitable zone around nearby stars. Large space
telescopes planned
for future exoplanet studies will employ these techniques and one
additional
method, which brings earth-size planets within reach to obtain
compelling data on
the atmospheres of nearby exoplanets.
Key words: techniques: interferometric - planets and satellites: detection
1 Introduction
In the technique of nulling interferometry (Bracewell 1978), radiation from the target object is
collected through two separate apertures and combined after inverting the electric field
of one of the inputs. The resultant Young's fringes (seen on the sky) are destructive
along the line of sight, so that radiation from a point-like target is extinguished. Light
from objects at angles
![]() ,
3
,
3
![]() ,
etc. (where
,
etc. (where ![]() is the wavelength
and B is the
interferometric baseline, that is the distance between the aperture centers) is
constructively interfered and may be detected. Additional nulling aperture pairs may be
added to enable phase modulation of the field of view, for example on ground-based
telescopes (Colavita et al. 2006) in order to reject atmospheric disturbances to the amplitude and phase of
the incoming beams pairs. For a space telescope, one or two dimensional arrays (Mennesson & Mariotti 1997) using
phase modulation in combination with rotation of the aperture array around the line of
sight, would be used to reduce thermal background including local and exo-Zodiacal
radiation and instrument disturbance effects to enable detection of faint exoplanets. The
effect of the array rotation is to rotate the interference fringes on the sky, producing
characteristic planet signals, which may be detected through matched filtering. Figure 1A
shows the two-dimensional on-sky fringe pattern for TPF-Emma (Martin et al. 2007). The star would be
maintained in the central dark nulled region, and radiation from a planet located at the
radius of the strong interference fringes would be modulated as the array rotates as
shown in Fig. 1B, see for example, Defrere et al. (2009).
is the wavelength
and B is the
interferometric baseline, that is the distance between the aperture centers) is
constructively interfered and may be detected. Additional nulling aperture pairs may be
added to enable phase modulation of the field of view, for example on ground-based
telescopes (Colavita et al. 2006) in order to reject atmospheric disturbances to the amplitude and phase of
the incoming beams pairs. For a space telescope, one or two dimensional arrays (Mennesson & Mariotti 1997) using
phase modulation in combination with rotation of the aperture array around the line of
sight, would be used to reduce thermal background including local and exo-Zodiacal
radiation and instrument disturbance effects to enable detection of faint exoplanets. The
effect of the array rotation is to rotate the interference fringes on the sky, producing
characteristic planet signals, which may be detected through matched filtering. Figure 1A
shows the two-dimensional on-sky fringe pattern for TPF-Emma (Martin et al. 2007). The star would be
maintained in the central dark nulled region, and radiation from a planet located at the
radius of the strong interference fringes would be modulated as the array rotates as
shown in Fig. 1B, see for example, Defrere et al. (2009).
2 Planet detection testbed
![\begin{figure}
\par\includegraphics[width=17cm,clip]{14139fig1.eps}
\end{figure}](/articles/aa/full_html/2010/03/aa14139-10/img8.png)
|
Figure 1:
A: Intensity map of the fringes on the sky. The star is at the center and the
array rotation causes the planet to move along the circular path. B: Normalized intensity signal
from planet as the array rotates through 360 |
| Open with DEXTER | |
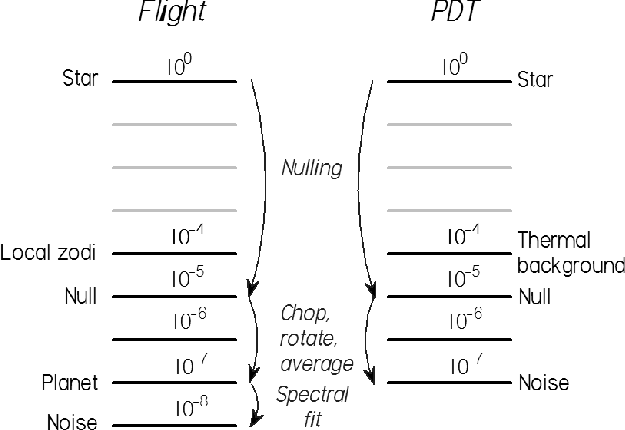
The exoplanet signal detection process is illustrated in Fig. 2. Approximating the intensities in terms of orders of magnitude, top left, the star's intensity is normalized to unity and the local Zodiacal background light has an intensity of 10-4. The starlight would be nulled to the 10-5 level and then rotation of the interferometer array, averaging, matched filtering, and finally spectral fitting (Lay 2006) reduce the starlight to 10-8 of the original intensity. The planet detection testbed (Booth et al. 2008) (PDT) has been developed for NASA's terrestrial planet finder interferometer (TPF-I) program to test this method of exoplanet detection using mid-infrared nulling. In our laboratory experiment, performed on the PDT, the light from a bright monochromatic source (forming the star) is split into four identical beams and may be combined with four beams of light from a faint source (forming the planet). For the test outlined here, we did not use the planet source. The four beams are then combined in a four-beam nulling interferometer, which eliminates most of the starlight by nulling the beams in pairs. The outputs of the two nullers are then combined and a phase modulation is also applied, enabling homodyne detection of the signal via a lock-in amplifier. The testbed embodies the main systems required for a large infrared telescope array (Martin 2005) such as fringe tracking for phase-locking on the star and laser metrology for internal pathlength and alignment control. Since the testbed's beam combination scheme is the same as that of TPF-Emma, it produces realistic signals which can be used to test starlight suppression and noise rejection. The output data can then be processed to test for the presence of planetary companions to the artificial star. Since, in this case, there are no companions, the test measures the noise level at the chosen radius, which was at the peak of the first constructive fringe on the nulling baseline.
On the right of Fig. 2, the test described here is illustrated, reproducing all but one of the exoplanet detection steps. The starlight will be nulled to the 10-5 level and then averaging and matched filtering (testing for specific planet signatures, which would be created by the rotation of the interferometer array) will reduce the starlight to at most 10-7 of the original intensity. This level therefore forms the baseline noise level. Since the testbed currently uses a monochromatic source for the star, the spectral fitting step shown on the left, which requires a broadband source and is used to reduce the instability noise (Lay 2004), cannot yet be executed.
|
Figure 2: Exoplanet detection process using a nulling interferometer. |
| Open with DEXTER | |
![\begin{figure}
\par\includegraphics[width=16.5cm,clip]{14139fig3.eps}
\end{figure}](/articles/aa/full_html/2010/03/aa14139-10/img10.png)
|
Figure 3:
A: Data from the detector. The periodic full scale excursions are the resets.
B: Data with processing steps applied: phase chopping, averaging over five rotations and filtering.
The vertical axis shows volts measured at the detector: the full flux from the star
would produce 254 V on this scale. C: Central part of interferometer field of view
with a 0.2 |
| Open with DEXTER | |
We report here the result of an experiment made with the PDT showing strong
suppression of the starlight so that the characteristic signal of a planet ![]() three
million times
fainter than the star would be detectable at a signal to noise ratio of
10. At this
suppression level, the ultimate goal of earth-sized exoplanet detection
is not quite
reached, but Neptune-sized planets (that are approximately three to
four times larger) would be readily detectable in the habitable
zone. Two planets in this size range (Kepler-4b and
GJ1214b) were recently
detected by transit methods (Borucki et al. 2010; Charbonneau et al. 2009). The expected star-to-planet contrast ratio would
vary by a factor of
three
million times
fainter than the star would be detectable at a signal to noise ratio of
10. At this
suppression level, the ultimate goal of earth-sized exoplanet detection
is not quite
reached, but Neptune-sized planets (that are approximately three to
four times larger) would be readily detectable in the habitable
zone. Two planets in this size range (Kepler-4b and
GJ1214b) were recently
detected by transit methods (Borucki et al. 2010; Charbonneau et al. 2009). The expected star-to-planet contrast ratio would
vary by a factor of ![]() 25 across the spectral band (Des Marais et al. 2002),
so a single number cannot cover all cases and a number of other factors
would affect performance, for example, stellar diameter, zodiacal light
and distance to the target system (Defrere et al. 2008). The
figures used here
therefore should be considered illustrative of an observation made in a portion of that wavelength range.
True earth-sized planet detection requires the
addition of the spectral fitting technique to the methods outlined here: this is planned as
the next phase for PDT.
25 across the spectral band (Des Marais et al. 2002),
so a single number cannot cover all cases and a number of other factors
would affect performance, for example, stellar diameter, zodiacal light
and distance to the target system (Defrere et al. 2008). The
figures used here
therefore should be considered illustrative of an observation made in a portion of that wavelength range.
True earth-sized planet detection requires the
addition of the spectral fitting technique to the methods outlined here: this is planned as
the next phase for PDT.
Since the testbed operates in a normal laboratory environment rather than under a vacuum at cryogenic temperatures, some steps were taken to allow traceability of the testbed performance to flight. First, for the test discussed here, the null depth (the suppression of the starlight due to nulling) was limited to approximately 10-5 in order to emulate the suppression that would be used in space. Near the earth, the local zodiacal light and the exo-zodiacal light would total around 10-4 of the flux from the target star. Therefore there is little to be gained by suppressing the starlight by more than about five orders of magnitude. Secondly, the test was run over approximately three hours rather than the ten hours typically needed in space. To compensate for the resulting increased noise level, five array rotations were allowed in the analysis phase, rather than a single one. Thirdly, the testbed has nulling stability similar to that required in space, so that it produces a similar level of instability noise. Separate algebraic and numerical models were used to verify that this setup is a good analogue of the performance in space.
After nulling the two pairs of input beams, the nulled output beams were combined
at a beamsplitter known as the cross-combiner and then sent to the detector. The
cross-combiner executes a step-like motion (known as phase chopping), which causes
the phase between the nuller outputs to alternate by one half wavelength, modulating the
constructive areas of the fixed nulling fringe pattern. This modulated signal was then
processed to test the starlight suppression. Figure 3A shows the detector output
measured in Volt. The total input starlight would measure 254 V on this scale. The
horizontal axis of the figure represents time and extends over a nominal five rotations of
the array, lasting a total of approximately three hours. Periodically, the testbed was
automatically reset to counteract any drifting of the alignment; this results in the full
scale deflections of the trace. These data, with the reset periods excluded, were then sampled as
the mean difference between the detector outputs in each cycle of the alternate phase
states, producing chopped data. This new dataset was then averaged by angle over
the five rotations. Then we removed artifacts; a dc offset, the fundamental of the rotation
frequency and the fundamental of the reset frequency. The result is shown in Fig. 3B.
We then applied matched filtering to test for the presence of a planet. For an array
with the dimensions 60 m and 10 m for the long and short axes respectively, nulling
across the short baselines, we predict for a planet at 1 AU from its star 10 pc distant, at
a wavelength of 10.6 ![]() m, the ``chopped'' planet signal shown in Fig. 1C. To measure
this putative planet signal we formed a correlation function
m, the ``chopped'' planet signal shown in Fig. 1C. To measure
this putative planet signal we formed a correlation function
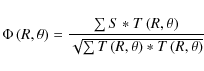
where S is the detected signal and T is the theoretical planet signal, a template produced as discussed by Mennesson & Mariotti (1997). The templates are calculated for a 6:1 X-array formation (Lay et al. 2007) of telescope apertures. At a given test radius R, all values of
Summarizing the results: normalizing the total input starlight to 1, the mean
starlight suppression due to nulling was
![]() .
After chopping, averaging and matched filtering, the rms output is
.
After chopping, averaging and matched filtering, the rms output is
![]() .
Thus the combination of nulling, chopping, rotational averaging and matched
filtering suppresses the starlight by a factor of
.
Thus the combination of nulling, chopping, rotational averaging and matched
filtering suppresses the starlight by a factor of ![]() 60 million, measured as rms noise divided by starlight input.
For comparison, a planet three million times fainter than the star and at a distance of 1 AU, will have a signal rms of
60 million, measured as rms noise divided by starlight input.
For comparison, a planet three million times fainter than the star and at a distance of 1 AU, will have a signal rms of
![]() ,
which is a factor
of 10 above the noise. Putting these numbers into the terms of Fig. 2, with a null about 50
,
which is a factor
of 10 above the noise. Putting these numbers into the terms of Fig. 2, with a null about 50![]() better than 10-5 the starlight suppression was about three times better than the test goal. Had the null been exactly at the intended 10-5 level, (difficult to achieve precisely), the starlight suppression would have been two times better than the test goal.
better than 10-5 the starlight suppression was about three times better than the test goal. Had the null been exactly at the intended 10-5 level, (difficult to achieve precisely), the starlight suppression would have been two times better than the test goal.
3 Conclusions and discussion
The testbed demonstrated starlight suppression of more than seven orders of magnitude using interferometric nulling. The performance was equivalent to that required to detect a Neptune-sized object at a distance of 1 AU from a sun-like star at a distance of 10 pc, with a signal to noise ratio of 10. Such an observation would be achievable with a 6:1 X-array formation with baselines of 10 m and 60 m between apertures.
The testbed is also capable of producing realistic faint exoplanet signals for detection by the same procedure. These measurements will be reported in a subsequent paper intended for this journal. The next logical step in mid-infrared starlight suppression development would be to employ spectral fitting, which affords a further level of noise suppression by enabling thedetection and compensation of the instability noise. Since this noise is produced by a 1/f process, it is only weakly reduced by an averaging process. However, instability noise has a spectral signature, which allows it to be corrected for in each detection epoch. Conversion of the PDT to operation with a broadband light source, enabling tests of starlight suppression using spectral fitting, is now being carried out. In the longer term, mid-infrared nulling interferometry also needs to be tested at realistic fluxes, which will require operation at cryogenic temperatures. This work shows that starlight suppression methods proposed for mid-infrared space interferometers are feasible and effective, and one additional step, the demonstration of spectral fitting, will complete the starlight suppression developments required for spectrally characterizing earth-like planets orbiting nearby stars.
AcknowledgementsKurt Liewer assisted with testbed development and operation. Frank Loya developed the software control system and several electronics systems. Oliver Lay assisted with data analysis techniques and traceability to flight. The research described in this letter was carried out at the Jet Propulsion Laboratory, California Institute of Technology, under a contract with the National Aeronautics and Space Administration.
References
- Booth, A. J., Martin, S. R., & Loya, F. 2008, in Optical and Infrared Interferometry, Proc. SPIE 7013, 701320-11 [Google Scholar]
- Borucki, W., Koch, D., & Brown, T., et al. 2010, ApJL, submitted [arXiv:1001.0604] [Google Scholar]
- Bracewell, R. N. 1978, Nature, 274, 780 [NASA ADS] [CrossRef] [Google Scholar]
- Charbonneau, D., Berta, Z. K., Irwin, J., et al. 2009, Nature, 462, 891 [NASA ADS] [CrossRef] [PubMed] [Google Scholar]
- Colavita, M. M., Serabyn, G., Wizinowich, P. L., & Akeson, R. L. 2006, in Advances in Stellar Interferometry, Proc. SPIE 6268, 626803 [Google Scholar]
- Defrere, D., Lay, O., den Hartog, R., & Absil, O. 2008, in Optical and Infrared Interferometry, Proc. SPIE 7013, 701321 [Google Scholar]
- Defrere, D., Absil, O., Den Hartog, R., Hanot, C., & Stark, C. 2009, A A, 509, A9 [Google Scholar]
- Des Marais, D. J., Harwit, M. O., Jucks, K. W., et al. 2002, Astrobiology, 2, 153 [NASA ADS] [CrossRef] [PubMed] [Google Scholar]
- Lay, O. P. 2004, Appl. Opt., 43, 6100 [NASA ADS] [CrossRef] [PubMed] [Google Scholar]
- Lay, O. P. 2006, in Advances in Stellar Interferometry, Proc. SPIE 6268, 62681A [Google Scholar]
- Lay, O. P., Martin, S. R., & Hunyadi, S. L. 2007, in Techniques and Instrumentation for Detection of Exoplanets III, Proc. SPIE 6693, 66930A [Google Scholar]
- Martin, S. 2005, in Techniques and Instrumentation for Detection of Exoplanets II, Proc. SPIE 5905, 21 [Google Scholar]
- Martin, S. R., Scharf, D., Wirz, R., et al. 2007, in Techniques and Instrumentation for Detection of Exoplanets III, Proc. SPIE 6693, 669309 [Google Scholar]
- Mennesson, B., & Mariotti, J. M. 1997, Icarus, 128, 202 [NASA ADS] [CrossRef] [Google Scholar]
Footnotes
All Figures
|
|
Figure 1:
A: Intensity map of the fringes on the sky. The star is at the center and the
array rotation causes the planet to move along the circular path. B: Normalized intensity signal
from planet as the array rotates through 360 |
| Open with DEXTER | |
| In the text | |
|
|
Figure 2: Exoplanet detection process using a nulling interferometer. |
| Open with DEXTER | |
| In the text | |
|
|
Figure 3:
A: Data from the detector. The periodic full scale excursions are the resets.
B: Data with processing steps applied: phase chopping, averaging over five rotations and filtering.
The vertical axis shows volts measured at the detector: the full flux from the star
would produce 254 V on this scale. C: Central part of interferometer field of view
with a 0.2 |
| Open with DEXTER | |
| In the text | |
Copyright ESO 2010
Current usage metrics show cumulative count of Article Views (full-text article views including HTML views, PDF and ePub downloads, according to the available data) and Abstracts Views on Vision4Press platform.
Data correspond to usage on the plateform after 2015. The current usage metrics is available 48-96 hours after online publication and is updated daily on week days.
Initial download of the metrics may take a while.