| Issue |
A&A
Volume 511, February 2010
|
|
|---|---|---|
| Article Number | A63 | |
| Number of page(s) | 26 | |
| Section | Interstellar and circumstellar matter | |
| DOI | https://doi.org/10.1051/0004-6361/200913037 | |
| Published online | 11 March 2010 | |
A multi-wavelength study of the young star V1118 Orionis in outburst![[*]](/icons/foot_motif.png) ,
,
M. Audard1,2 - G. S. Stringfellow3 - M. Güdel4 - S. L. Skinner3 - F. M. Walter5 - E. F. Guinan6 - R. T. Hamilton6,7 - K. R. Briggs4 - C. Baldovin-Saavedra1,2
1 - ISDC Data Center for Astrophysics, University of Geneva, Ch. d'Ecogia 16, 1290 Versoix, Switzerland
2 -
Observatoire de Genève, University of Geneva, Ch. des Maillettes 51, 1290 Versoix,
Switzerland
3 -
Center for Astrophysics and Space Astronomy, University of Colorado, Boulder, CO 80309-0389, USA
4 -
Institut für Astronomie, ETH Zürich, 8093 Zürich, Switzerland
5 -
Department of Physics and Astronomy, Stony Brook University, Stony Brook, NY 11794-3800, USA
6 -
Department of Astronomy and Astrophysics, Villanova University, Villanova 19085, PA, USA
7 -
Department of Astronomy, New Mexico State University, 320 East Union Ave, Apt. 1434, Las Cruces, NM 88001, USA
Received 31 July 2009 / Accepted 16 December 2009
Abstract
Context. The accretion history of low-mass young stars is
not smooth but shows spikes of accretion that can last from months and
years to decades and centuries.
Aims. Observations of young stars in outbursts can help us
understand the temporal evolution of accreting stars and the interplay
between the accretion disk and the stellar magnetosphere.
Methods. The young late-type star V1118 Orionis was in
outburst from 2005 to 2006. We followed the outburst with optical and
near-infrared photometry. The X-ray emission was further probed with
observations taken with XMM-Newton and Chandra during and after the outburst. In addition, we obtained mid-infrared photometry and spectroscopy with Spitzer at the peak of the outburst and in the post-outburst phase.
Results. The spectral energy distribution of V1118 Ori
varied significantly over the course of the outburst. The optical flux
showed the largest variations, most likely caused by enhanced emission
by a hot spot. The hot spot dominated the optical and near-infrared
emission at the peak of the outburst, while the disk emission dominated
in the mid-infrared. The emission silicate feature in V1118 Ori is
flat and does not vary in shape, but was slightly brighter at the peak
of the outburst compared to the post-outburst spectrum. The X-ray flux
correlated with the optical and infrared fluxes, indicating that
accretion affected the magnetically active corona and the stellar
magnetosphere. The thermal structure of the corona was variable with
some indication of a cooling of the coronal temperature in the early
phase of the outburst with a gradual return to normal values.
Color-color diagrams in the optical and infrared showed variations
during the outburst, with no obvious signature of reddening caused by
circumstellar matter. Using Monte-Carlo realizations of
star+disk+hotspot models to fit the spectral energy distributions in
``quiescence'' and at the peak of the outburst, we determined that the
mass accretion rate varied from about
![]()
![]() yr-1 to
yr-1 to
![]()
![]() yr-1; in addition, the fractional area of the hotspot increased significantly.
yr-1; in addition, the fractional area of the hotspot increased significantly.
Conclusions. The multi-wavelength study of the V1118 Ori
outburst helped us to understand the variations in spectral energy
distributions and demonstrated the interplay between the disk and the
stellar magnetosphere in a young, strongly accreting star.
Key words: accretion, accretion disks - infrared: stars - circumstellar matter - stars: coronae - stars: pre-main-sequence - X-rays: stars
1 Introduction
The star formation process involves strong accretion of circumstellar matter
onto the protostar. The time evolution of the mass accretion rate is of deep
interest for understanding the timescale of stellar growth and the lifetime of proto-planetary disks.
While the mass accretion rate in young stars overall decreases with increasing stellar age (Hartmann et al. 1998),
it can also show significant and rapid changes over time (e.g., Hartmann et al. 1993).
A handful of accreting young stars display powerful eruptive events
with flux increases in the optical regime of a few magnitudes. Two classes have
emerged: FUors, which display outbursts of 4 mag and more, last
several decades, and hence, show a low recurrence rate. EXors (named
after the prototype EX Lup), in contrast, show somewhat smaller outbursts
(
![]() mag) on a much shorter timescale, from a few months to a few
years, and may occur repeatedly (see review by Hartmann & Kenyon 1996; also Herbig 2008).
Such outbursts are believed to originate during a rapid increase in the disk accretion
rate over a short period of time, from values of 10-7
mag) on a much shorter timescale, from a few months to a few
years, and may occur repeatedly (see review by Hartmann & Kenyon 1996; also Herbig 2008).
Such outbursts are believed to originate during a rapid increase in the disk accretion
rate over a short period of time, from values of 10-7 ![]() yr-1
to 10-4
yr-1
to 10-4 ![]() yr-1, although the underlying cause of such an increase in mass accretion rate
is unclear (thermal disk instabilities, Bell & Lin 1994; Lin & Papaloizou 1985; close companions, Bonnell & Bastien 1992; cluster-induced encounters, Pfalzner et al. 2008; giant planets in the disk,
Lodato & Clarke 2004; Clarke & Syer 1996;
a combination of gravitational instability and the triggering of the magnetorotational instability, Armitage et al. 2001; accretion of
clumps in a gravitationally unstable disk, Vorobyov & Basu 2005,2006).
The limited number of eruptive young stars and the
long recurrence time (especially for FUor-type objects) make it difficult
to test models. It is, therefore, important to study the
evolution of outbursts in as much detail as possible and to understand the place of outbursting young stars
in the evolutionary scheme from highly accreting, embedded protostars to
``normal'' accreting classical T Tauri stars (CTTS).
yr-1, although the underlying cause of such an increase in mass accretion rate
is unclear (thermal disk instabilities, Bell & Lin 1994; Lin & Papaloizou 1985; close companions, Bonnell & Bastien 1992; cluster-induced encounters, Pfalzner et al. 2008; giant planets in the disk,
Lodato & Clarke 2004; Clarke & Syer 1996;
a combination of gravitational instability and the triggering of the magnetorotational instability, Armitage et al. 2001; accretion of
clumps in a gravitationally unstable disk, Vorobyov & Basu 2005,2006).
The limited number of eruptive young stars and the
long recurrence time (especially for FUor-type objects) make it difficult
to test models. It is, therefore, important to study the
evolution of outbursts in as much detail as possible and to understand the place of outbursting young stars
in the evolutionary scheme from highly accreting, embedded protostars to
``normal'' accreting classical T Tauri stars (CTTS).
The optically revealed CTTS can make excellent comparison stars to outbursting young stars. They have been studied extensively in the past: optical and infrared observations have given clues about the presence of accretion disks, on the mass accretion rates, and disk winds, while millimeter observations provided constraints on the dust disk mass and on CO outflows. In the X-rays, the origin of emission in young, accreting stars has gained significant attention in the last few years. Kastner et al. (2002) obtained the first X-ray grating spectrum of TW Hya, a moderately accreting CTTS, and observed unexpected new spectral features: the O VII and Ne IX He-like triplets showed very low forbidden-to-intercombination line ratios and indicated high electron densities on the order of 1012-1013 cm-3. The effect of UV photoexcitation on the observed line ratio was deemed negligible. In addition, the X-ray spectrum was consistent with a quasi-isothermal plasma of about 3 MK. Kastner et al. (2002) concluded that the X-ray emission in TW Hya was due to accretion, a result further supported by Stelzer & Schmitt (2004) and Ness & Schmitt (2005). Additional high-resolution X-ray spectra of CTTS have also indicated that accretion may play a significant role for X-rays in accreting stars (Argiroffi et al. 2007; Robrade & Schmitt 2006; Günther et al. 2007; Sacco et al. 2008; Günther et al. 2006; Schmitt et al. 2005). Soft X-ray emission from shocks in jets may also be detected (Schneider & Schmitt 2008; Günther & Schmitt 2009; Güdel et al. 2005; Güdel et al. 2008; Kastner et al. 2005; Robrade & Schmitt 2007). Telleschi et al. (2007) and Güdel & Telleschi (2007) showed that CTTS display a soft X-ray excess from plasma at low temperature. Such a plasma (mostly detected in the O VII lines) is difficult to detect with CCD spectroscopy but can easily be revealed by high-resolution X-ray spectra when the absorbing column density is not too high. The soft X-ray excess can co-exist with the hot plasma observed in the vast majority of young stars, which is due to scaled-up solar-like magnetic activity (Preibisch et al. 2005; Smith et al. 2005; Audard et al. 2005a; Telleschi et al. 2007). The origin of such an excess is unclear, but it could be due in part to accretion onto the stellar photosphere. It is crucial to understand how the X-ray emission in young stars, in particular those actively accreting matter, can be influenced by the accretion process. FUor and EXor stars are, therefore, the ideal cases for understanding the physical mechanism common to both CTTS and outbursting stars.
In recent years, several young low-mass stars have been observed in outburst, in the optical and infrared, but also in X-rays: V1647 Ori in 2003-2005 (e.g., Kastner et al. 2004, Grosso et al. 2005, Kastner et al. 2006a; see also Aspin et al. 2008, and references therein) and recently in 2008-2009 (Aspin 2008; Venkat & Anandarao 2008; Aspin et al. 2009; Itagaki 2008), V1118 Ori in 2005-2006 (Lorenzetti et al. 2007; Herbig 2008; Audard et al. 2005b; Lorenzetti et al. 2006). Kastner et al. (2006b) also observed a young stellar object in eruption in LDN 1415 with Chandra but failed to detect it. EX Lup also showed an extreme outburst in early 2008 (Kospal et al. 2008; Jones 2008b,a). Ábrahám et al. (2009) detected crystalline features in the silicate feature of EX Lup in outburst which were not present in the pre-outburst spectrum, suggesting crystallization by thermal annealing in the surface layer of the inner disk. X-ray observations were obtained with Chandra (PI: Weintraub) and Swift (PI: Stringfellow) but have not yet been published. The FUor objects FU Ori, V1735 Cyg, and Z CMa have also been detected in X-rays (Skinner et al. 2006; Stelzer et al. 2009; Skinner et al. 2009a).
The V1647 Ori campaign showed an increase in X-ray flux by a factor of 200 from the pre-outburst flux, in line with the flux increase in the infrared. The X-ray flux then followed the optical outburst flux and returned to its pre-outburst level after the outburst ended (Kastner et al. 2006a). The initial observations of V1118 Ori in X-rays revealed different behavior, with little flux enhancement (Audard et al. 2005b), but also indicated that the rapid increase of accretion rate in outbursts can impact the X-ray emission of young accreting stars. The present paper aims to present the remainder of the X-ray data of V1118 Ori taken during and after the 2005-2006 outburst, together with contemporaneous optical and infrared data.
Table 1: X-ray observation log.
2 The young erupting star V1118 Ori
The outburst of V1118 Ori, a young low-mass M1e star in the Orion Nebula (d = 400 pc; Muench et al. 2008 for a discussion), was reported
in early January 2005 by Williams et al. (2005).
Hillenbrand (1997) and Stassun et al. (1999) provide details about its physical properties:
![]() ;
;
![]() ;
;
![]() d;
d;
![]() ;
;
![]() ;
;
![]() .
Recently, Reipurth et al. (2007) resolved V1118 Ori into a close binary separated by
.
Recently, Reipurth et al. (2007) resolved V1118 Ori into a close binary separated by
![]() with
a position angle of
with
a position angle of
![]() and a magnitude difference of
and a magnitude difference of
![]() mag in the H
mag in the H![]() -band image.
The observation was obtained on 2004 Jan. 29, thus before the 2005-2006 outburst (see Fig. 6).
The binarity of V1118 Ori leaves unclear which star actually erupted. However, the small magnitude
difference indicates that the components are similar, suggesting similar effective temperatures. We may also assume
that they show similar disk evolution. While the binarity of V1118 Ori complicates the interpretation of the combined
photometry and spectroscopy in quiescence, this should have little impact on the interpretation of the outburst data, as
only one star+disk component dominates the emission. In this paper, we have used the above stellar properties that
assumed a single star.
-band image.
The observation was obtained on 2004 Jan. 29, thus before the 2005-2006 outburst (see Fig. 6).
The binarity of V1118 Ori leaves unclear which star actually erupted. However, the small magnitude
difference indicates that the components are similar, suggesting similar effective temperatures. We may also assume
that they show similar disk evolution. While the binarity of V1118 Ori complicates the interpretation of the combined
photometry and spectroscopy in quiescence, this should have little impact on the interpretation of the outburst data, as
only one star+disk component dominates the emission. In this paper, we have used the above stellar properties that
assumed a single star.
V1118 Ori has shown frequent outbursts (e.g., 1983-84, 1988-90, 1992-94, 1997-98; see Garcia & Parsamian 2000; and Herbig 2008 for details).
Indeed, after returning to quiescence in mid-2006, V1118 Ori had another outburst in late 2007 (Garcia & Parsamian 2008).
We focus here on our monitoring campaign to study the 2005-2006 outburst of V1118 Ori in the X-rays,
optical and infrared.
Additional properties in the optical and infrared were obtained independently during and after the outburst by Lorenzetti et al. (2007,2006) and Herbig (2008).
Using wind models, Lorenzetti et al. (2006) derived a mass loss rate of
![]() yr-1 from the H I recombination line, and
yr-1 from the H I recombination line, and
![]()
![]() yr-1 from the CO emission at 2.3
yr-1 from the CO emission at 2.3 ![]() m for the neutral molecular gas; they
also found no evidence of infrared cooling from a collimated jet or outflow. Lorenzetti et al. (2007) also found
evidence of intrinsic polarization in the I band, and irregular fluctuations during the outburst.
Herbig (2008) obtained Keck/HIRES spectra of V1118 Ori in the decaying phase of the outburst and in the
post-outburst phase. He noted the detection of Li I
m for the neutral molecular gas; they
also found no evidence of infrared cooling from a collimated jet or outflow. Lorenzetti et al. (2007) also found
evidence of intrinsic polarization in the I band, and irregular fluctuations during the outburst.
Herbig (2008) obtained Keck/HIRES spectra of V1118 Ori in the decaying phase of the outburst and in the
post-outburst phase. He noted the detection of Li I
![]() in emission during the outburst,
in contrast to the absorbed feature in CTTS spectra. The feature, however, was seen in absorption after the outburst. Similar
behavior was exhibited by the K I lines at
in emission during the outburst,
in contrast to the absorbed feature in CTTS spectra. The feature, however, was seen in absorption after the outburst. Similar
behavior was exhibited by the K I lines at
![]() 7664 and 7698 Å. A P Cyg profile was also found
in H
7664 and 7698 Å. A P Cyg profile was also found
in H![]() during the outburst, which disappeared thereafter. In the near-infrared, Lorenzetti et al. (2007) also found
that the emission lines detected during the outburst (H I, He I, CO
during the outburst, which disappeared thereafter. In the near-infrared, Lorenzetti et al. (2007) also found
that the emission lines detected during the outburst (H I, He I, CO ![]() m band, a few neutral metals)
disappeared about a year later.
m band, a few neutral metals)
disappeared about a year later.
In the X-ray regime, the initial Jan.-Mar. 2005 data were published by Audard et al. (2005b).
In brief, the X-ray data of early 2005 indicated that the X-ray flux
and luminosity varied by less than a factor of two during the outburst,
at the same level as in a pre-outburst observation in 2002. The
fluxes in the optical and near-infrared varied more significantly, by
factors of 2-10. The hydrogen column density showed no evidence
for variation from its modest pre-outburst value of
![]() cm-2. However, there was evidence of a spectral change from a dominant
hot plasma (
cm-2. However, there was evidence of a spectral change from a dominant
hot plasma (![]() 25 MK) in 2002 and in January 2005 to a cooler plasma (
25 MK) in 2002 and in January 2005 to a cooler plasma (![]() 8 MK)
in February 2005 and probably in March 2005. We hypothesized that the
hot magnetic loops high in the corona were disrupted by the closing in
of the accretion disk as a consequence of the increased accretion rate
during the outburst, whereas the lower cooler loops were probably less
affected and became the dominant coronal component (Audard et al. 2005b). We argued that the cool component in V1118 Ori
could not originate from shocks because free-fall velocities of matter falling from the truncation radius are
too low (see Audard et al. 2005b for further discussion). In a subsequent paper, Lorenzetti et al. (2006) independently analyzed our public data sets
of early 2005, and also included the September 2005 XMM-Newton observation, together with their near-infrared data sets. The September 2005 observation
showed a decrease in X-ray flux at the start of the decay phase.
8 MK)
in February 2005 and probably in March 2005. We hypothesized that the
hot magnetic loops high in the corona were disrupted by the closing in
of the accretion disk as a consequence of the increased accretion rate
during the outburst, whereas the lower cooler loops were probably less
affected and became the dominant coronal component (Audard et al. 2005b). We argued that the cool component in V1118 Ori
could not originate from shocks because free-fall velocities of matter falling from the truncation radius are
too low (see Audard et al. 2005b for further discussion). In a subsequent paper, Lorenzetti et al. (2006) independently analyzed our public data sets
of early 2005, and also included the September 2005 XMM-Newton observation, together with their near-infrared data sets. The September 2005 observation
showed a decrease in X-ray flux at the start of the decay phase.
The initial paper by Audard et al. (2005b) presented and analyzed the outburst data through March 2005. We present here the XMM-Newton and Chandra data obtained from September 2005 on, which are analyzed in the context of our multiwavelength analysis. We also include a post-outburst data set obtained by Chandra in December 2007. The latter was taken during a minor outburst detected in the optical (Garcia & Parsamian 2008). Extensive optical and near-infrared photometry are presented and analyzed, obtained from our team's imaging data, along with mid-infrared photometry and spectroscopy with Spitzer.
3 Observations and data reduction
3.1 X-ray
Table 1 provides the observation log of our 2005-2006 monitoring campaign of the outburst of V1118 Ori with XMM-Newton (Jansen et al. 2001) and Chandra (Weisskopf et al. 1996). We also provide information about the 2002 serendipitous observation of V1118 Ori (an observation in 2001 with XMM-Newton was reported in Audard et al. 2005b but is not mentioned here since the star was not detected). A deep XMM-Newton observation was obtained in early 2006 that complements the short monitoring observations. Finally, we include the post-outburst Chandra observation in December 2007 as well. The angular resolution of neither X-ray satellites was high enough to separate the V1118 Ori binary.
The XMM-Newton data were processed with SAS 7.0. Standard procedures were applied. We used an extraction circle of radius 20
![]() for the source and a nearby circular region of 60
for the source and a nearby circular region of 60
![]() radius (40
radius (40
![]() for Sep. 2005 and 35
for Sep. 2005 and 35
![]() for Mar. 2006) for the background.
Only event patterns lower than 4 and 12 were used for the European Photon Imaging Cameras (EPIC) pn and MOS (Turner et al. 2001; Strüder et al. 2001), respectively.
The background flux levels were high during all XMM-Newton observations, in particular in March and September 2005. As described in Audard et al. (2005b),
we used only the MOS1 and MOS2 data for the March 2005
observation.
The September 2005 observation was so affected by the background
that we lost about half the exposure time in the EPIC pn, while no MOS
data were available. The deep March 2006 observation was affected
by a system failure at the Mission Operations Centre and the EPIC
pn experienced full scientific buffer in the last part of the
observation, explaining the reduced exposure time in the EPIC pn
(78 ks) compared to the
EPIC MOS (90 ks). No Optical Monitor data were taken with the XMM-Newton X-ray observation because of the presence of the nearby bright Trapezium stars.
for Mar. 2006) for the background.
Only event patterns lower than 4 and 12 were used for the European Photon Imaging Cameras (EPIC) pn and MOS (Turner et al. 2001; Strüder et al. 2001), respectively.
The background flux levels were high during all XMM-Newton observations, in particular in March and September 2005. As described in Audard et al. (2005b),
we used only the MOS1 and MOS2 data for the March 2005
observation.
The September 2005 observation was so affected by the background
that we lost about half the exposure time in the EPIC pn, while no MOS
data were available. The deep March 2006 observation was affected
by a system failure at the Mission Operations Centre and the EPIC
pn experienced full scientific buffer in the last part of the
observation, explaining the reduced exposure time in the EPIC pn
(78 ks) compared to the
EPIC MOS (90 ks). No Optical Monitor data were taken with the XMM-Newton X-ray observation because of the presence of the nearby bright Trapezium stars.
The Chandra data
were processed with CIAO 3.3 and CALDB 3.2.3![]() .
The task psextract
was used to extract the spectra
for V1118 Ori and the nearby background. We used a circle of 2
.
The task psextract
was used to extract the spectra
for V1118 Ori and the nearby background. We used a circle of 2
![]() radius (
radius (![]() 4 pixels)
for the star and an annulus centered at the position of the star but
with radii of 10 and 60 pixels for the background; our
background area was, therefore, 212 times larger
than the source extraction area. Our extraction radius for the star
includes 95% of the encircled energy at 1.5 keV and 90% at
4.5 keV.
For the January 2005 observation in sub-array mode, we used an
outer radius of 40 pixels for the background annulus.
For the 2002 observation, we used circles of radii of 15
4 pixels)
for the star and an annulus centered at the position of the star but
with radii of 10 and 60 pixels for the background; our
background area was, therefore, 212 times larger
than the source extraction area. Our extraction radius for the star
includes 95% of the encircled energy at 1.5 keV and 90% at
4.5 keV.
For the January 2005 observation in sub-array mode, we used an
outer radius of 40 pixels for the background annulus.
For the 2002 observation, we used circles of radii of 15
![]() and 45
and 45
![]() for the source and the background, respectively (see Audard et al. 2005b).
for the source and the background, respectively (see Audard et al. 2005b).
Table 2: Spitzer IRAC and MIPS flux density measurements (units of mJy).
3.2 Optical and near-infrared
3.2.1 SMARTS
We observed V1118 Ori with the ANDICAM dual-channel imager on the SMARTS/CTIO![]() 1.3 m
telescope on 115 nights. Such dense coverage was made possible by the
service mode operations employed by the SMARTS consortium. We have
5 pre-outburst observations (2004 Feb. 2 through
2004 Apr. 8) that can
be used to set the quiescent flux levels.
The intensive monitoring began 2005 Jan. 10, shortly after
the outburst was
reported. There were no observations from 2005 Apr. 4 through
2005 Jul. 31
due to proximity to the Sun. We observed with cadences between
1 per day
and 1 per week, with observations generally every
3-4 days.
Our intensive monitoring terminated on 2006 May 6.
We also followed the decay of the second outburst from
2007 Dec. 27
through 2008 Mar. 27. Details of the data reduction are given
in Appendix A.
Table A.2 (available online only) gives the nightly average photometry for SMARTS.
1.3 m
telescope on 115 nights. Such dense coverage was made possible by the
service mode operations employed by the SMARTS consortium. We have
5 pre-outburst observations (2004 Feb. 2 through
2004 Apr. 8) that can
be used to set the quiescent flux levels.
The intensive monitoring began 2005 Jan. 10, shortly after
the outburst was
reported. There were no observations from 2005 Apr. 4 through
2005 Jul. 31
due to proximity to the Sun. We observed with cadences between
1 per day
and 1 per week, with observations generally every
3-4 days.
Our intensive monitoring terminated on 2006 May 6.
We also followed the decay of the second outburst from
2007 Dec. 27
through 2008 Mar. 27. Details of the data reduction are given
in Appendix A.
Table A.2 (available online only) gives the nightly average photometry for SMARTS.
3.2.2 Villanova
Photometric coverage in the optical (standard Bessel VRI) was obtained with the Celestron 14'' optical tube assembly with a Paramount ME German equatorial mount at the Villanova University Observatory located on the campus near Philadelphia, PA. Observations were carried out with a SBIG ST7-XME detector thermoelectrically cooled to -25 degrees Celsius. Dark and flat field frames were collected at the end of each night’s observations. A standard error of 0.05 mag was estimated from the signal-to-noise ratio and seeing conditions. Table A.3 (available online only) lists the magnitudes obtained at Villanova.
3.2.3 Additional data
We have also used published optical and near-infrared photometric data from Lorenzetti et al. (2007) (3.3 Spitzer
In addition to our observations of V1118 Ori in outburst (program ID 3716, PI: G. Stringfellow) and in post-outburst (program ID 41019, PI: M. Audard), V1118 Ori was serendipitously observed with the InfraRed Array Camera (IRAC; Fazio et al. 2004) by the Spitzer Space Telescope (Werner et al. 2004) in March 2004 and twice in October 2004 (program IDs 43 and 50, PI: G. Fazio). We show the IRAC images taken before the outburst in March 2004 centered on V1118 Ori (Fig. 1). We provide the IRAC fluxes for all observations in Table 2 (see also Lorenzetti et al. 2007 for the IRAC data of October 27, 2004). Details of the Spitzer IRAC data reduction are given in Appendix B.
![\begin{figure}
\par\includegraphics[angle=0,width=8.5cm,clip]{13037fg1.ps}
\end{figure}](/articles/aa/full_html/2010/03/aa13037-09/img61.png)
|
Figure 1: Spitzer IRAC images centered on V1118 Ori, taken pre-outburst in March 2004. The images are shown with a linear scale from 0 to 200 MJy sr-1. The Herbig Ae star V372 Ori is seen near V1118 Ori. |
| Open with DEXTER | |
![\begin{figure}
\par\includegraphics[width=16.5cm,clip]{13037fg2.eps}
\end{figure}](/articles/aa/full_html/2010/03/aa13037-09/img62.png)
|
Figure 2: Spitzer IRS background-subtracted spectra obtained near the peak of the outburst (panels a) and b)) and after the outburst (panels c) and d)). Panel d) shows the SL and LL module data. Panels a), b), and c) show the SL spectra as thick black lines, whereas the SH and LH spectra are shown as red and blue lines. Detected emission lines are labeled (while other lines well-subtracted by the background spectrum are shown in italics). |
| Open with DEXTER | |
V1118 Ori was also observed with the Multiband Imaging Photometer for Spitzer (MIPS; Rieke et al. 2004) at 24 ![]() m before the outburst, on March 20, 2004 (program ID 58, PI: G. Rieke). Again, Appendix B
provides details of the data reduction. No MIPS photometry is available
for V1118 Ori during or after the outburst. Our programs (3716 and
41019) included MIPS spectral energy distribution data (
m before the outburst, on March 20, 2004 (program ID 58, PI: G. Rieke). Again, Appendix B
provides details of the data reduction. No MIPS photometry is available
for V1118 Ori during or after the outburst. Our programs (3716 and
41019) included MIPS spectral energy distribution data (
![]() )
in the 70
)
in the 70 ![]() m
band; however, the on-time exposure (180 s) did not allow us to
detect V1118 Ori, even during the outburst. Indeed, the background
level (because of the diffuse emission in the Orion nebula) produced a
much higher flux (on the order of 40 Jy at 70
m
band; however, the on-time exposure (180 s) did not allow us to
detect V1118 Ori, even during the outburst. Indeed, the background
level (because of the diffuse emission in the Orion nebula) produced a
much higher flux (on the order of 40 Jy at 70 ![]() m) than the expected signal from V1118 Ori (on the order 0.1 Jy if extrapolating the SED at 70
m) than the expected signal from V1118 Ori (on the order 0.1 Jy if extrapolating the SED at 70 ![]() m, see Fig. 12).
m, see Fig. 12).
Spitzer also observed V1118 Ori with the InfraRed Spectrograph (IRS; Houck et al. 2004) twice during the outburst (PID 3716) with the Short-Low (SL: 5.2-14.7 ![]() m,
m,
![]() ), Short-High (SH: 9.9-19.6
), Short-High (SH: 9.9-19.6 ![]() m,
m,
![]() ), and Long-High (LH: 18.7-37.2
), and Long-High (LH: 18.7-37.2 ![]() m,
m,
![]() )
modules (2005 February 18 and 2005 March 11). No
background observations were taken with the high-resolution modules. In
contrast, the post-outburst data (PID 41019;
2008 November 14) were taken with background spectra for the
high-resolution modules and also included the Long-Low (LL:
14.0-38.0
)
modules (2005 February 18 and 2005 March 11). No
background observations were taken with the high-resolution modules. In
contrast, the post-outburst data (PID 41019;
2008 November 14) were taken with background spectra for the
high-resolution modules and also included the Long-Low (LL:
14.0-38.0 ![]() m,
m,
![]() )
module.
)
module.
Figure 2 shows all IRS spectra after background subtraction. We describe in Appendix B the methodology we used to derive the background-subtracted spectra of V1118 Ori. We also discuss in the Appendix the validity of using the post-outburst background observation for our outburst IRS SH spectra.
In brief, the background is well-subtracted in the case of the
continuum in the post-outburst, high-resolution spectrum, as the flux
is consistent with the low-resolution spectrum. The continua in the
outburst SH spectra are also accurate below 14 ![]() m since they are consistent with the low-resolution SL spectra. However, we consider the observed increase in continuum flux
for
m since they are consistent with the low-resolution SL spectra. However, we consider the observed increase in continuum flux
for
![]()
![]() m
during the outburst to be unreliable, since we have no MIPS photometry
or low-resolution spectra to confirm the increase. We also urge caution
with regards to the detection of lines in the background-subtracted SH
and LH spectra. The strong background line emission of the Orion
nebula, and its inhomogeneity (see Fig. B.2) make the background subtraction difficult, although not impossible (e.g., a very strong PAH emission at 11.3
m
during the outburst to be unreliable, since we have no MIPS photometry
or low-resolution spectra to confirm the increase. We also urge caution
with regards to the detection of lines in the background-subtracted SH
and LH spectra. The strong background line emission of the Orion
nebula, and its inhomogeneity (see Fig. B.2) make the background subtraction difficult, although not impossible (e.g., a very strong PAH emission at 11.3 ![]() m is well-subtracted). The [S III] emission lines at 18.71 and 33.48
m is well-subtracted). The [S III] emission lines at 18.71 and 33.48 ![]() m are likely robust detections as their detection is consistent with the low-resolution SL and LL data. The [Si II] line is also generally well subtracted.
m are likely robust detections as their detection is consistent with the low-resolution SL and LL data. The [Si II] line is also generally well subtracted.
Interestingly, the rotational H2 S(0) line is detected during the outburst and in post-outburst. However the S(1) line is not detected (it is is even slightly oversubtracted in the outburst spectra), and the S(2) line is only detected in the post-outburst spectrum (a faint excess in the outburst spectra is present only in one bin, likely caused by slight differences in the wavelength scales of the source and background spectra). It is likely that the H2 emitting conditions vary spatially in the Orion nebula, and that the background spectrum did not accurately reflect the H2 background line fluxes near V1118 Ori, creating an excess in line emission observed in the post-outburst spectrum. Alternatively, if the H2 emission lines are real, at least in the post-outburst spectra, the physical conditions near V1118 Ori are such that the para (odd quantum number J) lines dominate the emission.
A similar case of difficult background line subtraction arises in the [Ne II] line at 12.81 ![]() m:
its detection in the SH spectrum is also subject to caution, as it is
not detected in the low-resolution spectra (although it should have
been, see the discussion in the Appendix). In any case, we provide in
Table 3 the tentative, measured line fluxes from the high-resolution module spectra, while Fig. 3 shows zoomed in regions of the IRS spectra of the detected lines.
m:
its detection in the SH spectrum is also subject to caution, as it is
not detected in the low-resolution spectra (although it should have
been, see the discussion in the Appendix). In any case, we provide in
Table 3 the tentative, measured line fluxes from the high-resolution module spectra, while Fig. 3 shows zoomed in regions of the IRS spectra of the detected lines.
4 X-ray analysis
4.1 Light curves
![\begin{figure}
\par\includegraphics[angle=0,width=17cm,clip]{13037fg3.eps}
\end{figure}](/articles/aa/full_html/2010/03/aa13037-09/img67.png)
|
Figure 3: Zoomed in regions of the Spitzer IRS background-subtracted spectra. The post-outburst spectra are shown in the bottom panel, while the top two panels are for the outburst spectra. In the leftmost panels, we show both the high-resolution SH (thin, red) and the low-resolution SL (thick, black) data. Detected emission lines are labeled in the bottom panels (while other lines well-subtracted by the background spectrum are shown in italics). Observation dates applicable to each horizontal set of spectra are listed in the left panels. |
| Open with DEXTER | |
Figure 4 presents the X-ray light curves for the Chandra observations. The lower panels show the binned light curves, whereas the upper panels show the photon CCD energy as a function of time. Except for Sep. 2002, the background is not subtracted in the light curves and not shown in the upper panels, since it contributed less than 1 count to the Chandra total (source + background) number of counts over the entire observing duration. Since V1118 Ori was observed serendipitously in the Sep. 2002 observation and was placed at the edge of the ACIS-I camera, the background contributed more significantly; therefore, the light curve shown in the bottom panel is background-subtracted, and the CCD energy vs time background events are shown together with the CCD energy vs. time total events (for clarity, every ninth background event was plotted, which corresponds approximately to the area-scaled background contribution).
Table 3: Tentative Spitzer IRS line fluxes derived from the SH and LH spectra.
While small-scale variability is visible in the Chandra light curves, no strong flares were detected during the observations, although a significant increase in the count rate in the last 10 ks of the January 2006 observation may be attributed to a moderate flare. The average count rates are 3.14, 2.31, 1.10, 0.39, 1.23, 1.23, and 1.09 ct ks-1 (0.2-4.0 keV, except for Sep. 2002: 0.2-6.0 keV) for the Sep. 2002, Jan. 2005, Jan.-Jul. 2006, and Dec. 2007 observations, respectively. While the effective areas in all pointed observations are similar, the Sep. 2002 effective area was about 40-50% lower (because of the off-axis position of V1118 Ori). Therefore, to compare the above Sep. 2002 count rate with the later Chandra count rates, one needs to multiply by a factor of about 2, i.e., 6.00 ct ks-1. Clearly, assuming only a change in emission measure, the X-ray flux dropped by a factor of 4-6, and even 15 in Feb. 2006, during the 2005 outburst compared to 2002. It is important to emphasize that the serendipitous observation did not show evidence of strong flaring, and V1118 Ori was likely caught in ``quiescence''.Figure 5 presents the X-ray light curves for the XMM-Newton observations. In comparison with the Chandra data, the XMM-Newton data were heavily impacted by background radiation. The (scaled) background contributions were generally similar to - or even higher than - the net source contribution. In particular, during the March 2005 observation, the background completely overwhelmed the EPIC pn data which could not be used. As in the Chandra observations, no obvious large flare was observed during the XMM-Newton exposures, However, in March 2006, V1118 Ori showed a significant increase in X-ray flux in the last 35-40 ks of the observation, probably due to flares or the onset of an active region. This increase is observed in all EPIC cameras, comforting us that this behavior is not caused by an increase in background flux that was improperly subtracted in the EPIC pn data.
The light curves in Figs. 4 and 5 suggest that the spectral fits represent snapshots of the thermal emission measure distribution of V1118 Ori's corona observed serendipitously before the 2005 outburst, and over the course of the optical/infrared outburst.
![\begin{figure}
\par\includegraphics[angle=0,width=8.5cm,clip]{13037fg4.eps}
\end{figure}](/articles/aa/full_html/2010/03/aa13037-09/img82.png)
|
Figure 4:
Light curves for the Chandra observations (0.4-6.0 keV range). The upper panels show the CCD energy of the events as a function
of time after the start of the observations, whereas the lower panels show count rate light curves ( |
| Open with DEXTER | |
4.2 X-ray and optical/near-infrared flux correlations
Figure 6 shows the
long-term light curve of V1118 Ori in the X-rays, optical, and
infrared, from its pre-outburst detection in September 2002,
through its outburst in 2005 and 2006 to the post-outburst phase at the
end of December 2007. We have looked into correlations between the
X-ray and optical and infrared photometry.
Since we obtained few sequential optical and infrared photometry points
every night of our campaign, it was not possible to determine
short-term variations to compare with the X-ray light curves.
Nevertheless, to quantify further the correlation between the optical
and near-infrared flux densities with the X-ray flux, we have
calculated average optical and near-infrared flux densities within ![]() 20 days
of the 6 X-ray observations between January 2005 and February 2006 (we
did not include the March 2006 observation, as this one might have been
contaminated by a flare). The optical and near-infrared flux densities
are well-correlated with the X-ray fluxes measured at Earth (Fig. 7) as indicated by Pearson's correlation coefficients, which are in the range of
20 days
of the 6 X-ray observations between January 2005 and February 2006 (we
did not include the March 2006 observation, as this one might have been
contaminated by a flare). The optical and near-infrared flux densities
are well-correlated with the X-ray fluxes measured at Earth (Fig. 7) as indicated by Pearson's correlation coefficients, which are in the range of
![]() .
The sparsity of X-ray data points does not allow the measurement of any
clear delay between the X-ray and optical/near-infrared flux densities.
We have also performed cross-correlation studies with the optical and
near-infrared data (including only the data points for which we had
simultaneous measurements). The onset of the outburst is unclear in
most light curves (except perhaps in the V band),
but the end of the outburst occurs at a similar epoch for all bands
(around MJD 53860). The shapes of the light curves also differ: the
fluxes vary most at short wavelengths (
.
The sparsity of X-ray data points does not allow the measurement of any
clear delay between the X-ray and optical/near-infrared flux densities.
We have also performed cross-correlation studies with the optical and
near-infrared data (including only the data points for which we had
simultaneous measurements). The onset of the outburst is unclear in
most light curves (except perhaps in the V band),
but the end of the outburst occurs at a similar epoch for all bands
(around MJD 53860). The shapes of the light curves also differ: the
fluxes vary most at short wavelengths (![]() ), while the near-infrared fluxes display shallower variations and they reach their peak some time later (e.g., K peaks around MJD 53470 while V
peaks around MJD 53433). The overall shapes of the light curves
suggest that the mechanism dominating in the optical and near-infrared
bands may be the same (e.g., due to a hot spot), although the different
peak times suggest contamination of another mechanism longward of
), while the near-infrared fluxes display shallower variations and they reach their peak some time later (e.g., K peaks around MJD 53470 while V
peaks around MJD 53433). The overall shapes of the light curves
suggest that the mechanism dominating in the optical and near-infrared
bands may be the same (e.g., due to a hot spot), although the different
peak times suggest contamination of another mechanism longward of ![]() m, probably disk thermal emission (see below).
m, probably disk thermal emission (see below).
![\begin{figure}
\par\includegraphics[angle=0,width=8.5cm,clip]{13037fg5.eps}
\end{figure}](/articles/aa/full_html/2010/03/aa13037-09/img86.png)
|
Figure 5:
Background-subtracted count rate light curves ( |
| Open with DEXTER | |
4.3 Spectral fits
![\begin{figure}
\par\includegraphics[angle=0,width=15.6cm,clip]{13037fg6.eps}
\end{figure}](/articles/aa/full_html/2010/03/aa13037-09/img87.png)
|
Figure 6:
Optical ( |
| Open with DEXTER | |
![\begin{figure}
\par\includegraphics[angle=0,width=16cm,clip]{13037fg7.eps}
\end{figure}](/articles/aa/full_html/2010/03/aa13037-09/img88.png)
|
Figure 7:
Optical and near-infrared flux densities (averaged within |
| Open with DEXTER | |
Table 4: Spectral fits and quantile properties.
Audard et al. (2005b) presented spectral fits of the V1118 Ori data taken through March 2005. Lorenzetti et al. (2006) repeated the analysis for the February 2005 data and added the September 2005 data, noting a decrease in the X-ray flux of V1118 Ori at that time compared to earlier in the outburst. For this paper, we have reprocessed the 2005 data with the latest calibration (see Sect. 3).
We used XSPEC 11 (Arnaud 1996) to fit the Chandra ACIS and the XMM-Newton EPIC spectra for each epoch. For February 2005 and March 2006, we fitted the EPIC
pn, MOS1, and MOS2 spectra simultaneously, while we used the EPIC MOS only for March 2005, and the EPIC pn only for
September 2005 (no MOS data were available). In general, we used a 1-T collisional ionization equilibrium (CIE) model (apec;
Smith et al. 2001) with a photoelectric absorption model, except for the deep March 2006 observation for which the signal-to-noise was
large enough to use a 2-T
CIE model. We have fitted the plasma metallicity in the high
signal-to-noise ratio spectra of February 2005 and used the best-fit
value,
![]() ,
for the other epochs.
The coronal abundances are relative to the solar photospheric standard set of Grevesse & Sauval (1998). The best-fit metallicity is in line with the values measured for Fe
in the coronae of young stars in Orion (Table 3 in Maggio et al. 2007). Since the spectral fits of the February and March 2005 spectra are similar
to those reported in Audard et al. (2005b), we provide in this paper their best-fit values (but adapt the emission measure and luminosities to the adopted
distance of 400 pc). The
September 2005 data are heavily contaminated by the high background level during the observation. Contrary to Lorenzetti et al. (2006),
we preferred not to provide spectral fits for this observation;
however, we provide estimates for the observed X-ray flux at Earth
and absorption-corrected X-ray luminosity, based on the previous
February 2005 and the subsequent March 2006 XMM-Newton observations.
The results of our spectral fits are given in Table 4.
,
for the other epochs.
The coronal abundances are relative to the solar photospheric standard set of Grevesse & Sauval (1998). The best-fit metallicity is in line with the values measured for Fe
in the coronae of young stars in Orion (Table 3 in Maggio et al. 2007). Since the spectral fits of the February and March 2005 spectra are similar
to those reported in Audard et al. (2005b), we provide in this paper their best-fit values (but adapt the emission measure and luminosities to the adopted
distance of 400 pc). The
September 2005 data are heavily contaminated by the high background level during the observation. Contrary to Lorenzetti et al. (2006),
we preferred not to provide spectral fits for this observation;
however, we provide estimates for the observed X-ray flux at Earth
and absorption-corrected X-ray luminosity, based on the previous
February 2005 and the subsequent March 2006 XMM-Newton observations.
The results of our spectral fits are given in Table 4.
4.4 Quantiles
![\begin{figure}
\begin{tabular}{ccc}
&\includegraphics[bb=85 360 550 700,angle=0,...
...50 700,angle=0,width=0.30\textwidth]{13037fg8k.eps} &
\end{tabular}
\end{figure}](/articles/aa/full_html/2010/03/aa13037-09/img214.png)
|
Figure 8:
Color-color diagrams based on the |
| Open with DEXTER | |
In view of the low observed count rates with XMM-Newton and Chandra during the outburst, we have explored an alternative method to determine
spectral properties for low-count X-ray spectra and have used the quantile analysis presented by Hong et al. (2004)![]() . This type of analysis was, in particular,
successfully used by Grosso et al. (2005) for their analysis of the spectral properties of V1647 Ori (see also Skinner et al. 2009b).
In brief, this method makes
direct use of the event energy values, and determines spectral
properties based on quantiles
of the total number of counts (e.g., median 50% quantile, and
quartiles, 25% and 75%), instead of spectral energy bins. Such
quantiles are then used
as indicators for the X-ray color of the source. In particular, we make
use of a diagram with the
. This type of analysis was, in particular,
successfully used by Grosso et al. (2005) for their analysis of the spectral properties of V1647 Ori (see also Skinner et al. 2009b).
In brief, this method makes
direct use of the event energy values, and determines spectral
properties based on quantiles
of the total number of counts (e.g., median 50% quantile, and
quartiles, 25% and 75%), instead of spectral energy bins. Such
quantiles are then used
as indicators for the X-ray color of the source. In particular, we make
use of a diagram with the
![]() index in the x-axis, where
m corresponds to the median quantile Q50, and the index
index in the x-axis, where
m corresponds to the median quantile Q50, and the index
![]() in the y-axis. Hong et al. (2004) define
the
in the y-axis. Hong et al. (2004) define
the ![]() % quantile,
% quantile, ![]() ,
as
,
as
where
The total (source + background) and background extraction regions used
in the quantile analysis were the same as those used for the spectral
fits.
The energy bands used to determine the extraction of events are
reported in Table 4 together with the 25%, 50%, and 75% quantiles,
the ![]() energy, and the x and y indices. We also provide estimated values for the hydrogen column density and plasma temperature
derived from the x and y indices. Finally, Fig. 8 shows the color-color diagrams for all observations.
energy, and the x and y indices. We also provide estimated values for the hydrogen column density and plasma temperature
derived from the x and y indices. Finally, Fig. 8 shows the color-color diagrams for all observations.
![\begin{figure}
\par\includegraphics[angle=0,width=17cm,clip]{13037fg9.eps}
\end{figure}](/articles/aa/full_html/2010/03/aa13037-09/img223.png)
|
Figure 9:
Spitzer IRS SL spectra of V1118 Ori for the three epochs (left panel). The dotted line shows the fit to the underlying continuum in the [6-8, 13-14.5] |
| Open with DEXTER | |
There exists a certain degree of degeneracy in the x and y indices (e.g., Grosso et al. 2005): indeed, the same color indices can sometimes be described by
different combinations of column density ![]() and plasma temperature T. However, these degeneracies are limited to certain
sets of T and
and plasma temperature T. However, these degeneracies are limited to certain
sets of T and ![]() :
for example, in the September 2002 observation, color indices of x = -0.8 and y=1.8 can represent
any plasma temperature from about
:
for example, in the September 2002 observation, color indices of x = -0.8 and y=1.8 can represent
any plasma temperature from about
![]() to about
to about
![]() keV and
keV and ![]() can range from 0 to
can range from 0 to
![]() cm-2.
At higher temperatures, the degeneracy breaks down, and the observed x/y values of V1118 Ori can be better constrained to
cm-2.
At higher temperatures, the degeneracy breaks down, and the observed x/y values of V1118 Ori can be better constrained to
![]() keV
and
keV
and
![]() cm-2. The degeneracies differ slightly depending on the response matrix generated in the observation.
For example, with our Chandra monitoring data, the degeneracies occur around
(x,y)=(-0.7,1.85) and at
(-0.4,1.65). The first set again
indicate a degeneracy for kT < 0.8 keV and
cm-2. The degeneracies differ slightly depending on the response matrix generated in the observation.
For example, with our Chandra monitoring data, the degeneracies occur around
(x,y)=(-0.7,1.85) and at
(-0.4,1.65). The first set again
indicate a degeneracy for kT < 0.8 keV and
![]() cm-2. The second set shows that the plasma properties cannot be disentangled
for temperatures between 0.8 and 1.5 keV for a column density in the range
cm-2. The second set shows that the plasma properties cannot be disentangled
for temperatures between 0.8 and 1.5 keV for a column density in the range
![]() cm-2.
cm-2.
In contrast to the temperatures obtained from spectral fits, the
temperature derived from the color indices are more stable and vary
little from 10-20 MK, except in February 2006 (
![]() MK) and March 2006 (
MK) and March 2006 (
![]() MK).
In the case of March 2006, the quantile temperature is in fact close to
the second temperature component (which also has the higher emission
measure) obtained with the 2-T
fit. In the case of February 2006, the low number of counts did not
allow a good constraint on the temperature. There also appears to be
some kind of degeneracy: while the spectral fit gives a low plasma
temperature and
``high'' column density, the quantile analysis gives the inverse. It
remains unclear which result is more robust, but the quantile diagram
does not show
evidence of a degeneracy. It is then likely that the spectral fit
reached a local minimum at a low temperature and could not find a
combination of high plasma temperature and low
MK).
In the case of March 2006, the quantile temperature is in fact close to
the second temperature component (which also has the higher emission
measure) obtained with the 2-T
fit. In the case of February 2006, the low number of counts did not
allow a good constraint on the temperature. There also appears to be
some kind of degeneracy: while the spectral fit gives a low plasma
temperature and
``high'' column density, the quantile analysis gives the inverse. It
remains unclear which result is more robust, but the quantile diagram
does not show
evidence of a degeneracy. It is then likely that the spectral fit
reached a local minimum at a low temperature and could not find a
combination of high plasma temperature and low ![]() .
The February 2005 quantile analysis and spectral fit both confirm that the temperature
of the coronal plasma was cooler than in September 2002 and March 2005, as initially reported in Audard et al. (2005b).
The error bars of the color indices in January 2005 do not allow us to constrain the temperature of the coronal plasma, while
the spectral fit with XSPEC indicates no evidence of cool plasma at the start of the outburst.
.
The February 2005 quantile analysis and spectral fit both confirm that the temperature
of the coronal plasma was cooler than in September 2002 and March 2005, as initially reported in Audard et al. (2005b).
The error bars of the color indices in January 2005 do not allow us to constrain the temperature of the coronal plasma, while
the spectral fit with XSPEC indicates no evidence of cool plasma at the start of the outburst.
4.5 X-ray parameter correlations
We have attempted to search for correlations between X-ray properties (![]() ,
T,
,
T,
![]() ,
Txy,
,
Txy, ![]() ,
,
![]() ,
,
![]() ), but found generally little or no correlation based on the Pearson correlation coefficient,
), but found generally little or no correlation based on the Pearson correlation coefficient, ![]() (absolute values typically below 0.5). One exception was a mild correlation between the average median photon energy,
(absolute values typically below 0.5). One exception was a mild correlation between the average median photon energy, ![]() ,
and the absorbing column density derived from the quantile analysis,
,
and the absorbing column density derived from the quantile analysis,
![]() ,
which showed
,
which showed
![]() .
This is expected, as larger column densities will absorb low-energy
photons. However, we emphasize that we have only used the estimated
.
This is expected, as larger column densities will absorb low-energy
photons. However, we emphasize that we have only used the estimated
![]() based on the location of the xy
values in the quantile color-color diagrams, and that we have not taken
into account the (relatively) large range of column densities covered
by the quantile errors (typically,
based on the location of the xy
values in the quantile color-color diagrams, and that we have not taken
into account the (relatively) large range of column densities covered
by the quantile errors (typically,
![]() cm-2,
similar to values derived from spectral fitting). Another exception was
a strong correlation between the emission measure and the X-ray
luminosity, with
cm-2,
similar to values derived from spectral fitting). Another exception was
a strong correlation between the emission measure and the X-ray
luminosity, with
![]() .
Together with the above lack of correlation between the plasma temperature and
.
Together with the above lack of correlation between the plasma temperature and ![]() ,
and
,
and ![]() and
and ![]() ,
this is a strong indication that the X-ray variability observed during
the outburst of V1118 Ori is only caused by the amount of material
in the corona. It is, thus, probably related to the amount of mass
falling from the disk into the stellar magnetosphere, i.e., to the mass
accretion rate.
,
this is a strong indication that the X-ray variability observed during
the outburst of V1118 Ori is only caused by the amount of material
in the corona. It is, thus, probably related to the amount of mass
falling from the disk into the stellar magnetosphere, i.e., to the mass
accretion rate.
5 Optical and infrared analysis
![\begin{figure}
\par\includegraphics[angle=0,width=17cm,clip]{13037fg10.eps}
\end{figure}](/articles/aa/full_html/2010/03/aa13037-09/img238.png)
|
Figure 10: Magnitude versus color indices for the different time intervals (red: #1, lime: #2, violet: #3, blue: #4, green: #5, black: #6). |
| Open with DEXTER | |
![\begin{figure}
\par\includegraphics[angle=0,width=17cm,clip]{13037fg11.eps}
\end{figure}](/articles/aa/full_html/2010/03/aa13037-09/img239.png)
|
Figure 11: Color index diagrams for the same time intervals as in Fig. 10. An AV=1 mag vector is added using the reddening law of Rieke et al. (1985). The loci of unreddened main sequence and giant stars (Bessell & Brett 1988) are shown for the near-infrared panels as solid and dotted curves, respectively. Finally the loci of classical T Tauri stars (Meyer et al. 1997) are shown as a dashed line in the (J-H) vs. (H-K) diagram. |
| Open with DEXTER | |
5.1 Silicate feature
Figure 9 shows the silicate feature obtained at the three different epochs and its normalized version (
![]() ). We have used a linear fit to the SL spectra in the
). We have used a linear fit to the SL spectra in the
![]() plane, using only wavelength ranges of 6.0-8.0
plane, using only wavelength ranges of 6.0-8.0 ![]() m and 13.0-13.5
m and 13.0-13.5 ![]() m to determine the underlying continuum flux level,
m to determine the underlying continuum flux level, ![]() .
The shapes of the silicate feature in the three observations are
compatible with one another, but the Mar. 2005 silicate feature
appears to be brighter than the Feb. 2005 or post-outburst
(Nov. 2008) normalized fluxes, i.e., more flux is coming from the
less optically thick disk upper layers, likely as a result of hotter
temperature of such layers. The heating of the upper layers is probably
caused by the strong irradiation, e.g., by a hot spot (see below). The
ratio
S11.3/S9.8 is
0.95-1.0, suggesting grain growth, and the ratio
.
The shapes of the silicate feature in the three observations are
compatible with one another, but the Mar. 2005 silicate feature
appears to be brighter than the Feb. 2005 or post-outburst
(Nov. 2008) normalized fluxes, i.e., more flux is coming from the
less optically thick disk upper layers, likely as a result of hotter
temperature of such layers. The heating of the upper layers is probably
caused by the strong irradiation, e.g., by a hot spot (see below). The
ratio
S11.3/S9.8 is
0.95-1.0, suggesting grain growth, and the ratio
![]() is
0.74-0.79, evidence of a flat silicate feature.
is
0.74-0.79, evidence of a flat silicate feature.
In the outburst spectrum of the EXor prototype EX Lup, Ábrahám et al. (2009)
observed a silicate feature with a crystalline peak, in contrast to the
pre-outburst silicate feature which was similar to the interstellar
medium spectrum dominated by amorphous grains. They concluded that
thermal annealing in the surface layer of the proto-planetary disk was
the mechanism for this change in spectral features. Unfortunately, we
have no pre-outburst spectrum of V1118 Ori to compare with the
outburst spectra, only a spectrum taken 2 years after the end
of the outburst and 3.5 years after our last outburst spectrum in
March 2005. If the pre-outburst spectrum was indeed typical of
amorphous silicates, it means that the time scale for disappearance of
the crystalline features must be longer than 2 years. Ábrahám et al. (2009)
proposed that similar crystallization must have occurred during the
previous 1955-1956 outburst of EX Lup, and since the 2005
quiescent spectrum did not show crystalline features, the removal time
scale must have been less than 50 years. On the other hand, in
V1118 Ori, it is also possible that the unchanging silicate
feature in the three spectra is typical of the quiescent silicate
feature in the young star, perhaps an indication that the disk is more
evolved. In any case, M-type young stars typically show flat silicate
features (e.g., Kessler-Silacci et al. 2006,2005).
Finally, the IRS data do not show strong evidence of the forsterite crystalline feature at 16 ![]() m, in contrast to the feature observed in EX Lup (Ábrahám et al. 2009). This is consistent with the absences of a sharp peak
at 10
m, in contrast to the feature observed in EX Lup (Ábrahám et al. 2009). This is consistent with the absences of a sharp peak
at 10 ![]() m and of a shoulder at 11.3
m and of a shoulder at 11.3 ![]() m.
m.
5.2 Color indices
![\begin{figure}
\par\includegraphics[angle=0,width=17cm,clip]{13037fg12.eps}
\end{figure}](/articles/aa/full_html/2010/03/aa13037-09/img244.png)
|
Figure 12: Compilation of the optical and infrared photometry taken before, during, and just after the outburst (see text and caption of Fig. 10 for details about colors). The IRS SL and LL spectra and a reddened (AV = 1.5 mag) stellar atmosphere model are also shown. |
| Open with DEXTER | |
We have calculated color indices from our optical and near-infrared
data, and looked into their evolution during the outburst. Time
intervals
were defined in the pre-outburst epoch (1;
![]() ), initial phase of rise (2;
), initial phase of rise (2;
![]() ), second phase of rise
(3;
), second phase of rise
(3;
![]() ), plateau (4;
), plateau (4;
![]() ), decay (5;
), decay (5;
![]() ), and post-outburst (6;
), and post-outburst (6;
![]() ).
).
Figure 10 shows the color-magnitude diagrams, whereas Fig. 11 shows the color-color diagrams, together with an AV = 1 mag reddening vector using the reddening law of Rieke et al. (1985), the loci of the unreddened main sequence and giant stars (Bessell & Brett 1988), and the loci of classical T Tauri stars (Meyer et al. 1997). Compared to the pre-outburst color indices of V1118 Ori, the optical color indices are bluer in the early phases of the outburst (except for B-V which shows a peculiar pattern, probably because the B magnitude is very sensitive to the evolution of hotspot emission), and gradually return to the pre-outburst values in the decaying phase of the outburst. In the near infrared, an apparent blueing occurs as well in the initial phases of the outburst with a return to ``normal'' colors in the decay phase. The above results are consistent with the hypothesis of Lorenzetti et al. (2007) that blueing must have occurred because of a hotter temperature component during the initial phase of the outburst (their data were taken only in the decaying phase and showed reddening). The variations in the color-color diagrams also show no trend related to extinction variations, in agreement with the suggestion of Lorenzetti et al. (2007) and Lorenzetti et al. (2009). There is, however, a larger scatter in the infrared color-color diagrams, especially in J-H versus H-K. Since the stellar photospheric emission does not vary during the outburst, we need to understand the variations in color indices and magnitudes during the outburst in the context of a star + disk + hot spot model. Lorenzetti et al. (2007) suggested that the polarization found in the I band of the V1118 Ori outburst was intrinsic and that it was probably caused by the spotted and magnetized stellar photosphere. As we will show below, the photometric changes can indeed be explained by changes in the fluxes of the disk thermal emission and from a hot spot as the rate of mass falling from the disk onto the stellar photosphere increases during the outburst. We note also that during the outburst, any increase in hotspot emission will further increase the irradiation of the disk. The following section aims to understand the multi-wavelength photometric and spectroscopic behavior observed during the outburst of V1118 Ori by comparing the data with disk models of young stars.
5.3 Spectral energy distribution
Figure 12 shows the
observed SED for V1118 Ori. We have shown as small colored dots
the data for the different phases (as defined at the beginning of
Sect. 5.2 and in the caption of Fig. 10),
and the pre- and post-outburst photometry as red crosses and black
stars, respectively. The IRS low-resolution spectra are also shown for
the outburst phases (violet) and post-outburst phase (black). For
clarity, we do not show the high-resolution spectra. To emphasize the
expected stellar photospheric contribution, we have added a stellar
atmosphere model from the PHOENIX database![]() (e.g., Hauschildt et al. 1999) for a star with
(e.g., Hauschildt et al. 1999) for a star with
![]() K,
K,
![]() ,
and Z=0 (STARdusty2000 models), and reddened it with AV =1.5 mag and the reddening law of Fitzpatrick (1999). Indeed, the hydrogen column density derived from X-rays is
,
and Z=0 (STARdusty2000 models), and reddened it with AV =1.5 mag and the reddening law of Fitzpatrick (1999). Indeed, the hydrogen column density derived from X-rays is
![]() cm-2 in 2002, and does not change much during the outburst, generally staying in the range
cm-2 in 2002, and does not change much during the outburst, generally staying in the range
![]() cm-2, which corresponds to AV in the range
cm-2, which corresponds to AV in the range
![]() mag for RV = 3.1 (Galactic value) or
mag for RV = 3.1 (Galactic value) or
![]() mag for RV = 5.5 (dusty environment).
mag for RV = 5.5 (dusty environment).
We calculated the median magnitude differences from 0.44 to 8.0 ![]() m (we have no U
photometry during the outburst), relative to the median magnitude in
quiescence (we used both pre-outburst and post-outburst magnitude;
Fig. 13). There is clear evidence that the optical emission brightened much more than the infrared emission, with a peak in the V band.
We also observe that the
m (we have no U
photometry during the outburst), relative to the median magnitude in
quiescence (we used both pre-outburst and post-outburst magnitude;
Fig. 13). There is clear evidence that the optical emission brightened much more than the infrared emission, with a peak in the V band.
We also observe that the ![]() bands decayed faster than the JHK
bands, probably indicating a mixture of different emission components
in the near-infrared bands (e.g., disk and hot spot). At long
wavelengths (
bands decayed faster than the JHK
bands, probably indicating a mixture of different emission components
in the near-infrared bands (e.g., disk and hot spot). At long
wavelengths (
![]()
![]() m), the increase in flux was similar at all wavelengths.
m), the increase in flux was similar at all wavelengths.
To quantify better the star+disk properties of V1118 Ori
before and during its outburst, we have then used the code described in
Whitney et al. (2003b,a), version 20090224![]() .
We have run the code by fixing certain parameters and leaving others
free to vary. The models did not include an envelope, but only an
ambient medium with density of 10-22 g cm-3.
The contribution of this medium is generally negligible. The exclusion
of the envelope is motivated by its contributing mostly at long
wavelengths where we have no data. The IRS data also do not show strong
evidence of an envelope (that could not be attributed to unreliable
background subtraction).
.
We have run the code by fixing certain parameters and leaving others
free to vary. The models did not include an envelope, but only an
ambient medium with density of 10-22 g cm-3.
The contribution of this medium is generally negligible. The exclusion
of the envelope is motivated by its contributing mostly at long
wavelengths where we have no data. The IRS data also do not show strong
evidence of an envelope (that could not be attributed to unreliable
background subtraction).
The fixed parameters were the stellar radius (
![]() ), mass (
), mass (
![]() ), and effective temperature (
), and effective temperature (
![]() K; see Sect. 2; we used as input a lower spectral resolution version of the same PHOENIX stellar atmosphere model as above), the disk
mass (
K; see Sect. 2; we used as input a lower spectral resolution version of the same PHOENIX stellar atmosphere model as above), the disk
mass (
![]() )
and outer radius (100 AU), the disk flaring power (
)
and outer radius (100 AU), the disk flaring power (![]()
![]() ,
,
![]() ), the disk scale height (
), the disk scale height (
![]() at
at ![]() ;
the height is thus 2.6 AU at 100 AU), and the disk density profile (
;
the height is thus 2.6 AU at 100 AU), and the disk density profile (![]()
![]() ,
,
![]() ). For the dust opacity, we used a model of grains as large as 1 mm for the denser regions of the disk (see Wood et al. 2002 for HH 30), but used an interstellar medium grain model for the less dense regions of the disk (i.e., below a threshold set at
). For the dust opacity, we used a model of grains as large as 1 mm for the denser regions of the disk (see Wood et al. 2002 for HH 30), but used an interstellar medium grain model for the less dense regions of the disk (i.e., below a threshold set at
![]() g cm-3). The disk mass and outer radius were not constrained by our optical and infrared data
g cm-3). The disk mass and outer radius were not constrained by our optical and infrared data![]() .
Changes in their values would have little impact on the models at optical-infrared wavelengths.
.
Changes in their values would have little impact on the models at optical-infrared wavelengths.
We have left the mass accretion rate and inner disk radius (in units of the dust destruction radius,
![]() )
free to vary. The model also includes the possibility for material to
fall from the disk onto a hot spot by following the magnetic field
lines. We have kept the truncation radius to 5 AU, but left the
fractional area,
)
free to vary. The model also includes the possibility for material to
fall from the disk onto a hot spot by following the magnetic field
lines. We have kept the truncation radius to 5 AU, but left the
fractional area, ![]() (ratio of the shock area to the star area; see Calvet & Gullbring 1998), free to vary. Finally, the code samples the model at 10 different inclination angles from
(ratio of the shock area to the star area; see Calvet & Gullbring 1998), free to vary. Finally, the code samples the model at 10 different inclination angles from
![]() to 0.95 every 0.10, i.e., from
to 0.95 every 0.10, i.e., from
![]() to
to
![]() .
Thus, we have four different parameters that can vary (
.
Thus, we have four different parameters that can vary (
![]() ]).
]).
The choice of ![]() and
and ![]() is typical of those observed in T Tauri stars, and correspond to values that seem to fit the V1118 Ori data.
The power law indices are related in the sense that if the disk surface density is
is typical of those observed in T Tauri stars, and correspond to values that seem to fit the V1118 Ori data.
The power law indices are related in the sense that if the disk surface density is
![]() ,
then
,
then
![]() .
A value of
.
A value of
![]() is close to the theoretical values for irradiated and
is close to the theoretical values for irradiated and ![]() disks (
disks (
![]() ), and, with
), and, with
![]() ,
,
![]() ,
i.e., typical for a steady optically thick disk.
A fit to the IRAC and MIPS fluxes in quiescence gives
,
i.e., typical for a steady optically thick disk.
A fit to the IRAC and MIPS fluxes in quiescence gives
![]() ,
i.e., consistent with the commonly observed
,
i.e., consistent with the commonly observed
![]() for irradiated disks. Assuming that the temperature follows a power law
for irradiated disks. Assuming that the temperature follows a power law
![]() ,
and if
,
and if
![]() ,
both indices are related by s=2/q-4. Thus, we have q=0.6, i.e.,
,
both indices are related by s=2/q-4. Thus, we have q=0.6, i.e.,
![]() .
.
![\begin{figure}
\par\includegraphics[angle=0,width=8.5cm,clip]{13037fg13.eps}
\end{figure}](/articles/aa/full_html/2010/03/aa13037-09/img287.png)
|
Figure 13: Median magnitude difference relative to quiescence as a function of wavelength. The same time intervals as in Fig. 10 are used for the color coding (lime filled circles: #2, violet triangles: #3, blue diamonds: #4, green stars: #5). In the initial phase of the outburst, a strong optical component developed, with a peak in the V band. |
| Open with DEXTER | |
There is no pre-outburst IRS spectrum available to determine the shape
of the silicate feature before the outburst (emission or absorption).
However, we have used the post-outburst
IRS spectra, scaled by a factor of 0.7 to match the IRAC photometry
(see Fig. 9).
For the photometry, we have used the median of the pre-outburst
(interval #1) and post-outburst (interval #6) photometry. For the
outburst data, we have used the plateau (#4) peak photometric data with
the second epoch outburst IRS SL spectrum to characterize the SED at
``peak''. The IRS spectrum already matches well the 8 ![]() m flux without correction and shows the silicate feature in emission.
m flux without correction and shows the silicate feature in emission.
We ran the code with 5 000 000 ``photons'' or energy packets
for each model. This results in SED models with reasonably good
signal-to-noise ratios over the wavelength range covered by our data.
The models were then reddened with AV = 1.5 mag (assuming ISM opacities). For each realization we have calculated a reduced
![]() value
value
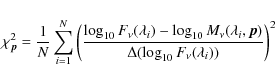
|
(1) |
where
![\begin{figure}
\par\includegraphics[angle=0,width=7.5cm,clip]{13037fg14.eps}
\end{figure}](/articles/aa/full_html/2010/03/aa13037-09/img296.png)
|
Figure 14:
Probability distribution of the parameters (
|
| Open with DEXTER | |
![\begin{figure}
\par\mbox{\includegraphics[angle=0,width=8.5cm,clip]{13037fg15a.e...
...{4mm}
\includegraphics[angle=0,width=8.5cm,clip]{13037fg15b.eps} }\end{figure}](/articles/aa/full_html/2010/03/aa13037-09/img297.png)
|
Figure 15: The best-fit models to the ``quiescent'' SED (left) and to the peak outburst SED (right). The direct stellar contribution (including emission by the hot spot) is shown as a dotted line (the AV = 1.5 mag reddened stellar atmosphere model is shown as a dash-dotted line), the thermal disk spectrum as a dashed line. |
| Open with DEXTER | |
Figure 14 shows the normalized model probabilities (calculated as
![]() )
for the quiescent case (solid), and for the outburst case (dotted). The
distributions of inclination angles are slightly different for the
quiescent and peak of outburst cases, but the distributions overlap in
the range
)
for the quiescent case (solid), and for the outburst case (dotted). The
distributions of inclination angles are slightly different for the
quiescent and peak of outburst cases, but the distributions overlap in
the range
![]() ,
with a maximum probability (obtained by multiplying the probability distributions) at
,
with a maximum probability (obtained by multiplying the probability distributions) at
![]() ,
i.e.,
,
i.e.,
![]() .
The mass accretion rate distributions are sharply peaked: the most probable values of
.
The mass accretion rate distributions are sharply peaked: the most probable values of ![]() are 10-6.6
are 10-6.6 ![]() yr-1 and 10-6.0
yr-1 and 10-6.0 ![]() yr-1
in quiescence and and at the peak of the outburst, respectively,
indicating an increase by a factor of 4. The coverage factor seems to
be small (
yr-1
in quiescence and and at the peak of the outburst, respectively,
indicating an increase by a factor of 4. The coverage factor seems to
be small (
![]() )
outside the outburst while the simulations indicate high values (
)
outside the outburst while the simulations indicate high values (
![]() )
at the peak of the outburst. This parameter is essentially constrained
by the optical and near-infrared photometry. The minimum disk radius
has likely values of
)
at the peak of the outburst. This parameter is essentially constrained
by the optical and near-infrared photometry. The minimum disk radius
has likely values of
![]() ,
with the most probable value at
,
with the most probable value at
![]() ,
whereas the values at the peak of the outburst are lower and most
likely equal to the sublimation radius.
The best models give sublimation radii of about 0.10 AU in
quiescence and 0.20 AU at the peak of the outburst, implying inner
disk radii of 0.25-0.6 AU (most probable value of
0.4 AU) and 0.2 AU, respectively. This result suggests that
the inner disk radius (determined from the infrared data arising from
dust emission) probably diminished during the outburst, although we
emphasize that quiescent values of 0.2 AU are possible, though
less probable from our SED modeling.
,
whereas the values at the peak of the outburst are lower and most
likely equal to the sublimation radius.
The best models give sublimation radii of about 0.10 AU in
quiescence and 0.20 AU at the peak of the outburst, implying inner
disk radii of 0.25-0.6 AU (most probable value of
0.4 AU) and 0.2 AU, respectively. This result suggests that
the inner disk radius (determined from the infrared data arising from
dust emission) probably diminished during the outburst, although we
emphasize that quiescent values of 0.2 AU are possible, though
less probable from our SED modeling.
Figure 15 shows the best fits to the ``quiescent'' SED and to the peak of outburst SED, respectively.
The total (bolometric) luminosity (including all components) varied from about
![]() in quiescence (with a contribution of the stellar luminosity,
in quiescence (with a contribution of the stellar luminosity,
![]() ,
of
,
of
![]() and of the thermal disk luminosity of
and of the thermal disk luminosity of
![]() )
to
)
to ![]()
![]() at the peak of the outburst
at the peak of the outburst![]() (the thermal disk luminosity increasing to about
(the thermal disk luminosity increasing to about
![]() ).
).
Thus the bolometric luminosity is dominated by the stellar direct emission, i.e., the stellar photospheric emission and the hotspot emission (the latter in particular during the outburst). We note, however, that we would need data at shorter wavelengths than B to constrain better the hotspot emission during the outburst.
6 Discussion
Our multi-wavelength campaign has allowed us to obtain several pieces of information on the outburst of V1118 Ori, as seen in the optical and infrared, and in the X-rays. Overall, the evolution of the X-ray flux during the outburst followed the evolution of the optical and near-infrared fluxes. The sampling of the X-ray observation does not allow us to determine whether the increase in X-ray flux in March 2006 is related to the short-term increase in optical/infrared flux observed about 45 days earlier. The thermal properties of V1118 Ori showed evidence of a plasma with temperature of a few MK to a few tens of MK. In our initial paper, we reported a change in the spectral properties from a predominantly hot (20 MK) plasma before the outburst (and possibly at the very beginning) to a lower temperature (8 MK) in February 2005 (Audard et al. 2005b). Our reanalysis confirms this finding and a gradual return to higher values in the later phases of the outburst. However, the low signal-to-noise ratio of the X-ray spectra taken during our monitoring campaign makes it difficult to accurately constrain the plasma temperature (in contrast, the February and March 2005 observations had a much better signal-to-noise ratio). The alternative quantile analysis showed evidence of less variation in the plasma temperature. Nevertheless, it is consistent with the detected change in temperature. While V1647 Ori showed a strong increase in X-ray flux during the outburst (Grosso et al. 2005; Kastner et al. 2004), V1118 Ori showed only a moderate X-ray flux increase, and possibly an eventual decrease in flux after the outburst, if we assume that the 2002 flux level was representative of the pre-outburst X-ray flux. In this case, the impact of the mass infall onto the stellar magnetosphere must have significantly affected the latter, leaving it in a lower X-ray flux state. It is, however, also possible that the 2002 flux was observed by chance in a high quiescent state, and that the 2007 X-ray flux is closer to the pre-outburst flux level. In any case, the changes in the X-ray fluxes during the outburst, and possibly the temperature changes all indicate a strong interplay between the material falling from the disk as a consequence of the increase in mass accretion rate and the stellar magnetosphere.
From the optical and infrared SED data and Monte-Carlo models using the code of Whitney et al. (2003b,a), there is clear evidence that the thermal disk emission dominates in the mid-infrared in quiescence and during the outburst, while emission from a hotspot and reprocessed emission dominates the outburst SED in the optical and near-infrared, and contributes to some extent before the outburst. However, this conclusion depends on our choice of using disk models that stop at the sublimation radius, i.e., there is no disk contribution at smaller radii, where the gas is optically thin. This could contribute to the near-infrared fluxes, but it should not contribute significantly to the optical fluxes. Therefore, we believe that the addition of hotspot emission is necessary to fit the blue side of the V1118 Ori SED, during the outburst and probably before the outburst.
The increase in mass accretion rate during the outburst leads
to the change in inner disk radius which moves closer to the star's
surface. Such an effect could
explain the changes in the X-ray emission (see above). From our
simulations, we have determined that the mass accretion rate increased
during the
outburst: consequently, the dust sublimation radius increased from ![]()
![]() AU to
AU to ![]()
![]() AU,
whereas
the inner disk radius (based on the infrared dust emission) moved from
0.4 AU in quiescence to 0.2 AU in outburst (although the
optically thin gas
disk could be closer to the star), and the inner disk radius is
consistent with the dust sublimation radius at the peak of the
outburst.
We emphasize that such estimates of the inner disk radius are biased by
our use of dust thermal emission for the disk. The optically thin gas
disk is
difficult to detect and we would require gas tracers, e.g., H2
or CO bandheads to properly determine the inner extent of the disk. In
any case, the strong increase in fractional area of the hotspot
suggests that large amounts of matter fell from the disk onto the star
during
the outburst, incidentally interacting with the stellar magnetosphere.
AU,
whereas
the inner disk radius (based on the infrared dust emission) moved from
0.4 AU in quiescence to 0.2 AU in outburst (although the
optically thin gas
disk could be closer to the star), and the inner disk radius is
consistent with the dust sublimation radius at the peak of the
outburst.
We emphasize that such estimates of the inner disk radius are biased by
our use of dust thermal emission for the disk. The optically thin gas
disk is
difficult to detect and we would require gas tracers, e.g., H2
or CO bandheads to properly determine the inner extent of the disk. In
any case, the strong increase in fractional area of the hotspot
suggests that large amounts of matter fell from the disk onto the star
during
the outburst, incidentally interacting with the stellar magnetosphere.
Using their near-infrared spectrum taken in September 2005 (i.e., about at the end of the plateau phase) and a wind loss model, Lorenzetti et al. (2006)
derived a mass loss rate![]() of about
of about
![]()
![]() yr-1 from H I. Furthermore, little or no absorption was reported (AV < 2), with no evidence of variations during the outburst. They also derived a mass loss rate of
yr-1 from H I. Furthermore, little or no absorption was reported (AV < 2), with no evidence of variations during the outburst. They also derived a mass loss rate of
![]()
![]() yr-1 from the CO overtone emission, indicating an ionization fraction of 0.1-0.2.
Furthermore, Lorenzetti et al. (2007)
observed V1118 Ori in September 2006, i.e., well after the
outburst, and detected no emission line, while the 2.3
yr-1 from the CO overtone emission, indicating an ionization fraction of 0.1-0.2.
Furthermore, Lorenzetti et al. (2007)
observed V1118 Ori in September 2006, i.e., well after the
outburst, and detected no emission line, while the 2.3 ![]() m CO band was seen in absorption. Herbig (2008) reported evidence of wind emission in H
m CO band was seen in absorption. Herbig (2008) reported evidence of wind emission in H![]() (P Cyg profile) in November 2005, in contrast with the more
symmetric profile observed after the outburst in December 2006. It
is, therefore, likely that high wind loss rates occurred transiently
because of the instability in the disk. The disk emission may provide a
better fit to CO bands in young stars than mass loss emission in
general (e.g., Chandler et al. 1995),
but this may not be the case during the outburst of a young star such
as V1118 Ori: our SED models including emission due to matter
falling from the accretion disk onto the stellar photosphere clearly
show that the outburst SED at wavelengths below 3
(P Cyg profile) in November 2005, in contrast with the more
symmetric profile observed after the outburst in December 2006. It
is, therefore, likely that high wind loss rates occurred transiently
because of the instability in the disk. The disk emission may provide a
better fit to CO bands in young stars than mass loss emission in
general (e.g., Chandler et al. 1995),
but this may not be the case during the outburst of a young star such
as V1118 Ori: our SED models including emission due to matter
falling from the accretion disk onto the stellar photosphere clearly
show that the outburst SED at wavelengths below 3 ![]() m
is dominated by the hotspot emission, not by disk thermal emission
(while it remains negligible outside the outburst and stellar
photospheric emission dominates). Wind loss emission may thus be
present in the optical and near-infrared.
m
is dominated by the hotspot emission, not by disk thermal emission
(while it remains negligible outside the outburst and stellar
photospheric emission dominates). Wind loss emission may thus be
present in the optical and near-infrared.
We can compare the mass loss rates derived for the neutral gas by Lorenzetti et al. (2006) to our derived mass accretion rates: the SED modeling suggests a variation in the mass accretion rate from about
![]()
![]() yr-1 to
yr-1 to
![]()
![]() yr-1, i.e., these mass accretion rates are comparable to the mass loss rates determined by Lorenzetti et al. (2006).
This is somewhat surprising, since mass outflow rates are expected to be about ten times lower than mass accretion rates (Hartigan et al. 1995, with revised mass accretion rates, see Edwards 2009; Gullbring et al. 1998).
Our mass accretion rate in quiescence is larger by about a factor of 10
compared to those derived for classical T Tau stars (
yr-1, i.e., these mass accretion rates are comparable to the mass loss rates determined by Lorenzetti et al. (2006).
This is somewhat surprising, since mass outflow rates are expected to be about ten times lower than mass accretion rates (Hartigan et al. 1995, with revised mass accretion rates, see Edwards 2009; Gullbring et al. 1998).
Our mass accretion rate in quiescence is larger by about a factor of 10
compared to those derived for classical T Tau stars (![]() 10-8
10-8 ![]() yr-1; e.g., Gullbring et al. 1998), and lower by a factor of 10 than the rates derived for embedded Class I stars (
yr-1; e.g., Gullbring et al. 1998), and lower by a factor of 10 than the rates derived for embedded Class I stars (![]()
![]()
![]() yr-1; Kenyon et al. 1993).
Therefore, our derived mass accretion rates are consistent with placing
V1118 Ori in a category between Class I and CTTS stars. We
note also that the IRAC color indices of V1118 Ori in quiescence
are [3.6]-[4.5
]=0.65-0.75 and [5.8]-[8.0
]=0.65-0.7 which places it formally in the region of Class II sources, but also close to the region for Class 0/I (e.g., Allen et al. 2004).
Furthermore, the K-[3.6] color of 1.52 in ``quiescence'' also place the star as a strong accretor. In contrast,
U-V = -0.05 which formally would (incorrectly) place V1118 Ori as a weak-lined T Tauri star. In fact, using the Gullbring et al. (1998) method to derive mass accretion rates from the U-band luminosity excess, we find a mass accretion rate of
yr-1; Kenyon et al. 1993).
Therefore, our derived mass accretion rates are consistent with placing
V1118 Ori in a category between Class I and CTTS stars. We
note also that the IRAC color indices of V1118 Ori in quiescence
are [3.6]-[4.5
]=0.65-0.75 and [5.8]-[8.0
]=0.65-0.7 which places it formally in the region of Class II sources, but also close to the region for Class 0/I (e.g., Allen et al. 2004).
Furthermore, the K-[3.6] color of 1.52 in ``quiescence'' also place the star as a strong accretor. In contrast,
U-V = -0.05 which formally would (incorrectly) place V1118 Ori as a weak-lined T Tauri star. In fact, using the Gullbring et al. (1998) method to derive mass accretion rates from the U-band luminosity excess, we find a mass accretion rate of
![]()
![]() yr-1,
much smaller than values derived by SED modeling, and also inconsistent
with the strong infrared excess. While our derived mass accretion rates
are model-dependent, we are confident that our derived mass accretion
rates are realistic, despite the difficulty to derive mass accretion
rates from infrared excess (e.g., Kenyon & Hartmann 1987).
yr-1,
much smaller than values derived by SED modeling, and also inconsistent
with the strong infrared excess. While our derived mass accretion rates
are model-dependent, we are confident that our derived mass accretion
rates are realistic, despite the difficulty to derive mass accretion
rates from infrared excess (e.g., Kenyon & Hartmann 1987).
Overall, the data provide ample evidence that a significant portion of
matter fell from the disk onto the young star as a consequence of the
increase in mass accretion rate. Over a duration of about
400 days, we estimate about
![]() was deposited (using an average of half the peak mass accretion rate),
i.e., about twice the amount that would have been deposited over the
same time range if using the quiescent mass accretion rate
The hotspot covering factor we derive at the peak of the outburst is
also relatively large (
was deposited (using an average of half the peak mass accretion rate),
i.e., about twice the amount that would have been deposited over the
same time range if using the quiescent mass accretion rate
The hotspot covering factor we derive at the peak of the outburst is
also relatively large (
![]() ),
suggesting that a large fraction of the stellar magnetosphere may also
have been influenced by the increase in mass accretion rate, which in
turn supports the hypothesis that the stellar magnetosphere was
modified during the outburst and the X-ray properties of the coronal
plasma have changed Audard et al. (2005b).
Our SED modeling of the dust thermal emission suggests a change of the
inner dust disk radius from about 0.4 AU in quiescence to
0.2 AU at the peak of the outburst (the optically thin gas could
reach down to 0.2 AU or below before the outburst, although it
would be unclear why dust would not go down to the sublimation radius,
unless, e.g., disk clearing by a giant planet or significant grain
growth making the dust optically thin would be present in the inner
portion of the disk). Together with the increase in
),
suggesting that a large fraction of the stellar magnetosphere may also
have been influenced by the increase in mass accretion rate, which in
turn supports the hypothesis that the stellar magnetosphere was
modified during the outburst and the X-ray properties of the coronal
plasma have changed Audard et al. (2005b).
Our SED modeling of the dust thermal emission suggests a change of the
inner dust disk radius from about 0.4 AU in quiescence to
0.2 AU at the peak of the outburst (the optically thin gas could
reach down to 0.2 AU or below before the outburst, although it
would be unclear why dust would not go down to the sublimation radius,
unless, e.g., disk clearing by a giant planet or significant grain
growth making the dust optically thin would be present in the inner
portion of the disk). Together with the increase in ![]() ,
this provides evidence that the disk closed in during the outburst,
disrupted the magnetosphere, and matter fell onto the stellar
photosphere, producing strong hotspot emission that dominated the
optical and near-infrared in outburst (while the thermal disk emission
increased by a factor of 4 and dominated the mid-infrared emission).
,
this provides evidence that the disk closed in during the outburst,
disrupted the magnetosphere, and matter fell onto the stellar
photosphere, producing strong hotspot emission that dominated the
optical and near-infrared in outburst (while the thermal disk emission
increased by a factor of 4 and dominated the mid-infrared emission).
While color-color and color-magnitude diagrams can be used to
determine the level of reddening in young stars, such diagrams might be
difficult to use to measure any reddening during the outburst of a
young star: in addition to reddening, the whole SED of a young star
changes dramatically, increasing in flux, but also in shape: in the
case of V1118 Ori, the optical and near-infrared fluxes increased
much more than the mid-infrared spectrum. The former are dominated by
stellar and hotspot emission, while the latter is dominated by thermal
disk emission. Color-color diagrams show a clear blueing of the colors
(Fig. 11), not caused by clearing of any enshrouding material, but by the strong increase in flux below 1.5![]() m (Fig. 13).
Such multi-wavelength data show that a good coverage of the SED is
necessary to understand the disk-star interactions in young stars.
Furthermore, Figures 10 and 11 indicate that V1118 Ori returned (within uncertainties) to its ``initial'', pre-outburst conditions.
m (Fig. 13).
Such multi-wavelength data show that a good coverage of the SED is
necessary to understand the disk-star interactions in young stars.
Furthermore, Figures 10 and 11 indicate that V1118 Ori returned (within uncertainties) to its ``initial'', pre-outburst conditions.
7 Conclusions
We have followed the young accreting star V1118 Ori before,
during, and after its outburst in 2005-2006 with photometry
in
![]() and in X-rays with XMM-Newton and Chandra. We have further obtained Spitzer photometry and spectroscopy during the outburst and after the outburst.
and in X-rays with XMM-Newton and Chandra. We have further obtained Spitzer photometry and spectroscopy during the outburst and after the outburst.
The optical and infrared data showed significant variations, with brightening by as much as about 3-4 mag below 1 ![]() m, and up
to
m, and up
to ![]() 2 mag
in the infrared. Monte-Carlo simulations of a star+disk+hotspot model
suggested that the optical data were dominated by
hotspot emission at the peak of the outburst (while the stellar
photosphere dominated before the outburst), while thermal disk emission
from optically thick dust dominated the infrared. The SED analysis
showed an increase in mass accretion rate from
2 mag
in the infrared. Monte-Carlo simulations of a star+disk+hotspot model
suggested that the optical data were dominated by
hotspot emission at the peak of the outburst (while the stellar
photosphere dominated before the outburst), while thermal disk emission
from optically thick dust dominated the infrared. The SED analysis
showed an increase in mass accretion rate from
![]()
![]() yr-1 in quiescence to
yr-1 in quiescence to
![]()
![]() yr-1 at the peak of the outburst, and an increase of the hotspot fractional coverage area from
yr-1 at the peak of the outburst, and an increase of the hotspot fractional coverage area from
![]() to
to
![]() .
The SED modeling suggests that the dust sublimation radius increased
from 0.1 to 0.2 AU. Based on the thermal dust emission, the inner
disk radius moved from about 4 times the dust sublimation radius
(0.4 AU) to 0.2 AU (
.
The SED modeling suggests that the dust sublimation radius increased
from 0.1 to 0.2 AU. Based on the thermal dust emission, the inner
disk radius moved from about 4 times the dust sublimation radius
(0.4 AU) to 0.2 AU (
![]() )
at the peak of the outburst, although the gas inner disk radius could extend within the dust sublimation radius.
The inclination angle of the disk is constrained to values of
)
at the peak of the outburst, although the gas inner disk radius could extend within the dust sublimation radius.
The inclination angle of the disk is constrained to values of
![]() with a peak at 0.25, i.e.,
with a peak at 0.25, i.e.,
![]() .
.
The Spitzer IRS spectra showed the silicate feature at 10 ![]() m
in emission during and after the outburst, with no apparent variation
in shape or flux, indicating
that the outburst had little impact on the optically thin region where
the silicate emission originates. Emission lines were detected in the
high-resolution module data
although the background subtraction proved to be difficult, especially
for the outburst spectra. Follow-up observations, e.g., from the ground
should confirm
the detection of lines of particular interest, e.g., [Ne II], [S III], and H2 0-0.
m
in emission during and after the outburst, with no apparent variation
in shape or flux, indicating
that the outburst had little impact on the optically thin region where
the silicate emission originates. Emission lines were detected in the
high-resolution module data
although the background subtraction proved to be difficult, especially
for the outburst spectra. Follow-up observations, e.g., from the ground
should confirm
the detection of lines of particular interest, e.g., [Ne II], [S III], and H2 0-0.
The initial X-ray observations (Jan.-Mar. 05) indicated a change in the thermal structure of the coronal spectrum of V1118 Ori with little change in the X-ray flux (Audard et al. 2005b), while fading in the X-rays was already detected in September 2005 (Lorenzetti et al. 2006). Our continued monitoring with XMM-Newton and Chandra provided the complete picture, confirmed the low plasma temperature measured in February 2005, and showed that V1118 Ori's X-ray flux was strongly correlated with the optical and infrared fluxes, although intrinsic variability (because of magnetic activity) was also observed. Compared to the 2002 flux, the increase in X-ray flux was not large during the outburst and the post-outburst X-ray observation in late 2007 showed a lower flux level than observed serendipitously in 2002, which could either indicate that the outburst significantly impacted the stellar magnetosphere to leave it in a lower state than before the outburst, or that the 2002 observation caught V1118 Ori in a quiescent high state. The X-ray spectra showed evidence of thermal variations of the corona during the outburst, but the signal-to-noise ratio of our data was not high (except in March 2006 during which we could detect a second temperature component, probably due to the increase in flux at the end of the observation, likely contaminated by a flare). After the apparent change to a cooler plasma temperature in the early phase of the outburst, we argue that V1118 Ori's corona returned to its ``normal'', hotter state before the end of the outburst, but that the continuing mass infall affected significantly the magnetospheric configuration.
Our observations have shown the interplay between disk and stellar magnetosphere in young accreting stars, as demonstrated by the changes in the X-ray plasma emission caused by the strong increase in mass infall from the disk onto the stellar photosphere. While our data do not directly help to determine the origin of the outbursts (thermal disk instabilities or instabilities because of close companions or giant planets in the disk), it is interesting that Reipurth et al. (2007) identified V1118 Ori as a close visual binary. Future observations should, ideally, take this binarity into account and determine which star is actually outbursting.
AcknowledgementsWe acknowledge support by NASA through Chandra award DD5-6029X and through XMM-Newton award NNG05GI96G to Columbia University, SAO GO6-7005D, SAO GO8-9020X, and NNX07AI37G to the University of Colorado. M. A. acknowledges support from a Swiss National Science Foundation Professorship (PP002-110504). G. S. Stringfellow further acknowledged support from NASA programs NNX06AG44G, NNX07AT30G, and Spitzer through JPL contract 1265288. The Chandra X-ray Observatory Center is operated by the Smithsonian Astrophysical Observatory for and on behalf of NASA under contract NAS8-03060. Based on observations obtained with XMM-Newton, an ESA science mission with instruments and contributions directly funded by ESA Member States and NASA. This work is based in part on observations made with the Spitzer Space Telescope, which is operated by the Jet Propulsion Laboratory, California Institute of Technology under a contract with NASA. Support for this work was provided by NASA. Stony Brook's participation in SMARTS is made possible by support from the offices of the Provost and the Vice President for Research. We thank J. Allyn Smith, P. McGehee, J. Espinoza, and D. Gonzalez for doing the observations with the SMARTS telescopes. We also thank H. Tannanbaum and N. Schartel for granting Chandra DDT and XMM-Newton TOO time to observe V1118 Ori. We also thank N. Grosso for discussions of quantiles and outbursting sources, A. Carmona and F. Fontani for useful comments on the manuscript. Finally, we thank the referee, D. Lorenzetti, for comments that clarified aspects of the manuscript.
References
- Ábrahám, P., Juhász, A., Dullemond, C. P., et al. 2009, Nature, 459, 224 [NASA ADS] [CrossRef] [PubMed] [Google Scholar]
- Ali, B., & Depoy, D.L. 1995, AJ, 109, 709 [NASA ADS] [CrossRef] [Google Scholar]
- Allen, L. E., Calvet, N., D'Alessio, P., et al. 2004, ApJS, 154, 363 [NASA ADS] [CrossRef] [Google Scholar]
- Argiroffi, C., Maggio, A., & Peres, G. 2007, A&A, 465, L5 [NASA ADS] [CrossRef] [EDP Sciences] [Google Scholar]
- Armitage, P. J., Livio, M., & Pringle, J. E. 2001, MNRAS, 324, 705 [NASA ADS] [CrossRef] [Google Scholar]
- Arnaud, K. A. 1996, in Astronomical Data Analysis Software and Systems V, ed. G. Jacoby, & J. Barnes (San Francisco: ASP), ASP Conf. Ser., 101, 1 [Google Scholar]
- Aspin, C. 2008, IAU Circ, 8969 [Google Scholar]
- Aspin, C., Beck, T. L., & Reipurth, B. 2008, AJ, 135, 423 [NASA ADS] [CrossRef] [Google Scholar]
- Aspin, C., Reipurth, B., Beck, T. L., et al. 2009, ApJ, 692, L67 [NASA ADS] [CrossRef] [Google Scholar]
- Audard, M., Skinner, S. L., Smith, K. W., et al. 2005a, in Proc. 13th Cool Stars Workshop, ed. F. Favata et al. (ESA), 411 [Google Scholar]
- Audard, M., Güdel, M., Skinner, S. L., et al. 2005b, ApJ, 635, L81 [NASA ADS] [CrossRef] [Google Scholar]
- Bell, K. R., & Lin, D. N. C. 1994, ApJ, 427, 987 [NASA ADS] [CrossRef] [Google Scholar]
- Bessell, M. S., & Brett, J. M. 1988, PASP, 100, 1134 [NASA ADS] [CrossRef] [Google Scholar]
- Bonnell, I., & Bastien, P. 1992, ApJ, 401, L31 [Google Scholar]
- Briceño, C., Vivas, A. K., Hernández, J., et al. 2004, ApJ, 606, L123 [NASA ADS] [CrossRef] [Google Scholar]
- Calvet, N., & Gullbring, E. 1998, ApJ, 509, 802 [NASA ADS] [CrossRef] [Google Scholar]
- Carr, J. S. 1989, ApJ, 345, 522 [NASA ADS] [CrossRef] [Google Scholar]
- Chandler, C. J., Carlstrom, J. E., & Scoville, N. Z. 1995, ApJ, 446, 793 [NASA ADS] [CrossRef] [Google Scholar]
- Clarke, C. J., & Syer, D. 1996, MNRAS, 278, L23 [NASA ADS] [CrossRef] [Google Scholar]
- Drake, J. J. 2005, 13th Cambridge Workshop on Cool Stars, Stellar Systems and the Sun, 560, 519 [Google Scholar]
- Edwards, S. 2009, AIP Conf. Ser., 1094, 29 [NASA ADS] [CrossRef] [Google Scholar]
- Fazio, G. G., Hora, J. L., Allen, L. E., et al. 2004, ApJS, 154, 10 [NASA ADS] [CrossRef] [Google Scholar]
- Fitzpatrick, E. L. 1999, PASP, 111, 63 [NASA ADS] [CrossRef] [Google Scholar]
- Garcia, J. G., & Parsamian, E. S. 2000, Informational Bulletin on Variable Stars, 4925, 1 [NASA ADS] [Google Scholar]
- Garcia, J. G., & Parsamian, E. S. 2008, Information Bulletin on Variable Stars, 5829, 1 [NASA ADS] [Google Scholar]
- Garcia, J. G., Parsamian, E. S., & Velazquez, J. C. 2006, Information Bulletin on Variable Stars, 5691, 1 [NASA ADS] [Google Scholar]
- Grevesse, N., & Sauval, A. J. 1998, Space Sci. Rev., 85, 161 [NASA ADS] [CrossRef] [Google Scholar]
- Grosso, N., Kastner, J. H., Ozawa, H., et al. 2005, A&A, 438, 159 [NASA ADS] [CrossRef] [EDP Sciences] [Google Scholar]
- Güdel, M., & Telleschi, A. 2007, A&A, 474, L25 [NASA ADS] [CrossRef] [EDP Sciences] [Google Scholar]
- Güdel, M., Skinner, S. L., Briggs, K. R., et al. 2005, ApJ, 626, L53 [NASA ADS] [CrossRef] [Google Scholar]
- Güdel, M., Skinner, S. L., Audard, M., et al. 2008, A&A, 478, 797 [NASA ADS] [CrossRef] [EDP Sciences] [Google Scholar]
- Gullbring, E., Hartmann, L., Briceño, C., & Calvet, N. 1998, ApJ, 492, 323 [NASA ADS] [CrossRef] [Google Scholar]
- Günther, H. M., & Schmitt, J. H. M. M. 2009, A&A, 494, 1041 [NASA ADS] [CrossRef] [EDP Sciences] [Google Scholar]
- Günther, H. M., Liefke, C., Schmitt, J. H. M. M., et al. 2006, A&A, 459, L29 [NASA ADS] [CrossRef] [EDP Sciences] [Google Scholar]
- Günther, H. M., Schmitt, J. H. M. M., Robrade, J., & Liefke, C. 2007, A&A, 466, 1111 [NASA ADS] [CrossRef] [EDP Sciences] [Google Scholar]
- Hartigan, P., Edwards, S., & Ghandour, L. 1995, ApJ, 452, 736 [NASA ADS] [CrossRef] [Google Scholar]
- Hartmann, L., & Kenyon, S. J. 1996, ARA&A, 34, 207 [NASA ADS] [CrossRef] [EDP Sciences] [MathSciNet] [Google Scholar]
- Hartmann, L., Kenyon, S., & Hartigan, P. 1993, Protostars and Planets III, 497 [Google Scholar]
- Hartmann, L., Calvet, N., Gullbring, E., & D'Alessio, P. 1998, ApJ, 495, 385 [NASA ADS] [CrossRef] [Google Scholar]
- Hauschildt, P. H., Allard, F., & Baron, E. 1999, ApJ 512, 377 [NASA ADS] [CrossRef] [Google Scholar]
- Herbig, G. H. 2008, AJ, 135, 637 [NASA ADS] [CrossRef] [Google Scholar]
- Hillenbrand, L. A. 1997, AJ, 113, 1733 [NASA ADS] [CrossRef] [Google Scholar]
- Hillenbrand, L. A., Strom, S. E., Calvet, N., et al. 1998, AJ, 116, 1816 [NASA ADS] [CrossRef] [Google Scholar]
- Hong, J., Schlegel, E. M., & Grindlay, J. E. 2004, ApJ, 614, 508 [NASA ADS] [CrossRef] [Google Scholar]
- Houck, J. R., Roellig, T. L., van Cleve, J., et al. 2004, ApJS, 154, 18 [NASA ADS] [CrossRef] [Google Scholar]
- Itagaki, K. 2008, IAU Circ., 8968, [Google Scholar]
- Jansen, F., Lumb, D., Altieri, B., et al. 2001, A&A, 365, L1 [NASA ADS] [CrossRef] [EDP Sciences] [Google Scholar]
- Jones, A. F. A. L. 2008a, Central Bureau Electronic Telegrams, 1217, 1 [NASA ADS] [Google Scholar]
- Jones, A. F. A. L. 2008b, Central Bureau Electronic Telegrams, 1231, 1 [NASA ADS] [Google Scholar]
- Kastner, J. H., Huenemoerder, D. P., Schulz, N. S., et al. 2002, ApJ, 567, 434 [NASA ADS] [CrossRef] [Google Scholar]
- Kastner, J. H., Richmond, M., Grosso, N., et al. 2004, Nature, 430, 429 [NASA ADS] [CrossRef] [PubMed] [Google Scholar]
- Kastner, J. H., Franz, G., Grosso, N., et al. 2005, ApJS, 160, 511 [NASA ADS] [CrossRef] [Google Scholar]
- Kastner, J. H., Richmond, M., Grosso, N., et al. 2006a, ApJ, 648, L43 [NASA ADS] [CrossRef] [Google Scholar]
- Kastner, J. H., Richmond, M., Simon, T., et al. 2006b, Central Bureau Electronic Telegrams, 760, 1 [NASA ADS] [Google Scholar]
- Kenyon, S. J., & Hartmann, L. 1987, ApJ, 323, 714 [NASA ADS] [CrossRef] [Google Scholar]
- Kenyon, S. J., Hartmann, L., & Hewett, R. 1988, ApJ, 325, 231 [NASA ADS] [CrossRef] [Google Scholar]
- Kenyon, S. J., Calvet, N., & Hartmann, L. 1993, ApJ, 414, 676 [NASA ADS] [CrossRef] [Google Scholar]
- Kessler-Silacci, J. E., Hillenbrand, L. A., Blake, G. A., & Meyer, M. R. 2005, ApJ, 622, 404 [Google Scholar]
- Kessler-Silacci, J. E., Augereau, J.-C., Dullemond, C. P., et al. 2006, ApJ, 639, 275 [NASA ADS] [CrossRef] [Google Scholar]
- Kóspál, Á., Nemeth, P., Ábrahám, P., et al. 2008, Information Bulletin on Variable Stars, 5819, 1 [Google Scholar]
- Lin, D. N. C., & Papaloizou, J. 1985, Protostars and Planets II, 981 [Google Scholar]
- Lodato, G., & Clarke, C. J. 2004, MNRAS, 353, 841 [NASA ADS] [CrossRef] [Google Scholar]
- Lorenzetti, D., Giannini, T., Calzoletti, L., et al. 2006, A&A, 453, 579 [NASA ADS] [CrossRef] [EDP Sciences] [Google Scholar]
- Lorenzetti, D., Giannini, T., Larionov, V. M., et al. 2007, ApJ, 665, 1182 [NASA ADS] [CrossRef] [Google Scholar]
- Lorenzetti, D., Larionov, V. M., Giannini, T., et al. 2009, ApJ, 693, 1056 [NASA ADS] [CrossRef] [Google Scholar]
- Maggio, A., Flaccomio, E., Favata, F., et al. 2007, ApJ, 660, 1462 [NASA ADS] [CrossRef] [Google Scholar]
- Meyer, M. R., Calvet, N., & Hillenbrand, L. A. 1997, AJ, 114, 288 [NASA ADS] [CrossRef] [Google Scholar]
- McGehee, P. M., Smith, J. A., Henden, A. A., et al. 2004, ApJ, 616, 1058 [NASA ADS] [CrossRef] [Google Scholar]
- McNeil, J. W. 2004, IAU Circ., 616, 8284 [NASA ADS] [Google Scholar]
- Muench, A., Getman, K., Hillenbrand, L., & Preibisch, T. 2008, Handbook of Star Forming Regions, Volume I: The Northern Sky, ASP Monograph Publications, Vol. 4, ed. B. Reipurth, 483 [Google Scholar]
- Ness, J.-U., & Schmitt, J. H. M. M. 2005, A&A, 444, L41 [NASA ADS] [CrossRef] [EDP Sciences] [Google Scholar]
- Pfalzner, S., Tackenberg, J., & Steinhausen, M. 2008, A&A, 487, L45 [NASA ADS] [CrossRef] [EDP Sciences] [Google Scholar]
- Preibisch, T., Kim, Y.-C., Favata, F., et al. 2005, ApJS, 160, 401 [NASA ADS] [CrossRef] [Google Scholar]
- Ramírez, S. V., Rebull, L., Stauffer, J., et al. 2004, AJ, 128, 787 [NASA ADS] [CrossRef] [Google Scholar]
- Reipurth, B., Guimarães, M. M., Connelley, M. S., & Bally, J. 2007, AJ, 134, 2272 [NASA ADS] [CrossRef] [Google Scholar]
- Rieke, G. H., Lebofsky, M. J., & Low, F. J. 1985, AJ, 90, 900 [NASA ADS] [CrossRef] [Google Scholar]
- Rieke, G. H., Young, E. T., Engelbracht, C. W., et al. 2004, ApJS, 154, 25 [NASA ADS] [CrossRef] [Google Scholar]
- Robrade, J., & Schmitt, J. H. M. M. 2006, A&A, 449, 737 [NASA ADS] [CrossRef] [EDP Sciences] [Google Scholar]
- Robrade, J., & Schmitt, J. H. M. M. 2007, A&A, 473, 229 [NASA ADS] [CrossRef] [EDP Sciences] [Google Scholar]
- Robitaille, T., Whitney, B. A., Indebetouw, R., & Wood, K. 2007, ApJS, 169, 328 [NASA ADS] [CrossRef] [Google Scholar]
- Sacco, G. G., Argiroffi, C., Orlando, S., et al. 2008, A&A, 491, L17 [NASA ADS] [CrossRef] [EDP Sciences] [Google Scholar]
- Schmitt, J. H. M. M., Robrade, J., Ness, J.-U., et al. 2005, A&A, 432, L35 [NASA ADS] [CrossRef] [EDP Sciences] [Google Scholar]
- Schneider, P. C., & Schmitt, J. H. M. M. 2008, A&A, 488, L13 [NASA ADS] [CrossRef] [EDP Sciences] [Google Scholar]
- Skinner, S. L., Briggs, K. R., & Güdel, M. 2006, ApJ, 643, 995 [NASA ADS] [CrossRef] [Google Scholar]
- Skinner, S. L., Sokal, K. R., Güdel, M., & Briggs, K. R. 2009, ApJ, 696, 766 [NASA ADS] [CrossRef] [Google Scholar]
- Skinner, S. L., Sokal, K. R., Megeath, S. T., et al. 2009, ApJ, 701, 710 [NASA ADS] [CrossRef] [Google Scholar]
- Smith, K. W., Audard, M., Güdel, M., et al. 2005, in Proc. 13th Cool Stars Workshop, ed. F. Favata et al. (ESA), 971 [Google Scholar]
- Smith, R. K., Brickhouse, N. S., Liedahl, D. A., & Raymond, J. C. 2001, ApJ, 556, L91 [NASA ADS] [CrossRef] [Google Scholar]
- Stassun, K. G., Mathieu, R. D., Mazeh, T., & Vrba, F. J. 1999, AJ, 117, 2941 [NASA ADS] [CrossRef] [Google Scholar]
- Stelzer, B., & Schmitt, J. H. M. M. 2004, A&A, 418, 687 [NASA ADS] [CrossRef] [EDP Sciences] [Google Scholar]
- Stelzer, B., Hubrig, S., Orlando, S., et al. 2009, A&A, 499, 529 [NASA ADS] [CrossRef] [EDP Sciences] [Google Scholar]
- Strüder, L., Aschenbach, B., Bräuniger, H., et al. 2001, A&A, 365, L18 [NASA ADS] [CrossRef] [EDP Sciences] [Google Scholar]
- Telleschi, A., Güdel, M., Briggs, K. R., et al. 2007, A&A, 468, 443 [NASA ADS] [CrossRef] [EDP Sciences] [Google Scholar]
- Turner, M. J. L., Abbey, A., Arnaud, M., et al. 2001, A&A, 365, L26 [Google Scholar]
- Venkat, V., & Anandarao, B. G. 2008, CBET, 1596 [Google Scholar]
- Vorobyov, E. I., & Basu, S. 2005, ApJ, 633, L137 [NASA ADS] [CrossRef] [Google Scholar]
- Vorobyov, E. I., & Basu, S. 2006, ApJ, 650, 956 [NASA ADS] [CrossRef] [Google Scholar]
- Weisskopf, M. C., O'dell, S. L., & van Speybroeck, L. P. 1996, Proc. SPIE, 2805, 2 [Google Scholar]
- Werner, M. W., Roellig, T. L., Low, F. J., et al. 2004, ApJS, 154, 1 [Google Scholar]
- Whitney, B. A., Wood, K., Bjorkman, J. E., & Wolff, M. J. 2003a, ApJ, 591, 1049 [Google Scholar]
- Whitney, B. A., Wood, K., Bjorkman, J. E., & Cohen, M. 2003b, ApJ, 598, 1079 [NASA ADS] [CrossRef] [Google Scholar]
- Williams, P., Bembrick, C., & Lee, S. 2005, IAUC, 8460, 3 [NASA ADS] [Google Scholar]
- Wood, K., Wolff, M. J., Bjorkman, J. E., & Whitney, B. 2002, ApJ, 564, 887 [NASA ADS] [CrossRef] [Google Scholar]
Online Material
Appendix A: Details on the SMARTS data reduction
Table A.1: Comparison stars for the SMARTS photometry.
The ANDICAM optical detector is a Fairchild 447
![]() CCD with
30
CCD with
30 ![]() m pixels.
It was used in
m pixels.
It was used in ![]() binning mode, yielding a nominal plate scale of 0.369 arcsec pixel-1 and approximately a
binning mode, yielding a nominal plate scale of 0.369 arcsec pixel-1 and approximately a
![]() field. Readnoise was
6.5 e- rms; gain is 2.3 e-/DN. It was read with a single amplifier.
Filters were Johnson B and V and Kron-Cousins R and I.
We generally took 3 exposures in B and V, and 2 images in
field. Readnoise was
6.5 e- rms; gain is 2.3 e-/DN. It was read with a single amplifier.
Filters were Johnson B and V and Kron-Cousins R and I.
We generally took 3 exposures in B and V, and 2 images in ![]() and
and ![]() ,
and co-added these prior to analysis. The IR channel detector is a Rockwell 10242 HgCdTe ``Hawaii'' array with
18
,
and co-added these prior to analysis. The IR channel detector is a Rockwell 10242 HgCdTe ``Hawaii'' array with
18 ![]() m pixels binned
m pixels binned ![]() to yield a
to yield a
![]() pixel-1plate scale. The IR channel field is
pixel-1plate scale. The IR channel field is
![]() .
The used filters are
standard CIT/CTIO JHK. We flattened the images using
dome flats obtained every 3 nights.
We observed using a 3-point dither pattern and a
.
The used filters are
standard CIT/CTIO JHK. We flattened the images using
dome flats obtained every 3 nights.
We observed using a 3-point dither pattern and a
![]() throw,
and used the median of the unshifted images as the local sky.
throw,
and used the median of the unshifted images as the local sky.
A.1 Differential photometry
We initially determined relative magnitudes using differential photometry.
In the optical, we selected the 11 brightest stars in the ![]()
![]() field of view (Table A.1; V372 Ori was overexposed).
Instrumental magnitudes were determined for the target and all the comparison stars, by summing the counts in a 5 pixel (
field of view (Table A.1; V372 Ori was overexposed).
Instrumental magnitudes were determined for the target and all the comparison stars, by summing the counts in a 5 pixel (
![]() )
aperture. Background was the median level in an annulus from
10-20 pixel (
)
aperture. Background was the median level in an annulus from
10-20 pixel (
![]() )
radius.
Since V1118 Ori is in a region of complex nebulosity,
we also tried modeling the background by taking radial cuts through the
image and extrapolating the level at the position of the target. This affected
the magnitudes at less than 5% at B, and even less at longer wavelengths.
)
radius.
Since V1118 Ori is in a region of complex nebulosity,
we also tried modeling the background by taking radial cuts through the
image and extrapolating the level at the position of the target. This affected
the magnitudes at less than 5% at B, and even less at longer wavelengths.
In the near-infrared, we used 6 comparison stars in the field (again excluding
V372 Ori). We used a 5 pixel (
![]() )
aperture. Background was the median level in an annulus from 10-20 pixel (
)
aperture. Background was the median level in an annulus from 10-20 pixel (
![]() )
radius.
)
radius.
We constructed a single comparison, the ``superstar'' from a weighted sum of all the comparison stars. The differential magnitude was the difference between the instrumental magnitudes of the target and the ``superstar''.
Most of the stars in this field are known or suspected variables. Fortunately, none were as variable as V1118 Ori. We assumed that, by summing all the comparisons, the ``superstar'' would be less variable than any single comparison. We constructed light curves using subsets of the comparison stars, and did not see any gross effects that could be attributed to variations of the comparisons. Nonetheless we did not incorporate those stars with measured standard deviations after absolute calibration (see below) >0.10 mag at V into the optical ``superstar''. We caution that there is no certainty that the comparison was stable at the few percent level.
A.2 Optical absolute calibration
Although the SMARTS operations are not optimized for absolute photometry, single observations are made of Landolt standard fields on each night judged photometric to establish thephotometric zero point. These can be used to determine apparent magnitudes with an accuracy of better than 10%.
On each night on which we had both observations of the target and of a photometric standard field, we computed the zero-point offset (apparent magnitude - instrumental magnitude). We assumed the standard atmospheric extinction correction for Cerro Tololo. Since the standard field was observed only once per night, we could not account for changes in transparency through the night. We did not solve for reddening terms, so the photometric solution consisted of only the zero-point.
We used the zero-point correction to determine the apparent magnitudes of all
the comparison stars in the field. We could do this on 71 nights.
In doing so, we confirmed that all the comparison stars were variable (Table A.1).
We compared these magnitudes to the
![]() magnitudes published by
Hillenbrand (1997). The median offsets were 0.08 and 0.23 mag at V and
magnitudes published by
Hillenbrand (1997). The median offsets were 0.08 and 0.23 mag at V and ![]() ,
respectively. Given that all the stars are
variable members of the Orion Nebula population, this was acceptable agreement.
,
respectively. Given that all the stars are
variable members of the Orion Nebula population, this was acceptable agreement.
We applied this absolute calibration on all nights (including non-photometric
nights) to determine the apparent magnitudes of the target.
There were 14 nights where SMARTS photometry overlapped with the Villanova photometry.
On these nights there were systematic offsets, in the sense (SMARTS-Villanova),
of
![]() ,
,
![]() ,
and
,
and
![]() mag in V,
mag in V, ![]() ,
and
,
and ![]() ,
respectively. The cause for the systematic offsets might be the lack of a
color term in the photometric solution, exacerbated by the fact
that most of our comparisons have
,
respectively. The cause for the systematic offsets might be the lack of a
color term in the photometric solution, exacerbated by the fact
that most of our comparisons have
![]() colors >2 mag.
To allow comparison between the different telescope data,
we applied the above systematic offsets to the SMARTS magnitudes and gave
the nightly average data in Table A.2.
colors >2 mag.
To allow comparison between the different telescope data,
we applied the above systematic offsets to the SMARTS magnitudes and gave
the nightly average data in Table A.2.
A.3 Near-infrared absolute calibration
For the JHK absolute calibration, we compared the instrumental magnitudes directly to the 2MASS magnitudes of the 6 comparison stars. To check for target variability, we compared these magnitudes to those published in the DENIS catalog, and by Ali & Depoy (1995) and Hillenbrand et al. (1998). Two of the six comparisons (2MASS J05344159-0534249 and 2MASS J05344219-0533036 appear variable, with variances >0.2 mag at K(4 observations), and 2 others (JW 94 and JW 100) appeared variable in the optical (Table A.1).
Our ability to absolutely calibrate the photometry was ultimately limited by the stability of the zero-point. By using all the possible comparison stars, on average the zero-point will be more stable than determined from any single comparison star. We did not include the systematic uncertainty in the zero-point in our error budgets. Overall, the JHK fluxes compared well to those published by Lorenzetti et al. (2007). However, we added a systematic correction of +0.1 mag for J and +0.2 mag for K to match their photometry. V1118 Ori is intrinsically variable, as are the comparison stars. The only reason for applying the systematic offsets to our data was to simplify graphical comparison with the Lorenzetti et al. data. The offsets do not change significantly the results of this paper, they merely shift the near-infrared data points by 0.1 to 0.2 mag, e.g., in Figs. 10 and 11.
Table A.2: SMARTS average nightly magnitudes.
Table A.3: Villanova magnitudes.
Appendix B: Details on the Spitzer data reduction
B.1 IRAC
We used the MOsaicker and Point source EXtractor (MOPEX) software
release of June 2007. We started from the Basic Calibrated Data
(BCD) individual images to produce mosaics with a (native) pixel size
of 1
![]() 22.
For the data taken in sub-array mode (PIDs 3716 and 41019), we
collapsed the 3-dimensional image BCDs into 2-dimensional BCDs by
using, for each pixel, the median of the 64 planes. For the uncertainty
BCD files, we used the standard deviation of the 64 planes of the BCD
file instead of using the input uncertainties. This method allows the
removal of most particle hits and the ingestion of the collapsed BCDs
in MOPEX. We then used aperture photometry, centered on V1118 Ori,
using an extraction radius of 10 pixels (12
22.
For the data taken in sub-array mode (PIDs 3716 and 41019), we
collapsed the 3-dimensional image BCDs into 2-dimensional BCDs by
using, for each pixel, the median of the 64 planes. For the uncertainty
BCD files, we used the standard deviation of the 64 planes of the BCD
file instead of using the input uncertainties. This method allows the
removal of most particle hits and the ingestion of the collapsed BCDs
in MOPEX. We then used aperture photometry, centered on V1118 Ori,
using an extraction radius of 10 pixels (12
![]() 2), and a concentric annulus of radii 12 and 15 pixels (we used radii of 10 and 12.5 pixels for the IRAC4 band at 8.0
2), and a concentric annulus of radii 12 and 15 pixels (we used radii of 10 and 12.5 pixels for the IRAC4 band at 8.0 ![]() m
because of the strength of the background intensity at this wavelength
for radii larger than 12.5 pixels. Indeed, the background is dominated
by emission caused by the nearby Herbig Ae star V372 Ori; this effect
is less prominent in the other IRAC bands, but the presence of the
Herbig star limited us to outer radii of 15 pixels). No aperture
correction is needed for an extraction circle radius of 10 pixels
(according to the IRAC data handbook v3.0).
m
because of the strength of the background intensity at this wavelength
for radii larger than 12.5 pixels. Indeed, the background is dominated
by emission caused by the nearby Herbig Ae star V372 Ori; this effect
is less prominent in the other IRAC bands, but the presence of the
Herbig star limited us to outer radii of 15 pixels). No aperture
correction is needed for an extraction circle radius of 10 pixels
(according to the IRAC data handbook v3.0).
B.2 MIPS
We used the BCD files where V1118 Ori was on the detector as input files for the MOPEX pipeline. A native pixel size of
![]() was used to create the mosaic, and we used an extraction radius of 13
was used to create the mosaic, and we used an extraction radius of 13
![]() centered on V1118 Ori to derive the aperture photometry. We used an annulus of radii 15
centered on V1118 Ori to derive the aperture photometry. We used an annulus of radii 15
![]() and 20
and 20
![]() for
the background, and finally used an aperture correction factor
of 1.17 (from Table 3.12 of the MIPS data handbook,
v. 3.3.1). We also investigated the background with a different
method, i.e., to calculate the background in a nearby region using a
circle with radius 13
for
the background, and finally used an aperture correction factor
of 1.17 (from Table 3.12 of the MIPS data handbook,
v. 3.3.1). We also investigated the background with a different
method, i.e., to calculate the background in a nearby region using a
circle with radius 13
![]() .
Indeed, the MIPS24 background near V1118 Ori is highly
inhomogeneous. Notice that, while the uncertainty in the flux density
is on the order 0.5 mJy, we estimate the true uncertainty, mainly
because of the inhomogeneity of the background and the difficulty of
finding a representative background region, to be closer to
15-20 mJy.
.
Indeed, the MIPS24 background near V1118 Ori is highly
inhomogeneous. Notice that, while the uncertainty in the flux density
is on the order 0.5 mJy, we estimate the true uncertainty, mainly
because of the inhomogeneity of the background and the difficulty of
finding a representative background region, to be closer to
15-20 mJy.
B.3 IRS
We extracted the IRS spectra using the Spitzer IRS Custom Extraction (SPICE) v2.1.2 software and the post-BCD co-added
2-D images (pipeline version S15.3.0 for SL/SH and S17.2.0 for LH/LL
for the outburst data; S18.5.0 for all post-outburst spectra).
We investigated in detail the methodology for subtracting the
background in the IRS spectra. Indeed, for the low-resolution modules,
we have investigated different techniques for estimating the background
contamination. Firstly, we used the standard technique that takes the
image from nod A, subtracts the nod B image, and then the net (A-B)
spectrum of V1118 Ori is extracted with SPICE. The same is then
done for the net (B-A) spectrum, and both net spectra are averaged.
Unfortunately, this technique is unsatisfactory because of the
inhomogeneity of the background emission along the cross-dispersion
axis of the slit. A second technique consisted in using the images
taken for the SL2![]() nods and use the source-free region in the SL1 image for the background
of the SL1 nods. This method removes any contamination by
V1118 Ori in the SL1 image, but the downside is that the region of
the sky covered by the SL1 slit (during the SL2 observations) is away
from V1118 Ori. Thus, the measured background may not represent
the background near V1118 Ori. A third technique consisted in
using a background region near V1118 Ori obtained during the
observed nod. This technique allows to get a better estimate for the
background near V1118 Ori, but has the disadvantage that
V1118 Ori may contaminate the background, especially at longer
wavelengths, since the standard extraction width increases with
increasing wavelength, to take into account the increasing size of the
point spread function of a point source. For the February 2005
observation, technique #2 proved better for SL1, while technique #3 was
better for SL2. We used the PAH emission at 6.2 and 11.3
nods and use the source-free region in the SL1 image for the background
of the SL1 nods. This method removes any contamination by
V1118 Ori in the SL1 image, but the downside is that the region of
the sky covered by the SL1 slit (during the SL2 observations) is away
from V1118 Ori. Thus, the measured background may not represent
the background near V1118 Ori. A third technique consisted in
using a background region near V1118 Ori obtained during the
observed nod. This technique allows to get a better estimate for the
background near V1118 Ori, but has the disadvantage that
V1118 Ori may contaminate the background, especially at longer
wavelengths, since the standard extraction width increases with
increasing wavelength, to take into account the increasing size of the
point spread function of a point source. For the February 2005
observation, technique #2 proved better for SL1, while technique #3 was
better for SL2. We used the PAH emission at 6.2 and 11.3 ![]() m
(coming mostly from the diffuse
background emission) to check that the background emission was
adequately removed. For the March 2005 observation, we used
technique #3 for both SL slits, as technique #2 gave an excess in
the PAH at 11.3
m
(coming mostly from the diffuse
background emission) to check that the background emission was
adequately removed. For the March 2005 observation, we used
technique #3 for both SL slits, as technique #2 gave an excess in
the PAH at 11.3 ![]() m
in the SL1 slit. For the post-outburst observations, we used technique
#3 for both SL slits and also for the LL slits (in this case, the
background subtraction is more difficult for
m
in the SL1 slit. For the post-outburst observations, we used technique
#3 for both SL slits and also for the LL slits (in this case, the
background subtraction is more difficult for
![]() mic).
mic).
![\begin{figure}
\par\includegraphics[width=8cm,clip]{13037fgB1.eps}
\end{figure}](/articles/aa/full_html/2010/03/aa13037-09/img1217.png)
|
Figure B.1: Spitzer IRS high-resolution post-outburst spectra (thick curve) degraded to the resolution of the SL and LL modules. The latter data are shown as well (thin curve). Note the good agreement in the continuum and for most lines, except for [Ne II]. |
| Open with DEXTER | |
![\begin{figure}
\par\includegraphics[angle=0,width=8.5cm,clip]{13037fgB2.ps}
\end{figure}](/articles/aa/full_html/2010/03/aa13037-09/img1218.png)
|
Figure B.2:
Spitzer MIPS 24 |
| Open with DEXTER | |
For the high-resolution modules, we used the standard approach to
average the spectra from both nods using the full slit aperture. For
the post-outburst spectra, we used the accompanying background spectra
to obtain the background-subtracted spectra. This procedure worked
nicely for the SH module (i.e., up to 19.35 ![]() m), as demonstrated by the good subtraction of the PAH emission at 11.3
m), as demonstrated by the good subtraction of the PAH emission at 11.3 ![]() m. Notice that the
H2 0-0 S(1)
m. Notice that the
H2 0-0 S(1)
![]()
![]() m line was apparently completely subtracted, while the H2 0-0 S(2)
m line was apparently completely subtracted, while the H2 0-0 S(2)
![]()
![]() m line is faintly detected, We also
detect [Ne II]
m line is faintly detected, We also
detect [Ne II]
![]()
![]() m (
2P1/2-2P3/2) and [S III]
m (
2P1/2-2P3/2) and [S III]
![]()
![]() m (
3P2-3P1) in
the background-subtracted spectrum (we will come back to this issue
below). Furthermore, the silicate feature and continuum flux up to
14
m (
3P2-3P1) in
the background-subtracted spectrum (we will come back to this issue
below). Furthermore, the silicate feature and continuum flux up to
14 ![]() m
are consistent with the SL flux, suggesting that the background
subtraction was not too far off. For the LH module, we subtracted only
95% of the background flux for the post-outburst data. Indeed, at the
wavelengths covered by the LH, the background dominates the emission
and is highly position-dependent. Although our background pointing was
close to V1118 Ori, there is considerable inhomogeneity in the
diffuse emission of the Orion nebula, as observed in the 8.0 and
24
m
are consistent with the SL flux, suggesting that the background
subtraction was not too far off. For the LH module, we subtracted only
95% of the background flux for the post-outburst data. Indeed, at the
wavelengths covered by the LH, the background dominates the emission
and is highly position-dependent. Although our background pointing was
close to V1118 Ori, there is considerable inhomogeneity in the
diffuse emission of the Orion nebula, as observed in the 8.0 and
24 ![]() m images. Figure B.2 shows the MIPS 24
m images. Figure B.2 shows the MIPS 24 ![]() m images together with the ``field-of-views'' of the IRS slits during the first outburst observation and in late 2008.
We used the [Si II]
m images together with the ``field-of-views'' of the IRS slits during the first outburst observation and in late 2008.
We used the [Si II]
![]()
![]() m (
2P3/2-2P1/2) as the proxy for background subtraction for the LH module, and noticed that a scaling factor of 0.95 was better than 1.0.
We detect, however, excess flux in the [S III]
m (
2P3/2-2P1/2) as the proxy for background subtraction for the LH module, and noticed that a scaling factor of 0.95 was better than 1.0.
We detect, however, excess flux in the [S III]
![]()
![]() m (
3P1-3P0) line and faint excess in the H2 0-0 S(0)
m (
3P1-3P0) line and faint excess in the H2 0-0 S(0)
![]()
![]() m line (in
contrast to the S(1) line in the SH spectrum). The SH and LH spectra agree relatively well at 19.4
m line (in
contrast to the S(1) line in the SH spectrum). The SH and LH spectra agree relatively well at 19.4 ![]() m, suggesting again that the background subtraction was adequate.
m, suggesting again that the background subtraction was adequate.
We provide, however, a word of caution about the accuracy of the continuum flux level (especially above 30 ![]() m) and in the reality of the detected flux excess in some lines, especially in the LH wavelength region.
Indeed, we have scaled the background LH spectrum using the [Si II]
line. However, we remind the reader that V1118 Ori is located at
the center of the Orion nebula, where strong ionization and excitation
of the
interstellar medium takes place. Strong spatial variations of the
diffuse background emission occur, which may be different for the
continuum and line (mostly [Si II], [S III], [Ne II], and H2)
emissions. Therefore, using a specific emission line to check that the
background subtraction is adequate may result in an incorrect
subtraction
of the continuum emission of the nebula and even in the subtraction of
another emission line! Nevertheless, the similarities of the continuum
shape in the low-resolution and high-resolution modules (at least below
35
m) and in the reality of the detected flux excess in some lines, especially in the LH wavelength region.
Indeed, we have scaled the background LH spectrum using the [Si II]
line. However, we remind the reader that V1118 Ori is located at
the center of the Orion nebula, where strong ionization and excitation
of the
interstellar medium takes place. Strong spatial variations of the
diffuse background emission occur, which may be different for the
continuum and line (mostly [Si II], [S III], [Ne II], and H2)
emissions. Therefore, using a specific emission line to check that the
background subtraction is adequate may result in an incorrect
subtraction
of the continuum emission of the nebula and even in the subtraction of
another emission line! Nevertheless, the similarities of the continuum
shape in the low-resolution and high-resolution modules (at least below
35 ![]() m) for the post-outburst data, the presence of line excess in [S III] in the LL spectrum and in both SH and LH spectra are suggestions that the background subtraction was overall accurate.
The presence of [Ne II]
in the SH module but not in the SL module demands, however, deeper
analysis to confirm the detection of the line. We degraded the SH and
LH spectra down to SL and LL resolution (Fig. B.1). The continuum shapes are well matched, but the degraded SH data covering the [Ne II]
line shows a strong line which is not compatible with the SL data at
this wavelength. This strongly suggests that the SH background [Ne II]
line flux was too faint compared to the line flux near V1118 Ori
and that the measured SH line flux is of background origin (from the
Orion nebula or from diffuse emission close to V1118 Ori). In the
case of H2 at 12.28
m) for the post-outburst data, the presence of line excess in [S III] in the LL spectrum and in both SH and LH spectra are suggestions that the background subtraction was overall accurate.
The presence of [Ne II]
in the SH module but not in the SL module demands, however, deeper
analysis to confirm the detection of the line. We degraded the SH and
LH spectra down to SL and LL resolution (Fig. B.1). The continuum shapes are well matched, but the degraded SH data covering the [Ne II]
line shows a strong line which is not compatible with the SL data at
this wavelength. This strongly suggests that the SH background [Ne II]
line flux was too faint compared to the line flux near V1118 Ori
and that the measured SH line flux is of background origin (from the
Orion nebula or from diffuse emission close to V1118 Ori). In the
case of H2 at 12.28 ![]() m,
the degraded SH spectrum is consistent with the SL spectrum: the
contrast between the line and the continuum is too faint to confirm the
presence of this line in the SL spectrum. The same comment applies to
the other molecular hydrogen line at 28.2
m,
the degraded SH spectrum is consistent with the SL spectrum: the
contrast between the line and the continuum is too faint to confirm the
presence of this line in the SL spectrum. The same comment applies to
the other molecular hydrogen line at 28.2 ![]() m. Thus, we cannot confirm that this molecule is detected in V1118 Ori's spectrum. On the other hand the [S III]
lines in the degraded SH and LH spectra have similar peak flux
densities as in the LL spectrum, indicating that these lines originate
from the immediate vicinity of V1118 Ori. In summary, we believe
in the detection of the [S III] lines, while we have doubts for [Ne II] and the H2 lines, but we nevertheless provide the line fluxes from the high-resolution module spectra in Table 3. In any case, in view of Spitzer spatial resolution, higher spatial resolution
observations would be required to confirm the origin of the excess line emission.
m. Thus, we cannot confirm that this molecule is detected in V1118 Ori's spectrum. On the other hand the [S III]
lines in the degraded SH and LH spectra have similar peak flux
densities as in the LL spectrum, indicating that these lines originate
from the immediate vicinity of V1118 Ori. In summary, we believe
in the detection of the [S III] lines, while we have doubts for [Ne II] and the H2 lines, but we nevertheless provide the line fluxes from the high-resolution module spectra in Table 3. In any case, in view of Spitzer spatial resolution, higher spatial resolution
observations would be required to confirm the origin of the excess line emission.
We have further investigated whether the post-outburst background
observations could be used for the outburst SH and LH data. In
principle, the zodiacal light dominates the continuum background
emission
below about 40 ![]() m,
while the interstellar medium emission dominates above. The zodiacal
contribution varies as a function of time. We have used the Spitzer
Planning Observations Tool (SPOT) to determine the contribution at the
three different
epochs of the IRS observations and found that they were of similar
level (about 20-25 MJy sr-1 from 15 to 24
m,
while the interstellar medium emission dominates above. The zodiacal
contribution varies as a function of time. We have used the Spitzer
Planning Observations Tool (SPOT) to determine the contribution at the
three different
epochs of the IRS observations and found that they were of similar
level (about 20-25 MJy sr-1 from 15 to 24 ![]() m). For the SH spectrum, we preferred to use the post-outburst spectrum without applying a scaling factor,
since the PAH feature and the H2
line S(2) were well subtracted (the S(1) line is slightly
oversubtracted). For the LH spectrum, we used a scaling factor
equivalent to 0.85, i.e., about the value of the ratio of the zodiacal
light contribution at 24
m). For the SH spectrum, we preferred to use the post-outburst spectrum without applying a scaling factor,
since the PAH feature and the H2
line S(2) were well subtracted (the S(1) line is slightly
oversubtracted). For the LH spectrum, we used a scaling factor
equivalent to 0.85, i.e., about the value of the ratio of the zodiacal
light contribution at 24 ![]() m at
in February-March 2005 and November 2008. This ratio also cancels out relatively well the [Si II] line while the H2 S(0) line still remains detected. With this procedure, the resulting spectrum shows an increase
of the flux with longer wavelengths, perhaps coming from an envelope,
but this increase is not detected in the post-outburst data, casting
some doubt on the accuracy of the continuum shape in the SH and LH
outburst spectra above 14
m at
in February-March 2005 and November 2008. This ratio also cancels out relatively well the [Si II] line while the H2 S(0) line still remains detected. With this procedure, the resulting spectrum shows an increase
of the flux with longer wavelengths, perhaps coming from an envelope,
but this increase is not detected in the post-outburst data, casting
some doubt on the accuracy of the continuum shape in the SH and LH
outburst spectra above 14 ![]() m.
Since we have no outburst LL data to confirm this shape, we prefer to
err on the safe side and consider that the high-resolution continuum
shape for
m.
Since we have no outburst LL data to confirm this shape, we prefer to
err on the safe side and consider that the high-resolution continuum
shape for
![]()
![]() m
during the outburst is unreliable. The strengths of the emission lines
may also be affected by unreliable background reduction; indeed the
flux levels are generally larger than in the post-outburst spectrum
(except for [Ne II], but in this case, the line is
probably not originating in the direct vicinity of V1118 Ori).
Line fluxes from the high-resolution module data in outburst are also
given in Table 3.
m
during the outburst is unreliable. The strengths of the emission lines
may also be affected by unreliable background reduction; indeed the
flux levels are generally larger than in the post-outburst spectrum
(except for [Ne II], but in this case, the line is
probably not originating in the direct vicinity of V1118 Ori).
Line fluxes from the high-resolution module data in outburst are also
given in Table 3.
Footnotes
- ... in outburst
- Appendices are only available in electronic form at http://www.aanda.org
- ...
- Two tables of photometry are only available in electronic form at the CDS via anonymous ftp to cdsarc.u-strasbg.fr (130.79.128.5) or via http://cdsweb.u-strasbg.fr/cgi-bin/qcat?J/A+A/511/A63
- ... 3.2.3
- We used the pipeline data for the December 2007 observation, which was calibrated with CALDB 3.4.2.
- ... SMARTS/CTIO
- SMARTS, the Small and Medium Aperture Research Telescope Facility, is a consortium of universities and research institutions that operate the small telescopes at Cerro Tololo under contract with AURA.
- ...Hong et al. (2004)
- The code is available at http://hea-www.harvard.edu/ChaMPlane/quantile. We used version 1.7.
- ... database
- http://www.hs.uni-hamburg.de/EN/For/ThA/phoenix/index.html
- ... 20090224
- http://gemelli.colorado.edu/ bwhitney/codes/
- ... data
- We obtained data with the IRAM 30 m
MAMBO2 bolometer at 1.2 mm in late November 2009.
V1118 Ori was detected at
 mJy.
Assuming an optically thin regime, an opacity of
mJy.
Assuming an optically thin regime, an opacity of
 cm2 g-1
and using a gas-to-dust ratio of 100, we obtained a disk mass of
cm2 g-1
and using a gas-to-dust ratio of 100, we obtained a disk mass of
 for a characteristic temperature of 20 K. The disk mass
increased to
for a characteristic temperature of 20 K. The disk mass
increased to  for
for  K.
Although the determination of the exact disk mass is out of scope in
this paper, the derived estimates indicate that the assumed disk mass
in our model is realistic.
K.
Although the determination of the exact disk mass is out of scope in
this paper, the derived estimates indicate that the assumed disk mass
in our model is realistic.
- ... outburst
- Lorenzetti
et al. (2006) quote a peak luminosity of
 ;
however, they used the peak magnitudes of a previous outburst to build
the outburst peak SED and to derive the luminosity. The previous
outburst had a peak magnitude of J=8.5, in contrast
to the 2005-2006 outburst that peaked at J=10.6. In
addition, our method derives the luminosity by matching the observed
SED with a detailed radiative transfer model, while Lorenzetti et al. (2006)
integrated the flux densities. The two issues may explain the
difference in derived luminosities.
;
however, they used the peak magnitudes of a previous outburst to build
the outburst peak SED and to derive the luminosity. The previous
outburst had a peak magnitude of J=8.5, in contrast
to the 2005-2006 outburst that peaked at J=10.6. In
addition, our method derives the luminosity by matching the observed
SED with a detailed radiative transfer model, while Lorenzetti et al. (2006)
integrated the flux densities. The two issues may explain the
difference in derived luminosities.
- ... rate
- Lorenzetti
et al. (2006) derive the mass loss rate from the
wind model of Carr (1989) and
his Fig. 8. While their derived mass loss rate is accurate,
they incorrectly give a CO luminosity of
 ,
while it should have been
,
while it should have been
 based on the quoted line flux (Lorenzetti 2009, priv. comm.).
- ... SL2
- For clarity, we explain the second technique for SL2 only in the main text. For the SL1 data, simply permute SL2 and SL1 in the text.
All Tables
Table 1: X-ray observation log.
Table 2: Spitzer IRAC and MIPS flux density measurements (units of mJy).
Table 3: Tentative Spitzer IRS line fluxes derived from the SH and LH spectra.
Table 4: Spectral fits and quantile properties.
Table A.1: Comparison stars for the SMARTS photometry.
Table A.2: SMARTS average nightly magnitudes.
Table A.3: Villanova magnitudes.
All Figures
|
|
Figure 1: Spitzer IRAC images centered on V1118 Ori, taken pre-outburst in March 2004. The images are shown with a linear scale from 0 to 200 MJy sr-1. The Herbig Ae star V372 Ori is seen near V1118 Ori. |
| Open with DEXTER | |
| In the text | |
|
|
Figure 2: Spitzer IRS background-subtracted spectra obtained near the peak of the outburst (panels a) and b)) and after the outburst (panels c) and d)). Panel d) shows the SL and LL module data. Panels a), b), and c) show the SL spectra as thick black lines, whereas the SH and LH spectra are shown as red and blue lines. Detected emission lines are labeled (while other lines well-subtracted by the background spectrum are shown in italics). |
| Open with DEXTER | |
| In the text | |
|
|
Figure 3: Zoomed in regions of the Spitzer IRS background-subtracted spectra. The post-outburst spectra are shown in the bottom panel, while the top two panels are for the outburst spectra. In the leftmost panels, we show both the high-resolution SH (thin, red) and the low-resolution SL (thick, black) data. Detected emission lines are labeled in the bottom panels (while other lines well-subtracted by the background spectrum are shown in italics). Observation dates applicable to each horizontal set of spectra are listed in the left panels. |
| Open with DEXTER | |
| In the text | |
|
|
Figure 4:
Light curves for the Chandra observations (0.4-6.0 keV range). The upper panels show the CCD energy of the events as a function
of time after the start of the observations, whereas the lower panels show count rate light curves ( |
| Open with DEXTER | |
| In the text | |
|
|
Figure 5:
Background-subtracted count rate light curves ( |
| Open with DEXTER | |
| In the text | |
|
|
Figure 6:
Optical ( |
| Open with DEXTER | |
| In the text | |
|
|
Figure 7:
Optical and near-infrared flux densities (averaged within |
| Open with DEXTER | |
| In the text | |
|
|
Figure 8:
Color-color diagrams based on the |
| Open with DEXTER | |
| In the text | |
|
|
Figure 9:
Spitzer IRS SL spectra of V1118 Ori for the three epochs (left panel). The dotted line shows the fit to the underlying continuum in the [6-8, 13-14.5] |
| Open with DEXTER | |
| In the text | |
|
|
Figure 10: Magnitude versus color indices for the different time intervals (red: #1, lime: #2, violet: #3, blue: #4, green: #5, black: #6). |
| Open with DEXTER | |
| In the text | |
|
|
Figure 11: Color index diagrams for the same time intervals as in Fig. 10. An AV=1 mag vector is added using the reddening law of Rieke et al. (1985). The loci of unreddened main sequence and giant stars (Bessell & Brett 1988) are shown for the near-infrared panels as solid and dotted curves, respectively. Finally the loci of classical T Tauri stars (Meyer et al. 1997) are shown as a dashed line in the (J-H) vs. (H-K) diagram. |
| Open with DEXTER | |
| In the text | |
|
|
Figure 12: Compilation of the optical and infrared photometry taken before, during, and just after the outburst (see text and caption of Fig. 10 for details about colors). The IRS SL and LL spectra and a reddened (AV = 1.5 mag) stellar atmosphere model are also shown. |
| Open with DEXTER | |
| In the text | |
|
|
Figure 13: Median magnitude difference relative to quiescence as a function of wavelength. The same time intervals as in Fig. 10 are used for the color coding (lime filled circles: #2, violet triangles: #3, blue diamonds: #4, green stars: #5). In the initial phase of the outburst, a strong optical component developed, with a peak in the V band. |
| Open with DEXTER | |
| In the text | |
|
|
Figure 14:
Probability distribution of the parameters (
|
| Open with DEXTER | |
| In the text | |
|
|
Figure 15: The best-fit models to the ``quiescent'' SED (left) and to the peak outburst SED (right). The direct stellar contribution (including emission by the hot spot) is shown as a dotted line (the AV = 1.5 mag reddened stellar atmosphere model is shown as a dash-dotted line), the thermal disk spectrum as a dashed line. |
| Open with DEXTER | |
| In the text | |
|
|
Figure B.1: Spitzer IRS high-resolution post-outburst spectra (thick curve) degraded to the resolution of the SL and LL modules. The latter data are shown as well (thin curve). Note the good agreement in the continuum and for most lines, except for [Ne II]. |
| Open with DEXTER | |
| In the text | |
|
|
Figure B.2:
Spitzer MIPS 24 |
| Open with DEXTER | |
| In the text | |
Copyright ESO 2010
Current usage metrics show cumulative count of Article Views (full-text article views including HTML views, PDF and ePub downloads, according to the available data) and Abstracts Views on Vision4Press platform.
Data correspond to usage on the plateform after 2015. The current usage metrics is available 48-96 hours after online publication and is updated daily on week days.
Initial download of the metrics may take a while.