| Issue |
A&A
Volume 510, February 2010
|
|
|---|---|---|
| Article Number | A31 | |
| Number of page(s) | 11 | |
| Section | Extragalactic astronomy | |
| DOI | https://doi.org/10.1051/0004-6361/200912882 | |
| Published online | 04 February 2010 | |
SCG0018-4854: a young and dynamic compact group![[*]](/icons/foot_motif.png)
I. Kinematical analyses
V. Presotto1,2 - A. Iovino2 - E. Pompei3 - S. Temporin4
1 - Universitá degli Studi dell'Insubria,
via Valleggio 11, 22100 Como, Italy
2 -
INAF - Osservatorio Astronomico di Brera
via Brera 28, 20122 Milan, Italy
3 -
European Southern Observatory (ESO)
Alonso de Cordova 3107, Santiago, Chile
4 -
Institut für Astro- und Teilchenphysik, Universität Innsbruck,
Technikerstrasse 25, 6020 Innsbruck, Austria
Received 13 July 2009 / Accepted 20 September 2009
Abstract
Aims. It has been widely recognized that processes taking
place inside group environment could be important drivers of galaxy
evolution. Compact groups of galaxies in particular are excellent
laboratories for studying galaxy interactions and their effects on the
evolution of galaxies due to their high density and low velocity
dispersion. SCG0018-4854 is a remarkably high galaxy density and low
velocity dispersion group with evidence of a recent interaction. It has
been detected and analyzed at different wavelengths, but its kinematics
have never been studied in detail.
Methods. We obtained VLT FORS2 optical observations and present
spectroscopic and photometric evidence to illustrate how dramatically
galaxy interactions have affected each of the four group member
galaxies.
Results. For each galaxy, we detected peculiar kinematics and
evidence of recent star formation. In particular, the gas and stellar
radial velocity curves of two galaxies are irregular with a level of
asymmetry similar to that of other interacting galaxies. We discovered
a bar inside NGC 92 thereby revising a previous morphological
classification, and we obtained spectroscopic confirmation of the
galactic-scale outflow within NGC 89.
Conclusions. The peculiar kinematics and dynamical considerations provide a rough estimate of the age of the latest interaction of
![]() ,
suggesting that SCG0018-4854 is a young and dynamical group.
,
suggesting that SCG0018-4854 is a young and dynamical group.
Key words: galaxies: clusters: individual: SCG 0018-4854 - galaxies: interactions - galaxies: kinematics and dynamics
1 Introduction
Compact groups (CGs) are among the smallest and densest systems of galaxies in the universe, and they
are characterized by low velocity dispersions of the order of
![]()
![]() (Hickson et al. 1992). This is why they are excellent
laboratories for studying galaxy interactions and their effects on the evolution of galaxies.
Rubin et al. (1991) showed that 30% of spiral galaxies in CGs have distorted rotation
curves and another 30% irregular velocity patterns indicating that tidal interactions are frequent
and persist in CGs. Mendes de Oliveira & Hickson (1994) demonstrated that 43% of the galaxies in
their compact group sample exhibit morphological and/or kinematical distortions indicative of interactions
and/or mergers. Since these pioneering studies, it has been clear that interactions play an important
role in the evolution of groups. According to current dynamical models, galaxies belonging to groups
should interact violently and merge on a relatively short timescale
(Governato et al. 1996; Sulentic 1987; Barnes 1985). Yet, strong mergers in CGs are
rare (Mendes de Oliveira & Hickson 1994) and much effort has been made to establish the origin and fate of
these systems. Coziol & Plauchu-Frayn (2007) showed that galaxies in compact groups are
more likely to merge under dry conditions, after they have lost most of their gas in interactions with
galaxies. This hypothesis is corroborated by HI studies: Verdes-Montenegro et al. (2001) detected
perturbed distributions of neutral hydrogen in CGs. These results indicate that the evolution of CGs is
mainly dominated by galaxy interactions, continuous tidal stripping, and/or gas heating.
(Hickson et al. 1992). This is why they are excellent
laboratories for studying galaxy interactions and their effects on the evolution of galaxies.
Rubin et al. (1991) showed that 30% of spiral galaxies in CGs have distorted rotation
curves and another 30% irregular velocity patterns indicating that tidal interactions are frequent
and persist in CGs. Mendes de Oliveira & Hickson (1994) demonstrated that 43% of the galaxies in
their compact group sample exhibit morphological and/or kinematical distortions indicative of interactions
and/or mergers. Since these pioneering studies, it has been clear that interactions play an important
role in the evolution of groups. According to current dynamical models, galaxies belonging to groups
should interact violently and merge on a relatively short timescale
(Governato et al. 1996; Sulentic 1987; Barnes 1985). Yet, strong mergers in CGs are
rare (Mendes de Oliveira & Hickson 1994) and much effort has been made to establish the origin and fate of
these systems. Coziol & Plauchu-Frayn (2007) showed that galaxies in compact groups are
more likely to merge under dry conditions, after they have lost most of their gas in interactions with
galaxies. This hypothesis is corroborated by HI studies: Verdes-Montenegro et al. (2001) detected
perturbed distributions of neutral hydrogen in CGs. These results indicate that the evolution of CGs is
mainly dominated by galaxy interactions, continuous tidal stripping, and/or gas heating.
Table 1: SCG0018-4854 galaxy properties.
It is therefore interesting to reconstruct the evolution and the interaction history of a CG by studying the properties of its galaxy members and comparing them with the group properties as a whole. Kinematical and dynamical information are fundamental in separating between different interaction histories. Mendes de Oliveira et al. (1998) defined some kinematic indicators to distinguish between merging and interaction, such as the misalignment between the kinematic and photometric axis of gas and stellar components, double gas components, warping, and other peculiarities. However, open questions remain about how many interactions take place and how strong and frequent they are.
In this work, we focus on SCG0018-4854, a spiral-only compact group characterized by an extremely dense environment in which member galaxies have clearly interacted.
The plan of the article is the following. In Sect. 2, we present the characteristics of SCG0018-4854. In Sect. 3, we describe our observations and the reduction process. In Sect. 4, we explain the methods used for our analysis. The results are presented in Sect. 5, followed, in Sect. 6, by a short discussion and our conclusions in Sect. 7.
2 SCG0018-4854
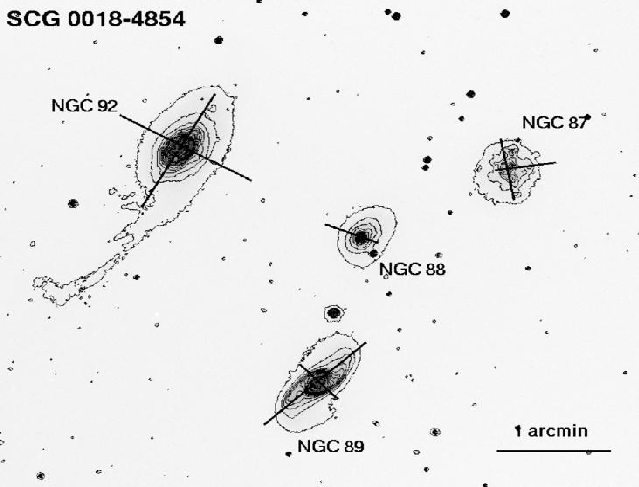
SCG0018-4854 is an extremely compact group of four late-type galaxies: NGC 92,
NGC 89, NGC 87 and NGC 88. It was originally listed in Rose's catalogue
(Rose 1977) and is part of the Southern Compact Group
catalogue (Iovino 2000). It is located at
![]() ,
which means that
,
which means that
![]() ,
adopting
,
adopting
![]() .
All galaxy members are within a projected distance of
.
All galaxy members are within a projected distance of ![]() 1
1
![]() 6
from the center of the group, where
6
from the center of the group, where
![]() corresponds to
corresponds to
![]() .
A possible fifth
member, ESO198-G013, is located at a distance of
.
A possible fifth
member, ESO198-G013, is located at a distance of ![]()
![]() in the E direction.
Furthermore, SCG0018-4854 has a remarkably low velocity dispersion,
in the E direction.
Furthermore, SCG0018-4854 has a remarkably low velocity dispersion, ![]()
![]() and high density,
and high density,
![]() on a log scale. Diffuse HI and X-ray
emission have been detected confirming its bound nature
(see Trinchieri et al. 2008; Pompei et al. 2007). The former data uncover a
common HI envelope and a possible bridge between two galaxies, NGC 92 and NGC 88; according to Verdes-Montenegro et al. (2001), this HI distribution is typical of
groups in phase 3b, i.e., with HI stripped from the galaxies and distributed in the
common potential or in tidal tails. X-ray observation have detected a hot
intergalactic medium,
on a log scale. Diffuse HI and X-ray
emission have been detected confirming its bound nature
(see Trinchieri et al. 2008; Pompei et al. 2007). The former data uncover a
common HI envelope and a possible bridge between two galaxies, NGC 92 and NGC 88; according to Verdes-Montenegro et al. (2001), this HI distribution is typical of
groups in phase 3b, i.e., with HI stripped from the galaxies and distributed in the
common potential or in tidal tails. X-ray observation have detected a hot
intergalactic medium,
![]() ,
in which the galaxies
are embedded. The
presence of both a warm and hot intergalactic diffuse medium is important not only as
evidence of the gravitationally bound nature of SCG0018-4854, but also as
proof of the galaxy interaction, even though it alone cannot explain the tidal structures.
All four close members have a disturbed morphology, a late-type appearance, and intense star formation activity,
as illustrated by early spectroscopic data (Coziol et al. 2000).
Here we list the main properties of each galaxy, while additional information can be found in
Table 1:
,
in which the galaxies
are embedded. The
presence of both a warm and hot intergalactic diffuse medium is important not only as
evidence of the gravitationally bound nature of SCG0018-4854, but also as
proof of the galaxy interaction, even though it alone cannot explain the tidal structures.
All four close members have a disturbed morphology, a late-type appearance, and intense star formation activity,
as illustrated by early spectroscopic data (Coziol et al. 2000).
Here we list the main properties of each galaxy, while additional information can be found in
Table 1:
- NGC 92 is a SAa pec starburst, also classified as a LINER by Coziol et al. (2000). It has a ring of star-forming regions close to its centre part and an extended tidal tail in the SE direction with many HII regions (Temporin et al. 2005). A peculiar extension in the tail direction is also detected in X-rays (Trinchieri et al. 2008). It has also been proposed to contain a double nucleus (Danks & Alcaino 1981). The galaxy has clearly undergone an interaction with one or several group members;
- NGC 89 is a SB0/a pec that has a Sy2 nucleus and
H
 -emitting extra-planar features with a filamentary structure on both sides
of the disk, including a
-emitting extra-planar features with a filamentary structure on both sides
of the disk, including a  4 kpc-long filament with a jet-like structure extending in the NE direction
(Temporin et al. 2005). It also has a ring of star-forming regions around the nucleus.
Interestingly, NGC 89 is the only galaxy of the group that was not detected in
HI (Pompei et al. 2007). It has probably lost its neutral gas after interacting with
other group members and the IGM;
4 kpc-long filament with a jet-like structure extending in the NE direction
(Temporin et al. 2005). It also has a ring of star-forming regions around the nucleus.
Interestingly, NGC 89 is the only galaxy of the group that was not detected in
HI (Pompei et al. 2007). It has probably lost its neutral gas after interacting with
other group members and the IGM;
- NGC 88 is the third spiral, SBab pec, of the group with a LINER nucleus. It forms an HI bridge with NGC 92 (Pompei et al. 2007);
- NGC 87 is a nearly face-on irregular galaxy, based on its axis ratio. It has many distinct regions of intense star formation.
SCG0018-4854 has been detected and analyzed at different wavelengths, but its kinematics has never been studied in detail. In this paper we present the first results of a kinematical analysis of galaxies in this group and we compare the member galaxy properties with those in HCG16. In a forthcoming paper (Temporin et al. in preparation), we will analyze in detail the photometric and morphological properties of each galaxy of SCG0018-4854, focusing on the likely age of the stellar populations and their correlation with morphological structures.
3 Observation and data reduction
The spectroscopic data were obtained with the FORS2 spectrograph at the VLT-UT1,
(Appenzeller et al. 1998) during an observing run in September 2001. The detector
was a
![]() CCD with a
scale of
CCD with a
scale of
![]() (we used the standard resolution collimator).
We acquired spectra using the spectroscopic mask mode (MXU), which enables a mask with slits of different length, width,
shape, and inclination to be created according to the observational demands. We designed two different masks,
one for all spectra along the major axis and another for all
spectra along the minor
axis. We were unable to observe the major axis of NGC 88 because of overlaps between the slits
in the same mask. We needed to use two different slits to cover the entire galaxy
extent of NGC 92 (both axis) and NGC 89 (major axis). The data consist of four
exposures of
(we used the standard resolution collimator).
We acquired spectra using the spectroscopic mask mode (MXU), which enables a mask with slits of different length, width,
shape, and inclination to be created according to the observational demands. We designed two different masks,
one for all spectra along the major axis and another for all
spectra along the minor
axis. We were unable to observe the major axis of NGC 88 because of overlaps between the slits
in the same mask. We needed to use two different slits to cover the entire galaxy
extent of NGC 92 (both axis) and NGC 89 (major axis). The data consist of four
exposures of
![]() for both masks, covering the major and the
minor axis. All slits are
for both masks, covering the major and the
minor axis. All slits are
![]() -wide and have different lengths, positions and inclinations with
respect to the dispersion axis. We used the GRISM-1400V with a dispersion of 20.8 Å mm-1,
corresponding to 0.49 Å px-1. The grism peak is at
5200 Å and the spectral coverage of each object spectra is
-wide and have different lengths, positions and inclinations with
respect to the dispersion axis. We used the GRISM-1400V with a dispersion of 20.8 Å mm-1,
corresponding to 0.49 Å px-1. The grism peak is at
5200 Å and the spectral coverage of each object spectra is ![]() 1000 Å in the 4500-5900 Å wavelength range according to the slit position
with respect to the center of the CCD. Figure 1 and
Tables 2 and 3 show the slit positions and properties. A set of
He-Cd-Hg-Ne lamp spectra were obtained for each observing night. The average
seeing was about
1000 Å in the 4500-5900 Å wavelength range according to the slit position
with respect to the center of the CCD. Figure 1 and
Tables 2 and 3 show the slit positions and properties. A set of
He-Cd-Hg-Ne lamp spectra were obtained for each observing night. The average
seeing was about
![]() throughout our exposures. The individual frames were
pre-reduced (e.g., bias subtraction, flat-field correction, etc.) using standard
IRAF
throughout our exposures. The individual frames were
pre-reduced (e.g., bias subtraction, flat-field correction, etc.) using standard
IRAF![]() image processing packages.
The wavelength calibration was performed using the IRAF twodspec.longslit package. Our spectra
have different inclination angles with respect to the dispersion axis. To rectify
them we adapted the parameters of the task reidentify forcing it to identify and calibrate
each lamp emission-line row by row. We verified our final wavelength solution using
available skylines row by row. We adopt the rms of the
image processing packages.
The wavelength calibration was performed using the IRAF twodspec.longslit package. Our spectra
have different inclination angles with respect to the dispersion axis. To rectify
them we adapted the parameters of the task reidentify forcing it to identify and calibrate
each lamp emission-line row by row. We verified our final wavelength solution using
available skylines row by row. We adopt the rms of the
![]() Å skyline
centroid distribution,
Å skyline
centroid distribution, ![]() 0.1 Å, to be the calibration accuracy.
The wavelength coverage for NGC 87 does not include any strong skyline so we verified
the calibration directly on lamp spectra. We obtained the same accuracy as above. We
found a systematic offset of
0.1 Å, to be the calibration accuracy.
The wavelength coverage for NGC 87 does not include any strong skyline so we verified
the calibration directly on lamp spectra. We obtained the same accuracy as above. We
found a systematic offset of ![]() 0.5 Å in the calibration of all spectra
along the major axis, which is probably caused by instrument flexure (see Gallart et al. 2001).
The final spectral resolution was measured to be 2.25 Å (FWHM of
0.5 Å in the calibration of all spectra
along the major axis, which is probably caused by instrument flexure (see Gallart et al. 2001).
The final spectral resolution was measured to be 2.25 Å (FWHM of
![]() skyline), equivalent to a velocity of
skyline), equivalent to a velocity of
![]() .
The sky subtraction was
performed using a narrow region,
.
The sky subtraction was
performed using a narrow region, ![]()
![]() ,
at both edges of the slit where there
was minimal galaxy contamination. Unfortunately, we could not remove the sky from the
spectrum along the major axis of NGC 87 because the galaxy covers the entire length of the slit and a
longer slit would have caused problems of overlap with the others. Our attempts to
reproduce the sky level reliably failed, so we preferred not to subtract it. We extracted 1D
spectra by binning each 2D spectrum along the spatial direction to ensure a
signal-to-noise ratio
,
at both edges of the slit where there
was minimal galaxy contamination. Unfortunately, we could not remove the sky from the
spectrum along the major axis of NGC 87 because the galaxy covers the entire length of the slit and a
longer slit would have caused problems of overlap with the others. Our attempts to
reproduce the sky level reliably failed, so we preferred not to subtract it. We extracted 1D
spectra by binning each 2D spectrum along the spatial direction to ensure a
signal-to-noise ratio
![]() at all radii. It should be noted that in the
central pixels, we have a
at all radii. It should be noted that in the
central pixels, we have a
![]() ,
and for this high S/N data we just take into account the
seeing when binning spectra to ensure that the data are uncorrelated spatially.
,
and for this high S/N data we just take into account the
seeing when binning spectra to ensure that the data are uncorrelated spatially.
|
Figure 1: R-band image of SCG0018-4854 with the slits and isointensity contours overlayed. North is up and east to the left. |
| Open with DEXTER | |
Table 2: Slit properties of the mask along the major axis.
Table 3: Slit properties of the mask along the minor axis.
4 Analysis method
4.1 Radial velocity curves
Stellar kinematics was derived using the cross-correlation technique (Tonry & Davis 1979)
with the IRAF RVSAO package. The cross-correlation was performed for a wavelength range of
![]() 900 Å about the main absorption features of the Mg line triplet (
900 Å about the main absorption features of the Mg line triplet (
![]() Å). We decided to use the nuclear spectra of each galaxy as a template, thereby
minimizing problems caused by template mismatch. In this way, we derived the relative velocities at
various distances from the nucleus and so constructed the stellar radial velocity curve.
Errorbars were derived by adding in quadrature the contributions from photon statistics, CCD read-out
noise, and calibration accuracy. We notice that the stellar errorbars are
always larger than those of the gas ones because the stellar cross-correlation was performed in a
wavelength range with few absorption lines. Furthermore, those present in the spectra are quite weak, causing the fit
to have a large error.
Å). We decided to use the nuclear spectra of each galaxy as a template, thereby
minimizing problems caused by template mismatch. In this way, we derived the relative velocities at
various distances from the nucleus and so constructed the stellar radial velocity curve.
Errorbars were derived by adding in quadrature the contributions from photon statistics, CCD read-out
noise, and calibration accuracy. We notice that the stellar errorbars are
always larger than those of the gas ones because the stellar cross-correlation was performed in a
wavelength range with few absorption lines. Furthermore, those present in the spectra are quite weak, causing the fit
to have a large error.
To obtain the systemic velocity of each galaxy, we performed a second cross-correlation with a radial velocity standard star extracted from the ESO archive. We used HD 36 003, a K star, using an observing set-up that matches that of our data well. We assumed that the photometric center coincides with the dynamical one, and we defined the systemic velocity of each galaxy to be that obtained by a cross-correlation between the standard star and the center of the galaxy along the major axis. All quoted velocities are corrected to the heliocentric reference system.
As already discussed, we could not measure the stellar kinematics of NGC 87 along the major axis because of the presence of sky contamination. We therefore decided to use the value of velocity measured at the center of the galaxy in the minor axis spectrum as the systemic velocity.
The ionized gas kinematics were measured by applaing a Gaussian fit to the main emission lines present in the
spectra (H![]() ,
[OIII]
,
[OIII]
![]() )
using the IRAF onedspec.splot task. We derived
the errors by adding in quadrature both the calibration accuracy and the formal errors given as output by the
fitting routine.
)
using the IRAF onedspec.splot task. We derived
the errors by adding in quadrature both the calibration accuracy and the formal errors given as output by the
fitting routine.
We discovered multiple components in the emission line profile of
NGC 92 and NGC 89. In the case of NGC 92, we found two components that we used the deblending function
of SPLOT to separate, obtaining errorbars as described above. For NGC 89, the emission profile is quite
complex, and may indeed represent three or more overlapping components (see Sect. 5.2).
We therefore used the task NGAUSSFIT to attempt to deblend them. In
this case, the errorbars of gas velocities are found to be the sum in
quadrature of uncertainties from four different sources: (1) the finite
slit width, which introduces an uncertainty of 1.2 Å; (2) the rms
of the peak centroid for different fitting solutions that were obtained
by perturbing the initial centroid guesses, which ranges between 0.01
and 0.5; Å according to the component; (3) the error in the
best-fit solution, which ranges between 0.001 and 0.5 Å; and
(4) the calibration accuracy of 0.1 Å. All of these terms infer a
velocity error that ranges between
![]() according to
the component.
according to
the component.
4.2 Asymmetry parameter
We wished to detect any sign of interactions and how they had affected the kinematical
properties of the galaxies. As we have said, most galaxies in groups have irregular or anomalous rotation curves
so we attempted to quantify any asymmetry. As an indicator we used the asymmetry parameter, AP,
described by Dale et al. (2001)
![\begin{displaymath}\mathit{AP}=\sum\frac{\left\vert\left\vert\mathit{V(R)}\right...
...gma^{2}(\mathit{R})+\sigma^{2}(\mathit{-R})}}\right]^{-1}\cdot
\end{displaymath}](/articles/aa/full_html/2010/02/aa12882-09/img40.png)
This parameter takes into account the different behaviors of the kinematically folded approaching and receding halves, so quantifies any possible asymmetries in the observed rotation curves. The error in AP was estimated as follows for each velocity measurement, V(Ri), we generated a normal velocity distribution centred on V(Ri) with a dispersion
5 Results
5.1 Kinematics of NGC 92
In Fig. 2, we present the stellar (filled circles) and gas (open circles) radial
velocity curves of NGC 92 along both the major (panel a) and the minor (panel b)
axes. The kinematics along the major axis has two important features: i) at each radius, the gas
rotates faster than the stars, the former reaching a maximal velocity of
![]() ,
and the latter a maximum of
,
and the latter a maximum of
![]() ;
ii) While the stars exhibit a regular radial velocity
curve, the gas radial velocity curve is asymmetric with respect to the center of the galaxy. There
is a steep rise in
;
ii) While the stars exhibit a regular radial velocity
curve, the gas radial velocity curve is asymmetric with respect to the center of the galaxy. There
is a steep rise in
![]() up to
up to
![]() within 1 kpc
in the NW direction, whereas on the other side the gas velocity reaches only
within 1 kpc
in the NW direction, whereas on the other side the gas velocity reaches only
![]() .
We discover that the gas also rotates along the minor axis (see Fig. 2).
.
We discover that the gas also rotates along the minor axis (see Fig. 2).
![\begin{figure}
\par\resizebox{9cm}{!}{\includegraphics[angle=-90]{12882f2.eps}}
\end{figure}](/articles/aa/full_html/2010/02/aa12882-09/img50.png)
|
Figure 2: Gas (open circles) and stellar (filled circles) kinematics along the major panel a) and minor panel b) axis of NGC 92. |
| Open with DEXTER | |
The emission-line profiles of H![]() and [OIII]
and [OIII]
![]() along the
minor axis detect a secondary component in addition to the main one.
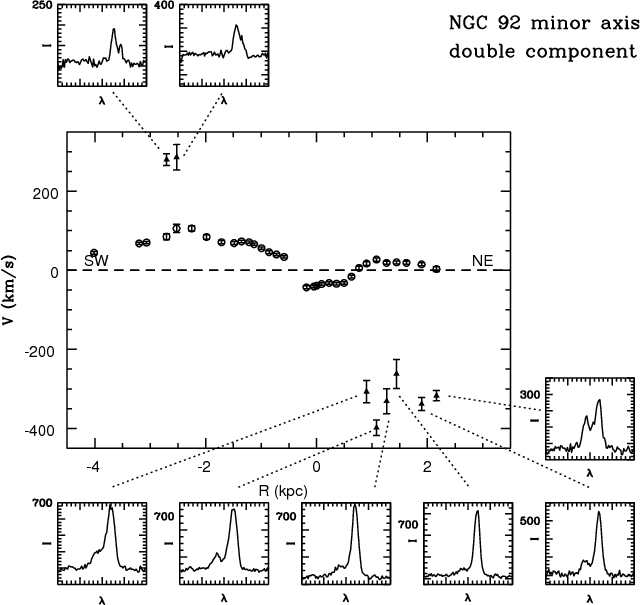
In Fig. 3, we show the position-velocity diagram with both the main
(open circles) and the second (filled triangles) component of gas along the minor axis of NGC 92.
The smaller panels show the zoom of 1D spectra in the range 5040-5080 Å of the [OIII] emission line at
each position where we were able to measure both components. Close to the nucleus, an asymmetry in the profile
is indicative of a second component, and at
along the
minor axis detect a secondary component in addition to the main one.
In Fig. 3, we show the position-velocity diagram with both the main
(open circles) and the second (filled triangles) component of gas along the minor axis of NGC 92.
The smaller panels show the zoom of 1D spectra in the range 5040-5080 Å of the [OIII] emission line at
each position where we were able to measure both components. Close to the nucleus, an asymmetry in the profile
is indicative of a second component, and at ![]()
![]() from the nucleus, an additional second peak is clearly
evident, as shown in the smaller panels of Fig. 3.
At distances greater than
from the nucleus, an additional second peak is clearly
evident, as shown in the smaller panels of Fig. 3.
At distances greater than
![]() ,
we do not detect the second component anymore.
,
we do not detect the second component anymore.
|
Figure 3: Position-velocity diagram with both the main (open circles) and the second (filled triangles) component of gas along the minor axis of NGC 92. Smaller panels show the zoom of 1D spectra in the range 5040-5080 Å containing the [OIII] emission line at each position where we were able to measure both components. |
| Open with DEXTER | |
The velocity gap between the components is
![]() in the SW direction, whereas it reaches
in the SW direction, whereas it reaches
![]() in the
NE direction. There are two possible explanations of this double component: we are either detecting
infalling gas with extra-planar motions (Fraternali & Binney 2008) or the two components trace
the well known eight-shape caused by a bar (Kuijken & Merrifield 1995).
To understand which of the two proposed explanations is more likely, we
inspected the
in the
NE direction. There are two possible explanations of this double component: we are either detecting
infalling gas with extra-planar motions (Fraternali & Binney 2008) or the two components trace
the well known eight-shape caused by a bar (Kuijken & Merrifield 1995).
To understand which of the two proposed explanations is more likely, we
inspected the ![]() -band and the continuum-subtracted H
-band and the continuum-subtracted H![]() + [NII] images
+ [NII] images![]() of NGC 92 (hereafter H
of NGC 92 (hereafter H![]() refers to
H
refers to
H![]() + [NII]). The
+ [NII]). The ![]() -band image was obtained with SOFI at NTT and has a scale of
-band image was obtained with SOFI at NTT and has a scale of
![]() ,
whereas the H
,
whereas the H![]() image was obtained with FORS2 and
has a scale of
image was obtained with FORS2 and
has a scale of
![]() .
These data will be presented and analyzed in detail
in a forthcoming paper (Temporin et al. in preparation). Here we just report a few
morphological details of the inner regions of NGC 92 that are particularly useful to our
interpretation of the kinematic features. The two images are shown in Fig. 4.
The
.
These data will be presented and analyzed in detail
in a forthcoming paper (Temporin et al. in preparation). Here we just report a few
morphological details of the inner regions of NGC 92 that are particularly useful to our
interpretation of the kinematic features. The two images are shown in Fig. 4.
The ![]() image clearly shows a bar, thus
corroborating the hypothesis that the second gas component along the minor axis is related to
a bar. From the comparison with the H
image clearly shows a bar, thus
corroborating the hypothesis that the second gas component along the minor axis is related to
a bar. From the comparison with the H![]() image, it also appears to be clear that the H
image, it also appears to be clear that the H![]() bright knot to the SE of the galaxy nucleus, thought to be a secondary nucleus,
is the elbow of an inner proceeding spiral arm. In Sect. 6, we explore and discuss the implications of the presence
of a bar for NGC 92.
bright knot to the SE of the galaxy nucleus, thought to be a secondary nucleus,
is the elbow of an inner proceeding spiral arm. In Sect. 6, we explore and discuss the implications of the presence
of a bar for NGC 92.
| Figure 4:
|
|
| Open with DEXTER | |
In Fig. 5, we show the folding of the stellar (panel a) and the gas (panel b) radial
velocity curves and their AP. The behavior of the stars looks quite regular,
whereas the gas is far more perturbed. We obtain AP values of 11% ![]() 4% and
23%
4% and
23% ![]() 1% for the stars and the gas, respectively. Pedrosa et al. (2008)
used simulations to analyze the AP of interacting and unperturbed galaxies in CGs
and compare this with observations. They found that AP
1% for the stars and the gas, respectively. Pedrosa et al. (2008)
used simulations to analyze the AP of interacting and unperturbed galaxies in CGs
and compare this with observations. They found that AP ![]() 13-36% for the former and
AP
13-36% for the former and
AP ![]() 5-7% for the latter.
These two ranges of values are in good agreement with our estimates for the
observed velocity curves of the stars and the gas, respectively. Therefore, the stars of
NGC 92 are unperturbed or only slightly perturbed, while
the gas AP agrees with values obtained for other perturbed galaxies in groups. A mismatch between
the two sides of the rotation curve was also independently found by Torres-Flores et al. (2009)
based on Fabry-Perot data. They also found signs of secondary
kinematical components
and a possible signature of non-circular motions.
We refer to Sect. 6 for a detailed discussion.
5-7% for the latter.
These two ranges of values are in good agreement with our estimates for the
observed velocity curves of the stars and the gas, respectively. Therefore, the stars of
NGC 92 are unperturbed or only slightly perturbed, while
the gas AP agrees with values obtained for other perturbed galaxies in groups. A mismatch between
the two sides of the rotation curve was also independently found by Torres-Flores et al. (2009)
based on Fabry-Perot data. They also found signs of secondary
kinematical components
and a possible signature of non-circular motions.
We refer to Sect. 6 for a detailed discussion.
![\begin{figure}
\par\resizebox{9cm}{!}{\includegraphics[angle=-90]{12882f5.eps}}
\end{figure}](/articles/aa/full_html/2010/02/aa12882-09/img59.png)
|
Figure 5: Folding of the stellar panel a) and the gas panel b) radial velocity curve of NGC 92. Triangles are used to represent the receding side, in NW direction and squares the proceeding side, in SE direction. The AP values obtained for the stars and the gas are indicated. |
| Open with DEXTER | |
Additional emission lines are detected in both the nucleus of NGC 92 and the surrounding regions.
These are HeI
![]() 5015.68, 5875.6, [NI]
5015.68, 5875.6, [NI]
![]() ,
and
[NII]
,
and
[NII]
![]() .
Some of these lines require a sufficiently hard ionizing radiation source
(Osterbrock & Ferland 2006) and, therefore, are normally found in regions photoionized by
AGN radiation,
or in regions of strong and recent star formation, although most of them are generally
difficult to detect because of their weakness. It is interesting to note that
the (usually very weak) HeI
.
Some of these lines require a sufficiently hard ionizing radiation source
(Osterbrock & Ferland 2006) and, therefore, are normally found in regions photoionized by
AGN radiation,
or in regions of strong and recent star formation, although most of them are generally
difficult to detect because of their weakness. It is interesting to note that
the (usually very weak) HeI ![]() 5015.68 emission-line was detected only in correspondence
with the elbow of the inner spiral arm, where additional data (not presented here) provides evidence of
the explosion of a supernova in the year 1999 (Temporin et al., in preparation).
The [NII]
5015.68 emission-line was detected only in correspondence
with the elbow of the inner spiral arm, where additional data (not presented here) provides evidence of
the explosion of a supernova in the year 1999 (Temporin et al., in preparation).
The [NII]
![]() line - which is a well known electronic temperature
indicator for the low ionization zones of gaseous nebulae, when combined with the more
easily detectable [NII]
line - which is a well known electronic temperature
indicator for the low ionization zones of gaseous nebulae, when combined with the more
easily detectable [NII]
![]() 6548, 6583
emission lines - is visible in both the same spectrum and the nuclear one.
Finally, the [NI] doublet is detected in the nucleus and in all spectra out
to 1.4 kpc NW and 2.1 kpc SE of the nucleus along the major axis.
Vaona et al. (in preparation), in a statistical study of the NLR of Sy2 galaxies
extracted from the SDSS, find that the [NI]
6548, 6583
emission lines - is visible in both the same spectrum and the nuclear one.
Finally, the [NI] doublet is detected in the nucleus and in all spectra out
to 1.4 kpc NW and 2.1 kpc SE of the nucleus along the major axis.
Vaona et al. (in preparation), in a statistical study of the NLR of Sy2 galaxies
extracted from the SDSS, find that the [NI]
![]() doublet
is detected in 8% of their sample (169 out of 2153 galaxies) and has a median ratio to
H
doublet
is detected in 8% of their sample (169 out of 2153 galaxies) and has a median ratio to
H![]() of
of ![]()
![]() .
This value is consistent with what we observe in the
nuclear region of NGC 92, which is classified as a LINER. Further out, the [NI]/H
.
This value is consistent with what we observe in the
nuclear region of NGC 92, which is classified as a LINER. Further out, the [NI]/H![]() ratio
assumes values of the order of a few 10-2, similar to those observed for HII regions
in other LINER galaxies (e.g., Díaz et al. 2000). These [NI] lines are even
observed in the presence
of relatively weak radiation fields, as in the partially ionized zones
of the Orion Nebula, and fluorescence is thought to play an important role in their
excitation (Bautista 1999).
ratio
assumes values of the order of a few 10-2, similar to those observed for HII regions
in other LINER galaxies (e.g., Díaz et al. 2000). These [NI] lines are even
observed in the presence
of relatively weak radiation fields, as in the partially ionized zones
of the Orion Nebula, and fluorescence is thought to play an important role in their
excitation (Bautista 1999).
5.2 Kinematics of NGC 89
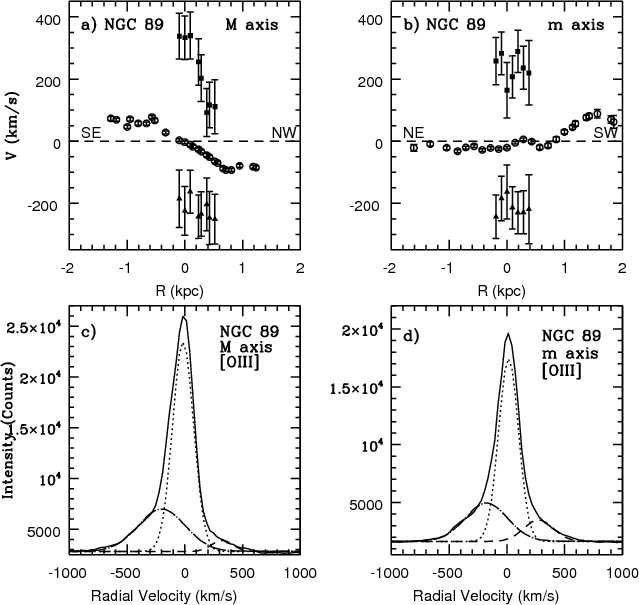
In Fig. 6, we present the stellar (filled circles) and gas (open circles)
radial velocity curves of NGC 89 along both the major (panel a) and the minor (panel b) axis.
Along the major axis, we can measure velocities only out to
![]() from the nucleus
and both the gas and the stars reach a maximum
from the nucleus
and both the gas and the stars reach a maximum
![]() .
In the inner regions,
.
In the inner regions,
![]() ,
gas and stars have similar kinematics, while further out
the gas has a slightly less regular pattern. In particular, we note that major discrepancies
occur at
,
gas and stars have similar kinematics, while further out
the gas has a slightly less regular pattern. In particular, we note that major discrepancies
occur at
![]() in the NW direction. The gas kinematics is also perturbed
along the minor axis: in the SW direction, the gas velocity starts to increase at
in the NW direction. The gas kinematics is also perturbed
along the minor axis: in the SW direction, the gas velocity starts to increase at
![]() and reaches
and reaches
![]() at
at
![]() .
We suggest that the gas kinematics is affected
by both the central AGN and the H
.
We suggest that the gas kinematics is affected
by both the central AGN and the H![]() -emitting extraplanar gas (see Sect. 2).
-emitting extraplanar gas (see Sect. 2).
![\begin{figure}
\par\resizebox{9cm}{!}{\includegraphics[angle=-90]{12882f6.eps}}
\end{figure}](/articles/aa/full_html/2010/02/aa12882-09/img71.png)
|
Figure 6: Gas (open circles) and stellar (filled circles) kinematics along the major panel a) and the minor panel b) axis of NGC 89. |
| Open with DEXTER | |
We observe that the emission-line profile of [OIII] is asymmetric and irregular because of the presence of multiple components, at least three, in the nuclear region. This kind of profile is typically observed in the narrow-line regions (NLR) of Sy2 galaxies. It is understood that photoionization and shocks play a dominant role in modifying the physical conditions of the gas (Kraemer & Crenshaw 2000; Veilleux et al. 2005; Dopita et al. 2002), although the dynamics of the gas in the NLR is less certain. The presence of blue-shifts and red-shifts on either side of the nucleus indicates that rotation alone cannot explain the observed radial velocities. Emission-line profiles can be reproduced by different kinematic models such as infall, outflow, rotation (Osterbrock & Mathews 1986; Veilleux 1991). The general idea is that radial outflows play an important role.
|
Figure 7:
NGC 89: position-velocity diagram along the major panel a) and the minor
panel b) axis and
the [OIII] emission-line profile obtained by summing 6 pixels (
|
| Open with DEXTER | |
![\begin{figure}
\par\resizebox{9cm}{!}{\includegraphics[angle=-90]{12882f8.eps}}
\end{figure}](/articles/aa/full_html/2010/02/aa12882-09/img74.png)
|
Figure 8: Multiple component of the [OIII] emission-line profile along the minor axis of NGC 89. We compare the fits to the profile using a combination of three ( left) or four ( right) Gaussians. In the bottom panels, we show residuals for both cases. The choice of four Gaussians, the main component (dotted line), two blue-shifted components (dot-dashed and short-long dashed line), and the red-shifted one (dashed line) provide more reliable results. |
| Open with DEXTER | |
|
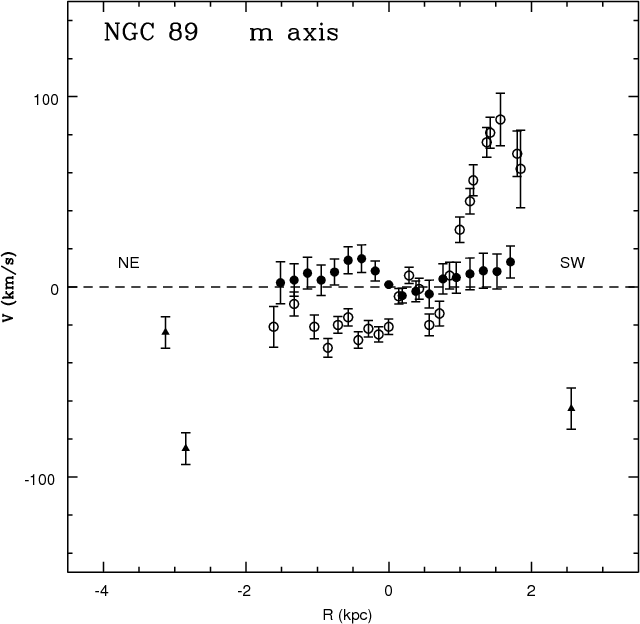
Figure 9: Kinematics along the minor axis of NGC 89. Measured radial velocities of the primary gas component (open circles), the secondary gas component (filled triangles), and the stars (filled circles) are plotted. The kinematics of the secondary gas component is consistent with the presence of an outflow. |
| Open with DEXTER | |
However, we note that this fourth component survives few pc away from the nucleus only
in NE direction, which is the same direction as the galactic-scale H![]() brightest filament.
We cannot exclude
that these two features are somehow linked to each other. The slit along the minor axis intercepts the
jet-like filament at three different points. We are therefore able to probe it
spectroscopically and compare its kinematics with that of the adjacent gas.
brightest filament.
We cannot exclude
that these two features are somehow linked to each other. The slit along the minor axis intercepts the
jet-like filament at three different points. We are therefore able to probe it
spectroscopically and compare its kinematics with that of the adjacent gas.
In Fig. 9, we plot the measured kinematics of the additional gas components (filled triangles) with the gas (open circles) and stellar (filled circles) radial velocity curves. The kinematics of the extraplanar gas is clearly decoupled from the disk gas kinematics. In the SW direction, the velocity of this gas component appears to an opposite sense to that of the disk gas. In the opposite direction, we have two measurement and there is a possible indication that the secondary gas component slows down as we go farther away from the center of the galaxy. The decoupled kinematics of the secondary gas component is compatible with the presence of an outflow. We discuss this possible interpretation in Sect. 6.3.
Once again, we estimated the asymmetry parameter. In Fig. 10, we show the
folded stellar (panel a) and gas (panel b) radial velocity curves and the relative AP.
We measure an AP value of 33% ![]() 6% and 24%
6% and 24% ![]() 4% for the stars and the gas, respectively.
These large values, as already mentioned in Sect. 5.1, are typical of strongly
perturbed galaxies. We refer to Sect. 6 for a more detailed discussion.
4% for the stars and the gas, respectively.
These large values, as already mentioned in Sect. 5.1, are typical of strongly
perturbed galaxies. We refer to Sect. 6 for a more detailed discussion.
![\begin{figure}
\par\resizebox{8.8cm}{!}{\includegraphics[angle=-90]{12882f10.eps}}
\end{figure}](/articles/aa/full_html/2010/02/aa12882-09/img82.png)
|
Figure 10: Folding of the stellar panel a) and gas panel b) radial velocity curve of NGC 89. Triangles are used for the receding side in the SE direction, and squares for the approaching side in the NW direction. The values of the AP for the gas and the stars are indicated. |
| Open with DEXTER | |
This galaxy also exhibits many emission lines in its nuclear spectrum, in particular
HeII
![]() .
This emission line can be observed in gas photoionized by the hard radiation field of an
active galactic nucleus or be produced by the wind of Wolf-Rayet (W-R) stars
(e.g., Crowther 2007), thus indicating that a recent burst of massive star formation may have occurred
(Schaerer & Vacca 1998). In W-R galaxies this emission line
is usually broad (although often accompanied by a narrow nebular component that is too weak relatively to be reliably
detected) and
forms the so-called ``W-R bump'' in the spectrum together with other
strong emission lines (e.g., of CIII, CIV, and NIII) in the wavelength range
.
This emission line can be observed in gas photoionized by the hard radiation field of an
active galactic nucleus or be produced by the wind of Wolf-Rayet (W-R) stars
(e.g., Crowther 2007), thus indicating that a recent burst of massive star formation may have occurred
(Schaerer & Vacca 1998). In W-R galaxies this emission line
is usually broad (although often accompanied by a narrow nebular component that is too weak relatively to be reliably
detected) and
forms the so-called ``W-R bump'' in the spectrum together with other
strong emission lines (e.g., of CIII, CIV, and NIII) in the wavelength range ![]() 4650-4690
(Schaerer & Vacca 1998, and references therein). Since the emission line that we observe is narrow,
is not accompanied by a W-R bump and other typical features of W-R galaxies, and is visible only
in the nuclear spectrum of NGC 89, we conclude that it is unlikely to be indicative of Wolf-Rayet stars, but
rather be the nebular emission produced by the ionizing radiation of the central AGN.
4650-4690
(Schaerer & Vacca 1998, and references therein). Since the emission line that we observe is narrow,
is not accompanied by a W-R bump and other typical features of W-R galaxies, and is visible only
in the nuclear spectrum of NGC 89, we conclude that it is unlikely to be indicative of Wolf-Rayet stars, but
rather be the nebular emission produced by the ionizing radiation of the central AGN.
5.3 Kinematics of NGC 87 and NGC 88
We describe the kinematical properties of the two remaining group members: NGC 87 and NGC 88.
In Fig. 11, we present the stellar (filled circles) and gas (open circles) radial velocity curves of NGC 87 along the minor axis (panel b), while along the major axis (panel a) we show only that of the gas (open circles). Our lack of stellar kinematical data along the major axis is caused by problems in sky subtraction that made the use of XCSAO impossible (see Sect. 4). The gas shows a velocity gradient along both axes upon which peculiar motions are superimposed. These peculiar motions relate to different regions of emission in the irregular galaxy. In both cases, the velocity gradient is a regular trend with a significant velocity variation with respect to the errorbars and the velocity range of peculiar motions. Nevertheless, we cannot determine wheter if the velocity gradient is associated with either the whole galaxy or only a few regions, or if it represents a warp. The HI gas emission is more extended than the optical light and the emission looks asymmetric; the HI velocity field does not show any significant gradient, as it would for an almost face-on galaxy, except in the N/NE corner at approximately the same position where the velocity gradient measured in the optical exhibits the widest variation.
![\begin{figure}
\par\resizebox{9cm}{!}{\includegraphics[angle=-90]{12882f11.eps}}
\end{figure}](/articles/aa/full_html/2010/02/aa12882-09/img84.png)
|
Figure 11: Panel a) Gas (open circles) kinematics along the major axis of NGC 87. Panel b) Gas (open circles) and stellar (filled circles) kinematics along the minor axis of NGC 87. |
| Open with DEXTER | |
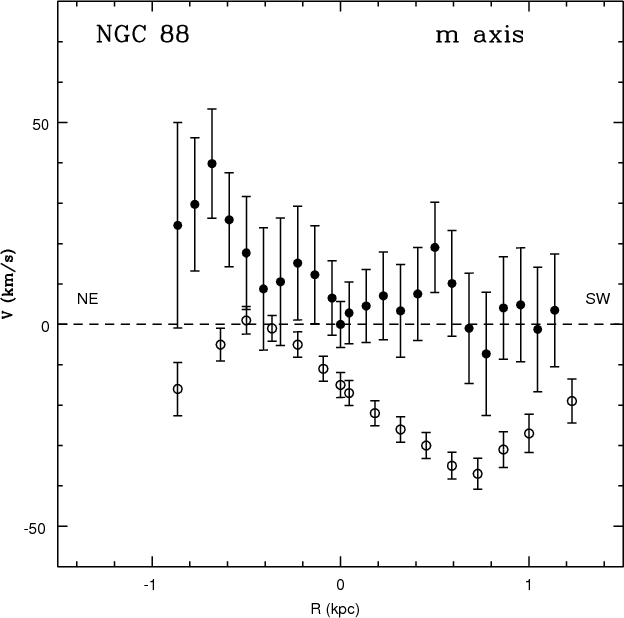
In Fig. 12, we show the stars (filled circles) and gas (open circles) kinematics along the minor axis of NGC 88. The gas shows a sinusoidal pattern that possibly indicates a regular rotation. Once again, the ionized gas moves on extra-planar orbits. This type of kinematics is common in galaxy bulges (Coccato et al. 2004) and could be generated by a triaxial bulge or a bar. Kinematical information along the major axis is needed to find out which hypothesis is more likely (Corsini et al. 2003).
6 Discussion
6.1 Kinematical effects of the interaction on galaxies involved
NGC 92 has clearly interacted with one or several group members as suggested by the extended tidal tail. We discuss the kinematical effects of this interaction and the most probable other interacting galaxy or galaxies.
The stellar radial velocity curve of NGC 92 is only moderately perturbed, whereas the gas has an asymmetric radial
velocity curve. The receding side has a steeper rise than the approaching one. We note that the
approaching side is in the direction of the tidal tail and we assume that the tail affects the gas
kinematics by keeping velocities at an approximately constant value of
![]() .
This is consistent with HI data: neutral hydrogen velocities show a continuous trend between the tidal tail
and the approaching side of the galaxy disk, clearly suggesting a physical link between
the gas, disk, and tail (Pompei et al. 2007). Arp 295 is a similar case of interacting galaxies with
asymmetric rotation curves (Roche 2007). For Arp 295, the rotation curve also rises slowly
and monotonically on the side pointing towards the tail and the companion, whereas on the other side it
rises more steeply. Furthermore, interacting galaxies have been found to exhibit a correlation
between the star-formation rate (SFR) and perturbed kinematics (Keel 1993). The SFR increases as the rotation
curves become more asymmetric from normal to disturbed rotation curves.
Therefore, we expect to detect enhanced
star formation in NGC 92. Previous results of an H
.
This is consistent with HI data: neutral hydrogen velocities show a continuous trend between the tidal tail
and the approaching side of the galaxy disk, clearly suggesting a physical link between
the gas, disk, and tail (Pompei et al. 2007). Arp 295 is a similar case of interacting galaxies with
asymmetric rotation curves (Roche 2007). For Arp 295, the rotation curve also rises slowly
and monotonically on the side pointing towards the tail and the companion, whereas on the other side it
rises more steeply. Furthermore, interacting galaxies have been found to exhibit a correlation
between the star-formation rate (SFR) and perturbed kinematics (Keel 1993). The SFR increases as the rotation
curves become more asymmetric from normal to disturbed rotation curves.
Therefore, we expect to detect enhanced
star formation in NGC 92. Previous results of an H![]() study of SCG0018-4854 found that the
luminosity function of the HII regions of NGC 92 exhibits a considerable flattening at the high
luminosity end (Temporin et al. 2005). NGC 89 and NGC 88 are likely to be interacting with
NGC 92, and we have measured irregular radial velocity curves and peculiar kinematics for both galaxies.
study of SCG0018-4854 found that the
luminosity function of the HII regions of NGC 92 exhibits a considerable flattening at the high
luminosity end (Temporin et al. 2005). NGC 89 and NGC 88 are likely to be interacting with
NGC 92, and we have measured irregular radial velocity curves and peculiar kinematics for both galaxies.
NGC 89 has perturbed stellar and gas radial velocity curves, suggesting that it has interacted with other group members. Both the gas and stars have lower velocities on the receding side than the approaching one. This could be the result of different phenomena: (1) a disk warp, (2) streaming motions induced by an interaction, or a (3) combination of disk and spiral arm motions. Although currently unavailable for this galaxy, 3D spectroscopy would help us to distinguish among these possibilities. Anyway, it is interesting to note that neutral and molecular hydrogen studies of this galaxy support the hypothesis that NGC 89 has interacted in the past with other group members. NGC 89 has been completely stripped of its HI gas (Pompei et al. 2007) and CO observations show that it is also perturbed in its molecular gas distribution (Boselli et al. 1996). These facts suggest that also the perturbed kinematics of NGC 89 is a consequence of previous interactions, the most likely perturber being NGC 92.
NGC 88 shows a sinusoidal pattern of the gas velocities probably caused by a triaxial bulge or a nuclear bar. Both phenomena could be the result of an interaction. There is also an HI bridge between NGC 92 and NGC 88 (Pompei et al. 2007). Broad-band observations show a wide stellar tail extending from this galaxy towards the south-west (Temporin et al. in preparation).
The interaction process probably only partially involves NGC 87: we found velocity gradients along both axes which could be the result of a slight interaction with other members. A stronger encounter would probably disrupt galaxy more dramatically because of its irregular morphology and lower mass.
|
Figure 12: Gas (open circles) and stellar (filled circles) kinematics along the minor axis of NGC 88. |
| Open with DEXTER | |
6.2 The interaction strength and history of SCG0018-4854 galaxies
The suggestion that NGC 92 contains a double nucleus (Danks & Alcaino 1981) could imply
that this galaxy is a merger remnant. If this were the case, NGC 92 should have interacted violently
with a companion galaxy in the past. Our results show that even if the interaction has been strong,
we can exclude the hypothesis of a merger for NGC 92. The discovery of the nuclear bar indeed rejected the
hypothesis of a double nucleus. The comparison between ![]() -band and H
-band and H![]() images shows that the
bright knot is actually the elbow of the inner proceeding spiral arm that departs from the nuclear bar.
Therefore, NGC 92 should have interacted more recently and less strongly than the presence of a double nucleus
would suggest.
images shows that the
bright knot is actually the elbow of the inner proceeding spiral arm that departs from the nuclear bar.
Therefore, NGC 92 should have interacted more recently and less strongly than the presence of a double nucleus
would suggest.
However, it is well known that structures such as bars and rings could arise from galaxy interactions (Gerin et al. 1990; Lindblad 1961; Noguchi 1987). A direct tidal interaction acts as a destabilizing agent, reducing the bar formation timescale and accelerating the growth of the bar. Hence, we cannot exclude that the nuclear bar of NGC 92 be a product of its interaction with other group members and the presence of the tidal tail strengthens this hypothesis. Future 3D-spectroscopy could help us to understand the origin of the bar, e.g., gas inflow could be an evidence of recent bar formation. Furthermore, a detailed study of the star formation along the bar could help us to state whether the bar is linked to the interaction or not.
We try to quantify the interaction strength by estimating the asymmetry parameter
for the NGC 92 and NGC 89 radial velocity curves. Cluster galaxies have a mean AP of
12.6% ![]() 1.2% (Dale et al. 2001), while, as we have already said, galaxies
in groups have larger values. We measured AP values in the range 11-33%, which are
in agreement with values of other perturbed and interacting galaxies in CGs. The gas
is the first component to be affected by an interaction. The gas kinematics of both NGC 92
and NGC 89 have been strongly perturbed. In contrast,
stellar kinematics are perturbed if the interaction has been violent. Therefore,
since NGC 89 only shows perturbed stellar kinematics, we speculate that the interaction
was stronger for this galaxy than for NGC 92. Furthermore, taking into account that NGC 89 is the only galaxy of
the group depleted of HI we cannot exclude a more complicated interaction history for this galaxy. NGC 89 could have
interacted with the other group members several times, NGC 92 being the latest one. Otherwise, NGC 89 may have joined
the group only recently: the interaction with the group potential removed its gas before it interacted with NGC 92.
Hydrodynamical simulations could help us to infer the more likely
scenario. Some caution is necessary, since studies have shown that
the appearance of distortions in rotation curves is strongly dependent on the
viewing angle (Kronberger et al. 2006). In any case, there is a clear trend of
increasing AP for interacting galaxies. Pedrosa et al. (2008)
analyzed the evolution of AP in simulations of galaxy
encounters with varying set-up. They showed that AP rises at the
peri-passage by values of up to
1.2% (Dale et al. 2001), while, as we have already said, galaxies
in groups have larger values. We measured AP values in the range 11-33%, which are
in agreement with values of other perturbed and interacting galaxies in CGs. The gas
is the first component to be affected by an interaction. The gas kinematics of both NGC 92
and NGC 89 have been strongly perturbed. In contrast,
stellar kinematics are perturbed if the interaction has been violent. Therefore,
since NGC 89 only shows perturbed stellar kinematics, we speculate that the interaction
was stronger for this galaxy than for NGC 92. Furthermore, taking into account that NGC 89 is the only galaxy of
the group depleted of HI we cannot exclude a more complicated interaction history for this galaxy. NGC 89 could have
interacted with the other group members several times, NGC 92 being the latest one. Otherwise, NGC 89 may have joined
the group only recently: the interaction with the group potential removed its gas before it interacted with NGC 92.
Hydrodynamical simulations could help us to infer the more likely
scenario. Some caution is necessary, since studies have shown that
the appearance of distortions in rotation curves is strongly dependent on the
viewing angle (Kronberger et al. 2006). In any case, there is a clear trend of
increasing AP for interacting galaxies. Pedrosa et al. (2008)
analyzed the evolution of AP in simulations of galaxy
encounters with varying set-up. They showed that AP rises at the
peri-passage by values of up to ![]() 20% and it begins to decrease only after
20% and it begins to decrease only after
![]() .
In other words, AP
could be used as a timer of recent interactions.
Since SCG0018-4854 is a compact group, its galaxies are supposed to encounter each other many times
during their lives. We attempt to determine the age of the latest interaction among the galaxies
of this group by measuring the AP. Our estimated values of AP for the
gas and stars of NGC 92 and NGC 89 are large and indicative of a recent
interaction. Hence, NGC 92 and NGC 89 should have interacted within
the past
.
In other words, AP
could be used as a timer of recent interactions.
Since SCG0018-4854 is a compact group, its galaxies are supposed to encounter each other many times
during their lives. We attempt to determine the age of the latest interaction among the galaxies
of this group by measuring the AP. Our estimated values of AP for the
gas and stars of NGC 92 and NGC 89 are large and indicative of a recent
interaction. Hence, NGC 92 and NGC 89 should have interacted within
the past
![]() .
This is only an upper limit, since dynamical considerations on the
tidal tail infer a more recent interaction. A rough estimate of the age of the latest
interaction is given by
.
This is only an upper limit, since dynamical considerations on the
tidal tail infer a more recent interaction. A rough estimate of the age of the latest
interaction is given by
![]() ,
where
,
where
![]() is the tail extent of
is the tail extent of ![]()
![]() ,
and
,
and
![]() is the velocity at which rotation curves become flat. In the tail direction, V assumes an approximately
constant value of
is the velocity at which rotation curves become flat. In the tail direction, V assumes an approximately
constant value of ![]()
![]() ,
which implies that
,
which implies that
![]() .
.
The above considerations lead us to an estimated age of the latest interaction of
![]()
![]() ,
which is comparable with the crossing time of this group of
,
which is comparable with the crossing time of this group of
![]() (Pompei et al. 2007).
Additional constraints will be obtained by estimating of the age of the stellar populations by means of
a detailed photometric analysis, which will be the subject of the already mentioned forthcoming paper.
(Pompei et al. 2007).
Additional constraints will be obtained by estimating of the age of the stellar populations by means of
a detailed photometric analysis, which will be the subject of the already mentioned forthcoming paper.
6.3 A galactic-scale outflow in NGC 89
As mentioned in Sect. 2, the continuum-subtracted H![]() image
of NGC 89 shows the presence of ionised extra-planar gas (Temporin et al. 2005).
This gas appears to be organised in a
biconical structure departing from the central part of the disk and
extending roughly perpendicularly to the disk plane on both sides of the disk.
It has a filamentary structure and the prominent 4-kpc long jet-like structure
is possibly just the brightest of these filaments.
The origin and the nature of these H
image
of NGC 89 shows the presence of ionised extra-planar gas (Temporin et al. 2005).
This gas appears to be organised in a
biconical structure departing from the central part of the disk and
extending roughly perpendicularly to the disk plane on both sides of the disk.
It has a filamentary structure and the prominent 4-kpc long jet-like structure
is possibly just the brightest of these filaments.
The origin and the nature of these H![]() filaments
cannot be fully established with the data presently available,
but their geometry is consistent with them being a galactic-scale outflow.
This outflow could be driven by the combined action of an AGN and
a central starburst, whose presence is indicated by a ring of bright
H
filaments
cannot be fully established with the data presently available,
but their geometry is consistent with them being a galactic-scale outflow.
This outflow could be driven by the combined action of an AGN and
a central starburst, whose presence is indicated by a ring of bright
H![]() emitting regions in the central part of the galaxy.
The X-ray emission from NGC 89 was modelled as that of both an absorbed AGN and a diffuse
emission coming from the central starburst (Trinchieri et al. 2008).
However, we cannot exclude the possibility of an inflow. To discriminate
between an inflow and an outflow beyond any doubt, we would need a detailed
study of the interstellar absorption-line profiles, such as those of
NaI D
emitting regions in the central part of the galaxy.
The X-ray emission from NGC 89 was modelled as that of both an absorbed AGN and a diffuse
emission coming from the central starburst (Trinchieri et al. 2008).
However, we cannot exclude the possibility of an inflow. To discriminate
between an inflow and an outflow beyond any doubt, we would need a detailed
study of the interstellar absorption-line profiles, such as those of
NaI D
![]() 5890, 5896 Å (e.g., Rupke et al. 2005a).
5890, 5896 Å (e.g., Rupke et al. 2005a).
Although another possibility is that a minor merger
occurred recently and that a dwarf satellite was cannibalised by NGC 89, we find
this interpretation less likely. At least with the existing data, we could
find no trace of a secondary nucleus in NGC 89. A search of the
NED archive for the presence of dwarf satellites around the group found
only two galaxies within an Abell radius at a comparable redshift.
This suggests that SCG0018-4854 is genuinely isolated. However, we cannot
exclude that NGC 89 might have had a dwarf satellite that was disrupted by
a merger event. However, in the case of a
minor merger we would expect to observe structures such as tidal streams that
form loops and shells around the main galaxy or features resembling X-shaped
jets, as in the case of other systems that have been explained as the result
of the disruption of a dwarf galaxy cannibalized by its more massive companion
(e.g., Mrk 315 and NGC 1097; see Higdon & Wallin 2003; Ciroi et al. 2005).
The H![]() images, instead show a wide distribution of extra-planar gas on
both sides of the galaxy disk.
images, instead show a wide distribution of extra-planar gas on
both sides of the galaxy disk.
On the other hand, both AGN-driven and starburst-driven winds on the galaxy scale have been observed in other Seyfert 2 and starburst galaxies in both the local Universe and at higher redshifts (see Veilleux et al. 2005, for a review). Powerful large-scale outflows might be caused by strong starburst activity in the central regions of a galaxy with the consequent shock-heating and acceleration of ambient interstellar gas (e.g., Heckman et al. 1990). Simulations of starburst-driven galactic winds find that optically emitting filaments can be formed by fragmentation and acceleration of a cloud into a supersonic wind (Cooper et al. 2008). When radiative cooling is taken into account, these fragments survive to generate strands and filaments downstream of the original cloud position as seen in starburst-driven winds (Cooper et al. 2009). A well known case is that of M 82, which contains optical filaments whose velocities increase with radius (Shopbell & Bland-Hawthorn 1998). The observed morphologies and kinematics of outflowing gas on large scales is reminescent of the structures that we observed in NGC 89. By analysing a sample of infrared luminous starbursts, Rupke et al. (2005b) found that superwinds are ubiquitous in these galaxies and in most cases the outflowing gas has velocities of 100-200 km s-1.
Bomans et al. (1997), Tschöke et al. (2001), and Strickland et al. (2004)
demonstrated that a correlation exists between H![]() outflow structures and X-ray features.
Cooper et al. (2009) also found that the soft X-ray emission is produced by mass ablated
from the clouds and mixed with the surrounding gas. After
outflow structures and X-ray features.
Cooper et al. (2009) also found that the soft X-ray emission is produced by mass ablated
from the clouds and mixed with the surrounding gas. After
![]() ,
the fraction
of gas mixed into the surrounding gas is
,
the fraction
of gas mixed into the surrounding gas is ![]() 25%.
Hence, we would expect to observe some X-ray features correlated to the galactic-scale
filaments of NGC 89. Trinchieri et al. (2008) did not detect any X-ray feature linked to the
H
25%.
Hence, we would expect to observe some X-ray features correlated to the galactic-scale
filaments of NGC 89. Trinchieri et al. (2008) did not detect any X-ray feature linked to the
H![]() emission.
However, the total number counts of their X-ray observations and the presence of
two dominant components in the emission related to NGC 89, namely an absorbed AGN and
an unresolved component from binary systems, would make it extremely difficult to detect
a additional faint component related to the low surface brightness H
emission.
However, the total number counts of their X-ray observations and the presence of
two dominant components in the emission related to NGC 89, namely an absorbed AGN and
an unresolved component from binary systems, would make it extremely difficult to detect
a additional faint component related to the low surface brightness H![]() filaments tracing
the extra-planar gas (flux
filaments tracing
the extra-planar gas (flux
![]() ). Any interaction of the outflow with the IGM is also expected
to be very weak, since the IGM in which the members of SCG0018-4854 are embedded
is cooler (
). Any interaction of the outflow with the IGM is also expected
to be very weak, since the IGM in which the members of SCG0018-4854 are embedded
is cooler (
![]() )
and less dense
(
)
and less dense
(
![]() )
than that typically found in
other environments, such as groups with a central elliptical galaxy or the cores
of clusters (Trinchieri et al. 2008).
)
than that typically found in
other environments, such as groups with a central elliptical galaxy or the cores
of clusters (Trinchieri et al. 2008).
Our study of NGC 89 have found a complex gas kinematics in the inner regions: the galaxy emission-line profiles have multiple components along both the major and the minor axes. We have presented evidence of at least two secondary components along both axes: one blue-shifted and the other red-shifted. This type of composite motion is well known in literature for the NLR of Seyfert galaxies (Das et al. 2006, and references therein). However, a detailed kinematical model for the NLR is beyond the scope of this paper. The presence of a possible fourth component in the emission-line profile along the minor axis is intriguing as this component is visible only in the direction of the galactic-scale extra-planar features. If indeed a galactic-scale outflow is present, we cannot exclude a link between this outflow and the central engine.
In Sect 5.2, we probed the kinematics of the extra-planar gas at
a few positions.
The velocity difference of ![]()
![]() between the two measured
positions in the NE direction could be indicative of two
gas shells with different velocities due to the impact of the gas with the ISM.
Moreover, when going far away from the nucleus along the minor axis we found that
the gas accelerates in the SW direction, which is consistent with an outflow interpretation.
between the two measured
positions in the NE direction could be indicative of two
gas shells with different velocities due to the impact of the gas with the ISM.
Moreover, when going far away from the nucleus along the minor axis we found that
the gas accelerates in the SW direction, which is consistent with an outflow interpretation.
Therefore, the combined information derived from the kinematics and
the geometry of the ionised extraplanar gas favours an outflow scenario.
Marquez et al. (1998) studied a similar case: NGC 2992 is a Seyfert 1.9 galaxy with
an emission arc, visible in [OIII] and H![]() ,
which is interacting with its companion NGC
2993.
A radial outflow was added to the circular motion to account for the observed kinematics.
They found that the largest differences with respect to the model were found when going to larger distances
from the nucleus
and suggested that these are kinematically distinct regions where the gas could be perturbed
by the interaction of NGC 2992 with its close companion NGC 2993.
This could also be the case for NGC 89 since the HI velocity field implies that the
tidal tail of NGC 92 points towards the observer with a velocity comparable to that
of NGC 89 (Pompei et al. 2007)
,
which is interacting with its companion NGC
2993.
A radial outflow was added to the circular motion to account for the observed kinematics.
They found that the largest differences with respect to the model were found when going to larger distances
from the nucleus
and suggested that these are kinematically distinct regions where the gas could be perturbed
by the interaction of NGC 2992 with its close companion NGC 2993.
This could also be the case for NGC 89 since the HI velocity field implies that the
tidal tail of NGC 92 points towards the observer with a velocity comparable to that
of NGC 89 (Pompei et al. 2007)
With the currently available data, we are not able to establish the origin of the galactic-scale outflow. Integral-field spectroscopy would be useful in helping us to understand the outflow kinematics and constrain its origin.
6.4 Comparing SCG0018-4854 with HCG16
The extreme physical properties of SCG0018-4854 make it a very interesting and
rare group. It could be considered the southern counterpart of HCG16, the group
with the highest concentration of late-type active and interacting galaxies in
the nearby universe. Therefore, we compare its kinematic properties with
those found in the literature for HCG 16. The latest and most detailed kinematical
study of HCG16 was carried out by Mendes de Oliveira et al. (1998) using
Fabry-Perot data. They found kinematic peculiarities for three galaxies out of
the four originally listed in Hickson's catalogue (Hickson 1982).
They found a non-axisymmetric rotation curve with a velocity discrepancy of
![]() between the two sides and a slow rise in the central region. They
discovered a second component in the emission-line profile of
one galaxy. They detected the severe warping of the kinematic major axis of two
galaxies and finally the presence of a double nucleus and a peculiar bar-like
structure. Based on these results, they suggested that major merger events
have occurred in at
least two out of four galaxies. Our study finds that most of these kinematical
peculiarities are also present in SCG0018-4854, confirming that it is a
relatively dynamically young and active CG.
between the two sides and a slow rise in the central region. They
discovered a second component in the emission-line profile of
one galaxy. They detected the severe warping of the kinematic major axis of two
galaxies and finally the presence of a double nucleus and a peculiar bar-like
structure. Based on these results, they suggested that major merger events
have occurred in at
least two out of four galaxies. Our study finds that most of these kinematical
peculiarities are also present in SCG0018-4854, confirming that it is a
relatively dynamically young and active CG.
7 Conclusions
We have analyzed high signal-to-noise spectra along both the major and the minor axis
of each member galaxy of SCG0018-4854. Each galaxy has disturbed or peculiar kinematics.
Kinematic information is important in obtaining insight into the possible interaction
history of the galaxies. Different interaction scenarios, depending on the
strength and the geometry of the encounter and the morphological types of the interacting
systems, will leave different signatures on the galaxy kinematics. Following
Mendes de Oliveira et al. (1998), we found signs of disturbed velocity fields, asymmetric
rotation curves, multiple kinematical gas components, tidal tails, and nuclear activity.
All of these characteristics suggest that at least three out of four galaxies of SCG0018-4854
have been involved in a strong and recent interaction. We derived some constraints on
the age of the latest close interaction: ![]()
![]() .
The interaction has been strong enough to perturb the gas kinematics
up to a level of 24% for the gas of the two main galaxies. These results agree with the recent claim by
Torres-Flores et al. (2009) that this group is in an advanced stage of
interaction, based on the presence of young star-forming region, a
candidate tidal dwarf galaxy
identified in the UV, and the observed tidal tails. Finally, the results of our spectroscpic
analysis are consistent with the hypothesis of a large-scale outflow in NGC 89.
.
The interaction has been strong enough to perturb the gas kinematics
up to a level of 24% for the gas of the two main galaxies. These results agree with the recent claim by
Torres-Flores et al. (2009) that this group is in an advanced stage of
interaction, based on the presence of young star-forming region, a
candidate tidal dwarf galaxy
identified in the UV, and the observed tidal tails. Finally, the results of our spectroscpic
analysis are consistent with the hypothesis of a large-scale outflow in NGC 89.
In contrast to its evolved properties as a group, such as its high spatial density, the spatial distribution of HI, and the presence of a common hot IGM, SCG0018-4854 consists entirely of spiral galaxies and has a remarkably high fraction of active galaxies. This study has found kinematical signs of recent interactions among its members making SCG0018-4854 a dynamically young group, although its global properties are indicative of a more advanced stage of evolution.
Given the estimated age of the latest interaction, we could say that we catch these galaxies in the act of interacting. What about the future of this group? Hydrodynamical simulations could help us to understand the fate of SCG 0018-4854, a true isolated and interacting compact group.
AcknowledgementsWe are grateful to the anonymous referee for his/her prompt and constructive comments that helped us to improve this paper. This research has made use of the NASA/IPAC Extragalactic Database (NED) which is operated by the Jet Propulsion Laboratory, California Institute of Technology, under contract with the National Aeronautics and Space Administration. V.P. is grateful for support from the short term studentship DGDF 09/39 awarded by the European Southern Observatory (ESO).
References
- Appenzeller, I., Fricke, K., Fürtig, W., et al. 1998, The Messenger, 94, 1 [NASA ADS] [Google Scholar]
- Barnes, J. 1985, MNRAS, 215, 517 [NASA ADS] [CrossRef] [Google Scholar]
- Bautista, M. A. 1999, ApJ, 527, 474 [NASA ADS] [CrossRef] [Google Scholar]
- Belsole, E., Sauvageot, J.-L., Ponman, T. J., & Bourdin, H. 2003, A&A, 398, 1 [NASA ADS] [CrossRef] [EDP Sciences] [Google Scholar]
- Bomans, D. J., Chu, Y.-H., & Hopp, U. 1997, AJ, 113, 1678 [NASA ADS] [CrossRef] [Google Scholar]
- Boselli, A., Mendes de Oliveira, C., Balkowski, C., Cayatte, V., & Casoli, F. 1996, A&A, 314, 738 [NASA ADS] [Google Scholar]
- Ciroi, S., Afanasiev, V. L., Moiseev, A. V., et al. 2005, MNRAS, 360, 253 [NASA ADS] [CrossRef] [Google Scholar]
- Coccato, L., Corsini, E. M., Pizzella, A., et al. 2004, A&A, 416, 507 [NASA ADS] [CrossRef] [EDP Sciences] [Google Scholar]
- Cooper, J. L., Bicknell, G. V., Sutherland, R. S., & Bland-Hawthorn, J. 2008, ApJ, 674, 157 [NASA ADS] [CrossRef] [Google Scholar]
- Cooper, J. L., Bicknell, G. V., Sutherland, R. S., & Bland-Hawthorn, J. 2009, ArXiv e-prints [Google Scholar]
- Corsini, E. M., Pizzella, A., Coccato, L., & Bertola, F. 2003, A&A, 408, 873 [NASA ADS] [CrossRef] [EDP Sciences] [Google Scholar]
- Coziol, R., & Plauchu-Frayn, I. 2007, AJ, 133, 2630 [NASA ADS] [CrossRef] [Google Scholar]
- Coziol, R., Iovino, A., & de Carvalho, R. R. 2000, AJ, 120, 47 [NASA ADS] [CrossRef] [Google Scholar]
- Crowther, P. A. 2007, ARA&A, 45, 177 [NASA ADS] [CrossRef] [Google Scholar]
- Dale, D. A., Giovanelli, R., Haynes, M. P., Hardy, E., & Campusano, L. E. 2001, AJ, 121, 1886 [Google Scholar]
- Danks, A. C., & Alcaino, G. 1981, A&A, 98, 223 [NASA ADS] [Google Scholar]
- Das, V., Crenshaw, D. M., Kraemer, S. B., & Deo, R. P. 2006, AJ, 132, 620 [NASA ADS] [CrossRef] [Google Scholar]
- de Carvalho, R. R., & Coziol, R. 1999, AJ, 117, 1657 [NASA ADS] [CrossRef] [Google Scholar]
- Díaz, A. I., Castellanos, M., Terlevich, E., & Luisa García-Vargas, M. 2000, MNRAS, 318, 462 [NASA ADS] [CrossRef] [Google Scholar]
- Dopita, M. A., Groves, B. A., Sutherland, R. S., Binette, L., & Cecil, G. 2002, ApJ, 572, 753 [NASA ADS] [CrossRef] [Google Scholar]
- Fraternali, F., & Binney, J. J. 2008, MNRAS, 386, 935 [NASA ADS] [CrossRef] [Google Scholar]
- Gallart, C., Martínez-Delgado, D., Gómez-Flechoso, M. A., & Mateo, M. 2001, AJ, 121, 2572 [NASA ADS] [CrossRef] [Google Scholar]
- Gerin, M., Combes, F., & Athanassoula, E. 1990, A&A, 230, 37 [NASA ADS] [Google Scholar]
- Governato, F., Tozzi, P., & Cavaliere, A. 1996, ApJ, 458, 18 [NASA ADS] [CrossRef] [Google Scholar]
- Heckman, T. M., Armus, L., & Miley, G. K. 1990, ApJS, 74, 833 [NASA ADS] [CrossRef] [Google Scholar]
- Hickson, P. 1982, ApJ, 255, 382 [NASA ADS] [CrossRef] [Google Scholar]
- Hickson, P., Mendes de Oliveira, C., Huchra, J. P., & Palumbo, G. G. 1992, ApJ, 399, 353 [NASA ADS] [CrossRef] [EDP Sciences] [MathSciNet] [PubMed] [Google Scholar]
- Higdon, J. L., & Wallin, J. F. 2003, ApJ, 585, 281 [NASA ADS] [CrossRef] [Google Scholar]
- Iovino, A. 2000, in Small Galaxy Groups, ed. M. J. Valtonen, & C. Flynn, ASP Conf. Ser., 209, IAU Coll., 174, 25 [Google Scholar]
- Keel, W. C. 1993, AJ, 106, 1771 [NASA ADS] [CrossRef] [Google Scholar]
- Kraemer, S. B., & Crenshaw, D. M. 2000, ApJ, 544, 763 [NASA ADS] [CrossRef] [Google Scholar]
- Kronberger, T., Kapferer, W., Schindler, S., et al. 2006, A&A, 458, 69 [NASA ADS] [CrossRef] [EDP Sciences] [Google Scholar]
- Kuijken, K., & Merrifield, M. R. 1995, ApJ, 443, L13 [NASA ADS] [CrossRef] [Google Scholar]
- Lindblad, P. O. 1961, Sov. Astron., 5, 376 [NASA ADS] [Google Scholar]
- Marquez, I., Boisson, C., Durret, F., & Petitjean, P. 1998, A&A, 333, 459 [NASA ADS] [Google Scholar]
- Mendes de Oliveira, C., & Hickson, P. 1994, ApJ, 427, 684 [NASA ADS] [CrossRef] [Google Scholar]
- Mendes de Oliveira, C., Plana, H., Amram, P., Bolte, M., & Boulesteix, J. 1998, ApJ, 507, 691 [NASA ADS] [CrossRef] [Google Scholar]
- Noguchi, M. 1987, MNRAS, 228, 635 [NASA ADS] [Google Scholar]
- Osterbrock, D. E., & Ferland, G. J. 2006, Astrophysics of gaseous nebulae and active galactic nuclei, ed. G. J. Osterbrock, & D. E. Ferland [Google Scholar]
- Osterbrock, D. E., & Mathews, W. G. 1986, ARA&A, 24, 171 [NASA ADS] [CrossRef] [Google Scholar]
- Pedrosa, S., Tissera, P. B., Fuentes-Carrera, I., & Mendes de Oliveira, C. 2008, A&A, 484, 299 [NASA ADS] [CrossRef] [EDP Sciences] [Google Scholar]
- Pompei, E., Dahlem, M., & Iovino, A. 2007, A&A, 473, 399 [NASA ADS] [CrossRef] [EDP Sciences] [Google Scholar]
- Ribeiro, A. L. B., de Carvalho, R. R., Coziol, R., Capelato, H. V., & Zepf, S. E. 1996, ApJ, 463, L5 [NASA ADS] [CrossRef] [Google Scholar]
- Roche, N. D. 2007, Rev. Mex. Astron. Astrofis., 43, 179 [NASA ADS] [Google Scholar]
- Rose, J. A. 1977, ApJ, 211, 311 [NASA ADS] [CrossRef] [Google Scholar]
- Rubin, V. C., Hunter, D. A., & Ford, W. K. J. 1991, ApJS, 76, 153 [NASA ADS] [CrossRef] [Google Scholar]
- Rupke, D. S., Veilleux, S., & Sanders, D. B. 2005a, ApJ, 632, 751 [Google Scholar]
- Rupke, D. S., Veilleux, S., & Sanders, D. B. 2005b, ApJS, 160, 115 [NASA ADS] [CrossRef] [Google Scholar]
- Schaerer, D., & Vacca, W. D. 1998, ApJ, 497, 618 [NASA ADS] [CrossRef] [Google Scholar]
- Shopbell, P. L., & Bland-Hawthorn, J. 1998, ApJ, 493, 129 [NASA ADS] [CrossRef] [Google Scholar]
- Strickland, D. K., Heckman, T. M., Colbert, E. J. M., Hoopes, C. G., & Weaver, K. A. 2004, ApJS, 151, 193 [NASA ADS] [CrossRef] [Google Scholar]
- Sulentic, J. W. 1987, ApJ, 322, 605 [NASA ADS] [CrossRef] [Google Scholar]
- Temporin, S., Ciroi, S., Iovino, A., et al. 2005, Starbursts: From 30 Doradus to Lyman Break Galaxies, ed. R. de Grijs, & R. M. González Delgado, Ap&SS Library, 329, 78P [Google Scholar]
- Tonry, J., & Davis, M. 1979, AJ, 84, 1511 [NASA ADS] [CrossRef] [Google Scholar]
- Torres-Flores, S., Mendes de Oliveira, C., de Mello, D. F., et al. 2009, A&A, 507, 723 [NASA ADS] [CrossRef] [EDP Sciences] [Google Scholar]
- Trinchieri, G., Iovino, A., Pompei, E., et al. 2008, A&A, 484, 195 [NASA ADS] [CrossRef] [EDP Sciences] [Google Scholar]
- Tschöke, D., Bomans, D. J., Hensler, G., & Junkes, N. 2001, A&A, 380, 40 [NASA ADS] [CrossRef] [EDP Sciences] [Google Scholar]
- Veilleux, S. 1991, ApJS, 75, 383 [NASA ADS] [CrossRef] [Google Scholar]
- Veilleux, S., Cecil, G., & Bland-Hawthorn, J. 2005, ARA&A, 43, 769 [Google Scholar]
- Verdes-Montenegro, L., Yun, M. S., Williams, B. A., et al. 2001, A&A, 377, 812 [NASA ADS] [CrossRef] [EDP Sciences] [Google Scholar]
Footnotes
- ... group
- Based on observations collected at the European Southern Observatory, Cerro Paranal, Chile (proposal: 267.A-5722(A)).
- ...
IRAF
- IRAF is distributed by the National Optical Astronomy Observatories, which are operated by the Association of Universities for Research in Astronomy, Inc., under cooperative agreement with the National Science Foundation.
- ... images
- The [NII]/H emission line
ratios evaluated within several regions of the galaxy by means of lower resolution spectra (not presented in this paper)
together with the shape of the narrow-band filter transmission curve show that the [NII] emission lines
contribute roughly 11.5% of the flux in the narrow-band image.
All Tables
Table 1: SCG0018-4854 galaxy properties.
Table 2: Slit properties of the mask along the major axis.
Table 3: Slit properties of the mask along the minor axis.
All Figures
|
|
Figure 1: R-band image of SCG0018-4854 with the slits and isointensity contours overlayed. North is up and east to the left. |
| Open with DEXTER | |
| In the text | |
|
|
Figure 2: Gas (open circles) and stellar (filled circles) kinematics along the major panel a) and minor panel b) axis of NGC 92. |
| Open with DEXTER | |
| In the text | |
|
|
Figure 3: Position-velocity diagram with both the main (open circles) and the second (filled triangles) component of gas along the minor axis of NGC 92. Smaller panels show the zoom of 1D spectra in the range 5040-5080 Å containing the [OIII] emission line at each position where we were able to measure both components. |
| Open with DEXTER | |
| In the text | |
| |
Figure 4:
|
| Open with DEXTER | |
| In the text | |
|
|
Figure 5: Folding of the stellar panel a) and the gas panel b) radial velocity curve of NGC 92. Triangles are used to represent the receding side, in NW direction and squares the proceeding side, in SE direction. The AP values obtained for the stars and the gas are indicated. |
| Open with DEXTER | |
| In the text | |
|
|
Figure 6: Gas (open circles) and stellar (filled circles) kinematics along the major panel a) and the minor panel b) axis of NGC 89. |
| Open with DEXTER | |
| In the text | |
|
|
Figure 7:
NGC 89: position-velocity diagram along the major panel a) and the minor
panel b) axis and
the [OIII] emission-line profile obtained by summing 6 pixels (
|
| Open with DEXTER | |
| In the text | |
|
|
Figure 8: Multiple component of the [OIII] emission-line profile along the minor axis of NGC 89. We compare the fits to the profile using a combination of three ( left) or four ( right) Gaussians. In the bottom panels, we show residuals for both cases. The choice of four Gaussians, the main component (dotted line), two blue-shifted components (dot-dashed and short-long dashed line), and the red-shifted one (dashed line) provide more reliable results. |
| Open with DEXTER | |
| In the text | |
|
|
Figure 9: Kinematics along the minor axis of NGC 89. Measured radial velocities of the primary gas component (open circles), the secondary gas component (filled triangles), and the stars (filled circles) are plotted. The kinematics of the secondary gas component is consistent with the presence of an outflow. |
| Open with DEXTER | |
| In the text | |
|
|
Figure 10: Folding of the stellar panel a) and gas panel b) radial velocity curve of NGC 89. Triangles are used for the receding side in the SE direction, and squares for the approaching side in the NW direction. The values of the AP for the gas and the stars are indicated. |
| Open with DEXTER | |
| In the text | |
|
|
Figure 11: Panel a) Gas (open circles) kinematics along the major axis of NGC 87. Panel b) Gas (open circles) and stellar (filled circles) kinematics along the minor axis of NGC 87. |
| Open with DEXTER | |
| In the text | |
|
|
Figure 12: Gas (open circles) and stellar (filled circles) kinematics along the minor axis of NGC 88. |
| Open with DEXTER | |
| In the text | |
Copyright ESO 2010
Current usage metrics show cumulative count of Article Views (full-text article views including HTML views, PDF and ePub downloads, according to the available data) and Abstracts Views on Vision4Press platform.
Data correspond to usage on the plateform after 2015. The current usage metrics is available 48-96 hours after online publication and is updated daily on week days.
Initial download of the metrics may take a while.