| Issue |
A&A
Volume 510, February 2010
|
|
|---|---|---|
| Article Number | A84 | |
| Number of page(s) | 16 | |
| Section | Extragalactic astronomy | |
| DOI | https://doi.org/10.1051/0004-6361/200912797 | |
| Published online | 16 February 2010 | |
Spectral ageing analysis and dynamical analysis of the double-double radio galaxy J1548-3216
J. Machalski1 - M. Jamrozy1 - C. Konar2
1 - Astronomical Observatory, Jagellonian University,
ul. Orla 171, 30244 Krakow, Poland
2 - Indian Institute of Astrophysics, Block II, Koramangala, Bangalore
560 034, India
Received 30 June 2009 / Accepted 17 November 2009
Abstract
Context. Determining ages of the outer and the inner
lobes of so-called double-double radio galaxies (DDRGs) is crucial for
understanding the active cycles of galactic nuclei, the phases of
interruption of the jet flow, and physical conditions in the
surrounding galactic and intergalactic medium governing the jets'
propagation. A recognition and understanding of these conditions during
the restarted jet activity is of special interest.
Aims. We determine the ages and other physical
characteristics of the outer and the inner lobes of the DDRG
J1548-3216, as well as the properties of the surrounding environment
during the original and the restarted phase of the jets' activity.
Methods. Using the new low-frequency and
high-frequency radio images of this galaxy, we determined the shape of
the spectrum along its lobes and performed the classical
spectral-ageing analysis. On the other hand, we applied the analytical
model of the jet's dynamics, which allowed us to derive the physical
conditions for the source's evolution during the original jet
propagation through the unperturbed IGM, as well as those when the
restarted new jet propagates inside the outer cocoon formed by the old
jet material that passed through the jet terminal shock.
Results. The dynamical age estimate of the outer and
the inner lobes is ![]() Myr
and
Myr
and ![]() Myr, respectively.
The synchrotron age in the outer lobes systematically rises from
Myr, respectively.
The synchrotron age in the outer lobes systematically rises from ![]() 25 Myr
in the vicinity of the lobes' edges to about 65-75 Myr in the
centre of the old cocoon. These ages imply an average expansion speed
along the jets' axis: (
25 Myr
in the vicinity of the lobes' edges to about 65-75 Myr in the
centre of the old cocoon. These ages imply an average expansion speed
along the jets' axis: (
![]() )c in the
outer lobes and (
)c in the
outer lobes and (
![]() )c in the
inner lobes, but the latter speed would be
)c in the
inner lobes, but the latter speed would be ![]() 0.25 c when they were
of age less than 1 Myr. We find that the jet power during the
restarted activity is about ten-fold fainter than that of the original
jet. Similar disproportion is found for the internal pressures and the
magnetic field strengths in the old cocoon and those in the inner
lobes. This disproportion can be effectively reduced by assuming the
same equations of state for the emitting particles and the magnetic
fields within the old and the new lobes. However, we think that our
assumption of the non-relativistic equation of state for the old cocoon
and the relativistic one for the new lobes is more justified.
0.25 c when they were
of age less than 1 Myr. We find that the jet power during the
restarted activity is about ten-fold fainter than that of the original
jet. Similar disproportion is found for the internal pressures and the
magnetic field strengths in the old cocoon and those in the inner
lobes. This disproportion can be effectively reduced by assuming the
same equations of state for the emitting particles and the magnetic
fields within the old and the new lobes. However, we think that our
assumption of the non-relativistic equation of state for the old cocoon
and the relativistic one for the new lobes is more justified.
Key words: galaxies: active - galaxies: evolution - radio continuum: galaxies - galaxies: individual: J1548-3216
1 Introduction
Although the intrinsic time evolution of powerful radio sources of Fanaroff-Riley type II (FRII; Fanaroff & Riley 1974) is largely understood and described with a number of analytical models (e.g. Kaiser et al. 1997; Blundell et al. 1999; Manolakou & Kirk 2002; Kino & Kawakatu 2005), there are still several unanswered questions about the duty-period of the active galactic nucleus (AGN), the jet production processes, its interaction with the external gaseous environment including the intergalactic medium (IGM), and the contents of the radio lobes as a part of the low-density ``cocoon''.
The double-double radio galaxies (DDRGs) are characterized by
two pairs of unequally-sized edge-brightened (FRII-type) lobes sharing
the same radio core. In
most of them the outer and inner double structures are aligned well.
The existence of
such radio sources is the evidence that the jet activity in AGN may be
not continuous
during the lifetime of a source. In fact, an intermittent production of
jets can be connected with stochastic transitions between two accretion
modes: the standard one
- with angular momentum transmitted outwards by viscous torques within
the accretion
disk - and the ``magnetic'' one, with the developed large-scale
magnetic fields and
related MHD winds (Nipoti et al. 2005; Körding
et al. 2006).
Sikora et al. (2007)
incorporated the above idea into the spin
paradigm scenario. Postulating that the efficient production of
relativistic jet
requires both a large black hole (BH) spin (as in the model of
Blandford & Znajek 1977)
and an efficient collimation mechanism (cf. Begelman & Li 1994), they
noted
that the intermittent jet activity observed in active galaxies
accreting at high
rates may be due to intermittent collimation of the central Poynting
flux-dominated
(so called ``Blandford & Znajek'') outflow by heavier and
slower MHD wind generated in
the inner parts of the accretion disk undergoing state transitions. In
the
framework of this interpretation, the jet axis in the subsequent jet
activity epochs
is expected to be the same, since this axis is determined by the spin
of the central
BH, which should not change substantially on short (![]() 100 Myr)
timescales (see
the discussion in Sikora et al. 2007).
100 Myr)
timescales (see
the discussion in Sikora et al. 2007).
Table 1: Observing log.
Such an interrupted production of jets is evidently imprinted in the radio morphology of DDRGs. We are interested in certain aspects of these sources. Are the ages and internal densities of the inner lobes much lower than these values for most ``normal'' radio sources of similar physical size as the inner lobes? Is the density of the pre-existing cocoon much lower than in the unperturbed galactic and IGM environment, or is this density higher? The first case would strongly suggest that the new inner structure is formed in a channel drilled through the old cocoon by the former jet activity cycle, which has been modelled by the numerical MHD simulations of Clarke & Burns (1991). They predict that ``the restarted jet will always be overdense (denser than its immediate surroundings) if the original jet is underdense relative to the quiescent IGM''. While the restarting jet model accounts for many of the observations, there remain some profound discrepancies difficult to be reconciled (cf. Clarke 1997). The second case would imply an efficient replacement of the inner lobes by the heavier external medium (e.g. Kaiser et al. 2000; Brocksopp et al. 2007).
![\begin{figure}
\par\includegraphics[width=16cm,clip]{12797f1.ps}
\end{figure}](/articles/aa/full_html/2010/02/aa12797-09/img19.png)
|
Figure 1:
Full-resolution GMRT 334 and 619 MHz, as well as VLA DnC-array
4860 MHz
images of the entire structure of the radio galaxy J1548-3216
(PKS 1545-321). The
first contour level, C1, is given in each image. The contour levels are
(1, 2, 4,
8, ...) |
| Open with DEXTER | |
The radio galaxy J1548-3216 (PKS B1545-321) is a remarkable example of DDRG in which the newly restarted jets propagate through the remnant cocoon of a previous active phase (Subrahmanyan et al. 1996; Saripalli et al. 2003, hereafter referred to as SSS2003). This galaxy has recently been extensively studied by Safouris et al. (2008, hereafter referred to as S2008), especially under the aspect of an observational constraint for the 2D and 3D numerical simulations of the restarted jet provided by Clarke & Burns (1991) and Clarke (1997), respectively. In S2008, the authors suggest that observational data are consistent with a picture that the restarted jets generate narrow-bow shocks, and the inner lobes in this galaxy are a mixture of cocoon plasma re-accelerated at the bow shock and new jet material re-accelerated at the termination shock. They propose that the evolution of the restarted jets and the inner lobes is strongly influenced by an entrainment of the external IGM into the pre-existing cocoon.
In this paper the spectral-ageing and dynamical analyses of J1548-3216 are performed with the aim of (i) determining the synchrotron age distribution in the outer lobes of this galaxy (in the old cocoon); (ii) estimating of this age in the inner lobes; (iii) comparing these ages with the dynamical ages estimated with the DYNAGE algorithm of Machalski et al. (2007); (iv) determining the jet powers during the first and the second phase of activity, as well as other physical parameters characterizing the lobes and their environments, such as the particle density, energy density, internal pressure, magnetic field strength and its density, propagation speeds of the lobes along the jets' axis, etc. Most working approaches in this paper are similar to those applied in our previous publications on other giant-sized radio galaxies: DDRG J1453+3308 (Konar et al. 2006) and a further ten selected galaxies (Jamrozy et al. 2008; Machalski et al. 2009, hereafter referred to as MJS2009). The analyses presented in this paper are based on the new radio observations recently conducted with the Giant Metrewave Radio Telescope (GMRT) and Very Large Array (VLA), and on the Australia Telescope Compact Array (ATCA) and VLA archival data kindly provided to us by Vicky Safouris and Ravi Subrahmanyan. The new observations and the data reduction are presented in Sect. 2. The resulting total-intensity 334, 619, 1384, 2495, and 4860 MHz total-intensity images are used in Sect. 3 to derive radio maps of the outer double structure of the investigated galaxy, as well as to extract the inner double structure from a background of the underlying cocoon formed during the earlier phase of the nuclear activity. The spectral-ageing analysis of the outer and the inner structures is described in Sect. 4. while the dynamical analysis is presented in Sect. 5. Results of these analyses, as well as our contribution to the aspects of the restarted nuclear activity, the environmental conditions ruling the new jets propagation within the relict cocoon, and their energetics - derived with another approach than applied in the previous studies of this radio galaxy by SSS2003 and S2008 - are discussed in Sect. 6.
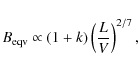
For the purpose of calculating the linear size, volume, and
luminosity of the lobes,
we use cosmological parameters
![]() ,
,
![]() ,
and
H0=71 km s-1 Mpc-1.
,
and
H0=71 km s-1 Mpc-1.
2 Observational data and their reduction
The observing log for all the observations is listed in Table 1, which is arranged as follows. Columns 1 and 2 show the name of the telescope and the array configuration for the former and the recent VLA observations; Cols. 3 and 4 give the frequency of observations and the primary beamwidth; Cols. 5 and 6 show a typical angular resolution and an rms noise level achieved in the resulting images of the radio galaxy investigated. The last Col. 7 gives the dates of the observations. More details of these observations are given below.
The low-frequency GMRT observations at 334 and 619 MHz were made in the standard manner, with each observation of the target source interspersed with observations of calibrator sources. The phase calibrators B1714-252 (at 334 MHz) and B1626-298 (at 619 MHz) were observed after each of several 20 min-lasting exposures of the target centred on the core position. 3C 286 was used as the flux density and bandpass calibrator based on the scale of Baars et al. (1977). At each of the two frequencies the total observing time on the target source was only about 150 min because of very limited observing time scheduled for the project. Unfortunately, a large part of 334-MHz data were strongly affected by radio frequency interference, and these data had to be flagged in the reduction process, which further reduced the quality of the data. Acceptable data were edited and reduced with the NRAO AIPS package. All these data were self-calibrated to produce the best possible images.
At the frequencies of 1384 and 2495 MHz, the archival data taken with the ATCA and VLA arrays are used. In particular, the ATCA 2495 MHz map of the total structure published by SSS2003, as well as the combined ATCA+VLA 1384 MHz of the total structure and the high-resolution VLA 1384 and 4910 MHz map of the inner double published by S2008. For the purpose of specifying a high-frequency spectrum of diffuse lobes of the outer double structure, we made other 4860 MHz observations of the target source with the VLA in its DnC configuration. Again, 3C 286 and B1522-275 were used for the amplitude and the phase calibrations, respectively. Two 20 min exposures of the fields centred on each of the two outer lobes were reduced, self-calibrated, and combined into one image of the entire source.
3 Observational results
3.1 New radio images
A full-resolution GMRT 334 and 619 MHz images, as well as the
VLA/DnC 4860 MHz image,
are presented in Fig. 1.
Our new images, especially those at low frequencies,
confirm the overall morphology of J1548-3216 already presented and
discussed by
SSS2003 and S2008, i.e. that both the outer lobes are edge-brightened
and rather
sharply bounded. Likewise in those papers, our images also do not show
any evident
hot spots or very compact structures at the ends of the lobes, and both
low-frequency
images confirm a distinct pair of emission peaks along a bright rim at
the western end
of the NW lobe. As in the archival ATCA and ATCA+VLA data, the
inner double structure
(a pair of relatively bright, narrow lobes) is strongly immersed into
the diffuse
bridge of emission extended from the bright edges of the outer lobes
towards the
radio core. A flare of the bridge transverse to the source's axis in
the vicinity of the core, very well shown at the ATCA 1384 MHz
image in SSS2003, is also pronounced at
both low frequencies. This flare is missing at the 4860 MHz
image, which suggests a
very steep radio spectrum in that part of the structure (cf.
Sect. 3.4). However, a
missing flux density at this frequency is negligible. Indeed, the area
marked with
the dashed line in the right panel of Fig. 1 is about
60 restoring beams, and a
missing flux is likely between the rms noise level and the first
contour C1 in this
image, both multiplied by ![]() 60 beams,
i.e. between
60 beams,
i.e. between ![]() 1.8 mJy
and
1.8 mJy
and ![]() 6 mJy.
Even the missing flux of 6 mJy will be about 1.3% of
the total flux density of 449 mJy given in Table 2. Such a loss does not
affect the spectral analysis performed in Sect. 3.4.
6 mJy.
Even the missing flux of 6 mJy will be about 1.3% of
the total flux density of 449 mJy given in Table 2. Such a loss does not
affect the spectral analysis performed in Sect. 3.4.
![\begin{figure}
\par\includegraphics[width=13.2cm,clip]{12797f2.ps}
\end{figure}](/articles/aa/full_html/2010/02/aa12797-09/img22.png)
|
Figure 2:
GMRT, ATCA and VLA images of the inner double structure of J1548-3216.
The
first contour level is given in each image. The contour levels are (1,
1.41, 2, 2.83,
4, 5.66, ...) |
| Open with DEXTER | |
Table 2: Flux densities of the total structure (Total) and the outer (outNW and outSE) and inner (innNW and innSE) lobes of J1548-3216.
3.2 Extraction of the inner double structure
To perform the spectral-ageing and dynamical analyses separately for
the
outer and the inner structures, we have to extract emission of the
inner lobes from
the underlying ``background'' radiation of the outer lobes. At the
observing
frequencies of 334 and 619 MHz this is made by excluding of
the visibility data taken
with baselines shorter than 2 k![]() and 3 k
and 3 k![]() ,
respectively, while at
4860 MHz visibilities with spatial frequencies less than
2.5 k
,
respectively, while at
4860 MHz visibilities with spatial frequencies less than
2.5 k![]() are excluded. This effectively resolved out a large part of the
underlying bridge's emission. Somewhat different approach was applied
at 2495 MHz. Having the final ATCA image at
this frequency only but not the original UV data, we used the AIPS task
IM2UV
which allows a Fourier transformation of the image reconverting the
data back to a UV
data file. Then a similar procedure, as described above, was applied to
the
reconverted 2495-MHz UV data excluding the visibilities at baselines
shorter than 2.5 k
are excluded. This effectively resolved out a large part of the
underlying bridge's emission. Somewhat different approach was applied
at 2495 MHz. Having the final ATCA image at
this frequency only but not the original UV data, we used the AIPS task
IM2UV
which allows a Fourier transformation of the image reconverting the
data back to a UV
data file. Then a similar procedure, as described above, was applied to
the
reconverted 2495-MHz UV data excluding the visibilities at baselines
shorter than 2.5 k![]() .
.
The resulting 334, 619, 2495, and 4860 MHz images of
the inner double structure are shown in Fig. 2. The corresponding
archival ATCA 1384 MHz and VLA/BnA 4910 MHz images
are included for comparison. Besides the brightest parts with the
leading heads of
the inner lobes, our new images confirm the presence of another weak
emission region in
the inner NW lobe detected by SSS2003 in their 2495-MHz total
intensity images of the
inner structure. Unfortunately, the dynamic range of our images is too
low to detect
more of the connecting emission seen in their Fig. 6. We estimate that such
a missing
flux is from about ![]() at 334 MHz to about
at 334 MHz to about ![]() at 4860 MHz. All these images,
except VLA/BnA, brought to a common scale using the AIPS task HGEOM
and convolved to the angular resolution of
at 4860 MHz. All these images,
except VLA/BnA, brought to a common scale using the AIPS task HGEOM
and convolved to the angular resolution of
![]() ,
are used to
make a longitudinal section along the inner structure. Such ``slices''
at the five
observing frequencies are shown in Fig. 3. To avoid problems
with any missing flux,
we restrict our spectral and dynamical analyses of the inner lobes to
their brightest
regions indicated in Fig. 3.
,
are used to
make a longitudinal section along the inner structure. Such ``slices''
at the five
observing frequencies are shown in Fig. 3. To avoid problems
with any missing flux,
we restrict our spectral and dynamical analyses of the inner lobes to
their brightest
regions indicated in Fig. 3.
![\begin{figure}
\par\includegraphics[width=7.5cm,clip]{12797f3.ps}
\end{figure}](/articles/aa/full_html/2010/02/aa12797-09/img27.png)
|
Figure 3: Longitudinal section along the inner double structure. The horizontal brackets indicate regions of the structure subject to the spectral and dynamical analyses. |
| Open with DEXTER | |
3.3 Outer lobes cleaned from the inner structure
To analyse physical properties of pure outer lobes of J1548-3216, the
inner double structure was subtracted from the images of the entire
radio source
partly shown in Fig. 1.
For this purpose, all of those images were also brought to a
common scale (a map size, cell size, coordinates of the map centre) and
convolved to
the angular resolution of
![]() .
The images of the inner
structure were blanked over regions outside the extracted inner lobes
and then
subtracted from the convolved maps of the entire source using the AIPS
task COMB. The net images of the outer lobes (rotated by
.
The images of the inner
structure were blanked over regions outside the extracted inner lobes
and then
subtracted from the convolved maps of the entire source using the AIPS
task COMB. The net images of the outer lobes (rotated by
![]() )
are shown in Fig. 4.
On the first of these images, a division of the radio structure into 18
strips, each
of them
)
are shown in Fig. 4.
On the first of these images, a division of the radio structure into 18
strips, each
of them ![]() wide, is shown. The first plotted contour on the ATCA+VLA image is
exceptionally high (about
wide, is shown. The first plotted contour on the ATCA+VLA image is
exceptionally high (about ![]() rms noise level) to clear it from spurious jagged
contours that appeared after the convolution of the original map with
the beam of
rms noise level) to clear it from spurious jagged
contours that appeared after the convolution of the original map with
the beam of
![]() .
The integrated flux densities measured in the consecutive strips and
plotted vs. distance of the strip's centre from the core position (the
strips' centres are separated by the angular distance of
.
The integrated flux densities measured in the consecutive strips and
plotted vs. distance of the strip's centre from the core position (the
strips' centres are separated by the angular distance of
![]() )
form a longitudinal section along the cleaned outer structure shown in
Fig. 5a.
The flares or spurs in the central region of the outer structure
increase the total flux density in the strips S7, S8 and N11, N12
causing its peaks marked F1, F2, and F3 in Fig. 5a. The brightness peaks
of the leading heads of the new inner lobes lying at the
radio axis (indicated with the dotted vertical lines), almost coincide
with the
positions of these strips. A spectral steepening and the spectral age
within the
strips are analysed in Sect. 4.1.
)
form a longitudinal section along the cleaned outer structure shown in
Fig. 5a.
The flares or spurs in the central region of the outer structure
increase the total flux density in the strips S7, S8 and N11, N12
causing its peaks marked F1, F2, and F3 in Fig. 5a. The brightness peaks
of the leading heads of the new inner lobes lying at the
radio axis (indicated with the dotted vertical lines), almost coincide
with the
positions of these strips. A spectral steepening and the spectral age
within the
strips are analysed in Sect. 4.1.
3.4 Radio spectra
The integrated flux densities of the total source, as well as of its outer and inner lobes, are given in Table 2. All columns are self-explanatory; outNW and outSE indicate the NW and SE lobes of the outer double structure, while innNW and innSE - the NW and SE inner lobes, respectively. Because a spectral fit, especially with the SYNAGE, is very sensitive to a lack of low-frequency data (cf. MJS2009), the 160-MHz flux densities of the outer lobes are estimated by subtracting 300 mJy (assumed flux density of the inner double at this frequency based at a spectral index of about 0.6, cf. Sect. 4.2) from the total flux density measured with the Culgoora array, and dividing the net flux between the two lobes in a proportion similar to those observed at the higher frequencies.
Distributions of the low-frequency
![]() and high-frequency
and high-frequency
![]() spectral
index vs. distance from the core measured along the
axis of the outer structure cleaned from the inner lobes are shown in
Fig. 5b.
The
wavy ridge and its side flares do not show any peculiarity in the
spectral index
distribution shown in Fig. 5b.
Both the low-frequency and the high-frequency indices
exhibit a systematic steepening from the heads of the outer lobes
towards the centre.
The low-frequency spectral index rises from
spectral
index vs. distance from the core measured along the
axis of the outer structure cleaned from the inner lobes are shown in
Fig. 5b.
The
wavy ridge and its side flares do not show any peculiarity in the
spectral index
distribution shown in Fig. 5b.
Both the low-frequency and the high-frequency indices
exhibit a systematic steepening from the heads of the outer lobes
towards the centre.
The low-frequency spectral index rises from ![]() 0.5 to
0.5 to ![]() 0.9, while
the
high-frequency one steepens from
0.9, while
the
high-frequency one steepens from ![]() 0.8 to
0.8 to ![]() 2.0 at the evident depression of
emission at the centre of the bridge. Such a large continuous
steepening of the
spectra suggested a systematic increase in the synchrotron age of
relativistic
particles enclosed in the old cocoon, i.e. an increase from the lobes'
head towards
their flaring ends.
2.0 at the evident depression of
emission at the centre of the bridge. Such a large continuous
steepening of the
spectra suggested a systematic increase in the synchrotron age of
relativistic
particles enclosed in the old cocoon, i.e. an increase from the lobes'
head towards
their flaring ends.
We do not attempt to analyse a distribution of the synchrotron
age in directions
transverse to the main axis of the source, hence spectral index
distributions over
the entire area of the outer structure are beyond the scope of this
paper.
Nevertheless our data show similar spectral features as those seen in
the map of the
spectral index ![]() in SSS2003 (their Fig. 3), i.e. the steepest
spectra appear at eastern ends of the strips S7 and S8, and at western
ends of the
strips N11 and N12. We cannot confirm a distinctly steeper
spectrum along the
southwestern edge of the outSE lobe appearing in their map, but at
least something
similar is not pronounced in the spectral index
in SSS2003 (their Fig. 3), i.e. the steepest
spectra appear at eastern ends of the strips S7 and S8, and at western
ends of the
strips N11 and N12. We cannot confirm a distinctly steeper
spectrum along the
southwestern edge of the outSE lobe appearing in their map, but at
least something
similar is not pronounced in the spectral index
![]() or
or
![]() .
.
![\begin{figure}
\par\includegraphics[width=13.66cm,clip]{12797f4.ps}
\end{figure}](/articles/aa/full_html/2010/02/aa12797-09/img36.png)
|
Figure 4:
Radio images of the outer lobes cleaned from the inner double structure
and
convolved to the angular resolution of
|
| Open with DEXTER | |
3.5 The radio core
The J2000.0 position of the radio core determined from the
high-resolution images is
RA: 15![]() 48
48![]() 58
58
![]() 05
and Dec:
05
and Dec:
![]() ,
which is less than 1 arcsec away from centre of the parent galaxy
imaged with the Anglo-Australian Telescope (AAT) by S2008. The flux
densities of the
core, measured on the images presented in this paper, are collected in
Table 3.
These
flux densities suggest a mildly inverted spectrum without a sign of
time variability.
,
which is less than 1 arcsec away from centre of the parent galaxy
imaged with the Anglo-Australian Telescope (AAT) by S2008. The flux
densities of the
core, measured on the images presented in this paper, are collected in
Table 3.
These
flux densities suggest a mildly inverted spectrum without a sign of
time variability.
Table 3: Flux densities of the radio core.
4 Spectral ageing analysis
Remembering all the serious problems with both the principles and the
practical
application of spectral-ageing calculations to physical conditions in
radio sources
described in detail in MJS2009, the spectral age in different parts of
the lobes,
i.e. the time elapsed since the radiating particles were last
accelerated, is
determined using the classical theory that describes the time evolution
of emission
spectrum of a single population of particles with an initial power-law
energy
distribution (e.g. Myers & Spangler 1985; Carilli
et al. 1991).
The initial energy
distribution of the relativistic particles is a power-law function,
![]() ,
of their initial Lorentz
factor,
,
of their initial Lorentz
factor, ![]() .
The power p corresponds to the initial (injection)
spectral
index
.
The power p corresponds to the initial (injection)
spectral
index ![]() ,
which can be, in principle, estimated from the
observational data until the synchrotron frequency of the minimum
electron Lorentz
factor lies far outside the observable low-frequency spectrum.
Fortunately, a
spectral turnover at low frequencies is not observed in the radio
spectra of the extended FRII-type radio sources. On the other hand, the
spectral break frequency above which the radio spectrum steepens from
the injected power law,
,
which can be, in principle, estimated from the
observational data until the synchrotron frequency of the minimum
electron Lorentz
factor lies far outside the observable low-frequency spectrum.
Fortunately, a
spectral turnover at low frequencies is not observed in the radio
spectra of the extended FRII-type radio sources. On the other hand, the
spectral break frequency above which the radio spectrum steepens from
the injected power law, ![]() ,
is related to the spectral (synchrotron) age,
,
is related to the spectral (synchrotron) age,
![]() ,
and the magnetic field strength, B, through
,
and the magnetic field strength, B, through
![\begin{displaymath}\tau_{\rm syn}[{\rm ~Myr}]=50.3\frac{B^{1/2}}{B^{2}+B_{\rm iC}^{2}}[\nu_{\rm br}(1+z)]^{-1/2},
\end{displaymath}](/articles/aa/full_html/2010/02/aa12797-09/img45.png)
|
(1) |
where
![\begin{figure}
\par\includegraphics[width=9cm,clip]{12797f5.ps}
\end{figure}](/articles/aa/full_html/2010/02/aa12797-09/img48.png)
|
Figure 5: a) Integrated flux densities in the consecutive strips along the outer double structure vs. distance from the core. The vertical lines indicate positions of brightness peaks in the inner lobes. b) Low-frequency and high-frequency spectral indices in these strips. |
| Open with DEXTER | |
4.1 The outer structure
4.1.1
Determination of  and
and  values
To determine the value of
![]() ,
we fit the CI, CIE, and JP
models to the flux densities of the entire outer lobes (given in
Cols. 3 and 4 of
Table 2)
treating
,
we fit the CI, CIE, and JP
models to the flux densities of the entire outer lobes (given in
Cols. 3 and 4 of
Table 2)
treating ![]() as a free parameter, and realizing that
decidedly the best fit to the data is achieved with the
JP model. Fits of the JP
model of radiative losses to the flux densities of the outer SE and NW
lobes are
shown in Fig. 6.
The values of
as a free parameter, and realizing that
decidedly the best fit to the data is achieved with the
JP model. Fits of the JP
model of radiative losses to the flux densities of the outer SE and NW
lobes are
shown in Fig. 6.
The values of
![]() and
and
![]() found
by the fit correspond to the
found
by the fit correspond to the
![]() indices
of
indices
of ![]() 0.7
and
0.7
and ![]() 0.6
previously determined by
SSS2003 for the brightest regions at the SE and NW heads of the outer
structure,
respectively. These fitted
0.6
previously determined by
SSS2003 for the brightest regions at the SE and NW heads of the outer
structure,
respectively. These fitted
![]() indices are used to determine values of
indices are used to determine values of
![]() in the 18 parallel strips
covering the entire outer structure of the
radio source. The JP models of the spectra within these 18 strips are
collected in Fig. 7.
A distance of the strip's centre from the core, the resulting value of
in the 18 parallel strips
covering the entire outer structure of the
radio source. The JP models of the spectra within these 18 strips are
collected in Fig. 7.
A distance of the strip's centre from the core, the resulting value of
![]() ,
and the relevant value of
,
and the relevant value of
![]() giving a goodness of the fit in each of 18 strips, are given in
Cols. 2-4 of Table 4,
respectively.
giving a goodness of the fit in each of 18 strips, are given in
Cols. 2-4 of Table 4,
respectively.
4.1.2 Determination of magnetic field strength values and the spectral ages
In consistency with the approach applied in our previous
spectral-ageing analyses of
giant radio galaxies (Jamrozy et al. 2005, 2008; Konar
et al. 2006),
the magnetic
field in Eq. (1) is identified with an ``equipartition
field'', ![]() ,
which
provides equipartition between the total energy densities of the
relativistic
particles and the magnetic field
,
which
provides equipartition between the total energy densities of the
relativistic
particles and the magnetic field
![]() ).
The required values
of
).
The required values
of ![]() are computed with Miley's (1980)
prescription for the general formula
are computed with Miley's (1980)
prescription for the general formula
|
(2) |
where k is the ratio of the energy content of relativistic protons to that of electrons (adopted as k=1), L is the luminosity of a given strip calculated by integration of its spectrum from a frequency equivalent to a minimum Lorentz factor,
![\begin{figure}
\par\includegraphics[width=14.5cm,clip]{12797f6.ps}
\end{figure}](/articles/aa/full_html/2010/02/aa12797-09/img56.png)
|
Figure 6: Spectra of the outer lobes fitted with the JP model, as described in the text. |
| Open with DEXTER | |
![\begin{figure}
\par\includegraphics[width=14cm,clip]{12797f7.eps}
\end{figure}](/articles/aa/full_html/2010/02/aa12797-09/img57.png)
|
Figure 7:
Spectra of the slices S1-S9 in the outSE lobe and N10-N18 in the outNW
lobe, fitted with the JP model. The spectra of particular
strips are arbitrarily
shifted. Reduced values of |
| Open with DEXTER | |
Table 4: Break frequency, equipartition magnetic field strength, and spectral age of emitting particles in consecutive strips through the outer lobes of J1548-3216 (cf. Fig. 4).
The distribution of this spectral age vs. distance from the core measured along the axis of the outer structure is shown in Fig. 8.
4.2 The inner structure
The spectrum of each of the two inner lobes, i.e. the flux densities
given in Cols. 5 and 6 of Table 2, is fitted with the
CI model. The fits (shown in Fig. 9) suggest
a similar initial slope of the spectrum of both the lobes of
![]() and
the spectral break of
and
the spectral break of
![]() GHz
and
GHz
and ![]() GHz
for the NW and SE lobes, respectively. (The formal
GHz
for the NW and SE lobes, respectively. (The formal
![]() errors are enormous
due to the practically straight spectra.) The volume of the lobes is
calculated assuming their cylindrical geometry with a minimum angular
size
errors are enormous
due to the practically straight spectra.) The volume of the lobes is
calculated assuming their cylindrical geometry with a minimum angular
size
![]() (height
(height ![]() base diameter) for the NW lobe and
base diameter) for the NW lobe and
![]() for the SE lobe where these dimensions are measured in the VLA image of
S2008 (their Fig. 5). In this case, the equipartition magnetic
field strength, calculated with the prescription of Miley (1980), is
for the SE lobe where these dimensions are measured in the VLA image of
S2008 (their Fig. 5). In this case, the equipartition magnetic
field strength, calculated with the prescription of Miley (1980), is
![]() nT
and
nT
and ![]() nT, respectively.
Using these values, a ``mean'' spectral age of the radiating particles
in the lobes is
nT, respectively.
Using these values, a ``mean'' spectral age of the radiating particles
in the lobes is ![]() Myr
for innNW lobe and
Myr
for innNW lobe and ![]() Myr
for innSE lobe. However, adopting the full length of the lobes as the
cylinder's height, i.e.
Myr
for innSE lobe. However, adopting the full length of the lobes as the
cylinder's height, i.e.
![]() and
and ![]() for innNW and innSE lobes, the magnetic field strengths reduce to
for innNW and innSE lobes, the magnetic field strengths reduce to
![]() nT
and
nT
and ![]() nT, while the ages
increase to
nT, while the ages
increase to ![]() Myr
and
Myr
and ![]() Myr,
respectively. The resulting spectral ages of the inner lobes are
discussed in Sect. 6.1.
Myr,
respectively. The resulting spectral ages of the inner lobes are
discussed in Sect. 6.1.
5 The dynamical age analysis
This analysis is performed using the DYNAGE algorithm of Machalski
et al. (2007)
which is based on the analytical model for the evolution of FR II type
radio sources,
combining the pure dynamical model of Kaiser & Alexander (1997)
with the model for
expected radio emission from a source under the influence of the energy
loss processes
published by Kaiser et al. (1997, known as the
KDA model). With this algorithm we
derive the dynamical age of the lobes t, both the
outer and the inner ones, the
effective injection spectral index
![]() ,
which approximates the
initial electron continuum averaged over a very broad energy range and
over the
present age of the source, the jet power
,
which approximates the
initial electron continuum averaged over a very broad energy range and
over the
present age of the source, the jet power
![]() ,
and the central density near
the radio core
,
and the central density near
the radio core ![]() ,
which determines the ambient density in which the jet
propagates.
,
which determines the ambient density in which the jet
propagates.
A detailed description of how to apply the above algorithm is
published in MJS2009.
It is worth explaining here that determining of values of these four
free
parameters of the model is possible by a fit to the observational
parameters of a
source (or its lobes): its projected linear size D,
the volume V, the radio power ![]() and the radio spectrum
and the radio spectrum ![]() ,
which provides
,
which provides ![]() at a number
of observing frequencies i=1, 2, 3, ... As
in the KDA model, we assume
a cylindrical geometry of the lobes (cocoon), thus
at a number
of observing frequencies i=1, 2, 3, ... As
in the KDA model, we assume
a cylindrical geometry of the lobes (cocoon), thus
![]() where
where
![]() is their
axial ratio. The values of the few other free parameters of the model
have to be assumed. These are the central core radius a0,
the exponent
is their
axial ratio. The values of the few other free parameters of the model
have to be assumed. These are the central core radius a0,
the exponent ![]() describing the ambient density profile in the simplified King's (1972) model
describing the ambient density profile in the simplified King's (1972) model
![]() ,
the Lorentz factors determining the energy range of the relativistic
particles used in integration of their initial power-law distribution
,
the Lorentz factors determining the energy range of the relativistic
particles used in integration of their initial power-law distribution
![]() and
and ![]() ,
the adiabatic indices of the three ``fluids'' with individual energy
densities: the jet material,
,
the adiabatic indices of the three ``fluids'' with individual energy
densities: the jet material,
![]() ,
the magnetic field,
,
the magnetic field, ![]() ,
and the ambient medium,
,
and the ambient medium, ![]() (cf. Kaiser et al. 1997).
Since the emitting region consists of these three fluids, the model
also takes the adiabatic index of the lobe (cocoon) into account as a
whole,
(cf. Kaiser et al. 1997).
Since the emitting region consists of these three fluids, the model
also takes the adiabatic index of the lobe (cocoon) into account as a
whole, ![]() .
The two other free parameters we have to assume are
.
The two other free parameters we have to assume are
![]() - the ratio of the energy density of thermal particles to that of the
relativistic electrons - and
- the ratio of the energy density of thermal particles to that of the
relativistic electrons - and ![]() ,
the orientation of the jet axis to the observer's line of sight.
Following KDA, in the DYNAGE algorithm the assumed energy equipartition
is expressed by the ratio of the energy densities of the magnetic field
and of the particles,
,
the orientation of the jet axis to the observer's line of sight.
Following KDA, in the DYNAGE algorithm the assumed energy equipartition
is expressed by the ratio of the energy densities of the magnetic field
and of the particles,
![]() .
The values adopted for the whole source are a0=10 kpc,
.
The values adopted for the whole source are a0=10 kpc,
![]() ,
,
![]() ,
,
![]() ,
and
,
and ![]() .
A decrease in
.
A decrease in ![]() to
to ![]() 70
70
![]() (cf. S2008) would
result in
(cf. S2008) would
result in ![]() 6%
increase of D and
6%
increase of D and ![]() 7% increase
of t (cf. Eq. (6) in
Sect. 5.3). As we are interested in an age difference between
the lobes rather than in their absolute age value, the latter one is
less important. The values of
7% increase
of t (cf. Eq. (6) in
Sect. 5.3). As we are interested in an age difference between
the lobes rather than in their absolute age value, the latter one is
less important. The values of
![]() ,
,
![]() ,
,
![]() ,
and
,
and ![]() assumed for
the outer and the inner lobes are given in next sections. The
observational data
of these lobes, used in the DYNAGE fitting procedure, are given in
Table 5.
Most
columns are selfexplanatory, the entries in Cols. (6)-(9) give
the ratios of the
size and luminosity of the given lobes.
assumed for
the outer and the inner lobes are given in next sections. The
observational data
of these lobes, used in the DYNAGE fitting procedure, are given in
Table 5.
Most
columns are selfexplanatory, the entries in Cols. (6)-(9) give
the ratios of the
size and luminosity of the given lobes.
![\begin{figure}
\par\includegraphics[width=8.5cm,clip]{12797f8.ps}
\end{figure}](/articles/aa/full_html/2010/02/aa12797-09/img152.png)
|
Figure 8: Spectral age of relativistic particles in the outer structure cleaned from the inner lobes plotted vs. distance from the radio core. |
| Open with DEXTER | |
However, the age and other physical parameters, fitted
independently for either lobe
of a given double source, may be significantly different; i.e., any
difference between
the fitted values of a parameter is found to be greater than the
uncertainty of the
fits. This is a consequence of the usual asymmetries between the lobes
in their
length and luminosity. The difference arises if the same density
profile of the
ambient medium along the opposite lobes is assumed. The ratios between
these
parameters of the lobes of J1548-3216, both the outer and the inner
ones, are shown
in Cols. (6)-(9) in Table 5. On the other hand, we
can expect that ![]() and
and ![]() have the same values in the solutions for the opposite lobes, since
they characterize an energy-emitting process in the central AGN. Also a
large difference in age is rather unlikely. Therefore, following a
similar ageing analysis in MJS2009, we consider the independent
solutions, as well as the two self-consistent
solutions for the opposite lobes, hereafter denoted as
solutions A and B.
have the same values in the solutions for the opposite lobes, since
they characterize an energy-emitting process in the central AGN. Also a
large difference in age is rather unlikely. Therefore, following a
similar ageing analysis in MJS2009, we consider the independent
solutions, as well as the two self-consistent
solutions for the opposite lobes, hereafter denoted as
solutions A and B.
![\begin{figure}
\par\includegraphics[width=14cm,clip]{12797f9.ps}
\end{figure}](/articles/aa/full_html/2010/02/aa12797-09/img158.png)
|
Figure 9: Spectra of the inner lobes fitted with the CI model, as described in the text. |
| Open with DEXTER | |
Table 5: Observational parameters of the outer and the inner lobes used to fit the dynamical model.
5.1 Independent solutions for the individual outer lobes
The images in Fig. 4
suggest that the diffused outer lobes may comprise a fraction
of thermal particles, thus the lobes, as a whole, may have a
non-relativistic
equation of state. Therefore, we assume
![]() and
and ![]() .
The latter value is less than
.
The latter value is less than ![]() (25-140)
calculated by S2008 with the assumption that the hot spot pressure,
(25-140)
calculated by S2008 with the assumption that the hot spot pressure,
![]() ,
equals a minimum pressure
,
equals a minimum pressure
![]() ,
though they expected that a true hot spot
pressure should be higher, i.e.
,
though they expected that a true hot spot
pressure should be higher, i.e.
![]() .
Indeed, when studying
the large-scale X-ray environment of selected FRII radio sources,
Belsole et al. (2007)
find that the internal pressure in their lobes,
.
Indeed, when studying
the large-scale X-ray environment of selected FRII radio sources,
Belsole et al. (2007)
find that the internal pressure in their lobes, ![]() ,
is
,
is ![]() (1-5) times
higher that the minimum (equipartition) pressure. Considering that the
ratio
(1-5) times
higher that the minimum (equipartition) pressure. Considering that the
ratio
![]() in
the DYNAGE algorithm varies from
in
the DYNAGE algorithm varies from ![]() 4 to
4 to ![]() 20
(depending on the value of
20
(depending on the value of ![]() ), the assumed value
), the assumed value
![]() is justified.
is justified.
The model solutions, i.e. the parameter values resulting from the independent fits, are listed in Cols. 2 and 3 of Table 6.
Table 6:
Fitted physical parameters of the outer lobes, with
brackets ![]() showing the values assumed within the given
solution, (cf. the text).
showing the values assumed within the given
solution, (cf. the text).
5.2 Self-consistent solutions for the outer lobes
The differences between the values of the model parameters for the
opposite lobes
found in the independent solutions come from different environmental
conditions
(and/or different magnetic fields) on both sides of the core region.
For this reason,
in the first kind self-consistent solution (solution A), we
averaged the values of
![]() and
and
![]() found for the opposite outer lobes (given
in Cols. 2 and 3 of Table 6), and now treat them
as the fixed free parameters of
the model,
found for the opposite outer lobes (given
in Cols. 2 and 3 of Table 6), and now treat them
as the fixed free parameters of
the model,
![]() W
and
W
and
![]() kg m-3,
respectively.
Given these values, we can determine another value of
kg m-3,
respectively.
Given these values, we can determine another value of ![]() for each of the two
lobes, hereafter denoted as
for each of the two
lobes, hereafter denoted as
![]() .
To do that (following MJS2009), we equalize values of the ambient
density at the head of the outer lobes resulting from the independent
solution and the self-consistent solution A:
.
To do that (following MJS2009), we equalize values of the ambient
density at the head of the outer lobes resulting from the independent
solution and the self-consistent solution A:
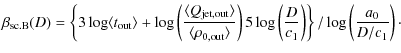
|
(3) |
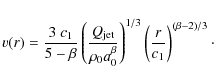
Given a value of
|
(4) |
where c1 is a dimensionless constant dependent on the values of
The data in Table 6
show that the difference between the lobes' ages inferred from
the solution A is greater than the found in the independent
solution. This is not
what we would expect for the actual ages of the opposite lobes![]() . Another
alternative, self-consistent solution is plausible in which these ages
are very
similar (especially if we suspect that an orientation of the jets' axis
in giant
radio galaxies is close to
. Another
alternative, self-consistent solution is plausible in which these ages
are very
similar (especially if we suspect that an orientation of the jets' axis
in giant
radio galaxies is close to
![]() ),
and any differences between the
linear extent and luminosity of the lobes come from an inhomogeneity
either in
density distribution of the ambient gaseous environment or in magnetic
field. Since
significant differences between the jet power and the radio core
parameters in the
opposite directions along the jets' axis are not plausible, in the
self-consistent
solution B we assume the same values of
),
and any differences between the
linear extent and luminosity of the lobes come from an inhomogeneity
either in
density distribution of the ambient gaseous environment or in magnetic
field. Since
significant differences between the jet power and the radio core
parameters in the
opposite directions along the jets' axis are not plausible, in the
self-consistent
solution B we assume the same values of
![]() and
and
![]() for
both outer lobes (as in solution A) and the
same age
for
both outer lobes (as in solution A) and the
same age ![]() Myr,
i.e. a mean of the ages determined in
the independent solution, and a0=10 kpc.
In such a scenario, a value of
Myr,
i.e. a mean of the ages determined in
the independent solution, and a0=10 kpc.
In such a scenario, a value of
![]() can be calculated from
Eq. (4) substituting
can be calculated from
Eq. (4) substituting
![]() for
for ![]() and
and ![]() for
for ![]() .
As a result,
.
As a result,
|
(5) |
This solution does not give an unequivocal result for the fit, because c1 is a rising function of
The data in Table 6
show that the values of the model free parameters do not differ
much in the three solutions considered. However, the identity of
![]() ,
,
![]() ,
and
,
and ![]() in the opposite outer lobes postulated in the
solution B result in a greater difference between the values
of
in the opposite outer lobes postulated in the
solution B result in a greater difference between the values
of ![]() and
and
![]() than in the remaining
solutions. In particular, it suggests more
than twice denser ambient environment around the head of the outer NW
lobe than
around the head of the opposite SE lobe. These physical conditions seem
to be
supported by the presence of a distinct pair of emission peaks along
the bright rim
at the end of the NW lobe, while a similar emission is absent
in the SE lobe.
Also the mean pressure,
than in the remaining
solutions. In particular, it suggests more
than twice denser ambient environment around the head of the outer NW
lobe than
around the head of the opposite SE lobe. These physical conditions seem
to be
supported by the presence of a distinct pair of emission peaks along
the bright rim
at the end of the NW lobe, while a similar emission is absent
in the SE lobe.
Also the mean pressure, ![]() in the NW lobe is about 30
in the NW lobe is about 30![]() higher than
in the SE lobe, and their ratio found in the solution B is the
highest. We discuss
this point again in Sect. 6.2.
higher than
in the SE lobe, and their ratio found in the solution B is the
highest. We discuss
this point again in Sect. 6.2.
5.3 Independent solution for the inner lobes
In the case of the inner structure, we assume that (i) the observed
emission arises
from the narrow lobes (cocoon), not the restarted jets; (ii) the jets'
and lobes'
material has a relativistic equation of state with
![]() with no thermal particles, thus
with no thermal particles, thus
![]() ;
and (iii) the restarted jets propagate within rarefied and
uniform (with
;
and (iii) the restarted jets propagate within rarefied and
uniform (with ![]() )
medium of the relict outer cocoon formed by the old jets' material that
passed through the jet terminal shock. Since the observed spectra of
the inner lobes show no curvature below the frequency of
4.9 GHz, especially for the innNW lobe where the SYNAGE fit
suggests
)
medium of the relict outer cocoon formed by the old jets' material that
passed through the jet terminal shock. Since the observed spectra of
the inner lobes show no curvature below the frequency of
4.9 GHz, especially for the innNW lobe where the SYNAGE fit
suggests ![]() above 20 GHz (cf. Fig. 9),
the DYNAGE algorithm will not be able to find a unique solution for the
dynamical age, i.e. to determine values of
above 20 GHz (cf. Fig. 9),
the DYNAGE algorithm will not be able to find a unique solution for the
dynamical age, i.e. to determine values of
![]() ,
,
![]() ,
and
,
and ![]() ,
even if a value of
,
even if a value of ![]() is known. Its formal fit with the SYNAGE is
is known. Its formal fit with the SYNAGE is
![]() and
and
![]() for
the innSE and innNW
lobes, respectively. Therefore for the purpose of DYNAGE calculations,
we assume here
that a maximum value of
for
the innSE and innNW
lobes, respectively. Therefore for the purpose of DYNAGE calculations,
we assume here
that a maximum value of ![]() cannot exceed the values of 0.606 and
0.611, but can be as low as 0.510 and 0.525, respectively. Moreover,
the width of the
inner cocoon can be larger than the lobes' widths determined from the
images in
Fig. 2,
therefore we admit a twice larger width for these lobes corresponding
to
cannot exceed the values of 0.606 and
0.611, but can be as low as 0.510 and 0.525, respectively. Moreover,
the width of the
inner cocoon can be larger than the lobes' widths determined from the
images in
Fig. 2,
therefore we admit a twice larger width for these lobes corresponding
to
![]() (instead of 11.8
and 10.6) supposing that the best age
solution for
the innSE lobe lies within the model space parameters limited from one
side by the
values
(instead of 11.8
and 10.6) supposing that the best age
solution for
the innSE lobe lies within the model space parameters limited from one
side by the
values ![]() and
and ![]() ,
and from the other side by
,
and from the other side by
![]() and
and
![]() .
For the opposite innNW lobe, the
limiting pairs of the model parameters are
.
For the opposite innNW lobe, the
limiting pairs of the model parameters are
![]() ,
,
![]() and
and
![]() ,
,
![]() .
.
The sets of solutions
resulting from the fit of the model's free parameters to the linear
size and the radio
powers of the inner lobes (given in Cols. (4) and (5) of
Table 5),
are presented in
Fig. 10.
This diagram clearly shows that the spaces of model parameters for the
opposite inner lobes do not overlap. Obviously the lobes' asymmetries
in the luminosity and size are too large to allow a comparable age and
jet power solution in the model. Moreover, a selection of adequate pair
of ![]() and
and ![]() values is not possible until a value of
values is not possible until a value of
![]() is fixed by means of some additional constraint.
is fixed by means of some additional constraint.
Let us therefore consider the limiting values for the core
density ![]() within the old outer lobes. On the one hand, the upper limit for
the cold gas density may therefore be provided by studies of the
internal depolarization of radio emission produced by the extended
lobes of FRII-type radio
galaxies. For example, Garrington & Conway (1991) found
that the product of the cold
gas number density and the lobes' magnetic field strength is on average
within the old outer lobes. On the one hand, the upper limit for
the cold gas density may therefore be provided by studies of the
internal depolarization of radio emission produced by the extended
lobes of FRII-type radio
galaxies. For example, Garrington & Conway (1991) found
that the product of the cold
gas number density and the lobes' magnetic field strength is on average
![]() m-3 nT.
This, with the
m-3 nT.
This, with the
![]() nT
determined for the inner lobes in Sect. 4.2, gives
roughly
nT
determined for the inner lobes in Sect. 4.2, gives
roughly
![]() kg m-3.
We note in this context that the above equipartition magnetic field
strength is compatible with the typical values
kg m-3.
We note in this context that the above equipartition magnetic field
strength is compatible with the typical values
![]() found by means of multiwavelength analysis of the non-thermal lobes'
emission (e.g. Kataoka & Stawarz 2005; Croston
et al. 2005).
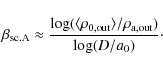
However, the ambient gas density within the old cocoon of DDRGs is
likely lower than that of the typical FRII-type sources with linear
sizes comparable to those characteristic for the inner double
structures. It can be supposed that
found by means of multiwavelength analysis of the non-thermal lobes'
emission (e.g. Kataoka & Stawarz 2005; Croston
et al. 2005).
However, the ambient gas density within the old cocoon of DDRGs is
likely lower than that of the typical FRII-type sources with linear
sizes comparable to those characteristic for the inner double
structures. It can be supposed that
![]() ,
where
,
where
![]() .
With
.
With
![]() kg m-3
and
kg m-3
and
![]() kpc,
we have
kpc,
we have
![]() kg m-3.
This value, corresponding exactly to the baryon density of 10-4 cm-3
(102 m-3)
typical for the intracluster medium (ICM) of nearby (z<0.2)
clusters of galaxies (Croston et al. 2008), can be
considered as a very upper limit for
kg m-3.
This value, corresponding exactly to the baryon density of 10-4 cm-3
(102 m-3)
typical for the intracluster medium (ICM) of nearby (z<0.2)
clusters of galaxies (Croston et al. 2008), can be
considered as a very upper limit for
![]() .
.
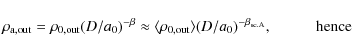
On the other hand, the lower limit is provided by an amount of
matter injected into
the outer lobes by the old jet, which is
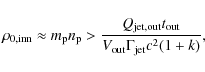
where
![\begin{figure}
\par\includegraphics[width=9cm,clip]{12797f10.ps}
\end{figure}](/articles/aa/full_html/2010/02/aa12797-09/img240.png)
|
Figure 10:
Model solution for the inner lobes. The two pairs of dotted diagonal
lines
for each of the lobes indicate the age vs. jet-power relation
corresponding to the
limiting values of the lobe's axial ratio, |
| Open with DEXTER | |
The value of
![]() adopted in our calculations is more
than two orders higher than its estimate in S2008 (
adopted in our calculations is more
than two orders higher than its estimate in S2008 (
![]() kg m-3)
and close to the ionized gas density in clusters of galaxies
(cf. Croston et al.
2008). This seems to contradict the finding of SSS2003 that the
investigated
radio galaxy is not in a cluster, and one could expect that the gas
density inside the
old cocoon is much lower than the value
kg m-3)
and close to the ionized gas density in clusters of galaxies
(cf. Croston et al.
2008). This seems to contradict the finding of SSS2003 that the
investigated
radio galaxy is not in a cluster, and one could expect that the gas
density inside the
old cocoon is much lower than the value
![]() adopted in
the above calculations unless an efficient entrainment process occurs.
However,
an order of magnitude decrease in this value, i.e. to about
adopted in
the above calculations unless an efficient entrainment process occurs.
However,
an order of magnitude decrease in this value, i.e. to about
![]() kg m-3,
will result in a two-fold decrease in the estimated age of the inner
structure only, i.e. to about
kg m-3,
will result in a two-fold decrease in the estimated age of the inner
structure only, i.e. to about ![]() 3 Myr.
3 Myr.
Nevertheless, there is a way to avoid any assumption about the
environment's density.
It is not an easy task to detect and measure the high-frequency radio
spectrum of the
inner lobes. The calculation of the flux density expected from the
model with
![]() ,
,
![]() W,
W,
![]() kg m-3,
kg m-3,
![]() ,
and t=9 Myr are 20.6 mJy,
11.0 mJy, 4.6 mJy, and 1.9 mJy at
,
and t=9 Myr are 20.6 mJy,
11.0 mJy, 4.6 mJy, and 1.9 mJy at ![]() 10.6, 30, 90, and 230 GHz, respectively.
Supplementing the observed spectrum with the above flux densities and
fitting the CI model of energy losses, we find
10.6, 30, 90, and 230 GHz, respectively.
Supplementing the observed spectrum with the above flux densities and
fitting the CI model of energy losses, we find
![]() GHz,
which with
GHz,
which with ![]() nT
gives
nT
gives ![]() Myr.
Myr.
Similar to the outer lobes, the independent solutions for the inner lobes cannot provide comparable jet powers for the opposite lobes. The diamond-shaped areas in Fig. 10 are significantly separated along the abscissa. We therefore consider an alternative solution of their age.
5.4 Alternative solution
An explanation of the difference in
![]() values by different external
density profiles along the opposite new jets is problematic if we
assume a constant
density with
values by different external
density profiles along the opposite new jets is problematic if we
assume a constant
density with ![]() .
The nearer opposite sides of the ``diamonds''
correspond to the largest acceptable differences between the parameters
.
The nearer opposite sides of the ``diamonds''
correspond to the largest acceptable differences between the parameters
![]() and
and
![]() .
Even completely different values of these parameters for the
opposite inner lobes do not allow even a partial superposition of these
diamonds
in the (log) plane
.
Even completely different values of these parameters for the
opposite inner lobes do not allow even a partial superposition of these
diamonds
in the (log) plane ![]() -
-
![]() .
However, as pointed out
and discussed in MJS2009, a plausible equalization of
.
However, as pointed out
and discussed in MJS2009, a plausible equalization of
![]() values can be
achieved by changing the ratio between the energy densities of magnetic
field and of
particles,
values can be
achieved by changing the ratio between the energy densities of magnetic
field and of
particles, ![]() .
For example, the six-fold decrease of
.
For example, the six-fold decrease of ![]() in the innNW lobe
results in desired increase in
in the innNW lobe
results in desired increase in
![]() in this lobe. This alternative
solution is marked in Fig. 10.
We discuss this solution in Sect. 6.2.
in this lobe. This alternative
solution is marked in Fig. 10.
We discuss this solution in Sect. 6.2.
Table 7:
Fitted physical parameters of the inner lobes for different values of
the lobe's
axial ratio ![]() .
.
A number of physical parameters fitted with the model for the
inner lobes of
J1548-3216, with the ages as above, are provided in Table 7. Columns (2)
and (3) give
their values for the innSE lobe with
![]() and innNW lobe with
and innNW lobe with
![]() ,
respectively, while Cols. (4) and (5) give their values for
these lobes but with
,
respectively, while Cols. (4) and (5) give their values for
these lobes but with ![]() .
Although the fitted values of
.
Although the fitted values of
![]() and
and ![]() differ a little from the values
differ a little from the values
![]() W
and
W
and
![]() kg m-3
used to
estimate the age from Eq. (4), their ratio
kg m-3
used to
estimate the age from Eq. (4), their ratio
![]() always
equals
always
equals
![]() .
This occurs because of the property of the DYNAGE algorithm allowing
determination of
the values of both
.
This occurs because of the property of the DYNAGE algorithm allowing
determination of
the values of both ![]() and
and ![]() by the fit of the model free
parameters to the observed size and power of a given source (lobe). The
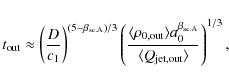
last two lines in Table 7
give the expansion velocity of the jet's head resulting from the model
and exhibit its deceleration with time. Since the length of the jet is
by the fit of the model free
parameters to the observed size and power of a given source (lobe). The
last two lines in Table 7
give the expansion velocity of the jet's head resulting from the model
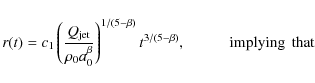
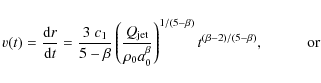
and exhibit its deceleration with time. Since the length of the jet is
|
(6) |
|
(7) |
|
(8) |
The next to last line in Table 7 gives the expansion velocity at the assumed radius of the radio core a0, while the last one gives this velocity at the actual length of the given inner lobe
6 Discussion of the results
In the sections below, we discuss the derived ages and physical parameters of the source, both its outer and inner double structures, as well as those associated with the original unperturbed ambient environment and the relict cocoon.
6.1 Spectral age of the outer and the inner structures
As expected, the synchrotron age of both the outer lobes,
![]() ,
increases
with distance from their edges. It starts from
,
increases
with distance from their edges. It starts from ![]() 25 Myr and rises to about 65-75
Myr in the centre of the old cocoon. The lowest estimated age, far from
the zero
value, can be related to the time that passed from the last
acceleration of the
emitting particles at the region of the old jet interaction with the
original
unperturbed IGM. However, in a number of similar spectral-ageing
analyses (cf. Liu et al. 1992;
Jamrozy et al. 2005,
2008) a mean
of the ratio between the
youngest and the oldest emitting particles is always about
25 Myr and rises to about 65-75
Myr in the centre of the old cocoon. The lowest estimated age, far from
the zero
value, can be related to the time that passed from the last
acceleration of the
emitting particles at the region of the old jet interaction with the
original
unperturbed IGM. However, in a number of similar spectral-ageing
analyses (cf. Liu et al. 1992;
Jamrozy et al. 2005,
2008) a mean
of the ratio between the
youngest and the oldest emitting particles is always about
![]() and is weakly dependent on the size and/or the age of sources. It means
that the youngest
synchrotron age is found usually between 5 Myr and
20 Myr for FRII-type sources with
and is weakly dependent on the size and/or the age of sources. It means
that the youngest
synchrotron age is found usually between 5 Myr and
20 Myr for FRII-type sources with
![]() kpc
and
kpc
and ![]() Myr
(cf. Machalski et al. 2004).
Similar
values (
Myr
(cf. Machalski et al. 2004).
Similar
values (![]() 18.7 Myr
and
18.7 Myr
and ![]() 20.3 Myr)
have been found in the detailed ageing
analysis of the DDRG J1453+3308 (Konar et al. 2006), for which
the time that passed
since the jets stopped actively feeding the hot spots was estimated by
Kaiser et al.
(2000) as about 1.1 Myr. We return to this point again in
Sect. 6.3.
20.3 Myr)
have been found in the detailed ageing
analysis of the DDRG J1453+3308 (Konar et al. 2006), for which
the time that passed
since the jets stopped actively feeding the hot spots was estimated by
Kaiser et al.
(2000) as about 1.1 Myr. We return to this point again in
Sect. 6.3.
The evidently curved age-distance tracks in Fig. 8, especially for the
outNW lobe,
support the expected deceleration of the jet head's advance speed and
probable
backflow present in giant radio galaxies (e.g. Schoenmakers
et al. 1998;
Lara et al.
2000). Indeed,
the advance speed of the jet's head given by Eq. (8),
![]() ,
and a backflow velocity,
,
and a backflow velocity, ![]() ,
will form opposite
vectors. If a quotient of separation between the strips in
Table 4
and a difference
between the derived spectral (synchrotron) ages in these strips,
,
will form opposite
vectors. If a quotient of separation between the strips in
Table 4
and a difference
between the derived spectral (synchrotron) ages in these strips,
![]() ,
is more than v(r)at a given
distance from the core, a backflow is present. If
,
is more than v(r)at a given
distance from the core, a backflow is present. If
![]() ,
then
,
then
![]() .
For example, the
entries in Table 4
show that, in outSE lobe at r=332 kpc,
.
For example, the
entries in Table 4
show that, in outSE lobe at r=332 kpc,
![]() and
and
![]() ,
while closer to the core at r=131 kpc:
,
while closer to the core at r=131 kpc:
![]() and
and
![]() .
In outNW lobe at
r=300 kpc,
.
In outNW lobe at
r=300 kpc,
![]() and
and ![]() ,
while at r=98 kpc:
,
while at r=98 kpc:
![]() and
and ![]() .
.
A spectral age for the new inner lobes is quite problematic.
Since this structure is
relatively smaller and much fainter than the outer structure, we were
not able to cut it into strips and to check whether and how much the
spectral index varies along the lobes. The spectral index map derived
from the the ATCA+VLA and VLA images at 1384 and
2495 MHz, published by S2008 (their Fig. 5), does not indicate
any steepening that
would signal a spectral ageing. Though the flux densities measured in
the entire inner
lobes (cf. Cols. (5) and (6) in Table 2) allowed the
CI model fit to the data and an
estimate of spectral breaks in the observed spectra, the fit's
uncertainty is so large
that the resulting ``mean'' spectral ages within the lobes are very
uncertain as being
formally in a range from ![]() 0.1 Myr
to
0.1 Myr
to ![]() 14 Myr.
Taking an uncertainty of
the
14 Myr.
Taking an uncertainty of
the ![]() value of the inner lobes into account (which determines their
volume, V, used to estimate
value of the inner lobes into account (which determines their
volume, V, used to estimate
![]() ), and that
even the axial expansion of the
lobes with the speed of light would require the time of
), and that
even the axial expansion of the
lobes with the speed of light would require the time of ![]() 0.5 Myr,
we may adopt
that a spectral age of these lobes is about
0.5 Myr,
we may adopt
that a spectral age of these lobes is about ![]() Myr.
Myr.
6.2 Dynamical age of the outer and the inner structures
Following similar ageing analysis made by MJS2009 for a limited sample
of ten giant
radio galaxies, we solved the dynamical age and other physical
parameters of the two
outer lobes independently and explored the resulting formal differences
between those
fitted parameters that should actually not differ in the opposite
lobes, like the jet
power and the central core density. In this way we can perform a deeper
search for
properties of the surrounding ambient medium and conditions of the
jets' propagation
during the active phases of the jet production in the common central
engine. In the
two kinds of proposed self-consistent solutions, we
require identical values
of ![]() and
and ![]() for the opposite lobes both of the outer and of the
inner structures. However, in MJS2009 we showed that the fits with such
an assumption
results in either decreasing or enlarging the age difference between
the lobes,
depending on the actual asymmetries in the lobes' length and
luminosity. The
self-consistent solution A for the outer
lobes of J1548-3216 enlarges the age
difference from
for the opposite lobes both of the outer and of the
inner structures. However, in MJS2009 we showed that the fits with such
an assumption
results in either decreasing or enlarging the age difference between
the lobes,
depending on the actual asymmetries in the lobes' length and
luminosity. The
self-consistent solution A for the outer
lobes of J1548-3216 enlarges the age
difference from ![]() 20 Myr
in the independent solution to
20 Myr
in the independent solution to ![]() 27 Myr
(cf.
the entries in Cols. (2)-(5) in Table 6). As the above
differences are too large to
be caused by a projection of the source on the sky, we consider the
solution B in
which we demand the same age for both lobes. Taking a mean of the age
values in the
independent solution, i.e.
27 Myr
(cf.
the entries in Cols. (2)-(5) in Table 6). As the above
differences are too large to
be caused by a projection of the source on the sky, we consider the
solution B in
which we demand the same age for both lobes. Taking a mean of the age
values in the
independent solution, i.e.
![]() Myr,
we find it as
satisfactory for the outer lobes. This is worth emphasizing that this
age fully
agrees with its estimate in S2008, (30-200) Myr, though they
derive it from another
consideration about the energy budget.
Myr,
we find it as
satisfactory for the outer lobes. This is worth emphasizing that this
age fully
agrees with its estimate in S2008, (30-200) Myr, though they
derive it from another
consideration about the energy budget.
As expected, the self-consistent
solution B suggests different exponents
![]() in the power-law density
profiles and different effective
injection spectral index
in the power-law density
profiles and different effective
injection spectral index ![]() ,
where
,
where ![]() value (according to
Eq. (6)) governs the lobe's length, while
value (according to
Eq. (6)) governs the lobe's length, while
![]() value influences the
energy losses and the resulting brightness of a given lobe. Different
fitted values
of
value influences the
energy losses and the resulting brightness of a given lobe. Different
fitted values
of ![]() and
and ![]() for the opposite outer lobes result in about
twice higher IGM density at the edge of the outer NW lobe as compared
to that at the
SE lobe. As a result, the bright rim and the two ``warm'' spots in the
outNW lobe may
indicate a higher pressure ratio between the lobe's head and the IGM,
in other words,
this lobe may be more overpressured than the opposite outSE lobe.
for the opposite outer lobes result in about
twice higher IGM density at the edge of the outer NW lobe as compared
to that at the
SE lobe. As a result, the bright rim and the two ``warm'' spots in the
outNW lobe may
indicate a higher pressure ratio between the lobe's head and the IGM,
in other words,
this lobe may be more overpressured than the opposite outSE lobe.
The age for the inner structure is estimated by assuming a
scenario in which
the new restarted jets propagate within rarefied and uniform (
![]() )
medium of the old outer cocoon formed by the old jet material that
passed through the
jet terminal shock and eventually partly mixed with the surrounding
thermal gas (cf.
the discussion in Kaiser et al. 2000). The
assumption of uniformity is justified by
the fact that the sound crossing time within the outer lobes is much
longer than the dynamical timescales of evolution of the outer
structure. In the case of the
inner structure, the age solution is formally undefined due to almost
pure power-law
radio spectrum of the new lobes. On the one hand, such a lack of the
spectrum
steepening can tell us that the structure is rather young; on the other
hand, it
prevents determination of its quantitative value (cf. also SSS2003). In
the framework
of the DYNAGE algorithm the inability to specify an explicit age
solution means that
the space of the model's free parameters (
)
medium of the old outer cocoon formed by the old jet material that
passed through the
jet terminal shock and eventually partly mixed with the surrounding
thermal gas (cf.
the discussion in Kaiser et al. 2000). The
assumption of uniformity is justified by
the fact that the sound crossing time within the outer lobes is much
longer than the dynamical timescales of evolution of the outer
structure. In the case of the
inner structure, the age solution is formally undefined due to almost
pure power-law
radio spectrum of the new lobes. On the one hand, such a lack of the
spectrum
steepening can tell us that the structure is rather young; on the other
hand, it
prevents determination of its quantitative value (cf. also SSS2003). In
the framework
of the DYNAGE algorithm the inability to specify an explicit age
solution means that
the space of the model's free parameters (
![]() ,
,
![]() ,
t,
,
t,
![]() )
is very large (the space between two diagonal lines for a given
lobe in Fig. 10).
Within this space, kinetic energy of the jet,
)
is very large (the space between two diagonal lines for a given
lobe in Fig. 10).
Within this space, kinetic energy of the jet,
![]() ,
is almost constant, so that the criterion of its minimum (a
crucial aspect of the algorithm) is not applicable. As shown in
Sect. 5.3, the above
space can be reduced a little by fixing values of some of these
parameters, e.g. the
value of
,
is almost constant, so that the criterion of its minimum (a
crucial aspect of the algorithm) is not applicable. As shown in
Sect. 5.3, the above
space can be reduced a little by fixing values of some of these
parameters, e.g. the
value of ![]() (hence the diamond-shaped areas in Fig. 10).
(hence the diamond-shaped areas in Fig. 10).
However, the straight, unaged spectra of the inner lobes are
not just a single factor
precluding age determination. The other one is asymmetry both in their
length and
brightness, which causes the spaces of parameters allowed for the
opposite lobes
to not overlap each other. The assumption of uniform density of the
pre-existing
cocoon with ![]() precludes a differentiation of this parameter for the lobes,
thus we pointed out another parameter that also rules the age solution,
namely the
ratio between energy densities of the magnetic field and of the
particles,
precludes a differentiation of this parameter for the lobes,
thus we pointed out another parameter that also rules the age solution,
namely the
ratio between energy densities of the magnetic field and of the
particles, ![]() .
The calculations indicate that a significant departure from the
equipartition
conditions in one of the inner lobes (but not in the opposite one)
enables a relative
equalization of the jet powers and attainment of comparable ages for
both lobes.
Therefore, a combination of the alternative
solution for the innNW lobe and the
independent one for the innSE lobe is required to
attain comparable values of
the three parameters involved:
.
The calculations indicate that a significant departure from the
equipartition
conditions in one of the inner lobes (but not in the opposite one)
enables a relative
equalization of the jet powers and attainment of comparable ages for
both lobes.
Therefore, a combination of the alternative
solution for the innNW lobe and the
independent one for the innSE lobe is required to
attain comparable values of
the three parameters involved:
![]() ,
,
![]() ,
and
,
and
![]() .
Although this alternative age solution for the innNW lobe is only a
numerical result of the fitting algorithm, such a departure seems to be
supported by X-ray observations, which allow measurements of electron
energies of
radio lobes and magnetic fields. In the lobes of the well-studied
nearby radio
galaxies Centaurus B and Fornax A, the inferred
electron energy densities exceed
those of magnetic fields by a factor of 5-8 (cf. Tashiro
et al. 1998,
2009; Isobe
et al. 2006).
.
Although this alternative age solution for the innNW lobe is only a
numerical result of the fitting algorithm, such a departure seems to be
supported by X-ray observations, which allow measurements of electron
energies of
radio lobes and magnetic fields. In the lobes of the well-studied
nearby radio
galaxies Centaurus B and Fornax A, the inferred
electron energy densities exceed
those of magnetic fields by a factor of 5-8 (cf. Tashiro
et al. 1998,
2009; Isobe
et al. 2006).
Of course, the above combined age solution is odd, in which a
significant departure
from equipartition conditions happens in only one lobe of the inner
double structure
evolving in supposedly uniform medium,
![]() const.
Perhaps, these different conditions might arise when the magnetic field
within the old
cocoon is strongly inhomogeneous giving rise to enhanced observable
radiation in the
high-field regions (cf. Eilek et al. 1997; Kaiser 2005). An
inhomogeneity of the field
may indicate a faint blob of emission detected at all the observed
frequencies between
the radio core and the bright end of the innNW lobe
(cf. Fig. 2).
Understanding an
expected criticism of the above speculations, we argue that the
estimated dynamical
age of the inner lobes of the investigated radio galaxy,
const.
Perhaps, these different conditions might arise when the magnetic field
within the old
cocoon is strongly inhomogeneous giving rise to enhanced observable
radiation in the
high-field regions (cf. Eilek et al. 1997; Kaiser 2005). An
inhomogeneity of the field
may indicate a faint blob of emission detected at all the observed
frequencies between
the radio core and the bright end of the innNW lobe
(cf. Fig. 2).
Understanding an
expected criticism of the above speculations, we argue that the
estimated dynamical
age of the inner lobes of the investigated radio galaxy,
![]() Myr,
is plausible. This age accords with its spectral age estimate given in
Sect. 5.3.
Myr,
is plausible. This age accords with its spectral age estimate given in
Sect. 5.3.
6.3 Kinetic energy and internal pressure
Kinetic energy delivered by the original jets to the old cocoon during
the time of
![]() 132 Myr
is found to be
132 Myr
is found to be ![]() 1054
J, while the energy radiated out is
1054
J, while the energy radiated out is
![]() J
(cf. entries in Table 6).
The latter value is about twice
higher than estimated in S2008 using another approach to the energy
budget. One
of the important results of our dynamical analysis is the power of the
old and the new
jets. We find that the jet power during the previous phase of the
nuclear activity was
J
(cf. entries in Table 6).
The latter value is about twice
higher than estimated in S2008 using another approach to the energy
budget. One
of the important results of our dynamical analysis is the power of the
old and the new
jets. We find that the jet power during the previous phase of the
nuclear activity was
![]() W,
while the power of the new jets (although we could only
determine a range of its value
W,
while the power of the new jets (although we could only
determine a range of its value
![]() W
to
W
to ![]() W;
cf. Fig. 10)
seems to be almost one order less than the former one, but in a
good agreement with its range of
W;
cf. Fig. 10)
seems to be almost one order less than the former one, but in a
good agreement with its range of
![]() erg s-1
if
erg s-1
if
![]() estimated
by S2008 (cf. their Fig. 16). Such a high ratio
estimated
by S2008 (cf. their Fig. 16). Such a high ratio
![]() impairs
results of the ageing analysis of a few other
DDRGs published by Kaiser et al. (2000) in which
they assumed the same
impairs
results of the ageing analysis of a few other
DDRGs published by Kaiser et al. (2000) in which
they assumed the same ![]() values
during two successive phases of activity. The difference between the
outer and
inner jet power found in our analysis may indicate that the spin of the
central BH
cannot be the only factor determining the total power of the
relativistic outflow, since
this spin is not expected to change significantly in a relatively short
timescale,
which would be involved. However, we note that, in the original
Blandford & Znajek
(1977) model, the power of the outflow extracted from the ergosphere of
the rotating BH
depends not only on the BH spin, but also on the magnetic field
intensity within the
innermost parts of the accretion disk, which in turn should depend on
the
accretion rate (or, possibly, on the accretion mode). Thus, the
difference between the
power of the original and the restarted jet in the radio galaxy
J1545-3216 may still
be reconciled with the modified spin paradigm (Sikora et al. 2007; Sikora 2009)
if the accretion disk undergoes significant
structural changes between different
activity epochs in a single source.
values
during two successive phases of activity. The difference between the
outer and
inner jet power found in our analysis may indicate that the spin of the
central BH
cannot be the only factor determining the total power of the
relativistic outflow, since
this spin is not expected to change significantly in a relatively short
timescale,
which would be involved. However, we note that, in the original
Blandford & Znajek
(1977) model, the power of the outflow extracted from the ergosphere of
the rotating BH
depends not only on the BH spin, but also on the magnetic field
intensity within the
innermost parts of the accretion disk, which in turn should depend on
the
accretion rate (or, possibly, on the accretion mode). Thus, the
difference between the
power of the original and the restarted jet in the radio galaxy
J1545-3216 may still
be reconciled with the modified spin paradigm (Sikora et al. 2007; Sikora 2009)
if the accretion disk undergoes significant
structural changes between different
activity epochs in a single source.
The DYNAGE algorithm clearly shows that a demand of
![]() would lead
to an unlikely solution of the model for the inner structure with the
lobes'
age
would lead
to an unlikely solution of the model for the inner structure with the
lobes'
age ![]() Myr,
the old cocoon density
Myr,
the old cocoon density
![]() kg m-3,
and the average expansion
speed
kg m-3,
and the average expansion
speed
![]() !
One can conclude that until an
independent measure of
!
One can conclude that until an
independent measure of ![]() is available (e.g. from internal
depolarization of radio emission and/or X-ray inverse-Compton emission
from the region
of the inner lobes), a numerical algorithm like the DYNAGE will not be
able to specify
more accurate values of
is available (e.g. from internal
depolarization of radio emission and/or X-ray inverse-Compton emission
from the region
of the inner lobes), a numerical algorithm like the DYNAGE will not be
able to specify
more accurate values of ![]() ,
,
![]() ,
,
![]() ,
etc.
,
etc.
The internal (cocoon) pressures, ![]() ,
resemble the jets' disproportion. The
pressure in the old cocoon, derived from the fit, is about five times
higher than the
pressure estimate within the new younger lobes (cf. the entries in
Tables 5
and 7).
However, this is a result of the different equations of state assumed
for the jet,
particle, and magnetic field ``fluids'': non-relativistic for the old
cocoon and the
relativistic one for the inner double structure. If
,
resemble the jets' disproportion. The
pressure in the old cocoon, derived from the fit, is about five times
higher than the
pressure estimate within the new younger lobes (cf. the entries in
Tables 5
and 7).
However, this is a result of the different equations of state assumed
for the jet,
particle, and magnetic field ``fluids'': non-relativistic for the old
cocoon and the
relativistic one for the inner double structure. If ![]() ,
the cocoon pressure is
,
the cocoon pressure is
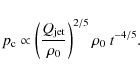
For a lobe with given D and

Assuming the non-relativistic equation of state for a lobe at age t, the model requires a higher jet power and predicts proportionally the higher core density needed to fit the lobe's length and power, higher than the values of
6.4 Magnetic fields
With the standard assumption about the energy equipartition between the
relativistic
particles and magnetic fields, the derived strength of uniform magnetic
field in the
outer lobes, ![]() ,
slightly varies from
,
slightly varies from ![]() 0.33 nT
at the edges of the
lobes to
0.33 nT
at the edges of the
lobes to ![]() 0.24 nT
in the centre of the old cocoon. Similar values are derived
from the magnetic energy density,
0.24 nT
in the centre of the old cocoon. Similar values are derived
from the magnetic energy density, ![]() ,
via the dynamical considerations.
For the inner lobes, the field estimates are incompatible with the
values derived
with the Miley (1980)
formula during the spectral-ageing analysis, which are
almost twice higher than the corresponding values implied by the
dynamical analysis.
Our calculations (in the framework of the KDA model) show that, to
increase
strength of magnetic field in the inner lobes to its level derived from
the spectral
analysis, it is necessary to assume the non-relativistic equations of
state for the
jet's material and the magnetic field ``fluids'', as well as to admit
some admixture of
thermal particles. Obviously such an assumption would level out the
propagation
conditions during the initial and the restarted phases of activity,
which is rather
unacceptable.
,
via the dynamical considerations.
For the inner lobes, the field estimates are incompatible with the
values derived
with the Miley (1980)
formula during the spectral-ageing analysis, which are
almost twice higher than the corresponding values implied by the
dynamical analysis.
Our calculations (in the framework of the KDA model) show that, to
increase
strength of magnetic field in the inner lobes to its level derived from
the spectral
analysis, it is necessary to assume the non-relativistic equations of
state for the
jet's material and the magnetic field ``fluids'', as well as to admit
some admixture of
thermal particles. Obviously such an assumption would level out the
propagation
conditions during the initial and the restarted phases of activity,
which is rather
unacceptable.
7 Conclusions
The new low-frequency and high-frequency radio continuum maps of the double-double radio galaxy J1548-3216 (PKS 1545-321) are used to complement its already published maps at 22 and 13 cm (Saripalli et al. 2003; Safouris et al. 2008) and to perform both the spectral-ageing and the dynamical analysis of this remarkable giant DDRG, in which the newly restarted jets propagate through the bright cocoon formed by a previous active phase of its AGN. The current activity is indicated by the radio core.
The maps of the outer and the inner radio lobes at five observing frequencies from 334 to 4860 MHz allow determination of the spectral index distribution along the outer lobes, as well as extension of the spectral index frequency range in the inner lobes. The spectral index distribution in the outer lobes implies a distribution of the spectral (synchrotron) age of emitting particles along the ridge of these lobes, which increases from about 25 Myr at the edges of the extended old cocoon structure to about 65-75 Myr in the vicinity of the core. A velocity equivalent to the quotient of separation between the selected positions on the ridge and the difference in synchrotron age between these positions, which is higher than the advance speed of the jet's head, indicates a significant backflow in the old cocoon. Moreover, its average speed evidently decreases from the cocoon's edges towards the core.
Using the DYNAGE algorithm (Machalski et al. 2007), we attempted to specify the dynamical age of both the outer and the inner pairs of radio lobes. Because each pair is characterized by a specific asymmetry in the lobes' length and brightness, we searched for a self-consistent solution of the analytical model, Demanding the same values for the jet power, central core density, and a comparable age for the opposite lobes, we find that:
- (1)
- The age of the outer and the inner lobes is
 Myr
and
Myr
and  Myr,
respectively. However the derived age of the inner lobes is quite
problematic because
the almost pure power-law spectrum of its lobes prevents a unique age
solution
without any independent knowledge of either the restarted jet power or
the ambient
density within the old cocoon through which it propagates. This problem
is solved with
the assumption of limiting values for the latter parameter discussed in
detail in
Sect. 5.3.
Myr,
respectively. However the derived age of the inner lobes is quite
problematic because
the almost pure power-law spectrum of its lobes prevents a unique age
solution
without any independent knowledge of either the restarted jet power or
the ambient
density within the old cocoon through which it propagates. This problem
is solved with
the assumption of limiting values for the latter parameter discussed in
detail in
Sect. 5.3.
- (2)
- If the above assumption is correct, the jet powers during the initial and the restarted phase of activity are not similar. The restarted jet is one order less powerful than the original one. We think that this can support a hypothesis that the jet power is much more dependent (if not only) on the intermittent jet activity, than on the spin of a black hole. This intermittent activity can be connected with a stochastic transition between two accretion modes - the standard one where the angular momentum is transmitted outwards by viscous torques within a disk and - the ``magnetic'' one, in which large-scale poloidal fields are developed (cf. Nipoti et al. 2005; Körding et al. 2006).
- (3)
- The magnetic field strength estimates along the ridge of the outer double structure vary slightly from the edges of the lobes towards the centre of the old cocoon. Unexpectedly, the field strengths in the inner lobes resulting from the dynamical analysis seem to be twice lower than the corresponding values estimated in the spectral-ageing analysis. This discrepancy arises from the assumed different adiabatic indices in the equations of state: a non-relativistic one for the outer structure and the relativistic one for the inner double structure. The non-relativistic equation of state implies some energy dissipation process between magnetic field and thermal particles whose presence in the old cocoon is expected. Therefore in the non-relativistic conditions for the magnetic energy evolution, a stronger magnetic field would be necessary to account for the observed brightness of the inner lobes.
The authors are grateful and indebted to Drs. Vicky Safouris and Ravi Subrahmanyan for access to the archival ATCA and VLA data, to Drs. Matteo Murgia and Karl-Heinz Mack for access to the SYNAGE software, and to the anonymous referee for valuable remarks and suggestions that helped us to improve the paper. This project was supported in part by the MNiSW funds for scientific research in years 2009-2012 under contract No. 3812/B/H03/2009/36.
Appendix A
Table A.1: Notations for the free parameters in the DYNAGE algorithm and other physical parameters used through the paper.
References
- Baars, J. W. M., Genzel, R., Pauliny-Toth, I. I. K., & Witzel, A. 1977, A&A, 61, 99 [NASA ADS] [Google Scholar]
- Begelman, M. C., & Li, Z. Y. 1994, ApJ, 426, 259 [Google Scholar]
- Belsole, E., Worrall, D. M., Hardcastle, M. J., & Croston, J. H. 2007, MNRAS, 381, 1109 [NASA ADS] [CrossRef] [Google Scholar]
- Blandford, R. D., & Znajek, R. 1977, MNRAS, 179, 433 [NASA ADS] [CrossRef] [Google Scholar]
- Blundell, K. M., Rawlings, S., & Willott, C. J. 1999, AJ, 117, 677 [Google Scholar]
- Brocksopp, C., Kaiser, C. R., Schoenmakers, A. P., & de Bruyn, A. G. 2007, MNRAS, 382, 1019 [NASA ADS] [CrossRef] [Google Scholar]
- Carilli, C. L., Perley, R. A., Dreher, J. W., & Leahy, J. P. 1991, ApJ, 383, 554 [NASA ADS] [CrossRef] [Google Scholar]
- Celotti, A., & Ghisellini, G. 2008, MNRAS, 385, 283 [NASA ADS] [CrossRef] [Google Scholar]
- Clarke, D. A. 1997, in Computational Astrophysics; 12th Kingston Meeting on Theoretical Astrophysics, ed. D. A. Clarke, & M. J. West, ASP Conf. Ser., 123, 255 [Google Scholar]
- Clarke, D. A., & Burns, J. O. 1991, ApJ, 369, 308 [NASA ADS] [CrossRef] [Google Scholar]
- Condon, J. J., Cotton, W. D., Greisen, E. W., et al. 1998, AJ, 115, 1693 [NASA ADS] [CrossRef] [Google Scholar]
- Croston, J. H., Hardcastle, M. J., Harris, D. E., et al. 2005, ApJ, 626, 733 [NASA ADS] [CrossRef] [Google Scholar]
- Croston, J. H., Pratt, G. W., Böhringer, H., Arnaud, M., et al. 2008, A&A, 487, 431 [NASA ADS] [CrossRef] [EDP Sciences] [Google Scholar]
- Eilek, J. A., Melrose, D. B., & Walker, M. A. 1997, ApJ, 483, 282 [NASA ADS] [CrossRef] [Google Scholar]
- Fanaroff, B. L., & Riley, J. M. 1974, MNRAS, 167, 31P [Google Scholar]
- Garrington, S. T., & Conway, R. G. 1991, MNRAS, 250, 198 [NASA ADS] [Google Scholar]
- Isobe, N., Makishima, K., Tashiro, M., et al. 2006, ApJ, 645, 256 [NASA ADS] [CrossRef] [Google Scholar]
- Jamrozy, M., Machalski, J., Mack, K.-H., & Klein, U. 2005, A&A, 433, 467 [NASA ADS] [CrossRef] [EDP Sciences] [Google Scholar]
- Jamrozy, M., Konar, C., Machalski, J., & Saikia, D. J. 2008, MNRAS, 385, 1286 (MJS2008) [NASA ADS] [CrossRef] [Google Scholar]
- Jones, P. A., & McAdam, W. B. 1992, ApJS, 80, 137 [NASA ADS] [CrossRef] [Google Scholar]
- Kaiser, C. R. 2000, A&A, 362, 447 [NASA ADS] [Google Scholar]
- Kaiser, C. R. 2005, MNRAS, 360, 176 [NASA ADS] [CrossRef] [Google Scholar]
- Kaiser, C. R., & Alexander, P. 1997, MNRAS, 286, 215 [NASA ADS] [CrossRef] [Google Scholar]
- Kaiser, C. R., Dennett-Thorpe, J., & Alexander, P. 1997, MNRAS, 292, 723 (KDA) [NASA ADS] [CrossRef] [Google Scholar]
- Kaiser, C. R., Schoenmakers, A. P., & Röttgering, J. A. 2000, MNRAS, 315, 381 [Google Scholar]
- Kataoka, J., & Stawarz, L. 2005, ApJ, 622, 797 [NASA ADS] [CrossRef] [Google Scholar]
- King, I. R. 1972, ApJ, 174, L123 [NASA ADS] [CrossRef] [Google Scholar]
- Kino, M., & Kawakatu, N. 2005, MNRAS, 364, 659 [NASA ADS] [Google Scholar]
- Konar, C., Saikia, D. J., Jamrozy, M., & Machalski, J. 2006, MNRAS, 372, 693 [NASA ADS] [CrossRef] [Google Scholar]
- Körding, E. G., Jester, S., & Fender, R. 2006, MNRAS, 372, 1366 [NASA ADS] [CrossRef] [Google Scholar]
- Lara, L., Mack, K.-H., Lacy, M., et al. 2000, A&A, 356, 63 [NASA ADS] [Google Scholar]
- Liu, R., Pooley, G., & Riley, J. M. 1992, MNRAS, 257, 545 [NASA ADS] [CrossRef] [Google Scholar]
- Machalski, J., Chyzy, K. T., & Jamrozy, M. 2004, AcA, 54, 249 [Google Scholar]
- Machalski, J., Chyzy, K. T., Stawarz, L., & Koziel, D. 2007, A&A, 462, 43 [NASA ADS] [CrossRef] [EDP Sciences] [Google Scholar]
- Machalski, J., Jamrozy, M., & Saikia, D. J. 2009, MNRAS, 395, 812 (MJS2009) [NASA ADS] [CrossRef] [Google Scholar]
- Manolakou, K., & Kirk, J. G. 2002, A&A, 391, 127 [NASA ADS] [CrossRef] [EDP Sciences] [Google Scholar]
- Murgia, M. 1996, Laurea Thesis, Univ. of Bologna [Google Scholar]
- Miley, G. K. 1980, ARA&A, 18, 185 [Google Scholar]
- Myers, S. T., & Spangler, S. R. 1985, ApJ, 291, 52 [NASA ADS] [CrossRef] [Google Scholar]
- Nipoti, C., Blundell, K. M., & Binney, J. 2005, MNRAS, 361, 633 [NASA ADS] [CrossRef] [Google Scholar]
- Safouris, V., Subrahmanyan, R., Bicknell, G., & Saripalli, L. 2008, MNRAS, 385, 2117 (S2008) [NASA ADS] [CrossRef] [Google Scholar]
- Saripalli, L., Subrahmanyan, R., & Udaya Shankar, N. 2003, ApJ, 590, 181 (SSS2003) [NASA ADS] [CrossRef] [Google Scholar]
- Schoenmakers, A. P., Mack, K,-H., Lara, L., et al. 1998, A&A, 336, 455 [NASA ADS] [Google Scholar]
- Sikora, M. 2009, Astron. Nachr., 330, 291 [NASA ADS] [CrossRef] [Google Scholar]
- Sikora, M., & Madejski, G. M. 2000, ApJ, 534, 109 [NASA ADS] [CrossRef] [Google Scholar]
- Sikora, M., Stawarz, L., & Lasota, J. P. 2007, ApJ, 658, 815 [NASA ADS] [CrossRef] [Google Scholar]
- Slee, O. B. 1995, AuJPh, 48, 143 [Google Scholar]
- Subrahmanyan, R., Saripalli, L., & Hunstead, R. W. H. 1996, MNRAS, 279, 257 [NASA ADS] [CrossRef] [Google Scholar]
- Tashiro, M., Kaneda, H., Makishima, K., et al. 1998, ApJ, 499, 713 [NASA ADS] [CrossRef] [Google Scholar]
- Tashiro, M., Isobe, N., Seta, H., Matsuta, K., & Yaji, Y. 2009, PASJ, 61, 327 [Google Scholar]
Footnotes
- ... lobes
![[*]](/icons/foot_motif.png)
- In MJS2009 we showed that for some sources the solution A can diminish the age difference. This usually happens if the shorter lobe is brighter than the larger one.
All Tables
Table 1: Observing log.
Table 2: Flux densities of the total structure (Total) and the outer (outNW and outSE) and inner (innNW and innSE) lobes of J1548-3216.
Table 3: Flux densities of the radio core.
Table 4: Break frequency, equipartition magnetic field strength, and spectral age of emitting particles in consecutive strips through the outer lobes of J1548-3216 (cf. Fig. 4).
Table 5: Observational parameters of the outer and the inner lobes used to fit the dynamical model.
Table 6:
Fitted physical parameters of the outer lobes, with
brackets ![]() showing the values assumed within the given
solution, (cf. the text).
showing the values assumed within the given
solution, (cf. the text).
Table 7:
Fitted physical parameters of the inner lobes for different values of
the lobe's
axial ratio ![]() .
.
Table A.1: Notations for the free parameters in the DYNAGE algorithm and other physical parameters used through the paper.
All Figures
|
|
Figure 1:
Full-resolution GMRT 334 and 619 MHz, as well as VLA DnC-array
4860 MHz
images of the entire structure of the radio galaxy J1548-3216
(PKS 1545-321). The
first contour level, C1, is given in each image. The contour levels are
(1, 2, 4,
8, ...) |
| Open with DEXTER | |
| In the text | |
|
|
Figure 2:
GMRT, ATCA and VLA images of the inner double structure of J1548-3216.
The
first contour level is given in each image. The contour levels are (1,
1.41, 2, 2.83,
4, 5.66, ...) |
| Open with DEXTER | |
| In the text | |
|
|
Figure 3: Longitudinal section along the inner double structure. The horizontal brackets indicate regions of the structure subject to the spectral and dynamical analyses. |
| Open with DEXTER | |
| In the text | |
|
|
Figure 4:
Radio images of the outer lobes cleaned from the inner double structure
and
convolved to the angular resolution of
|
| Open with DEXTER | |
| In the text | |
|
|
Figure 5: a) Integrated flux densities in the consecutive strips along the outer double structure vs. distance from the core. The vertical lines indicate positions of brightness peaks in the inner lobes. b) Low-frequency and high-frequency spectral indices in these strips. |
| Open with DEXTER | |
| In the text | |
|
|
Figure 6: Spectra of the outer lobes fitted with the JP model, as described in the text. |
| Open with DEXTER | |
| In the text | |
|
|
Figure 7:
Spectra of the slices S1-S9 in the outSE lobe and N10-N18 in the outNW
lobe, fitted with the JP model. The spectra of particular
strips are arbitrarily
shifted. Reduced values of |
| Open with DEXTER | |
| In the text | |
|
|
Figure 8: Spectral age of relativistic particles in the outer structure cleaned from the inner lobes plotted vs. distance from the radio core. |
| Open with DEXTER | |
| In the text | |
|
|
Figure 9: Spectra of the inner lobes fitted with the CI model, as described in the text. |
| Open with DEXTER | |
| In the text | |
|
|
Figure 10:
Model solution for the inner lobes. The two pairs of dotted diagonal
lines
for each of the lobes indicate the age vs. jet-power relation
corresponding to the
limiting values of the lobe's axial ratio, |
| Open with DEXTER | |
| In the text | |
Copyright ESO 2010
Current usage metrics show cumulative count of Article Views (full-text article views including HTML views, PDF and ePub downloads, according to the available data) and Abstracts Views on Vision4Press platform.
Data correspond to usage on the plateform after 2015. The current usage metrics is available 48-96 hours after online publication and is updated daily on week days.
Initial download of the metrics may take a while.