| Issue |
A&A
Volume 509, January 2010
|
|
|---|---|---|
| Article Number | A12 | |
| Number of page(s) | 13 | |
| Section | Interstellar and circumstellar matter | |
| DOI | https://doi.org/10.1051/0004-6361/200912708 | |
| Published online | 12 January 2010 | |
The long-wavelength emission of interstellar PAHs: characterizing the spinning dust contribution
N. Ysard - L. Verstraete
Institut d'Astrophysique Spatiale, UMR 8617, Université Paris-Sud, 91405 Orsay, France
Received 17 June 2009 / Accepted 24 September 2009
Abstract
Context. The emission of cold dust grains at long
wavelengths will soon be observed by the Planck and Herschel satellites
and will provide new constraints on the nature of interstellar dust. In
particular, the microwave galactic anomalous foreground detected
between 10 to 90 GHz, proposed as coming from small spinning
grains (PAHs), should help to define these species better. Moreover,
understanding the fluctuations of the anomalous foreground
quantitatively over the sky is crucial for CMB studies.
Aims. We focus on the long-wavelength emission of
interstellar PAHs in their vibrational and rotational transitions. We
present here the first model that coherently describes the
PAH emission from the near-IR to microwave range.
Methods. We take quantum effects into account to
describe the rotation of PAHs and compare our results to current models
of spinning dust to assess the validity of the classical treatment
used. Between absorptions of stellar photons, we followed the
rovibrational radiative cascade of PAHs. We used the exact-statistical
method of Draine & Li to derive the distribution of
PAH internal energy and followed a quantum approach for the
rotational excitation induced by vibrational (IR) transitions. We also
examined the influence of the vibrational relaxation scheme and of the
low-energy cross-section on the PAH emission. We study the emissivity
of spinning PAHs in a variety of physical conditions (radiation field
intensity and gas density), search for specific signatures in this
emission that can be looked for observationally, and discuss how the
anomalous foreground may constrain the PAH size distribution.
Results. Simultaneously predicting the vibrational
and rotational emission of PAHs, our model can explain the observed
emission of the Perseus molecular cloud from the IR to the microwave
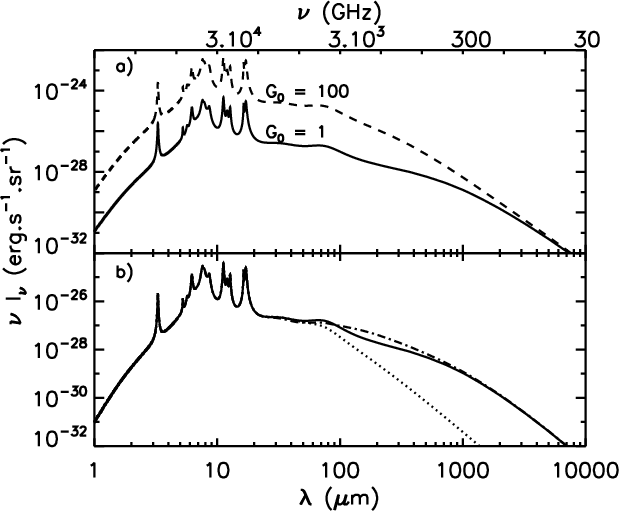
range with plausible PAH properties. We show that for
![]() mm
the PAH vibrational emission no longer scales with the radiation field
intensity (G0), unlike the
mid-IR part of the spectrum (which scales with G0).
This emission represents less than 10% of the total dust
emission at 100 GHz. Similarly, we find the broadband
emissivity of spinning PAHs per carbon atom to be rather constant for
mm
the PAH vibrational emission no longer scales with the radiation field
intensity (G0), unlike the
mid-IR part of the spectrum (which scales with G0).
This emission represents less than 10% of the total dust
emission at 100 GHz. Similarly, we find the broadband
emissivity of spinning PAHs per carbon atom to be rather constant for
![]() and for proton densities
and for proton densities ![]() cm-3.
In the diffuse ISM, photon exchange and gas-grain interactions play
comparable roles in exciting the rotation of PAHs, and the emissivity
of spinning PAHs is dominated by the contribution of small species
(bearing less than 100 C atoms). We show that the
classical description of rotation used in previous works is a good
approximation and that unknowns in the vibrational relaxation scheme
and low-energy cross-section affect the PAH rotational emissivity
around 30 GHz by less than 15%.
cm-3.
In the diffuse ISM, photon exchange and gas-grain interactions play
comparable roles in exciting the rotation of PAHs, and the emissivity
of spinning PAHs is dominated by the contribution of small species
(bearing less than 100 C atoms). We show that the
classical description of rotation used in previous works is a good
approximation and that unknowns in the vibrational relaxation scheme
and low-energy cross-section affect the PAH rotational emissivity
around 30 GHz by less than 15%.
Conclusions. The contrasted behaviour of the PAH
vibrational and rotational emissivities with G0
provides a clear prediction that can be tested against observations of
anomalous and dust mid-IR emissions: this is the subject of a companion
paper. Comparison of these emissions complemented with radio
observations (21 cm or continuum) will provide constraints on
the fraction of small species and the electric dipole moment of
interstellar PAHs.
Key words: ISM: general - dust, extinction - radiation mechanisms: general
1 Introduction
The mid-IR spectrum of the interstellar medium (ISM) shows prominent
bands from 3 to 17 ![]() m, which account for one third of the energy
emitted by interstellar dust. Such bands are emitted by very small
(subnanometric-sized) dust particles during internal energy
fluctuations triggered by the absorption of a stellar photon (Sellgren
1984). The positions of these bands suggest there are aromatic,
hydrogenated cycles in these grains. Léger
& Puget (1984) and Allamandola
et al. (1985) proposed polycyclic aromatic
hydrocarbons (PAHs) as the carriers of these bands. Despite two decades
of experimental and theoretical efforts, the match (band positions and
intensities) between data only available on small species and
observations still remains elusive, as illustrated recently by the work
of Peeters et al. (2002)
and Kim & Saykally (2002).
Given their important role in the ISM (e.g., gas heating, Habart
et al. 2001; UV extinction, Joblin et al. 1992), it
is necessary to find other ways to constrain the properties of
interstellar PAHs.
m, which account for one third of the energy
emitted by interstellar dust. Such bands are emitted by very small
(subnanometric-sized) dust particles during internal energy
fluctuations triggered by the absorption of a stellar photon (Sellgren
1984). The positions of these bands suggest there are aromatic,
hydrogenated cycles in these grains. Léger
& Puget (1984) and Allamandola
et al. (1985) proposed polycyclic aromatic
hydrocarbons (PAHs) as the carriers of these bands. Despite two decades
of experimental and theoretical efforts, the match (band positions and
intensities) between data only available on small species and
observations still remains elusive, as illustrated recently by the work
of Peeters et al. (2002)
and Kim & Saykally (2002).
Given their important role in the ISM (e.g., gas heating, Habart
et al. 2001; UV extinction, Joblin et al. 1992), it
is necessary to find other ways to constrain the properties of
interstellar PAHs.
The Planck and Herschel data will soon trace the emission of
cold interstellar grains in the interstellar medium. Due to their small
size, PAHs are heated sporadically (every few months in the diffuse
ISM) by absorption of stellar photons and have a high probability of
being in low-energy states (Draine &
Li 2001). Interstellar PAHs may thus contribute significantly
to the emission at long wavelength (
![]() mm). In this
context, an unexpected emission excess called anomalous
foreground, correlated to dust emission, has been discovered
between 10 and 90 GHz (de Oliveira-Costa et al. 2002;
Leitch
et al. 1997). In this spectral range, several
galactic emission components (synchrotron, free-free, and thermal dust)
contribute with a comparable magnitude, and only recently has the
anomalous foreground been separated in WMAP data (Miville-Deschênes et al. 2008).
Spinning, small dust grains were first proposed by Draine
& Lazarian (1998) (hereafter DL98) as a
possible origin to this anomalous component. Since then, analysis of
observations has suggested that the anomalous foreground is correlated
to small grain emission (Casassus et al. 2006;
Lagache 2003).
mm). In this
context, an unexpected emission excess called anomalous
foreground, correlated to dust emission, has been discovered
between 10 and 90 GHz (de Oliveira-Costa et al. 2002;
Leitch
et al. 1997). In this spectral range, several
galactic emission components (synchrotron, free-free, and thermal dust)
contribute with a comparable magnitude, and only recently has the
anomalous foreground been separated in WMAP data (Miville-Deschênes et al. 2008).
Spinning, small dust grains were first proposed by Draine
& Lazarian (1998) (hereafter DL98) as a
possible origin to this anomalous component. Since then, analysis of
observations has suggested that the anomalous foreground is correlated
to small grain emission (Casassus et al. 2006;
Lagache 2003).
In this paper, we study the emission of PAHs with particular emphasis on the long-wavelength part of the spectrum. In this spectral range, the emission is dominated by species in low-energy states for which each photon exchange represents a large energy fluctuation. To derive the internal energy distribution of PAHs, we use here the exact statistical method described in Draine & Li (2001). We include low-frequency bands to the vibrational mode spectrum of interstellar PAHs and examine the influence of the internal vibrational redistribution hypothesis (see Sect. 3) often used to describe their vibrational relaxation. We describe the rotation of PAHs with a quantum approach where specific processes in the rovibrational relaxation are naturally included (molecular recoil after photon emission; rovibrational transitions that leave the angular momentum of the molecule unchanged or Q bands). We present in a variety of interstellar phases the rovibrational (IR) and broadband rotational (spinning) emission of PAHs in a consistent fashion. Our model results are compared to observations of the interstellar emission from the IR to the microwave range and show how the size distribution and electric dipole moments of interstellar PAHs may be constrained.
The paper is organized as follows. Section 2 describes the properties of PAHs adopted in this work. Section 3 discusses the internal energy distribution of PAHs and associated rovibrational emission. Sections 4 and 5 discuss the rotational excitation and emission of PAHs. In Sect. 6, we apply our model to the case of a molecular cloud in the Perseus arm. Finally, conclusions and observational perspectives are given in Sect. 7.
2 The properties of interstellar PAHs
In the ISM, the stablest PAHs are found to be compact species (Le Page
et al. 2003; Léger et al. 1989). Small
PAHs are planar, but above some poorly known size threshold (40 to
100 C atoms), interstellar formation routes may favour
three-dimensional species (bowl- or cage-shaped) containing pentagonal
cycles (see Moutou et al. 2000, and references therein). As we
see later, small PAHs (containing less than 100 C atoms)
dominate the rotational emission, so we assume that interstellar PAHs
are planar with a hexagonal (
![]() )
symmetry. The PAH radius is thus
)
symmetry. The PAH radius is thus
![]() ,
where
,
where ![]() is the number of carbon atoms in the grain (Omont
1986). The formula for such molecules is C
is the number of carbon atoms in the grain (Omont
1986). The formula for such molecules is C
![]() ,
and their hydrogen-to-carbon ratio is
,
and their hydrogen-to-carbon ratio is
![]() ,
where
,
where ![]() is the hydrogenation fraction of PAHs. In this work, we assume that
PAHs are fully hydrogenated (
is the hydrogenation fraction of PAHs. In this work, we assume that
PAHs are fully hydrogenated (
![]() ).
).
2.1 Absorption cross-section
The excitation, cooling, and emission of PAHs depend on their
absorption cross-section (Sect. 3), which we
describe now. We took the visible-UV cross-section from Verstraete & Léger (1992)
and applied their size-dependent cut-off for electronic transitions in
the visible-NIR range. The resulting cross-section compares well to the
available data (Joblin
et al. 1992). In Appendix A, we
discuss the mid-IR bands considered in this work.
Each vibrational mode is assumed to be harmonic, and the corresponding
band profile has a Drude shape (Draine
& Li 2001). The width ![]() is inferred from astronomical spectra, and the peak value
is inferred from astronomical spectra, and the peak value ![]() is chosen so that the integrated cross-section
is chosen so that the integrated cross-section
![]() is equal to the value measured in the laboratory. By adopting the
observed bandwidth, we empirically account for the complex molecular
relaxation and band broadening (Mulas et al. 2006; Pech
et al. 2002) in interstellar PAHs. We adopt here the
band strengths given in Pech
et al. (2002) that were inferred from laboratory
data. Different definitions of the PAH IR cross-sections have been
proposed by Rapacioli
et al. (2005), Flagey
et al. (2006), and Draine & Li (2007).
is equal to the value measured in the laboratory. By adopting the
observed bandwidth, we empirically account for the complex molecular
relaxation and band broadening (Mulas et al. 2006; Pech
et al. 2002) in interstellar PAHs. We adopt here the
band strengths given in Pech
et al. (2002) that were inferred from laboratory
data. Different definitions of the PAH IR cross-sections have been
proposed by Rapacioli
et al. (2005), Flagey
et al. (2006), and Draine & Li (2007).
We used the database of Malloci
et al. (2007) to define an average broadband
cross-section of the far-IR vibrations of PAHs. At frequencies below
500 cm-1, each species features many
modes. However, for compact species, modes accumulate in three definite
frequency ranges: modes with a frequency of less than 100 cm-1,
modes between 100 and 200 cm-1,
and modes between 200 and 500 cm-1.
We therefore model the far-IR cross-section of compact PAHs with
3 modes (Table 1).
The frequency of each mode is the average of all modes falling within
the given energy range, weighted by their corresponding integrated
cross-sections. We find that the frequency of the lowest energy mode
depends on the molecular size as
![]() (see Fig. 1).
Conversely, for the two other modes, the average energy is instead
independent of the size. The integrated cross-section for these
3 modes was estimated as follows. From the Mallocci database,
we first derived the fraction of
(see Fig. 1).
Conversely, for the two other modes, the average energy is instead
independent of the size. The integrated cross-section for these
3 modes was estimated as follows. From the Mallocci database,
we first derived the fraction of
![]() for each of the 3 modes. Then, we assumed that the total
for each of the 3 modes. Then, we assumed that the total
![]() below 500 cm-1 is given by the integral
of the absorption cross-section of Schutte
et al. (1993):
below 500 cm-1 is given by the integral
of the absorption cross-section of Schutte
et al. (1993):
![]() cm2
per C-atom. The integrated cross-sections of each of the
3 modes was finally obtained by multiplying the former value
by the
cm2
per C-atom. The integrated cross-sections of each of the
3 modes was finally obtained by multiplying the former value
by the ![]() fractions inferred from the database.
fractions inferred from the database.
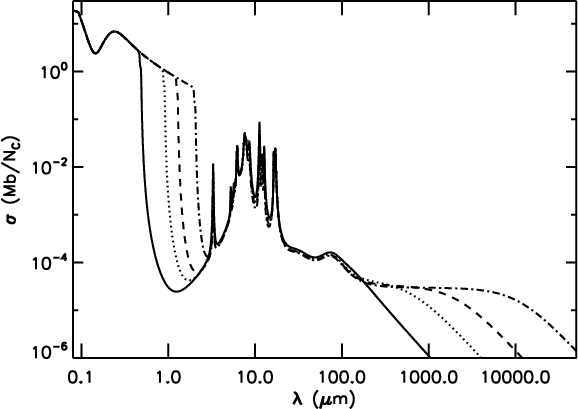
The parameters of the far-IR bands adopted here are given in Table 1, and the full cross-section is displayed in Fig. 2. We show in Sect. 3 that this set of IR bands provides a good match to observed interstellar spectra. Finally, we note that the in-plane or out-of-plane character of each vibrational band is important because of the different associated weights in the rotational excitation (Sect. 4.1). This character is indicated in Tables A.1 for the mid-IR bands (Socrates 2001). In the case of the far-IR bands, this character is not as well known and we assume that 1/3 (2/3) of the oscillator strength come from out-of-plane (in-plane) transitions respectively (Table 1).
Table 1: Far-IR rovibrational bands of PAH cations adopted in this work, with the percentage of the total oscillator strength in each band.

|
Figure 1:
Frequencies of the first (lowest energy) vibrational mode versus |
| Open with DEXTER | |
|
Figure 2:
Absorption cross-section of PAH cations per carbon atom
(1 Mb = 10-18 cm2).
The solid, dotted, dashed, and dot-dashed lines show the cases for |
| Open with DEXTER | |
2.2 The rigid rotor model
While describing the rotation of a molecule, the relevant operator is
the total angular momentum ![]() ,
which includes the electrons and nuclei contributions without the spin.
We note that
,
which includes the electrons and nuclei contributions without the spin.
We note that ![]() ,
,
![]() ,
and
,
and ![]() are the principal axis of inertia. We assumed that PAHs are oblate
symmetric top molecules with the axis
are the principal axis of inertia. We assumed that PAHs are oblate
symmetric top molecules with the axis ![]() perpendicular to the plane of the molecule and parallel to Oz.
We called
perpendicular to the plane of the molecule and parallel to Oz.
We called ![]() the inertia moment with respect to
the inertia moment with respect to ![]() and
and ![]() ,
,
![]() the inertia moments with respect to
the inertia moments with respect to ![]() and
and ![]() ,
which were taken to be parallel to Ox and Oy.
The rotational Hamiltonian is then
,
which were taken to be parallel to Ox and Oy.
The rotational Hamiltonian is then
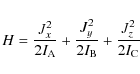
|
(1) |
where Jx, Jy, and Jz are the projections of

|
(2) |
and the rotational energy is
where
Since the available microwave data are broadband observations
(
![]() of
the order of a few), we make several simplifying assumptions in the
description of the rotational motion of PAHs. We thus assume that the
rotational constant B is the same in all
vibrational levels, and within the framework of a rigid rotor model, we
neglect the centrifugal distortion terms in the energy equation that
are usually small for large molecules (Lovas et al. 2005; Herzberg 1968ab).
of
the order of a few), we make several simplifying assumptions in the
description of the rotational motion of PAHs. We thus assume that the
rotational constant B is the same in all
vibrational levels, and within the framework of a rigid rotor model, we
neglect the centrifugal distortion terms in the energy equation that
are usually small for large molecules (Lovas et al. 2005; Herzberg 1968ab).
|
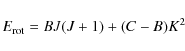
Figure 3:
Symmetric top molecule: |
| Open with DEXTER | |
2.3 Electric dipole moment
The rotational emission of PAHs depends on their permanent electric
dipole moment, ![]() .
Symmetric (
.
Symmetric (
![]() ), neutral, and fully
hydrogenated PAHs have
), neutral, and fully
hydrogenated PAHs have ![]() .
Spectroscopic analysis of their IR emission bands suggests
that interstellar PAHs can hqve a cationic form that is partially
hydrogenated (Le Page et al.
2003), and maybe also substituted (Peeters et al. 2002,2004a).
For instance, a PAH having lost one H atom has
.
Spectroscopic analysis of their IR emission bands suggests
that interstellar PAHs can hqve a cationic form that is partially
hydrogenated (Le Page et al.
2003), and maybe also substituted (Peeters et al. 2002,2004a).
For instance, a PAH having lost one H atom has
![]() to 1 D, and a PAH cation where a C atom has been substituted
by N would also have
to 1 D, and a PAH cation where a C atom has been substituted
by N would also have ![]() to 1.5 D depending on its size (Pino, private communication).
Moreover, it has been proposed that non-planar PAHs containing
pentagonal rings may exist in the ISM (see Moutou et al. 2000,
and references therein): such species are known to have large dipole
moments as recently measured on coranulene, C
to 1.5 D depending on its size (Pino, private communication).
Moreover, it has been proposed that non-planar PAHs containing
pentagonal rings may exist in the ISM (see Moutou et al. 2000,
and references therein): such species are known to have large dipole
moments as recently measured on coranulene, C
![]() ,
,
![]() D (Lovas et al. 2005). In this
work, we express the electric dipole moment of interstellar PAHs as
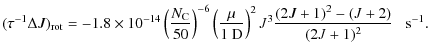
in DL98:
D (Lovas et al. 2005). In this
work, we express the electric dipole moment of interstellar PAHs as
in DL98:
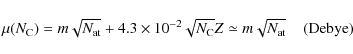
where
3 Internal energy distribution and rovibrational IR emission of isolated interstellar PAHs
![\begin{figure}
\par\resizebox{9cm}{!}{\includegraphics[angle=90]{12708fg4.eps}}
\end{figure}](/articles/aa/full_html/2010/01/aa12708-09/img77.png)
|
Figure 4:
Internal energy distribution of PAHs with
|
| Open with DEXTER | |
After the absorption of a visible-UV photon, a PAH cools off by emitting IR rovibrational photons. These photons reduce its angular momentum and also may increase it by recoil (a purely quantum effect, see Sect. 4.1). Previous studies have mostly used a thermal description of molecular cooling. In fact, since PAHs spend a large fraction of their time at low internal energies (see Fig. 4), their emission at long wavelengths cannot be considered as a negligible fluctuation compared to their total internal energy. While estimating the emission of PAHs at low temperatures, the validity of a thermal approach is questionable. Because of the rapid energy redistribution between interactions (photon exchange or collision with gas phase species), PAHs rapidly reach thermodynamical equilibrium while isolated (Léger et al. 1989). To describe this situation, we used the exact-statistical method of Draine & Li (2001) to derive the stationary internal energy distribution of PAHs.
The energy distribution, P(E),
depends on (a) the energy density of the exciting radiation field
![]() (where
(where ![]() is the brightness); (b) the absorption cross-section,
is the brightness); (b) the absorption cross-section, ![]() ,
of interstellar PAHs; and (c) their rovibrational density of states,
,
of interstellar PAHs; and (c) their rovibrational density of states, ![]() .
For the stellar contribution, we used the local interstellar radiation
field (ISRF, Mathis et al. 1983) or a blackbody. We sometimes
scale this stellar radiation field with a factor, G0,
equal to 1 in the case of the Mathis field
.
For the stellar contribution, we used the local interstellar radiation
field (ISRF, Mathis et al. 1983) or a blackbody. We sometimes
scale this stellar radiation field with a factor, G0,
equal to 1 in the case of the Mathis field![]() . Throughout this work, the
contribution of the CMB is included in the radiation field. The
vibrational absorption cross-section used has been described
previously, and for simplicity, we did not include rotational bands.
Unless otherwise stated, we took the cross-section of PAH cations. The
density of states was obtained by first deriving the vibrational mode
spectrum from a Debye model and then applying the algorithm of Beyer & Swinehart (1973) for
each molecular size (see Appendix B).
. Throughout this work, the
contribution of the CMB is included in the radiation field. The
vibrational absorption cross-section used has been described
previously, and for simplicity, we did not include rotational bands.
Unless otherwise stated, we took the cross-section of PAH cations. The
density of states was obtained by first deriving the vibrational mode
spectrum from a Debye model and then applying the algorithm of Beyer & Swinehart (1973) for
each molecular size (see Appendix B).
![\begin{figure}
{
\begin{tabular}{cc}
\includegraphics[width=9cm]{12708fg5.eps} & \includegraphics[width=9cm]{12708fg6.eps}\\
\end{tabular}}\end{figure}](/articles/aa/full_html/2010/01/aa12708-09/img82.png)
|
Figure 5:
Left: dust IR emission of the DIM (solid
black lines and symbols) with
|
| Open with DEXTER | |
After each absorption of a stellar photon, we assume that the
excitation energy of the PAH is rapidly redistributed among all the
vibrational modes (Mulas
et al. 2006). This radiationless and isoenergetic
process is called internal vibrational redistribution (IVR).
The energy distribution is then computed according to the
exact-statistical formalism described in Draine
& Li (2001). The energy scale (referenced to the zero
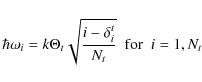
point energy) is divided into bins of energy Ei
and width ![]() with i
= 0, 1, ..., M (M = 500) with
with i
= 0, 1, ..., M (M = 500) with
![]() where
where ![]() cm-1
is the Lyman limit. When its energy is below that of the first excited
vibrational state, the molecule is in a rotational state. Letting Pi
be the probability of having a PAH in the energy bin i
we have
cm-1
is the Lyman limit. When its energy is below that of the first excited
vibrational state, the molecule is in a rotational state. Letting Pi
be the probability of having a PAH in the energy bin i
we have
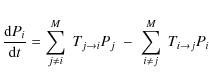
|
(5) |
where
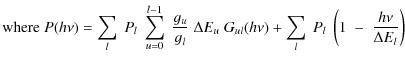
Knowing the internal energy distribution of PAHs, we can
deduce their IR emission from the upper state u
by summing the contributions of all lower vibrational modes l
(Draine & Li 2001):
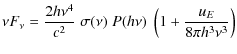
|
(6) |
|
(7) |
is the number of rovibrational photons emitted at energy
|
Figure 6:
PAH rovibrational emissivity for a MRN size distribution with
|
| Open with DEXTER | |
3.1 Decoupling of vibrational modes
Our derivation of P(E) assumes
an efficient energy redistribution between vibrational modes (IVR)
during the PAH relaxation. The IVR thus involves a coupling between
vibrational modes via intramolecular transitions. However, it is known
that IVR is no longer efficient when the excitation energy of the
molecule is below some threshold
![]() (Mulas et al. 2006),
and we will then speak of IVR breakdown. When
(Mulas et al. 2006),
and we will then speak of IVR breakdown. When
![]() ,
the excitation of energetically accessible vibrational modes is frozen
according to microcanonical statistics at energy
,
the excitation of energetically accessible vibrational modes is frozen
according to microcanonical statistics at energy
![]() .
The molecule then continues to cool via emission of the excited
vibrational modes.
To study the influence of decoupling on the long-wavelength emission,
we consider two extreme cases for the relaxation at
.
The molecule then continues to cool via emission of the excited
vibrational modes.
To study the influence of decoupling on the long-wavelength emission,
we consider two extreme cases for the relaxation at
![]() :
:
- -
- case 1: no IVR, cooling by IR forbidden modes. We assume these modes to be defined like those of Table 1 but with an oscillator strength 104 lower and;
- -
- case 2: no IVR, cooling only by the first vibrational mode
at
 (cm-1) as defined in Table 1,
4 Angular momentum distribution
Building the angular momentum distribution of interstellar PAHs is
driven by photon exchanges and gas-grain interactions (DL98). In the
DIM, pervaded by the ISRF, and for a PAH bearing 50 carbon
atoms, the mean time between absorptions of visible-UV photons (![]() 0.2 yr)
is comparable to the mean time between emissions of rotational photons,
as well as to the mean time between PAH-hydrogen collisions (for a gas
density of 100 cm-3 and a temperature
of 100 K). Photons absorbed in the visible-UV have a weak
effect on the total angular momentum; indeed, each photon exchanged
carries a unit angular momentum, and the numerous
0.2 yr)
is comparable to the mean time between emissions of rotational photons,
as well as to the mean time between PAH-hydrogen collisions (for a gas
density of 100 cm-3 and a temperature
of 100 K). Photons absorbed in the visible-UV have a weak
effect on the total angular momentum; indeed, each photon exchanged
carries a unit angular momentum, and the numerous![]() IR photons emitted overwhelm the influence of the photon absorbed. To
estimate the angular momentum distribution, we take the following
processes into account:
IR photons emitted overwhelm the influence of the photon absorbed. To
estimate the angular momentum distribution, we take the following
processes into account:
- -
- IR rovibrational photon emission;
- -
- purely rotational photon emission;
- -
- H2 formation;
- -
- collisions with gas (neutral atoms and ions);
- -
- plasma drag;
- -
- photoelectric effect.
with
4.1 Rovibrational transitions
The rovibrational IR emission can be both an exciting and a damping
process for the rotation of a PAH. Assuming that the interstellar PAHs
are symmetric top molecules, the selection rules for the emission of an
IR rovibrational photon are:
![]() ,
and
,
and ![]() .
Transitions corresponding to
.
Transitions corresponding to
![]() ,
and 0 are called the P, Q,
and R-bands, respectively. As seen in
Sect. 2.2,
two types of transitions are possible: parallel ones (out-of-plane
vibrational motion) with
,
and 0 are called the P, Q,
and R-bands, respectively. As seen in
Sect. 2.2,
two types of transitions are possible: parallel ones (out-of-plane
vibrational motion) with ![]() and perpendicular ones (in-plane vibrational motion) with
and perpendicular ones (in-plane vibrational motion) with
![]() .
The type of each transition is given in Tables A.1 and 1. For a
rovibrational transition,
.
The type of each transition is given in Tables A.1 and 1. For a
rovibrational transition,
![]() ,
the rate is proportional to the spontaneous emission coefficient and to
the probability for the grain to lose the corresponding transition
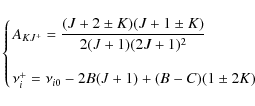
energy. The spontaneous emission rate is proportional to the AKJ
factors, which represent the angular part of the transition
probability. Formulae for these factors are given in Appendix C. Expressed in terms
of cross-section, the transition rate is (with
,
the rate is proportional to the spontaneous emission coefficient and to
the probability for the grain to lose the corresponding transition
energy. The spontaneous emission rate is proportional to the AKJ
factors, which represent the angular part of the transition
probability. Formulae for these factors are given in Appendix C. Expressed in terms
of cross-section, the transition rate is (with ![]() and
and ![]() in cm-1):
in cm-1):
where the
4.2 Rotational emission
We consider here the spontaneous emission of purely rotational photons.
The selection rules for such transitions are
![]() and
and ![]() (Townes & Schawlow 1975).
No change in K occurs because, for
rotational transitions, the dipole moment of a symmetric top molecule
necessarily lies along its symmetry axis. The transition rate is then
simply related to the spontaneous emission coefficient
AJ,
J-1:
(Townes & Schawlow 1975).
No change in K occurs because, for
rotational transitions, the dipole moment of a symmetric top molecule
necessarily lies along its symmetry axis. The transition rate is then
simply related to the spontaneous emission coefficient
AJ,
J-1:
where
4.3 Equilibrium angular momentum J0
Table 2: Physical parameters for the typical interstellar phases considered.
We estimate damping and excitation rotational rates for the
interstellar phases described in Table 2. When
solving Eq. (8),
we obtain the equilibrium angular momentum J0.
Figure 7
shows J0 for the DIM
and the Orion Bar. In all cases, J0
increases with ![]() because there are more steps in the random walk; indeed, the
cross-section and absorption rate scale with
because there are more steps in the random walk; indeed, the
cross-section and absorption rate scale with ![]() (see Fig. 2),
so more IR photons are emitted for larger
(see Fig. 2),
so more IR photons are emitted for larger ![]() .
Similarly, J0 reaches higher
values when the radiation field intensity or the gas density increases
(see Fig. 8).
.
Similarly, J0 reaches higher
values when the radiation field intensity or the gas density increases
(see Fig. 8).
In the DIM, the excitation comes from gas-grain collisions,
whereas the damping is dominated by the emission of rotational photons
for ![]() and by IR photon emission for larger PAHs (
and by IR photon emission for larger PAHs (
![]() ,
whereas
,
whereas
![]() ).
We note similar J0-values
for the CNM, WNM and WIM (Fig. 7a) in spite of the
large differences in gas density and temperature
(see Table 2).
In the Orion Bar, because of the intense radiation field, the
excitation is driven by the photoelectric effect, whereas the damping
is dominated by the emission of IR photons. For the case of MCs (not
shown), J0 also rises and
reaches high values (J0=1300
for
).
We note similar J0-values
for the CNM, WNM and WIM (Fig. 7a) in spite of the
large differences in gas density and temperature
(see Table 2).
In the Orion Bar, because of the intense radiation field, the
excitation is driven by the photoelectric effect, whereas the damping
is dominated by the emission of IR photons. For the case of MCs (not
shown), J0 also rises and
reaches high values (J0=1300
for ![]() ). Indeed, the damping by IR
photon emission is no longer efficient (
). Indeed, the damping by IR
photon emission is no longer efficient (
![]() ), while the gas-grain rates
are strong because of higher density. We show in Fig. 7b the influence of
different choices of the vibrational mode spectrum (or cross-section)
on J0: changes are
below 20% and affect only the large sizes (
), while the gas-grain rates
are strong because of higher density. We show in Fig. 7b the influence of
different choices of the vibrational mode spectrum (or cross-section)
on J0: changes are
below 20% and affect only the large sizes (
![]() ), which make a minor
contribution
to the rotational emissivity (see Sect. 5). We found
comparable variations of J0
for the vibrational relaxation (IVR) cases 1 and 2,
discussed in Sect. 3.1.
), which make a minor
contribution
to the rotational emissivity (see Sect. 5). We found
comparable variations of J0
for the vibrational relaxation (IVR) cases 1 and 2,
discussed in Sect. 3.1.
![\begin{figure}
\par\resizebox{8.8cm}{!}{\includegraphics[angle=90]{12708fg8.eps}}
\end{figure}](/articles/aa/full_html/2010/01/aa12708-09/img142.png)
|
Figure 7:
J0 versus |
| Open with DEXTER | |
![\begin{figure}
{
\begin{tabular}{cc}
\includegraphics[width=8.5cm]{12708fg9.eps} & \includegraphics[width=8.5cm]{12708f10.eps}\end{tabular}}\end{figure}](/articles/aa/full_html/2010/01/aa12708-09/img144.png)
|
Figure 8:
a) Effect of varying G0
on J0 for PAH cations with
|
| Open with DEXTER | |
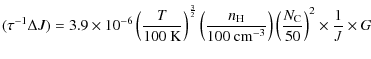
The processes contributing to the rotation of PAHs depend on the
intensity of the radiation field (G0)
and on the gas density (![]() ).
We now examine the influence of these parameters on J0.
Other important quantities (gas temperature; electron, proton,
and C+ abundances) are obtained at thermal
equilibrium with CLOUDY (Ferland
et al. 1998)
).
We now examine the influence of these parameters on J0.
Other important quantities (gas temperature; electron, proton,
and C+ abundances) are obtained at thermal
equilibrium with CLOUDY (Ferland
et al. 1998)![]() .
To study the influence of G0,
we took the radiation field to be a blackbody of effective temperature
22 000 K and scaled it in order to vary G0
between 10-2 and 105. The
shape of the radiation field is then always the same
.
To study the influence of G0,
we took the radiation field to be a blackbody of effective temperature
22 000 K and scaled it in order to vary G0
between 10-2 and 105. The
shape of the radiation field is then always the same![]() . Figure 8a shows J0
as a function of G0 for
different PAH sizes. As discussed before, J0
increases with G0 because
the excitation rate from IR emission (which scales with G0)
is dominant. This rise becomes steeper for larger PAHs because the
frequency of the first vibrational mode decreases (as
. Figure 8a shows J0
as a function of G0 for
different PAH sizes. As discussed before, J0
increases with G0 because
the excitation rate from IR emission (which scales with G0)
is dominant. This rise becomes steeper for larger PAHs because the
frequency of the first vibrational mode decreases (as
![]() )
and requires lower values of G0
to be excited (the maximum of P(E)
moves to higher energies as G0
increases, see Fig. 4c).
However, we note that J0 is
affected little by variations of G0
over the range 0.01-100.
The result of varying
)
and requires lower values of G0
to be excited (the maximum of P(E)
moves to higher energies as G0
increases, see Fig. 4c).
However, we note that J0 is
affected little by variations of G0
over the range 0.01-100.
The result of varying ![]() is shown in Fig. 8b.
In all cases, the incident radiation field is a blackbody with
is shown in Fig. 8b.
In all cases, the incident radiation field is a blackbody with
![]() 000 K
and G0 =1.
The gas-grain processes become dominant for
000 K
and G0 =1.
The gas-grain processes become dominant for
![]() cm-3
and
cm-3
and ![]() .
At lower gas densities, radiative processes prevail (excitation by IR
emission and damping by rotational emission), and J0
does not change. We therefore expect the rotational excitation of small
PAHs to hardly be variable in the DIM as found by Davies et al. (2006).
.
At lower gas densities, radiative processes prevail (excitation by IR
emission and damping by rotational emission), and J0
does not change. We therefore expect the rotational excitation of small
PAHs to hardly be variable in the DIM as found by Davies et al. (2006).
4.4 Modelling the rotational excitation by IR emission
Following the absorption of a stellar visible-UV photon, the
rovibrational cascade of PAHs is a complex process that involves many
states. Molecular, state-to-state models require a detailed database,
use Monte-Carlo simulations (see Mulas et al. 2006, for
references), and so far do not include the gas-grain interactions that
are important. Given our incomplete knowledge of interstellar PAHs and
the fact that their rotational emission may so far be seen in broadband
data, former models of spinning dust (DL98 and Ali-Haïmoud
et al. 2009) made simplifying assumptions to describe
radiative processes and performed a classical treatment of the
gas-grain interactions![]() .
We assess here the impact of these assumptions on the rotational
emissivity of PAHs.
.
We assess here the impact of these assumptions on the rotational
emissivity of PAHs.
First, the internal energy distribution of PAHs was derived in
the thermal approximation. As discussed in Sect. 4, this is a
questionable assumption for describing the long-wavelength emission of
PAHs and the change in angular momentum it induces. Moreover, the
excitation rate by IR emission (the recoil due to emission of
individual photons), which is a purely quantum effect, has been
described as a random walk of the angular momentum starting with a
non-rotating grain![]() .
Finally, an efficient vibrational redistribution (IVR, see
Sect. 3.1)
was assumed throughout the energy cascade following a photon
absorption. In this work, we improve on the first aspect by deriving
the internal energy distribution of isolated PAHs using a
microcanonical formalism and including the rotational density of
states. Next, we follow a quantum approach to treat the rovibrational
emission where the recoil due to photon emission and selection rules
are naturally included. In Fig. 9a, we
compare the absolute value of our rate of angular momentum change by
rovibrational IR emission
.
Finally, an efficient vibrational redistribution (IVR, see
Sect. 3.1)
was assumed throughout the energy cascade following a photon
absorption. In this work, we improve on the first aspect by deriving
the internal energy distribution of isolated PAHs using a
microcanonical formalism and including the rotational density of
states. Next, we follow a quantum approach to treat the rovibrational
emission where the recoil due to photon emission and selection rules
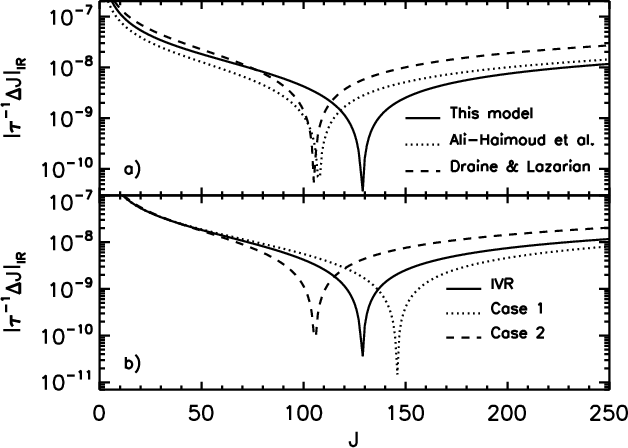
are naturally included. In Fig. 9a, we
compare the absolute value of our rate of angular momentum change by
rovibrational IR emission
![]() (see Sect. 4.1)
to former works. For a PAH containing 24 carbon atoms, all
rates decrease with the angular momentum and cross zero for J
between 100 and 150 (singular points in our
logarithmic representation). The main difference with previous models
is that the excitation-to-damping transition (the zero value) occurs at
higher J-values in our case. This discrepancy
diminishes with increasing sizes, and identical IR rates are found for
species with more than 100 C atoms.
(see Sect. 4.1)
to former works. For a PAH containing 24 carbon atoms, all
rates decrease with the angular momentum and cross zero for J
between 100 and 150 (singular points in our
logarithmic representation). The main difference with previous models
is that the excitation-to-damping transition (the zero value) occurs at
higher J-values in our case. This discrepancy
diminishes with increasing sizes, and identical IR rates are found for
species with more than 100 C atoms.
|
Figure 9:
Rate of J-change due to rovibrational emission for
a PAH with |
| Open with DEXTER | |
![\begin{figure}
{\begin{tabular}{cc}
\includegraphics[width=8.5cm]{12708f12.eps} & \includegraphics[width=8.5cm]{12708f13.eps}\end{tabular}}\end{figure}](/articles/aa/full_html/2010/01/aa12708-09/img152.png)
|
Figure 10:
Rotational emissivity of PAH cations. We take 430 ppm of carbon in
PAHs, |
| Open with DEXTER | |
We show in Fig. 9b
the effect of relaxation schemes other than IVR. Between extreme
cases 1 and 2 (see Sect. 3.1), the
damping IR rate is multiplied by a factor 2, which
leads to a balance at a lower J-value. Variations
in ![]() are in fact quite similar to those induced by the other approximations
discussed above. All these variations affect the rotational emissivity
of PAHs, around 30 GHz, by at most 15% (in the CNM
and including the gas-grain interactions)
are in fact quite similar to those induced by the other approximations
discussed above. All these variations affect the rotational emissivity
of PAHs, around 30 GHz, by at most 15% (in the CNM
and including the gas-grain interactions)![]() .
We conclude that, in spite of the assumptions made, former spinning
dust models (which are fast computationally) provide a sufficiently
accurate rotational emissivity.
.
We conclude that, in spite of the assumptions made, former spinning
dust models (which are fast computationally) provide a sufficiently
accurate rotational emissivity.
5 Spinning dust emission
The power emitted by a PAH containing ![]() carbon atoms in a rotational transition from state J
to J-1 is equal to
carbon atoms in a rotational transition from state J
to J-1 is equal to
| (13) |
when taking the spontaneous emission rate AJ,J-1 from Eq. (10) and with the transition energy
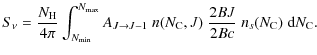
Since we are interested in a broadband spectrum, we take the rotational bandwidth to be 2Bc. As discussed before, we assume that
We emphasize here that the level, peak position and width of
the rotational emission spectrum depend on (a) the fraction of small
PAHs (
![]() ), (b) m
the scaling factor for the dipole moment, and (c) the physical
parameters of the gas along the line of sight (temperature, density,
and ionization). Microwave observations alone cannot constrain all
these unknowns. A quantitative description of the spinning dust
emission will require near-IR data (to constrain the fraction of small
PAHs) and radio maps (21 cm and continuum) to derive the
physical state of the gas.
), (b) m
the scaling factor for the dipole moment, and (c) the physical
parameters of the gas along the line of sight (temperature, density,
and ionization). Microwave observations alone cannot constrain all
these unknowns. A quantitative description of the spinning dust
emission will require near-IR data (to constrain the fraction of small
PAHs) and radio maps (21 cm and continuum) to derive the
physical state of the gas.
6 The case of the molecular cloud G159.6-18.5
We present here a comparison of our model results with observations of the anomalous microwave foreground and IR emission. We show how these data can be explained with a coherent description of the IR and rotational emission of PAHs, and also discuss how the size distribution of PAHs can be constrained.
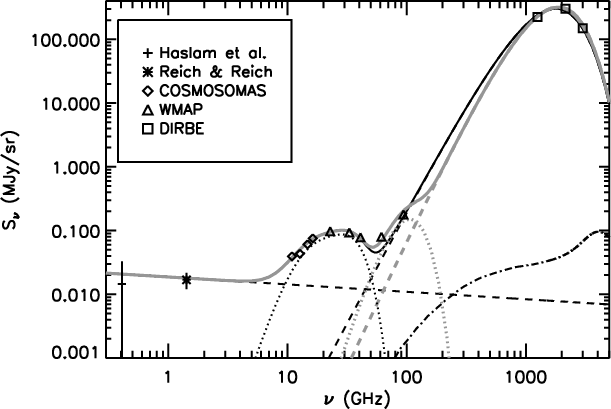
The COSMOSOMAS experiment has delivered maps of large sky fractions with an angular resolution of 1 degree in four frequency bands: 10.9, 12.7, 14.7, and 16.3 GHz. In this survey, Watson et al. (2005) studied the region G159.6-18.5 located in the Perseus molecular complex. Figure 11 shows the spectrum of this region from 3 to to 4000 GHz (COSMOSOMAS, WMAP, and DIRBE data). From mid to far-IR, the Perseus molecular complex is dominated by a molecular ring (G159.6-18.5) surrounding an HII region. Unfortunately, the COSMOSOMAS resolution does not allow these two phases to be separated. The molecular ring is centred on the star HD 278942 (Andersson et al. 2000; Ridge et al. 2006). Its stellar wind is responsible for the HII region dug into the parent molecular cloud. To describe the emission spectrum of G159-18.5, we assume it includes an MC component for the ring and a WIM component for the HII region. We discuss below the physical parameters of both phases.
According to Ridge
et al. (2006), HD278942 is a B0 V star: its
radiation field is modelled by a blackbody with
![]() K,
scaled to get
K,
scaled to get ![]() at the radius of the ring (G0
is obtained from IRAS data). The radius of the HII region is
approximately 2.75 pc (Andersson
et al. 2000) and implies a WIM density
at the radius of the ring (G0
is obtained from IRAS data). The radius of the HII region is
approximately 2.75 pc (Andersson
et al. 2000) and implies a WIM density
![]() cm-3
(Ridge et al. 2006).
We obtained the WIM temperature from CLOUDY: 7500 K. Andersson et al. (2000)
estimated the density and temperature of the gas in the molecular ring
to be
cm-3
(Ridge et al. 2006).
We obtained the WIM temperature from CLOUDY: 7500 K. Andersson et al. (2000)
estimated the density and temperature of the gas in the molecular ring
to be ![]() cm-3
and
cm-3
and ![]() K. For the WIM and
MC phases, we derived the abundances of electrons, protons and C+,
and the gas temperature with CLOUDY. We took the total column density
(MC+WIM) to be
K. For the WIM and
MC phases, we derived the abundances of electrons, protons and C+,
and the gas temperature with CLOUDY. We took the total column density
(MC+WIM) to be
![]() cm-2
(Watson et al. 2005).
From 12
cm-2
(Watson et al. 2005).
From 12 ![]() m
IRAS data and our PAH emission model, we estimated the total PAH
abundance to represent
m
IRAS data and our PAH emission model, we estimated the total PAH
abundance to represent ![]() ppm
of carbon.
ppm
of carbon.
Following Watson
et al. (2005), we took the thermal dust emission to
be a grey body at 19 K with an emissivity index
![]() .
Our best-fit parameters for the spinning PAH
contribution (assuming a size distribution
.
Our best-fit parameters for the spinning PAH
contribution (assuming a size distribution
![]() )
are then (model A)
)
are then (model A)
![]() and
and ![]() cm-2 for the MC,
cm-2 for the MC,
![]() and
and ![]() cm-2
for the WIM. In both media, we took m=0.6 D
(Eq. (4)).
Larger PAHs are required in the MC, possibly as a consequence
of grain-grain coagulation. However, the results of Dupac et al. (2003)
indicate that emission of dust around 20 K requires a higher
emissivity index, close to 2. When adopting
cm-2
for the WIM. In both media, we took m=0.6 D
(Eq. (4)).
Larger PAHs are required in the MC, possibly as a consequence
of grain-grain coagulation. However, the results of Dupac et al. (2003)
indicate that emission of dust around 20 K requires a higher
emissivity index, close to 2. When adopting ![]() and a dust temperature of 18 K (model B),
we find an equally good fit of this region in the far-IR (Fig. 11). In this
case, the flux around 100 GHz is not explained. We speculate here that
it may come from an additional and less abundant population of small
PAHs in the MC component with:
and a dust temperature of 18 K (model B),
we find an equally good fit of this region in the far-IR (Fig. 11). In this
case, the flux around 100 GHz is not explained. We speculate here that
it may come from an additional and less abundant population of small
PAHs in the MC component with:
![]() ,
m=0.1 D and
,
m=0.1 D and
![]() cm-2
(for the larger PAHs in the MC phase,
cm-2
(for the larger PAHs in the MC phase,
![]() cm-2).
The corresponding spinning emission is shown in Fig. 11 (model
B). The PAH size distribution would thus be bimodal, as
already suggested by Le Page
et al. (2003). As can be seen in Fig. 11, both models
provide a good fit to the data. Discrimiting tests of these scenarios
will be soon possible with the Planck polarized data. Small grains or
PAHs are expected to be poorly aligned (Lazarian & Draine 2000;
Martin 2007), whereas big grains are fairly well-aligned with a
polarization fraction of 5 to 10%.
cm-2).
The corresponding spinning emission is shown in Fig. 11 (model
B). The PAH size distribution would thus be bimodal, as
already suggested by Le Page
et al. (2003). As can be seen in Fig. 11, both models
provide a good fit to the data. Discrimiting tests of these scenarios
will be soon possible with the Planck polarized data. Small grains or
PAHs are expected to be poorly aligned (Lazarian & Draine 2000;
Martin 2007), whereas big grains are fairly well-aligned with a
polarization fraction of 5 to 10%.
|
Figure 11: Comparison to observations (symbols) of the Perseus molecular cloud G159.6-18.5. The dashed lines show the free-free (low frequency) and big grains (high-frequency) emissions. The PAH rovibrational emission is represented by the dot-dashed line. Dotted lines show the PAH rotational emission. The black model is model A, and the grey model is model B. See text for details. |
| Open with DEXTER | |
7 Summary
The Planck and Herschel data will soon reveal the emission of interstellar dust at long wavelengths. Thanks to their small size, interstellar PAHs spend most of their time at low internal energy and can spin at frequencies of a few tens of GHz. The emission of PAHs is therefore expected to make a significant contribution at long wavelength. Recent observations have shown the existence of a 10-100 GHz emission component (the anomalous foreground), related to the smallest dust grains. As suggested by DL98, the anomalous foreground may trace the emission of spinning PAHs.
In this work, we built the first model that coherently
describes the emission of interstellar PAHs from the near-IR to the
centimetric range and focused on the long wavelength part of this
emission. To do so, we derived the internal energy of isolated PAHs
down to low energies. We included low-frequency vibrational bands (
![]() m), through which PAHs cool at
intermediate to low energies. They are important for their rotational
emission. In the cooling cascade that follows the absorption of a
stellar photon by a PAH, we treated rovibrational transitions in a
quantum approach and examined the possibility that the hypothesis of
vibrational redistribution (IVR) is not always fulfilled. Purely
quantum effects (recoil due to photon emission; transitions that do not
change the angular momentum or Q-bands) are thus
naturally included in our description of the rovibrational cascade. We
obtained the rotational emission of PAHs from a random-walk formalism,
including all processes participating in excitation and damping,
namely, rovibrational and pure rotational transitions and gas-grain
interactions.
m), through which PAHs cool at
intermediate to low energies. They are important for their rotational
emission. In the cooling cascade that follows the absorption of a
stellar photon by a PAH, we treated rovibrational transitions in a
quantum approach and examined the possibility that the hypothesis of
vibrational redistribution (IVR) is not always fulfilled. Purely
quantum effects (recoil due to photon emission; transitions that do not
change the angular momentum or Q-bands) are thus
naturally included in our description of the rovibrational cascade. We
obtained the rotational emission of PAHs from a random-walk formalism,
including all processes participating in excitation and damping,
namely, rovibrational and pure rotational transitions and gas-grain
interactions.
We have shown that the rovibrational emission of PAHs above ![]() 3 mm
does not depend on the intensity of the radiation field (represented
by G0),
unlike the mid-IR part of the spectrum that scales linearly with it. In
the diffuse interstellar medium, PAHs may contribute up to 10%
of the dust emission around 100 GHz. We also found the
rotational emissivity of PAHs is dominated by small species (bearing
less than 100 C atoms) and is hardly sensitive to G0
over the range 0.1-100. Using plausible PAH properties, our model can
explain both the IR and microwave emissions of a molecular cloud in the
Perseus arm where the anomalous foreground is conspicuous.
The level, peak position and width of the rotational emission spectrum
depend on the fraction of small PAHs, the dipole moment distribution (m-factor),
and the physical parameters of the gas phases present along the line of
sight. A quantitative description of the emission of spinning PAHs will
therefore involve observations at IR and radio wavelengths
(21 cm and continuum). Comparing the rotational excitation
rate obtained from our quantum treatment of the rovibrational cascade
to former works, we showed that the classical approximation used so far
has little effect on the rotational emissivity (the peak value varies
by at most 15%). Similarly, departures from the IVR hypothesis
lead to similar emissivity changes. We therefore conclude that a
classical description of rovibrational transitions and the IVR
hypothesis are good approximations for describing the rotational
emission of PAHs.
3 mm
does not depend on the intensity of the radiation field (represented
by G0),
unlike the mid-IR part of the spectrum that scales linearly with it. In
the diffuse interstellar medium, PAHs may contribute up to 10%
of the dust emission around 100 GHz. We also found the
rotational emissivity of PAHs is dominated by small species (bearing
less than 100 C atoms) and is hardly sensitive to G0
over the range 0.1-100. Using plausible PAH properties, our model can
explain both the IR and microwave emissions of a molecular cloud in the
Perseus arm where the anomalous foreground is conspicuous.
The level, peak position and width of the rotational emission spectrum
depend on the fraction of small PAHs, the dipole moment distribution (m-factor),
and the physical parameters of the gas phases present along the line of
sight. A quantitative description of the emission of spinning PAHs will
therefore involve observations at IR and radio wavelengths
(21 cm and continuum). Comparing the rotational excitation
rate obtained from our quantum treatment of the rovibrational cascade
to former works, we showed that the classical approximation used so far
has little effect on the rotational emissivity (the peak value varies
by at most 15%). Similarly, departures from the IVR hypothesis
lead to similar emissivity changes. We therefore conclude that a
classical description of rovibrational transitions and the IVR
hypothesis are good approximations for describing the rotational
emission of PAHs.
Our results on the influence of the radiation field intensity
led to a specific prediction that can be tested observationally. If the
anomalous microwave foreground comes from spinning PAHs, it is expected
to be correlated with the dust emission in the 12 ![]() m-IRAS band,
mostly carried by PAHs. In regions where G0
varies significantly, this correlation should improve when the
12
m-IRAS band,
mostly carried by PAHs. In regions where G0
varies significantly, this correlation should improve when the
12 ![]() m
flux is divided by G0,
indeed, the IR emission of PAHs scales with G0,
whereas their rotational emission is independent of G0.
This prediction was tested in a companion paper with WMAP and IRAS data
(Ysard et al. 2010).
m
flux is divided by G0,
indeed, the IR emission of PAHs scales with G0,
whereas their rotational emission is independent of G0.
This prediction was tested in a companion paper with WMAP and IRAS data
(Ysard et al. 2010).
We thank an anonymous referee whose comments helped us to significantly improve the content of this paper. We gratefully acknowledge stimulating discussions with B. Draine, C. Joblin, E. Dartois, T. Pino, and O. Pirali. We are grateful to M. Compiègne for his help in the dust SED modelling.
Appendix A: Mid-IR absorption cross-section
In Table A.1
we give the parameters defining the mid-IR vibrational bands considered
in this work. In all cases we assume their profile to have a Drude
shape. The bands at 3.3, 6.2, 7.7, 8.6, 11.3, and
12.7 ![]() m
are defined as follows. For the PAH cations, we start from the
integrated cross-sections,
m
are defined as follows. For the PAH cations, we start from the
integrated cross-sections,
![]() ,
of Pech et al. (2002)
that have been derived from laboratory data. The corresponding band
profiles, however, do not provide a detailed match of observations. We
therefore use band positions and widths as deduced from fits of ISO-SWS
spectra of a number of interstellar regions (Verstraete
et al. 2001). As indicated by these observations and
others (Peeters et al. 2002),
we include a broad band at 6.9
,
of Pech et al. (2002)
that have been derived from laboratory data. The corresponding band
profiles, however, do not provide a detailed match of observations. We
therefore use band positions and widths as deduced from fits of ISO-SWS
spectra of a number of interstellar regions (Verstraete
et al. 2001). As indicated by these observations and
others (Peeters et al. 2002),
we include a broad band at 6.9 ![]() m and split the 7.7
m and split the 7.7 ![]() m into three
sub-bands at 7.5, 7.6, and 7.8
m into three
sub-bands at 7.5, 7.6, and 7.8 ![]() m, where we use the observed
m, where we use the observed
![]() of each sub-band as weights in defining their integrated
cross-sections. In addition, we introduce a band at 8.3
of each sub-band as weights in defining their integrated
cross-sections. In addition, we introduce a band at 8.3 ![]() m to fill
the gap between the 7.8 and 8.6
m to fill
the gap between the 7.8 and 8.6 ![]() m bands, and
multiply the 8.6
m bands, and
multiply the 8.6 ![]() m
band by a factor 3 to match observations. For neutral PAHs, we
use the laboratory integrated cross-section of Joblin
et al. (1995), and assume the same band profiles as
for the cations. Furthermore, spectroscopic data (ISO-SWS, Spitzer
-IRS and UKIRT) reveal other bands at 5.25 and 5.75
m
band by a factor 3 to match observations. For neutral PAHs, we
use the laboratory integrated cross-section of Joblin
et al. (1995), and assume the same band profiles as
for the cations. Furthermore, spectroscopic data (ISO-SWS, Spitzer
-IRS and UKIRT) reveal other bands at 5.25 and 5.75 ![]() m, which
have been ascribed to combinations of PAH vibrational modes involving
the 11.3
m, which
have been ascribed to combinations of PAH vibrational modes involving
the 11.3 ![]() m
band and IR-forbidden modes at 9.8 and 11.7
m
band and IR-forbidden modes at 9.8 and 11.7 ![]() m,
respectively (Tripathi
et al. 2001; Roche et al. 1996). For
the 5.25
m,
respectively (Tripathi
et al. 2001; Roche et al. 1996). For
the 5.25 ![]() m,
we use the width and intensity ratio to the 11.3
m,
we use the width and intensity ratio to the 11.3 ![]() m band given
in Roche et al. (1996).
The 5.75
m band given
in Roche et al. (1996).
The 5.75 ![]() m
band has been derived from the observed spectrum of the Orion Bar (Verstraete et al. 2001).
We also add the 17.1
m
band has been derived from the observed spectrum of the Orion Bar (Verstraete et al. 2001).
We also add the 17.1 ![]() m
band recently seen in Spitzer data (Werner et al. 2004; Smith
et al. 2004) and recognized as arising from PAHs (Peeters
et al. 2004b; Smith et al. 2007).
m
band recently seen in Spitzer data (Werner et al. 2004; Smith
et al. 2004) and recognized as arising from PAHs (Peeters
et al. 2004b; Smith et al. 2007).
Table A.1: Mid-IR bands of interstellar PAHs adopted in this work for cations and neutrals.
Appendix B: Vibrational modes and density of states of interstellar PAHs
B.1 Vibrational modes
Symmetric top (
![]() symmetry) type PAHs, with
symmetry) type PAHs, with ![]() carbon atoms and
carbon atoms and
![]() hydrogen atoms, have
hydrogen atoms, have
![]() vibrational modes that can be divided into the following types:
vibrational modes that can be divided into the following types:
![]() out-of-plane (op) CC modes,
out-of-plane (op) CC modes,
![]() in-plane (ip) CC modes,
in-plane (ip) CC modes, ![]() out-of-plane CH bending modes,
out-of-plane CH bending modes, ![]() in-plane CH bending modes, and
in-plane CH bending modes, and ![]() CH stretching (st) modes. Following Draine
& Li (2001), we approximate the mode spectrum of each
type of vibration with a two-dimensional Debye model of maximum energy
CH stretching (st) modes. Following Draine
& Li (2001), we approximate the mode spectrum of each
type of vibration with a two-dimensional Debye model of maximum energy ![]() ,
where
,
where ![]() is the Debye temperature. We derive the mode spectra from the following
expressions:
is the Debye temperature. We derive the mode spectra from the following
expressions:
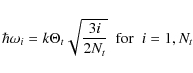
- -
- for the CC modes:
(B.1)
where is the type of mode and Nt
is the number of CC modes of a given type with
is the type of mode and Nt
is the number of CC modes of a given type with
 K
and
K
and  K
with:
K
with:

= 
= 
(B.2)
- -
- for the CH modes:
(B.3)
where ,
and Nt is
the number of CH modes of a given type with
,
and Nt is
the number of CH modes of a given type with
 K,
K,
 K
and
K
and  K.
K.
B.2 Density of states and degeneracies
We estimate the PAH density of harmonic vibrational states from direct
counts, a mode-to-mode convolution method proposed by Beyer & Swinehart (1973). We
start from the rotational density of states, classically given by
![]() with E
and B in cm-1 and for a
symmetric top (Baer & Hase 1996).
We then obtain the rovibrational density of states
with E
and B in cm-1 and for a
symmetric top (Baer & Hase 1996).
We then obtain the rovibrational density of states ![]() with the convolution method. The molecule's zero-point energy has been
chosen as the zero of the energy scale, and the calculation was made
for bins with finite width of 1 cm-1.
To calculate the internal energy distribution of PAHs P(E),
we grouped this very large number of points into broader energy bins
with the convolution method. The molecule's zero-point energy has been
chosen as the zero of the energy scale, and the calculation was made
for bins with finite width of 1 cm-1.
To calculate the internal energy distribution of PAHs P(E),
we grouped this very large number of points into broader energy bins
![]() with i=1 to 500. Each energy bin i
thus contains many states and its degeneracy, gi,
is estimated as (with g1 =
1)
with i=1 to 500. Each energy bin i
thus contains many states and its degeneracy, gi,
is estimated as (with g1 =
1)
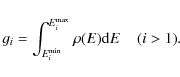
|
(B.4) |
![\begin{figure}
\par\resizebox{9cm}{!}{\includegraphics[angle=90]{12708f15.eps}}
\end{figure}](/articles/aa/full_html/2010/01/aa12708-09/img209.png)
|
Figure B.1:
Cumulative distribution of vibrational modes for coronene (
|
| Open with DEXTER | |
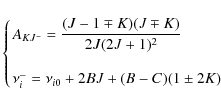
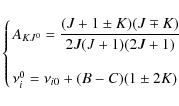
Appendix C: Lines intensities in the rotational bands
In the case of symmetric top molecules, we give below the Hönl-London
factors for the angular part of rovibrational transition rates, as well
as the corresponding transition energies (Herzberg
1968ab). The frequency of the vibrational mode i
is noted ![]() .
.
- -
- for
 and
and  (parallel transitions or out of plane transitions):
AKJ+ = 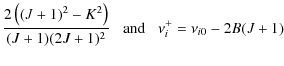
AKJ- = 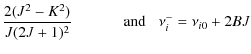
AKJ0 = 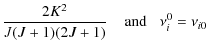
- -
- for
and
 (perpendicular or in plane transitions):
Appendix D: Rate of angular momentum change for gas-grain interactions
We describe below the gas-grain interactions considered in our model of
PAH rotation and the rate of change of Jthey
induce, ![]() .
.
D.1 Collisions with gas atoms and plasma drag
For the collisions with gas neutrals and ions, as well as the plasma
drag, we apply the results of DL98 to planar PAHs.
In the case where ![]() ,
we use the correspondence principle to write
,
we use the correspondence principle to write
![]() and obtain the following rates:
and obtain the following rates:

|
(D.1) |
for the damping contribution, and
|
(D.2) |
for the exciting contribution, where F and G are normalized rates defined in the Appendix B of DL98. We use the formalism of Bakes & Tielens (1994) to estimate the average charge of PAHs of a given size.
D.2 Rocket effect
Ejection of H or H2 from the edges of PAHs may
yield a significant rotational excitation if it occurs asymmetrically,
thus generating a systematic torque by the rocket effect (Rouan et al. 1992). We
note below
![]() the kinetic energy of the
ejected fragment. In the case of H2,
this will happen if this molecule forms on preferential sites by
chemisorption, and if the distribution of these sites on the PAH is
asymmetric as a result of dehydrogenation. We calculate the change
of J assuming that H2
molecules are ejected from the edge of the PAH with a cosine law:
the kinetic energy of the
ejected fragment. In the case of H2,
this will happen if this molecule forms on preferential sites by
chemisorption, and if the distribution of these sites on the PAH is
asymmetric as a result of dehydrogenation. We calculate the change
of J assuming that H2
molecules are ejected from the edge of the PAH with a cosine law:
|
|
= | 
|
|
|
(D.3) |
The above numerical values are based on the following assumptions: (i) all molecular hydrogen is formed on PAHs with
D.3 Photoelectric effect
Stellar UV photons can pull out electrons from grains. These
photoelectrons carry away a significant kinetic energy (![]() 1 eV)
that heats the interstellar gas and impulses grain rotation. If we
assume that the photoelectrons leave the grain surface with a cosine
law distribution, we have
1 eV)
that heats the interstellar gas and impulses grain rotation. If we
assume that the photoelectrons leave the grain surface with a cosine
law distribution, we have
|
(D.4) |
where
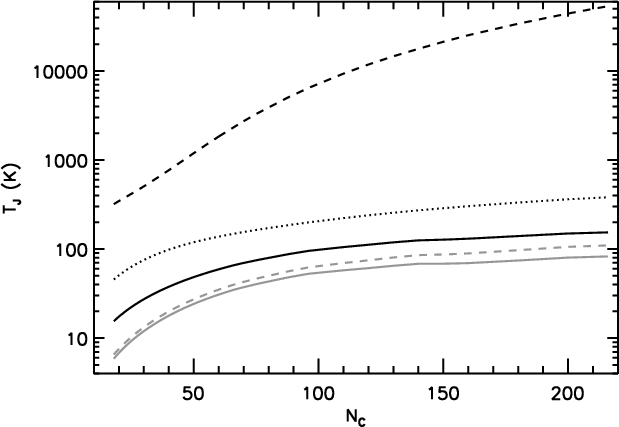
Appendix E: Rotational temperature
A rotational temperature TJ
can be defined from the Maxwell distribution of angular momentum,
![]() :
:
|
(E.1) |
Figure E.1 shows this temperature as a function of PAH size for several interstellar environments. We see that TJ is subthermal in the case of the DIM, and suprathermal for MCs and the Orion Bar. These results are in good agreement with Rouan et al. (1997). The rotational temperature is a relevant parameter in the study of the width of PAH vibrational or electronic transitions. The latter have been proposed as the origin of some unidentified diffuse interstellar bands (DIBs).
|
Figure E.1: Rotational temperature for PAH cations as a function of their size for several insterstellar environments: CNM (black line), WNM (gray dashed line), WIM (gray line), MC (black dotted line) and the Orion Bar (black dashed line). |
| Open with DEXTER | |
References
- Ali-Haïmoud, Y., Hirata, C. M., & Dickinson, C. 2009, MNRAS, 395, 1055 [NASA ADS] [CrossRef] [Google Scholar]
- Allamandola, L. J., Tielens, A. G. G. M., & Barker, J. R. 1985, ApJ, 290, L25 [NASA ADS] [CrossRef] [Google Scholar]
- Andersson, B.-G., Wannier, P. G., Moriarty-Schieven, G. H., & Bakker, E. J. 2000, AJ, 119, 1325 [NASA ADS] [CrossRef] [Google Scholar]
- Baer, T., & Hase, W. 1996, Unimolecular reaction dynamics: theory and experiments (Oxford university press) [Google Scholar]
- Bakes, E. L. O., & Tielens, A. G. G. M. 1994, ApJ, 427, 822 [NASA ADS] [CrossRef] [Google Scholar]
- Beyer, T., & Swinehart, D. 1973, Comm. of the ACM, 16 [Google Scholar]
- Boulanger, F. 2000, in ESA SP-455: ISO Beyond Point Sources: Studies of Extended Infrared Emission, ed. R. J. Laureijs, K. Leech, & M. F. Kessler, 3 [Google Scholar]
- Casassus, S., Cabrera, G. F., Förster, F., et al. 2006, ApJ, 639, 951 [NASA ADS] [CrossRef] [Google Scholar]
- Compiègne, M., Abergel, A., Verstraete, L., & Habart, E. 2008, A&A, 491, 797 [Google Scholar]
- Davies, R. D., Dickinson, C., Banday, A. J., et al. 2006, MNRAS, 370, 1125 [NASA ADS] [CrossRef] [Google Scholar]
- de Oliveira-Costa, A., Tegmark, M., Finkbeiner, D. P., et al. 2002, ApJ, 567, 363 [NASA ADS] [CrossRef] [Google Scholar]
- Draine, B. T., & Lazarian, A. 1998, ApJ, 508, 157 [NASA ADS] [CrossRef] [Google Scholar]
- Draine, B. T., & Li, A. 2001, ApJ, 551, 807 [NASA ADS] [CrossRef] [Google Scholar]
- Dupac, X., Bernard, J.-P., Boudet, N., et al. 2003, A&A, 404, L11 [Google Scholar]
- Ferland, G. J., Korista, K. T., Verner, D. A., et al. 1998, PASP, 110, 761 [Google Scholar]
- Flagey, N., Boulanger, F., Verstraete, L., et al. 2006, A&A, 453, 969 [Google Scholar]
- Herzberg, G. 1968a,b, Diatomic Molecules (a), IR and Raman Spectra of Polyatomic Molecules (b) (Van Norstand) [Google Scholar]
- Joblin, C., Leger, A., & Martin, P. 1992, ApJ, 393, L79 [NASA ADS] [CrossRef] [Google Scholar]
- Joblin, C., Boissel, P., Leger, A., D'Hendecourt, L., & Defourneau, D. 1995, A&A, 299, 835 [Google Scholar]
- Joblin, C., & Mulas, G. 2008, in School on dust, Les Houches, ed. F. Boulanger (EAS Publication Series) [Google Scholar]
- Jura, M. 1975, ApJ, 197, 575 [NASA ADS] [CrossRef] [Google Scholar]
- Kim, H.-S., & Saykally, R. J. 2002, ApJS, 143, 455 [NASA ADS] [CrossRef] [Google Scholar]
- Kim, S.-H., Martin, P. G., & Hendry, P. D. 1994, ApJ, 422, 164 [NASA ADS] [CrossRef] [Google Scholar]
- Lagache, G. 2003, A&A, 405, 813 [Google Scholar]
- Lazarian, A., & Draine, B. T. 1999, ApJ, 516, L37 [NASA ADS] [CrossRef] [Google Scholar]
- Le Page, V., Snow, T. P., & Bierbaum, V. M. 2003, ApJ, 584, 316 [NASA ADS] [CrossRef] [Google Scholar]
- Léger, A., & Puget, J. L. 1984, A&A, 137, L5 [Google Scholar]
- Léger, A., D'Hendecourt, L., & Defourneau, D. 1989, A&A, 216, 148 [Google Scholar]
- Leitch, E. M., Readhead, A. C. S., Pearson, T. J., & Myers, S. T. 1997, ApJ, 486, L23 [NASA ADS] [CrossRef] [Google Scholar]
- Lovas, F. J., McMahon, R. J., Grabow, J.-U., et al. 2005, J. Am. Chem. Soc., 127, 4345 [CrossRef] [PubMed] [Google Scholar]
- Malloci, G., Joblin, C., & Mulas, G. 2007, Chem. Phys., 332, 353 [NASA ADS] [CrossRef] [Google Scholar]
- Mathis, J. S., Rumpl, W., & Nordsieck, K. H. 1977, ApJ, 217, 425 [NASA ADS] [CrossRef] [Google Scholar]
- Miville-Deschênes, M.-A., Ysard, N., Lavabre, A., et al. 2008, A&A, 490, 1093 [Google Scholar]
- Mulas, G. 1998, A&A, 338, 243 [Google Scholar]
- Mulas, G., Malloci, G., Joblin, C., & Toublanc, D. 2006, A&A, 460, 93 [Google Scholar]
- Omont, A. 1986, A&A, 164, 159 [Google Scholar]
- Pech, C., Joblin, C., & Boissel, P. 2002, A&A, 388, 639 [Google Scholar]
- Peeters, E., Hony, S., Van Kerckhoven, C., et al. 2002, A&A, 390, 1089 [Google Scholar]
- Peeters, E., Allamandola, L. J., Bauschlicher, Jr., C. W., et al. 2004a, ApJ, 604, 252 [Google Scholar]
- Peeters, E., Mattioda, A. L., Hudgins, D. M., & Allamandola, L. J. 2004b, ApJ, 617, L65 [NASA ADS] [CrossRef] [Google Scholar]
- Rapacioli, M., Joblin, C., & Boissel, P. 2005, A&A, 429, 193 [Google Scholar]
- Ridge, N. A., Schnee, S. L., Goodman, A. A., & Foster, J. B. 2006, ApJ, 643, 932 [NASA ADS] [CrossRef] [Google Scholar]
- Roche, P. F., Lucas, P. W., & Geballe, T. R. 1996, MNRAS, 281, L25 [NASA ADS] [Google Scholar]
- Rouan, D., Leger, A., Omont, A., & Giard, M. 1992, A&A, 253, 498 [Google Scholar]
- Rouan, D., Leger, A., & Le Coupanec, P. 1997, A&A, 324, 661 [Google Scholar]
- Schutte, W. A., Tielens, A. G. G. M., & Allamandola, L. J. 1993, ApJ, 415, 397 [NASA ADS] [CrossRef] [Google Scholar]
- Smith, J. D. T., Dale, D. A., Armus, L., et al. 2004, ApJS, 154, 199 [NASA ADS] [CrossRef] [Google Scholar]
- Smith, J. D. T., Draine, B. T., Dale, D. A., et al. 2007, ApJ, 656, 770 [NASA ADS] [CrossRef] [Google Scholar]
- Socrates, G. 2001, IR and Raman characteristic group frequencies: Tables and charts (John Wiley & Sons) [Google Scholar]
- Townes, C., & Schawlow, A. 1975, Microwave Spectroscopy (Dover Publications) [Google Scholar]
- Tripathi, A. K., & Sahasrabudhe, A., Mitra, R., et al. 2001, Phys. Chem. Chem. Phys., 3, 449 [Google Scholar]
- Verstraete, L., & Léger, A. 1992, A&A, 266, 513 [Google Scholar]
- Verstraete, L., Pech, C., Moutou, C., et al. 2001, A&A, 372, 981 [Google Scholar]
- Watson, R. A., Rebolo, R., Rubiño-Martín, J. A., et al. 2005, ApJ, 624, L89 [NASA ADS] [CrossRef] [Google Scholar]
- Werner, M. W., Uchida, K. I., Sellgren, K., et al. 2004, ApJS, 154, 309 [NASA ADS] [CrossRef] [Google Scholar]
- Ysard, N., Miville-Deschênes, M. A., & Verstraete, L. 2010, A&A, 509, L1 [Google Scholar]
Footnotes
-
... database
- The molecules considered are perylene (C20H12), benzo[g, h, i]perylene (C22H12), coronene (C24H12), bisanthene (C28H14), dibenzo[bc, ef]coronene (C30H14), ovalene (C32H14), circumbiphenyl (C38H16), circumanthracene (C40H16), cirumpyrene (C42H16), and circumovalene (C66H20).
- ... field
![[*]](/icons/foot_motif.png)
- G0 scales the
radiation field intensity integrated between 6 and
13.6 eV. The Mathis radiation field, G0=1,
corresponds to an intensity of
 erg/s/cm2.
- ... numerous
- Energy conservation implies that 40 IR photons are emitted after each absorption.
- ... approximation
- With this form of n(J) it is possible to define a rotational temperature (see Appendix E).
- ... is
- In the limit
 ,
we estimated that the stimulated emission and absorption of CMB photons
represent less than 20% of the spontaneous emission rate.
,
we estimated that the stimulated emission and absorption of CMB photons
represent less than 20% of the spontaneous emission rate.
- ...(Ferland et al. 1998)
- We assumed 130 (320) ppm of carbon (oxygen) to be in the gas phase. Parameters were taken from the optically thin zone of isochoric simulations with CLOUDY.
- ... same
- We also varied the shape of the blackbody keeping G0
constant (as well as
 ).
Similar J0 values
were found for
).
Similar J0 values
were found for  between 104 and
 K.
K.
- ... interactions
- These models can also be applied to describe the rotational emission of other grain types.
- ... grain
- Conversely, the damping part is correctly described by a
classical model when
(Ali-Haïmoud et al. 2009).
- ... interactions)
- A correction of the same order was found by Ali-Haïmoud et al. (2009), who used the Fokker-Planck equation to derive n(J) instead of a Maxwell distribution.
All Tables
Table 1: Far-IR rovibrational bands of PAH cations adopted in this work, with the percentage of the total oscillator strength in each band.
Table 2: Physical parameters for the typical interstellar phases considered.
Table A.1: Mid-IR bands of interstellar PAHs adopted in this work for cations and neutrals.
All Figures
|
|
Figure 1:
Frequencies of the first (lowest energy) vibrational mode versus |
| Open with DEXTER | |
| In the text | |
|
|
Figure 2:
Absorption cross-section of PAH cations per carbon atom
(1 Mb = 10-18 cm2).
The solid, dotted, dashed, and dot-dashed lines show the cases for |
| Open with DEXTER | |
| In the text | |
|
|
Figure 3:
Symmetric top molecule: |
| Open with DEXTER | |
| In the text | |
|
|
Figure 4:
Internal energy distribution of PAHs with
|
| Open with DEXTER | |
| In the text | |
|
|
Figure 5:
Left: dust IR emission of the DIM (solid
black lines and symbols) with
|
| Open with DEXTER | |
| In the text | |
|
|
Figure 6:
PAH rovibrational emissivity for a MRN size distribution with
|
| Open with DEXTER | |
| In the text | |
|
|
Figure 7:
J0 versus |
| Open with DEXTER | |
| In the text | |
|
|
Figure 8:
a) Effect of varying G0
on J0 for PAH cations with
|
| Open with DEXTER | |
| In the text | |
|
|
Figure 9:
Rate of J-change due to rovibrational emission for
a PAH with |
| Open with DEXTER | |
| In the text | |
|
|
Figure 10:
Rotational emissivity of PAH cations. We take 430 ppm of carbon in
PAHs, |
| Open with DEXTER | |
| In the text | |
|
|
Figure 11: Comparison to observations (symbols) of the Perseus molecular cloud G159.6-18.5. The dashed lines show the free-free (low frequency) and big grains (high-frequency) emissions. The PAH rovibrational emission is represented by the dot-dashed line. Dotted lines show the PAH rotational emission. The black model is model A, and the grey model is model B. See text for details. |
| Open with DEXTER | |
| In the text | |
|
|
Figure B.1:
Cumulative distribution of vibrational modes for coronene (
|
| Open with DEXTER | |
| In the text | |
|
|
Figure E.1: Rotational temperature for PAH cations as a function of their size for several insterstellar environments: CNM (black line), WNM (gray dashed line), WIM (gray line), MC (black dotted line) and the Orion Bar (black dashed line). |
| Open with DEXTER | |
| In the text | |
Copyright ESO 2010
Current usage metrics show cumulative count of Article Views (full-text article views including HTML views, PDF and ePub downloads, according to the available data) and Abstracts Views on Vision4Press platform.
Data correspond to usage on the plateform after 2015. The current usage metrics is available 48-96 hours after online publication and is updated daily on week days.
Initial download of the metrics may take a while.