| Issue |
A&A
Volume 508, Number 3, December IV 2009
|
|
|---|---|---|
| Page(s) | 1259 - 1268 | |
| Section | Extragalactic astronomy | |
| DOI | https://doi.org/10.1051/0004-6361/200912795 | |
| Published online | 27 October 2009 | |
A&A 508, 1259-1268 (2009)
The radial distribution of core-collapse supernovae in spiral host galaxies
A. A. Hakobyan1 - G. A. Mamon2,3 - A. R. Petrosian1 - D. Kunth2 - M. Turatto4
1 - Byurakan Astrophysical Observatory (BAO) and Isaac Newton Institute (INI) of Chile, Armenian Branch,
Byurakan 0213, Aragatzotn province, Armenia
2 -
Institut d'Astrophysique de Paris (UMR 7095: CNRS & Université Pierre
et Marie Curie), 98bis Bd Arago, 75014 Paris, France
3 -
Astrophysics & BIPAC, University of Oxford, Keble Road, Oxford OX1 3RH, UK
4 -
INAF, Osservatorio Astrofisico di Catania, via Santa Sofia 78, 95123 Catania, Italy
Received 30 June 2009 / Accepted 7 October 2009
Abstract
Aims. With the goal of providing constraints on the nature
of the progenitors of core-collapse (CC) supernovae (SNe), we compare
their radial distribution within their spiral host galaxies with the
distributions of stars and ionized gas in spiral disks.
Methods. SNe positions are taken from the Asiago catalog for a
well-defined sample of 224 SNe within 204 host galaxies. The
SN radial distances are estimated from the deprojected separations from
the host galaxy nuclei, and normalized both to the 25th
![]() blue-band isophotal radius and (for the first time) to the statistically-estimated disk scale length.
blue-band isophotal radius and (for the first time) to the statistically-estimated disk scale length.
Results. The normalized radial distribution of all CCSNe is
consistent with an exponential law, as previously found, with a
possible depletion of CCSNe within one-fifth of the isophotal radius
(less significant with scale-length normalization). There are no signs
of truncation of the exponential distribution of CCSNe out to
7 disk scale lengths. The scale length of the distribution of
type II SNe appears to be significantly larger than that of
the stellar disks of their host galaxies, but consistent with the scale
lengths of Freeman disks. SNe Ib/c have a significantly smaller
scale length than SNe II, with little difference between
types Ib and Ic. The radial distribution of type Ib/c
SNe is more centrally concentrated than that of the stars in a Freeman
disk, but is similar to the stellar disk distribution that we infer for
the host galaxies. All CCSN subsamples are consistent with the still
uncertain distribution of H II regions. The scale
length of the CCSN radial distribution shows no significant correlation
with the host galaxy morphological type, or the presence of bars.
However, low luminosity as well as inclined hosts have a less
concentrated distribution (with the scale-length normalized radial
distances) of CCSNe, which are probably a consequence of metallicity
and selection effects, respectively.
Conclusions. The exponential distribution of CCSNe shows a scale
length consistent with that of the ionized gas confirming the generally
accepted hypothesis that the progenitors of these SNe are young massive
stars. Given the lack of correlation of the normalized radial distances
of CCSNe with the morphological type of the host galaxy, we conclude
that the more concentrated distribution of SNe Ib/c relative to
SNe II must arise from the higher metallicity of their progenitors
or possibly from a shallower initial mass function in the inner regions
of spirals.
Key words: supernovae: general - galaxies: spiral - galaxies: stellar content
1 Introduction
Most SNe can be assigned to two main physical classes (e.g., Turatto et al. 2007; Turatto 2003): the gravitational collapse of young massive stellar cores (Types Ib, Ic and II SNe) and the thermonuclear explosions of a white dwarf in close binary systems (Type Ia SNe). While SNe with no or weak hydrogen lines were classified into type I, it is now understood that there are actually three spectroscopically and photometrically distinct subclasses of SNe I. Type Ia SNe are characterized by spectra with no hydrogen lines and strong Si II lines (e.g., Livio 2001; Leibundgut 2000). These SNe appear in galaxies of all morphological types (e.g., van den Bergh et al. 2005; Barbon et al. 1999). Type Ib SNe are characterized by spectra with no evident hydrogen lines, weak or absent Si II and strong He I lines. The third subclass, type Ic SNe, discovered later, shows weak or absent hydrogen, helium lines, and Si II. Type II SNe are characterized by the obvious presence of hydrogen lines. This SN type displays a wide variety of properties: type II Plateau SNe (SNe IIP) with flat light curves in the first few months; type II Linear SNe (SNe IIL) with a rapid, steady decline in the same period; the narrow-lined SNe (SNe IIn), dominated by emission lines with narrow components, a sign of energetic interaction between the SN ejecta and the circumstellar material; and type IIb SNe (SNe IIb), a transitional type, which have early time spectra similar to SNe II and late time spectra similar to SNe Ib/c (e.g., Filippenko et al. 1994,1990).
With the exception of SNe Ia, all types of SNe are rare in early-type galaxies (e.g., van den Bergh et al. 2005). Surprisingly, among morphologically classified hosts of SNe Ib/c and SNe II Hakobyan et al. (2008) found 22 cases where the host has been classified as an Elliptical or S0 galaxy. However, all the early-type hosts of SNe Ib/c and SNe II display independent indicators of recent star formation due to merging or gravitational interactions.
According to theoretical models, the progenitors of SNe Ib/c are massive O type stars that have lost most or all of their hydrogen (and their helium in the case of SN Ic progenitors) envelopes, either by strong winds as in Wolf-Rayet stars (e.g., Eldridge & Tout 2004), or through the transfer of material to a binary companion via Roche lobe overflow (e.g., Heger et al. 2003). Progenitors of SNe II are massive stars that retain their hydrogen envelopes (e.g., Hamuy 2003; Woosley & Weaver 1986).
Many observational studies confirm these theoretical interpretations of these classes of core-collapse SNe (CCSNe). The rates of all CCSN types depend on the morphology of the host galaxies. The rates of SNe Ib/c and II per unit stellar mass increase by factors of 3 and 5 respectively from early- to late-type spiral host galaxies (e.g., Mannucci et al. 2005). Given the short lifetime of their massive progenitors, the rate of CCSNe in host galaxies directly traces the current star formation rate (e.g., Malek et al. 2003). Conversely, when the star formation rate is known, it can be used to verify the consistency of the progenitor scenario (e.g., Hopkins & Beacom 2006).
The observation of progenitor stars of CCSNe in archival pre-explosion images provides a direct test of the theoretical predictions. Since massive evolved stars are the most luminous objects in a galaxy, the progenitors of CCSNe should be directly detectable on pre-explosion images of nearby host galaxies. The advent of data archives of large telescopes with high image quality, most importantly that of the Hubble Space Telescope, has allowed to extend the progenitor detection to distances larger than 20 Mpc (e.g., Maund & Smartt 2005; Van Dyk et al. 2003). These observations have generally confirmed the theoretical predictions mentioned above (e.g., Smartt et al. 2009; Crockett et al. 2007; Pastorello et al. 2007).
The spatial distribution of SNe in host galaxies provides another strong constraint on the nature of SN progenitors.
Various studies show that CCSNe are tightly connected to the disk (e.g., Johnson & MacLeod 1963)
and to the spiral arm structure (Johnson & MacLeod; Maza & van den Bergh 1976; Van Dyk et al. 1996; Bartunov et al. 1994),
which dramatically differs from the SN Ia distribution (e.g., Förster & Schawinski 2008). In addition, CCSNe are well
associated with star-forming sites: OB-associations, and H II regions
(Tsvetkov et al. 2001; Van Dyk et al. 1996; Bartunov et al. 1994).
SNe Ib/c show a higher degree of association with H II regions
than do type II SNe, suggesting that the former arise from a higher mass
progenitor population than the SNe II (Anderson & James 2008).
Most recently, Anderson & James (2009) found that the radial positions of a sample of 177 CCSNe closely follow the
radial distribution of H![]() emission, implying that these SNe are excellent tracers of star formation
within galaxies.
emission, implying that these SNe are excellent tracers of star formation
within galaxies.
One can better constrain the nature of the progenitors of CCSNe by
considering quantitative measures of
their radial distribution within their host galaxies,
after correcting for the inclination of the disk.
In their pioneering study, Johnson & MacLeod found a rapidly decreasing
surface density distribution of SNe, except for an important lack of SNe in the
central regions of spiral galaxies.
The surface density of SNe is known to be exponential (Barbon et al. 1975; Vettolani & Zamorani 1977),
although two studies (Iye & Kodaira 1975; Guseinov et al. 1980) suggested a ring like distribution.
Barbon et al. quantified the
exponential to have a slope that amounts to a scale length of
![]() times the optical radius, while Vettolani & Zamorani found
a scale length of
times the optical radius, while Vettolani & Zamorani found
a scale length of
![]() times the optical radius.
The difference in scale length arises from the different definitions of
optical radius.
All SN types, even the SNe Ia, were included in these early studies.
Using a large sample of CCSNe (of known types), i.e. 74 SNe Ib/c and SNe II,
van den Bergh (1997) found a scale length of
0.22 R25(with no error bar given), where R25 is the isophotal radius for the
blue-band surface brightness of
times the optical radius.
The difference in scale length arises from the different definitions of
optical radius.
All SN types, even the SNe Ia, were included in these early studies.
Using a large sample of CCSNe (of known types), i.e. 74 SNe Ib/c and SNe II,
van den Bergh (1997) found a scale length of
0.22 R25(with no error bar given), where R25 is the isophotal radius for the
blue-band surface brightness of
![]() .
Also, Bartunov et al. (1992) found that their 99 SNe II have an exponential
distribution with scale length that amounts to
.
Also, Bartunov et al. (1992) found that their 99 SNe II have an exponential
distribution with scale length that amounts to
![]() ,
extending far beyond the optical radius of galaxies.
Moreover, Bartunov et al. noticed a sharp decrease in slope of
both SNe II and SNe Ib at
1.4 R25.
,
extending far beyond the optical radius of galaxies.
Moreover, Bartunov et al. noticed a sharp decrease in slope of
both SNe II and SNe Ib at
1.4 R25.
It has rapidly become apparent that SNe Ib/c are more centrally concentrated
within galaxy disks than are SNe II.
Bartunov et al. noticed that their 22 SNe Ib show a non-exponential
distribution that increases slope with radius so that the scale
length varies from
![]() inside
0.5 R25 to
inside
0.5 R25 to
![]() between 0.5 and
1.0 R25.
The more centrally concentrated distribution of SNe Ib/c in comparison to that
of SNe II was also noticed by van den Bergh (1997) and Wang et al. (1997),
but, in contrast to the study of Bartunov et al.,
the difference with the distribution of SNe II was not statistically
significant.
between 0.5 and
1.0 R25.
The more centrally concentrated distribution of SNe Ib/c in comparison to that
of SNe II was also noticed by van den Bergh (1997) and Wang et al. (1997),
but, in contrast to the study of Bartunov et al.,
the difference with the distribution of SNe II was not statistically
significant.
Finally, Tsvetkov et al. (2004) found that, while in the central regions, SNe Ib/c are more concentrated than are the SNe II, in the outer regions the two distributions are similar. This result is at odds with the results of Bartunov et al. (1992), who found increasingly dissimilar slopes for the surface densities of SNe II and of SNe Ib/c in the outer regions of spirals.
Additional insight is obtained by comparing the radial distribution of CCSNe in galaxies of different activity or environment. Petrosian & Turatto (1990) found that their sample of 8 SNe II and SNe Ib within galaxies hosting AGN were significantly more radially concentrated in their galaxy hosts than analogous CCSNe in galaxies without active nuclei. Petrosian et al. (2005) studying a sample of 12 SNe II and SNe Ib/c in galaxies hosting AGN, confirmed this result and found that SNe Ib/c in active/star-forming galaxies are more centrally concentrated than are the SNe II, but given the small sample, this difference was not statistically significant. These results were confirmed with larger samples of CCSNe by Hakobyan (2008), who used both one-dimensional and multivariate statistics.
The locations of SN explosions in multiple systems have also been studied. In interacting galaxies, CCSNe are not preferentially located towards the companion galaxy (Navasardyan et al. 2001; Petrosian & Turatto 1995). Similarly, the azimuthal distributions inside the host members of galaxy groups are consistent with being isotropic (Navasardyan et al. 2001).
In this paper, we make use of a considerably larger sample of CCSNe to reanalyze the distribution of deprojected SN radii normalized both to R25 and, for the first time, to indirect estimates of individual stellar disk scale lengths. We make statistical comparisons between the radial distributions of CCSNe and the distribution of blue light and H II regions in the disks of spiral galaxies.
The plan of the paper is as follows. The samples of CCSNe and host galaxies
are presented in Sect. 2. We discuss the normalizations in Sect. 3.
The results, given in Sect. 4, are discussed and summarized in
Sect. 5. Throughout this article we have assumed a value of
![]() for the Hubble constant.
for the Hubble constant.
2 The CCSN and host galaxy sample
The present investigation is based upon the Asiago Supernova Catalogue (ASC)
(Barbon et al. 1999)![]() , updated on
30 September 2008.
This version contains 4730 SNe (86 SNe I,
2196 SNe Ia, 304 SNe Ib/c, 1141 SNe II and 1003 unclassified SNe) and data for
their host galaxies.
Note that for SNe II it includes also subtypes IIP, IIL, IIn, IIb.
SNe classified as type I or type Ia, or for which the classification was uncertain
(marked as : and ?) or SNe classified from the light curve only
(labelled as *) were excluded from the present study.
The last SN included in the present investigation is SN 2008fq,
discovered on 15 September 2008.
, updated on
30 September 2008.
This version contains 4730 SNe (86 SNe I,
2196 SNe Ia, 304 SNe Ib/c, 1141 SNe II and 1003 unclassified SNe) and data for
their host galaxies.
Note that for SNe II it includes also subtypes IIP, IIL, IIn, IIb.
SNe classified as type I or type Ia, or for which the classification was uncertain
(marked as : and ?) or SNe classified from the light curve only
(labelled as *) were excluded from the present study.
The last SN included in the present investigation is SN 2008fq,
discovered on 15 September 2008.
The analysis of the radial distribution of SNe in host galaxies requires a well-defined sample. We have selected all CCSNe and their hosts with the following criteria:
- 1.
- existing SN spectroscopic classification;
- 2.
- host galaxy with morphological type between Sa and Sd, excluding peculiar morphologies;
- 3.
- host galaxy inclination
 to minimize absorption and
projection effects (
to minimize absorption and
projection effects ( means face-on);
- 4.
- known position angle of the major axis of the host galaxy;
- 5.
- known host galaxy heliocentric radial velocity;
- 6.
- known integrated B magnitude of the host galaxy;
- 7.
- known position of the SN with respect to the galaxy center.
The distribution of morphological types of the 216 host galaxies is peaked around Sbc and Sc. 130 host galaxies are not barred with 38 SNe of type Ib/c and 105 SNe of type II. 86 hosts are barred and have 23 SNe of type Ib/c and 73 SNe of type II.
Because of projection effects, some of the SNe showing small distances to the center may lie quite far away from the center. With the assumption that the CCSNe have young progenitors that are located in the disks of the galaxies, a more realistic separation may be derived, using the inclinations of the host galaxies.
![\begin{figure}
\par\includegraphics[width=8.3cm,clip]{aa12795-fig1.eps}
\end{figure}](/articles/aa/full_html/2009/48/aa12795-09/img15.png)
|
Figure 1:
Location of the SN within its host galaxy. The
center of the galaxy is at the origin of coordinate systems
and the star symbol is the projected location of the SN.
|
| Open with DEXTER | |
Figure 1 illustrates the
geometrical location of a SN in the plane of the host galaxy.
The coordinates of the SN in its host galaxy coordinate system are
and the true radial distance of the SN to the galactic center satisfies
3 Radius normalization
Following Petrosian & Turatto (1990), Bartunov et al. (1992) and van den Bergh (1997), we first normalize the SN radius to the 25th magnitude isophotal radius, R25 (corrected for dust extinction).
The radial surface brightness distribution of spiral disks are well
described by an exponential law (e.g., Freeman 1970)
![]() ,
where R is radius measured along the disk from the center,
h is the scale length of the exponential disk,
and
,
where R is radius measured along the disk from the center,
h is the scale length of the exponential disk,
and
![]() is the central surface brightness.
In terms of
r=R/R25, the surface brightness distribution of disks is
is the central surface brightness.
In terms of
r=R/R25, the surface brightness distribution of disks is
![]() ,
where the scale length follows
the relation
,
where the scale length follows
the relation
where
Freeman (1970) asserted that the extrapolated disk central surface blue brightness,
corrected for inclination and Galactic absorption,
is almost constant and equal to
![]()
![]() .
Inserting
.
Inserting
![]() into Eq. (3),
we obtain the stellar disk scale length of
into Eq. (3),
we obtain the stellar disk scale length of
![]() .
Hereafter, we denote this stellar distribution as the Freeman disk.
.
Hereafter, we denote this stellar distribution as the Freeman disk.
However, the Freeman disk is an oversimplified model: the central disk surface brightness is fainter for late-type spirals, and also decreases with increasing scale length h, as found by Graham & de Blok (2001) in the B and Rbands, as well as Graham (2001) in the K band.
Therefore, rather than assuming that the surface density profile of SNe has a characteristic scale that is proportional to the isophotal radius of their host galaxy, as above, we can alternatively assume that this SN scale is proportional to the stellar disk scale length of their host galaxy, and thus normalize the SN galactocentric radii to the scale lengths of the disks of their host galaxies.
Ideally, we could perform a bulge/disk decomposition for each of our galaxies
to obtain the individual disk scale length. However, this is beyond the scope of the
present paper, and we have chosen instead to adopt a statistical approach, by
relying on the fits of ![]() as a function of disk
absolute magnitude
as a function of disk
absolute magnitude
![]() by Graham & Worley (2008).
Noting that the slope in the
by Graham & Worley (2008).
Noting that the slope in the ![]() vs.
vs.
![]() relation of types Sc and earlier
depends little on the waveband (Table 9 of Graham & Worley), we assume that
the same holds for later morphological types, and thus take the slopes in
the B band from those established by Graham & Worley (their Table 10)
in the K band for
each morphological type. We also assume that the difference
in
relation of types Sc and earlier
depends little on the waveband (Table 9 of Graham & Worley), we assume that
the same holds for later morphological types, and thus take the slopes in
the B band from those established by Graham & Worley (their Table 10)
in the K band for
each morphological type. We also assume that the difference
in ![]() normalizations between the B and K bands is independent of
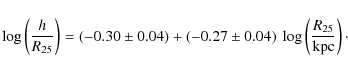
morphological type. This finally gives us
normalizations between the B and K bands is independent of
morphological type. This finally gives us
where h is in kpc and
![\begin{figure}
\par\includegraphics[width=9cm,clip]{aa12795-fig2.eps}
\end{figure}](/articles/aa/full_html/2009/48/aa12795-09/img30.png)
|
Figure 2: Comparison of h / R25 and R25, where the scale length h is computed according to Eq. (4) and Table 1. Red filled circles and blue crosses respectively show the early-type (Sa-Sbc) and late-type (Sc-Sd) galaxies. The solid line is a best fit to the full sample of CCSNe. |
| Open with DEXTER | |
Table 1: Parameters of the scale length vs. luminosity relation (Eq. (4)).
We estimate the disk magnitudes by adopting the median
B band bulge-to-disk ratios
![]() from Fig. 7 of Graham & Worley (2008), i.e.
from Fig. 7 of Graham & Worley (2008), i.e.
![]() .
.
Figure 2 illustrates the comparison of the two normalized radius
indicators. Also shown is the best fit line
The galaxies with large isophotal radii have a smaller ratio of disk scale length to isophotal radius, suggesting (Eq. (3)) that large spiral galaxies have higher central disk surface brightness, as found by Driver et al. (2006). Moreover, since the central disk surface brightness can be written
where h is in kpc, and combining Eqs. (4) and (6), one finds that
On average, we find
![]() (where the errors here
and below are on the mean).
Using Eq. (3), one deduces
(where the errors here
and below are on the mean).
Using Eq. (3), one deduces
![]() ,
i.e. about 0.8 mag brighter than the Freeman disk.
,
i.e. about 0.8 mag brighter than the Freeman disk.
From a statistical point of view the central disk surface brightness for the galaxies of our sample can be obtained in either two ways:
- 1.
- given the galaxy isophotal radius R25 and Graham & Worley's statistical estimate of h, using Eq. (3);
- 2.
- given the galaxy absolute magnitude M and
Graham & Worley's statistical estimates of
 (given the galaxy type) and h(given the galaxy type and disk luminosity),
using Eq. (6).
(given the galaxy type) and h(given the galaxy type and disk luminosity),
using Eq. (6).
![\begin{figure}
\par\includegraphics[width=8.5cm,clip]{aa12795-fig3.eps}
\end{figure}](/articles/aa/full_html/2009/48/aa12795-09/img41.png)
|
Figure 3: Distribution of central disk surface brightness obtained from Eqs. (3) ( open bars) and (6) ( filled bars), using our statistical measurement of disk scale length. |
| Open with DEXTER | |
Which measure of
![]() is more accurate?
The uncertainty on the first measure of
is more accurate?
The uncertainty on the first measure of
![]() (Eq. (3)) is
(Eq. (3)) is
![\begin{displaymath}\sigma_{\mu_0^{\rm disk}}^2 = \left ({2.5\over \ln 10}~{R_{25...
...left ({\sigma_{R_{25}}\over
R_{25}} \right )^2 \right ] \cdot
\end{displaymath}](/articles/aa/full_html/2009/48/aa12795-09/img42.png)
Using Eq. (6), the uncertainty on the second measure of
Hence the difference in the square uncertainties on the first (Eq. (3)) and second (Eq. (6)) measures of
Given that, on average,
In comparison, repeating the same analysis for the 1500 galaxies in a
reference sample found in HyperLeda with
the same selection as in points 2 to 6 of Sect. 2 (plus a limit on
redshift), we find (with Eq. (6)) a mean central disk
surface brightness of
![]() ,
very similar to the central surface brightness inferred from
Eq. (6),
indicating that SN hosts do not have centrally brighter disks than
other galaxies selected in the same way.
,
very similar to the central surface brightness inferred from
Eq. (6),
indicating that SN hosts do not have centrally brighter disks than
other galaxies selected in the same way.
4 Data analysis and results
4.1 Isophotal radius normalization
Figure 4 presents the histograms of the relative radial distributions
of types Ib/c and II SNe in the sample of spiral host galaxies.
45 out of 61 SNe Ib/c (74%) are found to be
located within relative distance
![]() from the nuclei of
their host galaxies, compared to 79 out of 178 (44%) of all SNe II.
The average relative radial distances
for types SNe Ib/c, SNe II, and all CCSNe are
from the nuclei of
their host galaxies, compared to 79 out of 178 (44%) of all SNe II.
The average relative radial distances
for types SNe Ib/c, SNe II, and all CCSNe are
![]() (
(
![]() ),
),
![]() (
(
![]() )
and
)
and
![]() (
(
![]() ), respectively.
), respectively.
![\begin{figure}
\par\includegraphics[width=9cm,clip]{aa12795-fig4.eps}
\end{figure}](/articles/aa/full_html/2009/48/aa12795-09/img56.png)
|
Figure 4: Distribution of deprojected isophotal-normalized radial distances for SNe of types Ib/c ( open bars) and II ( filled bars). |
| Open with DEXTER | |
The observational deficit of SNe in the central regions of remote galaxies relative to nearer galaxies, the Shaw (1979) effect, is found to be more important for deep photographic SN searches and negligible for visual and CCD searches in nearby galaxies (e.g., Cappellaro et al. 1997). The relative lack of CCSNe at the largest relative galactocentric distances for nearby galaxies might be caused by the limited fields of view of various SN search programs.
Figure 5, similar to Fig. 1 of
Wang et al. (1997), illustrates the relative
distance of CCSNe from the centers of their hosts
vs. the radial velocity of the host galaxy.
Spearman rank correlation tests indicate that SNe II show no trend for
![]() vs. host galaxy radial velocity (rank correlation
coefficient
vs. host galaxy radial velocity (rank correlation
coefficient
![]() ). However, these tests indicate strong
positive trends between galaxy radial velocity and
). However, these tests indicate strong
positive trends between galaxy radial velocity and
![]() (
(
![]() with probability P=0.04 of a stronger trend occurring by chance) for SNe II
on one hand, and both
with probability P=0.04 of a stronger trend occurring by chance) for SNe II
on one hand, and both
![]() (
(
![]() )
and
)
and
![]() (
(
![]() )
for SNe Ib/c
on the other hand.
However, if one removes the nearest galaxies (
)
for SNe Ib/c
on the other hand.
However, if one removes the nearest galaxies (
![]() ),
the trends become weaker and no longer statistically significant:
),
the trends become weaker and no longer statistically significant:
![]() ,
P=0.10 for SNe II with scale length
normalization, and
,
P=0.10 for SNe II with scale length
normalization, and
![]() for SNe Ib/c with either
normalization.
for SNe Ib/c with either
normalization.
![\begin{figure}
\par\includegraphics[width=9cm,clip]{aa12795-fig5.eps}\vspace*{1.5mm}
\end{figure}](/articles/aa/full_html/2009/48/aa12795-09/img66.png)
|
Figure 5: Deprojected isophotal-normalized SN-to-host distances vs. radial velocity of host galaxy (as a proxy for distance). SNe Ib/c and SNe II are shown as green filled circles and red plus signs, respectively. |
| Open with DEXTER | |
We therefore limit our CCSN sample to distances
![]() ,
thus retaining 224 SNe of the original 239, living in 204 host galaxies.
Table 2 displays the matrix of SNe type versus host galaxy
morphological type in this reduced sample.
The SNe Ib/c are equally split into 25 early-type spiral hosts (Sa to Sbc) and 30
late-type (Sc to Sd), while among the SNe II, 102 are in early-type spirals and only
67 in late-types. But this preference of SNe Ib/c for late-type spirals is
not statistically significant (from binomial statistics).
,
thus retaining 224 SNe of the original 239, living in 204 host galaxies.
Table 2 displays the matrix of SNe type versus host galaxy
morphological type in this reduced sample.
The SNe Ib/c are equally split into 25 early-type spiral hosts (Sa to Sbc) and 30
late-type (Sc to Sd), while among the SNe II, 102 are in early-type spirals and only
67 in late-types. But this preference of SNe Ib/c for late-type spirals is
not statistically significant (from binomial statistics).
Table 2: Distribution of SN types and host galaxy morphological types.
The distribution of radial distances can be better understood by considering the
normalized surface density profile of SNe within their host
galaxies. We have determined the
surface density of CCSNe,
![]() where rjis the relative inner radius of the circular annuli of width
rj+1 - rj (jth bin),
and nj indicates the number of CCSNe in the jth bin.
The top left panel of Fig. 6 shows that the stacked surface density
distribution of all 224 CCSNe appears consistent with an exponential law, except for a lack of
SNe in the central regions (
where rjis the relative inner radius of the circular annuli of width
rj+1 - rj (jth bin),
and nj indicates the number of CCSNe in the jth bin.
The top left panel of Fig. 6 shows that the stacked surface density
distribution of all 224 CCSNe appears consistent with an exponential law, except for a lack of
SNe in the central regions (
![]() ).
).
![\begin{figure}
\par\includegraphics[width=17cm,clip]{aa12795-fig6.eps}
\end{figure}](/articles/aa/full_html/2009/48/aa12795-09/img71.png)
|
Figure 6:
Top: surface density profiles (with arbitrary normalization)
of all CCSNe, with host galaxy isophotal
radius normalization ( left), and with disk scale length normalization
( right).
The thick solid line shows the maximum likelihood exponential surface
density profile of CCSNe.
The thin solid line represents the stellar
exponential disk of the host galaxies.
Bottom: same as top panels, for SNe Ib/c
( green open circles) and SNe II ( red filled circles).
The thick lines indicate the maximum likelihood
exponential surface density profiles for the SNe Ib/c ( green dashed) and SNe II
( red solid).
The error bars assume a Poisson distribution
(with |
| Open with DEXTER | |
If the surface density of CCSNe is an exponential
function of
![]() (i.e.
(i.e.
![]() ,
where
,
where
![]() is the scale length
for the distribution on disk, and
is the scale length
for the distribution on disk, and
![]() is the central surface
density of CCSNe), then
the probability that a SN is observed at normalized radius
is the central surface
density of CCSNe), then
the probability that a SN is observed at normalized radius
![]() is
is
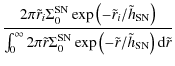
Equation (7) assumes no truncation in the normalized SN radii, and indeed we consider all SN, whatever their distance to the center of their host galaxy. The likelihood of the set of
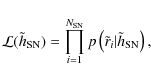
|
(8) |
and maximizing
for
i.e., the maximum likelihood exponential scale length is half the arithmetic mean of the radial distances. The integral of the denominator of Eq. (7) yields the normalization

|
(10) |
We check the goodness of fit using the Kolmogorov-Smirnov (KS) test on the normalized cumulative distributions of all SN types, where the exponential model has a cumulative normalized distribution
Table 3: Maximum likelihood fits of an exponential surface density profile to the radial distribution of CCSNe.
Table 3 presents the maximum likelihood fits of the exponential surface density profiles. One sees that all SN samples show stacked surface number density distributions that are consistent with an exponential model, with the exception of non-barred early-type spiral hosts (among which are the three galaxies of our 224 SN host galaxy sample with CCSNe beyond 2 R25).
However, Table 3 indicates that the distribution of SNe Ib/c is significantly more centrally concentrated than the distribution of stars in a Freeman disk. More precisely, SNe Ib/c appear 30% more centrally concentrated than SNe II. The scale length of SNe Ib/c is consistent with the scale length of stars in the host galaxies, while the SNe II appear 20% less concentrated than the stars in the host galaxies, but as concentrated as the stars in Freeman disks. The host galaxy morphological type appears to play no role in the distribution of SNe. However, the SNe in nearly face-on host galaxies appear more centrally concentrated than the SNe in more inclined host galaxies. This indicates that observational selection effects (dust extinction and confusion) prevent the observation of SNe near the centers of inclined disks.
The bottom left panel of Fig. 6 highlights the differences
in the radial distributions of SNe Ib/c and SNe II.
While SNe II have a 30% larger scale length,
both classes of SN types show an important
(statistically significant for the SNe II) drop in
the center (
![]() ).
).
The surface density distributions of H II regions in spiral galaxy disks can
also be represented reasonably well by an exponential function
(e.g., Hodge & Kennicutt 1983; Athanassoula et al. 1993; García-Gómez et al. 2002), the exceptions being mainly due to
unsatisfactory fits of the maxima near the center. Athanassoula et al. found
that the H II regions are marginally more concentrated to the centers of spiral galaxies
than are the disk stars, with
a ratio of scale lengths of
![]() is
is ![]() .
In units of R25, the ionized gas scale length is then
.
In units of R25, the ionized gas scale length is then
![]() if we use the Freeman disk normalization, i.e.
Freeman disk scale length of
if we use the Freeman disk normalization, i.e.
Freeman disk scale length of
![]() .
If we use the CCSN host disk normalization, i.e.
CCSN host disk average scale length of
.
If we use the CCSN host disk normalization, i.e.
CCSN host disk average scale length of
![]() ,
then
,
then
![]() .
Given the large uncertainty on the ratio of gas to stellar disk scale
length, the SN distribution is not inconsistent with that of the
ionized gas.
.
Given the large uncertainty on the ratio of gas to stellar disk scale
length, the SN distribution is not inconsistent with that of the
ionized gas.
In reality, the surface brightness profile of massive young stars in galaxies is more complex than a simple exponential disk model: indeed, the surface density of the star formation rate (SFR) has a hole in the center of our galaxy (Rana & Wilkinson 1986), and in other galaxies the SFR follows the surface density of the total (atomic and molecular) gas (Kennicutt 1998a; Buat et al. 1989), which is known to present a hole in the central regions (e.g., Kennicutt 1998b).
Table 4: Kolmogorov-Smirnov tests of the consistency of different CCSN distributions with two exponential disk models.
Table 4 presents, for the full 224 CCSN sample and
different subsamples, the KS test probabilities that the
isophotal-radius-normalized
distributions are consistent with those of the stars in a Freeman disk (
![]() ), and of the CCSN host disks (
), and of the CCSN host disks (
![]() ).
While there are several departures from the Freeman exponential disk,
most subsamples are consistent with the exponential disk that we
infer for the galaxy hosts. This is most significant for
the full CCSN sample compared to the Freeman disk,
because of the central drop and of the few SNe lying very far out.
).
While there are several departures from the Freeman exponential disk,
most subsamples are consistent with the exponential disk that we
infer for the galaxy hosts. This is most significant for
the full CCSN sample compared to the Freeman disk,
because of the central drop and of the few SNe lying very far out.
Table 5: Kolmogorov-Smirnov tests of the consistency of the radial distributions of CCSNe among different pairs of subsamples.
KS tests comparing different subsamples of CCSNe are given in Table 5. These tests confirm our conclusions based upon the maximum likelihood scale lengths: 1) the radial distribution of SNe Ib/c is highly inconsistent with that of SNe II, because the former are more centrally concentrated (Table 3); 2) the radial distribution of CCSNe is not significantly affected by the morphological type of the host galaxy, the presence of bars, the luminosity of the host galaxy or its disk inclination.
4.2 Scale length normalization
When we normalize the deprojected radial distances of CCSNe to the indirectly
determined scale lengths of the disks of their host galaxies, we find that
their distribution is even better described by an exponential law.
With the exponential model of
![]() ,
where
,
where
![]() ,
the maximum likelihood estimate of
,
the maximum likelihood estimate of
![]() will satisfy
will satisfy
![]() ,
as can be found in the same way as
Eq. (9).
The top right panel of Fig. 6 shows that the stacked surface density
profile of all 224 CCSNe appears consistent with an exponential law,
with only a very small drop in the central regions (
,
as can be found in the same way as
Eq. (9).
The top right panel of Fig. 6 shows that the stacked surface density
profile of all 224 CCSNe appears consistent with an exponential law,
with only a very small drop in the central regions (
![]() ).
).
Table 3 indicates that all subsamples have surface density profiles that are consistent with the exponential model. The Table also confirms that the mean scale length of SNe II is 35% greater than that of SNe Ib/c, with the scale length of stars in between.
The bottom right panel of Fig. 6 illustrates the different radial distributions of the SNe Ib/c and SNe II. For both SN types, the drop in the center is much less pronounced than with the isophotal radius normalization, and not statistically significant.
Table 4 indicates that nearly all subsamples have surface densities distributions that are consistent with the exponential disks of their host galaxies. The exceptions are early-type, barred, and low luminosity and highly inclined galaxies, as well as SNe II (there are 1 SNe Ic and 4 SNe II lying beyond 7 scale lengths).
Table 5 shows that the distributions of subsamples are consistent when coupled in pairs, except that also with scale-length normalization, SNe Ib/c are significantly more centrally concentrated than are SNe II and that CCSNe are more concentrated in high luminosity host galaxies.
We also find marginal trends for the CCSNe to be more centrally concentrated in face-on host galaxies, and no significant difference between the radial distributions of SNe Ib and SNe Ic.
In addition, we performed KS tests for dividing our subsamples of both types of CCSNe into different distance bins, of the half most nearby and half most distant host galaxies. These tests confirm that the distribution of CCSNe in our sample (both isophotal and scale-length normalizations) is not significantly affected by the distance of the host galaxy (see Table 5).
5 Discussion and conclusions
Our results reported in Sect. 4 (the top panels of Fig. 6,
and Table 3) indicate
that the global surface density of CCSNe within their host galaxies is exponential
with a scale length of
![]() ,
which is 30%
larger than the scale length found by van den Bergh (1997) with a 5 times smaller
sample.
,
which is 30%
larger than the scale length found by van den Bergh (1997) with a 5 times smaller
sample.
There are several reasons why the observed radial distribution of CCSNe might not be a perfect exponential:
- 1.
- the total radial distribution may be the combination of several components with different distributions;
- 2.
- the inner disk may be destroyed or perturbed by an important bulge;
- 3.
- the inner CCSNe may be confused with the light of the bulge;
- 4.
- dust extinction may prevent the observation of CCSNe in the more opaque inner regions of edge-on spiral galaxies;
- 5.
- the progenitors of CCSNe may follow a truncated exponential disk.
There is a small loss of CCSNe in
the central regions of host galaxies
(bottom panels of Fig. 6).
This is not unexpected since the observed radial distribution of CCSNe can be
affected by the internal dust extinction of their hosts as well as the
confusion with the high surface brightness of their bulges.
In our Galaxy, the star formation rate
as a function of galactocentric radius does not follow a pure exponential
disk, but is vigorous
near the center and is strongly peaked around
![]() (e.g., Kennicutt 1989).
Since the mean normalized
distances of CCSNe in inclined galaxies turn out to be
larger than those in face-on
ones (Tables 3 and 5), dust extinction
plays a quantitative role, and should also explain
the central dip in the CCSN surface density profile, mainly seen with the
isophotal normalization
(bottom left panel of Fig. 6).
This dip cannot be explained by confusion with the light from the galaxy bulge, since
CCSNe appear more centrally concentrated in the more luminous galaxies.
(e.g., Kennicutt 1989).
Since the mean normalized
distances of CCSNe in inclined galaxies turn out to be
larger than those in face-on
ones (Tables 3 and 5), dust extinction
plays a quantitative role, and should also explain
the central dip in the CCSN surface density profile, mainly seen with the
isophotal normalization
(bottom left panel of Fig. 6).
This dip cannot be explained by confusion with the light from the galaxy bulge, since
CCSNe appear more centrally concentrated in the more luminous galaxies.
The dip in the inner distribution of SNe II has also been recently reported by Anderson & James (2009). These authors found that this central deficit of SNe II is offset by a central excess of SNe Ib/c. Instead, our analysis (Fig. 6) shows no central excess for SNe Ib/c. In fact with the isophotal normalization one sees fairly significant central dips in the distributions of both SNe II and SNe Ib/c, while with the scale length normalization there is a small dip for the SNe Ib/c, and only a weak dip at best for the SNe II (neither being statistically significant).
Whereas several authors have suggested that stellar disks are sharply
truncated at several scale lengths
(e.g., Ruphy et al. 1996, found that the Milky Way is truncated at 6.5 scale lengths),
there are no signs of
such a truncation in the distribution of CCSNe out to
7 scale lengths (right panels of Fig. 6)
and SNe are observed out to nearly 11 scale lengths.
In fact, with our fairly large sample, we find weak signs of
a shallower slope at large radii, which does not occur at
1.4 R25 as reported by Bartunov et al., but at
![]() for SNe II, as we have two SNe II near
2.4 R25(see bottom left panel of Fig. 6).
for SNe II, as we have two SNe II near
2.4 R25(see bottom left panel of Fig. 6).
Since CCSNe are believed to originate from massive stars, one expects
that the radial distribution of CCSNe should resemble that of
tracers of recent star formation
such as ionized gas or perhaps even of
future star formation such as molecular gas.
The values of scale length
![]() for CCSNe in spiral host galaxies
(see Col. 3 of Table 3) are in good agreement with the data reported by
Athanassoula et al. (1993) on scale lengths of H II regions on exponential disks in spiral galaxies of
different types. But the huge uncertainty on the scale length of the ionized gas prevents us
from making a firm conclusion here.
for CCSNe in spiral host galaxies
(see Col. 3 of Table 3) are in good agreement with the data reported by
Athanassoula et al. (1993) on scale lengths of H II regions on exponential disks in spiral galaxies of
different types. But the huge uncertainty on the scale length of the ionized gas prevents us
from making a firm conclusion here.
We thus focused our analysis of the surface density profiles of CCSNe by comparing them to the surface density profile of stars in spiral disks, which admittedly is a poorer proxy for CCSNe progenitors than are the H II regions. With the isophotal radius normalization, the stacked surface density profile of SNe II is similar to that of the Freeman stellar disk, while the surface density profile of the SNe Ib/c has a smaller scale length than that of the Freeman disk. Given the uncertainties on the relevance of the Freeman disk for spiral galaxies, we also scaled the SN galactocentric distances to our statistical estimate of the scale length of each galaxy. Then, we find that the disk scale length is in between the small scale length of the SNe Ib/c and the larger scale length of the SNe II.
As mentioned above, we also find that SNe Ib/c are significantly more concentrated towards the centers of their host galaxies than are the SNe II, for the isophotal radius normalization (bottom left panel of Fig. 6, as well as Table 5). This result has been known for some time (e.g., Wang et al. 1997; Hakobyan 2008; van den Bergh 1997; Petrosian et al. 2005) for the distribution of radii normalized to R25, but we confirm the more centrally concentrated distribution of SNe Ib/c with our normalization to the disk scale lengths (Fig. 6 and Table 5). For both normalizations, the scale length of the SN Ib/c distribution is roughly 30% smaller than that of the SN II distribution.
We find no statistically significant difference in the radial
distributions of SNe Ib and SNe Ic, regardless of the normalization used.
This result may appear in
conflict with Anderson & James (2009), who found that SNe Ic are more centrally
concentrated than SNe Ib, while our measures of the concentration are
consistent (see values of
![]() and
and
![]() in
Table 3).
However Anderson & James admit that their result
is not statistically significant. Moreover, the mean distance of SNe Ic in our
sample is pushed up by one SN Ic that lies very far from its host galaxy
(
1.8 R25 and over 10 scale lengths). Still, even if this apparent
outlier is omitted from our sample, the normalized radial distributions of
SNe Ib and SNe Ic are similar enough that the KS test fails to distinguish
them with statistical significance. Admittedly, the analysis of
Anderson & James had the advantage of a much more precise measurement of the
normalization, as they actually went through the trouble of measuring the
light distribution around each host galaxy.
in
Table 3).
However Anderson & James admit that their result
is not statistically significant. Moreover, the mean distance of SNe Ic in our
sample is pushed up by one SN Ic that lies very far from its host galaxy
(
1.8 R25 and over 10 scale lengths). Still, even if this apparent
outlier is omitted from our sample, the normalized radial distributions of
SNe Ib and SNe Ic are similar enough that the KS test fails to distinguish
them with statistical significance. Admittedly, the analysis of
Anderson & James had the advantage of a much more precise measurement of the
normalization, as they actually went through the trouble of measuring the
light distribution around each host galaxy.
It is a well established fact that the metallicity in spiral disks decreases with increasing galactocentric distance (e.g., Henry & Worthey 1999). The obvious physical explanation for the more peaked radial distribution of SNe Ib/c with respect to SNe II is the effect of metallicity of SN progenitor environment. The local metallicity of the SN progenitor environment (Boissier & Prantzos 2009) as well as the global metallicity of the host galaxy (e.g., Meynet & Maeder 2005; Prantzos & Boissier 2003; Prieto et al. 2008) are approximately correlated with the SN progenitor metallicity: the ratio of the number of SNe Ib/c to SNe II increases with increasing local metallicity in CCSN hosts. In this respect, Eggenberger et al. (2002) found that the number ratio of the blue to red supergiants and the local metallicity in the Milky Way decreases with increasing galactocentric radius. Anderson & James (2009) also concluded that the more concentrated distribution of SNe Ib/c must be related to a strong metallicity dependence on the relative production of these CCSNe, with SNe Ib/c arising from higher metallicity progenitors than SNe II. Note that, since higher luminosity spirals have higher metallicity at the effective radius (Garnett 2002), the more concentrated distribution (with scale-length normalization) of CCSNe in high luminosity galaxies may also be a sign of the higher metallicity of these hosts.
In summary, our reanalysis of a considerably large sample of CCSNe has allowed us to derive precise surface density profiles for different subsamples of CCSNe. These in turn led us to the following statistically based conclusions:
- 1.
- The surface density of CCSNe in all studied subsamples (different CCSN type or galaxy
host type or luminosity or inclination) falls exponentially with relative
radius
 and
and
 ,
with no signs of
truncation out to 7 disk scale lengths.
,
with no signs of
truncation out to 7 disk scale lengths.
- 2.
- The radial distribution of CCSNe is not significantly affected by the host galaxy type, or by the presence of a bar in the host.
- 3.
- The radial distribution of CCSNe, measured with scale-length normalization, is more concentrated in high luminosity host galaxies.
- 4.
- The radial distribution of SNe Ib/c is significantly more concentrated than the Freeman disk distribution and consistent with the radial distribution of H II regions.
- 5.
- The radial distribution of SNe II is consistent with both the Freeman disk and the H II regions distributions, but significantly less concentrated than the host disks.
- 6.
- There is a small lack of CCSNe
within one-fifth of the isophotal radius (
 ),
not well visible with scale-length normalization.
),
not well visible with scale-length normalization.
- 7.
- The radial distribution of type Ib/c SNe in their host galaxies is more centrally
concentrated than that of type II SNe, the ratio of scale lengths is
 ,
probably because of a metallicity effect.
,
probably because of a metallicity effect.
We thank F. Matteucci, N. Prantzos, and J. Silk for useful discussions. This research was supported in part by a grant from the PICS France-Arménie and a scholarship to A.A.H. from the French Government. A.R.P. wishes to thank the Institut d'Astrophysique de Paris (France) for the hospitality and support (via the EARA network) during the beginning stage of this work and the Osservatorio Astrofisico di Catania (Italy) for hospitality during the last stage of this work. This research has made use of the Asiago Supernova Catalogue, which is available at http://web.oapd.inaf.it/supern/cat and the HyperLeda database, available at http://leda.univ-lyon1.fr/. Finally, we are especially grateful to our referee for his/her constructive comments.
References
- Anderson, J. P., & James, P. A. 2008, MNRAS, 390, 1527 [NASA ADS]
- Anderson, J. P., & James, P. A. 2009, MNRAS, 399, 559 [CrossRef]
- Athanassoula, E., García-Gómez, C., & Bosma, A. 1993, A&AS, 102, 229 [NASA ADS]
- Barbon, R., Capaccioli, M., & Ciatti, F. 1975, A&A, 44, 267 [NASA ADS]
- Barbon, R., Buondí, V., Cappellaro, E., & Turatto, M. 1999, A&AS, 139, 531 [NASA ADS] [EDP Sciences] [CrossRef]
- Bartunov, O. S., Makarova, I. N., & Tsvetkov, D. I. 1992, A&A, 264, 428 [NASA ADS]
- Bartunov, O. S., Tsvetkov, D. Y., & Filimonova, I. V. 1994, PASP, 106, 1276 [NASA ADS] [CrossRef]
- Boissier, S., & Prantzos, N. 2009, A&A, 503, 137 [NASA ADS] [EDP Sciences] [CrossRef]
- Boissier, S., Prantzos, N., Boselli, A., & Gavazzi, G. 2003, MNRAS, 346, 1215 [NASA ADS] [CrossRef]
- Bottinelli, L., Gouguenheim, L., Paturel, G., & Teerikorpi, P. 1995, A&A, 296, 64 [NASA ADS]
- Buat, V., Deharveng, J. M., & Donas, J. 1989, A&A, 223, 42 [NASA ADS]
- Cappellaro, E., Turatto, M., Tsvetkov, D. Y., et al. 1997, A&A, 322, 431 [NASA ADS]
- Crockett, R. M., Smartt, S. J., Eldridge, J. J., et al. 2007, MNRAS, 381, 835 [NASA ADS] [CrossRef]
- Driver, S. P., Allen, P. D., Graham, A. W., et al. 2006, MNRAS, 368, 414 [NASA ADS]
- Eggenberger, P., Meynet, G., & Maeder, A. 2002, A&A, 386, 576 [NASA ADS] [EDP Sciences] [CrossRef]
- Eldridge, J. J., & Tout, C. A. 2004, MNRAS, 353, 87 [NASA ADS] [CrossRef]
- Filippenko, A. V., Porter, A. C., & Sargent, W. L. W. 1990, AJ, 100, 1575 [NASA ADS] [CrossRef]
- Filippenko, A. V., Matheson, T., & Barth, A. J. 1994, AJ, 108, 2220 [NASA ADS] [CrossRef]
- Förster, F., & Schawinski, K. 2008, MNRAS, 388, L74 [NASA ADS]
- Freeman, K. C. 1970, ApJ, 160, 811 [NASA ADS] [CrossRef]
- García-Gómez, C., Athanassoula, E., & Barberà, C. 2002, A&A, 389, 68 [NASA ADS] [EDP Sciences] [CrossRef]
- Garnett, D. R. 2002, ApJ, 581, 1019 [NASA ADS] [CrossRef]
- Graham, A. W. 2001, MNRAS, 326, 543 [NASA ADS] [CrossRef]
- Graham, A. W., & de Blok, W. J. G. 2001, ApJ, 556, 177 [NASA ADS] [CrossRef]
- Graham, A. W., & Worley, C. C. 2008, MNRAS, 388, 1708 [NASA ADS] [CrossRef]
- Guseinov, O. H., Kasumov, F. K., & Kalinin, E. V. 1980, Ap&SS, 68, 385 [NASA ADS] [CrossRef]
- Hakobyan, A. A. 2008, Astrophysics, 51, 69 [NASA ADS] [CrossRef]
- Hakobyan, A. A., Petrosian, A. R., McLean, B., et al. 2008, A&A, 488, 523 [NASA ADS] [EDP Sciences] [CrossRef]
- Hamuy, M. 2003, in Core Collapse of Massive Stars, ed. C. L. Fryer (Dordrecht: Kluwer) [arXiv:astro-ph/0301006]
- Heger, A., Fryer, C. L., Woosley, S. E., Langer, N., & Hartmann, D. H. 2003, ApJ, 591, 288 [NASA ADS] [CrossRef]
- Henry, R. B. C., & Worthey, G. 1999, PASP, 111, 919 [NASA ADS] [CrossRef]
- Hodge, P. W., & Kennicutt, Jr., R. C. 1983, ApJ, 267, 563 [NASA ADS] [CrossRef]
- Hopkins, A. M., & Beacom, J. F. 2006, ApJ, 651, 142 [NASA ADS] [CrossRef]
- Iye, M., & Kodaira, K. 1975, PASJ, 27, 411 [NASA ADS]
- Johnson, H. M., & MacLeod, J. M. 1963, PASP, 75, 123 [NASA ADS] [CrossRef]
- Kennicutt, Jr., R. C. 1989, ApJ, 344, 685 [NASA ADS] [CrossRef]
- Kennicutt, Jr., R. C. 1998a, ApJ, 498, 541 [NASA ADS] [CrossRef]
- Kennicutt, Jr., R. C. 1998b, ARA&A, 36, 189 [NASA ADS] [CrossRef]
- Leibundgut, B. 2000, A&ARv, 10, 179 [NASA ADS]
- Livio, M. 2001, in Supernovae and Gamma-Ray Bursts: the Greatest Explosions since the Big Bang, ed. M. Livio, N. Panagia, & K. Sahu, 334
- Malek, M., Morii, M., Fukuda, S., et al. 2003, Phys. Rev. Lett., 90, 061101 [NASA ADS] [CrossRef]
- Mannucci, F., Della Valle, M., Panagia, N., et al. 2005, A&A, 433, 807 [NASA ADS] [EDP Sciences] [CrossRef]
- Maund, J. R., & Smartt, S. J. 2005, MNRAS, 360, 288 [NASA ADS] [CrossRef]
- Maza, J., & van den Bergh, S. 1976, ApJ, 204, 519 [NASA ADS] [CrossRef]
- Meynet, G., & Maeder, A. 2005, A&A, 429, 581 [NASA ADS] [EDP Sciences] [CrossRef]
- Navasardyan, H., Petrosian, A. R., Turatto, M., Cappellaro, E., & Boulesteix, J. 2001, MNRAS, 328, 1181 [NASA ADS] [CrossRef]
- Pastorello, A., Smartt, S. J., Mattila, S., et al. 2007, Nature, 447, 829 [NASA ADS] [CrossRef]
- Paturel, G., Petit, C., Prugniel, P., et al. 2003, A&A, 412, 45 [NASA ADS] [EDP Sciences] [CrossRef]
- Petrosian, A. R., & Turatto, M. 1990, A&A, 239, 63 [NASA ADS]
- Petrosian, A. R., & Turatto, M. 1995, A&A, 297, 49 [NASA ADS]
- Petrosian, A., Navasardyan, H., Cappellaro, E., et al. 2005, AJ, 129, 1369 [NASA ADS] [CrossRef]
- Prantzos, N., & Boissier, S. 2003, A&A, 406, 259 [NASA ADS] [EDP Sciences] [CrossRef]
- Prieto, J. L., Stanek, K. Z., & Beacom, J. F. 2008, ApJ, 673, 999 [NASA ADS] [CrossRef]
- Rana, N. C., & Wilkinson, D. A. 1986, MNRAS, 218, 497 [NASA ADS]
- Ruphy, S., Robin, A. C., Epchtein, N., et al. 1996, A&A, 313, L21 [NASA ADS]
- Schlegel, D. J., Finkbeiner, D. P., & Davis, M. 1998, ApJ, 500, 525 [NASA ADS] [CrossRef]
- Shaw, R. L. 1979, A&A, 76, 188 [NASA ADS]
- Smartt, S. J., Eldridge, J. J., Crockett, R. M., & Maund, J. R. 2009, MNRAS, 395, 1409 [NASA ADS] [CrossRef]
- Terry, J. N., Paturel, G., & Ekholm, T. 2002, A&A, 393, 57 [NASA ADS] [EDP Sciences] [CrossRef]
- Tsvetkov, D. Y., Blinnikov, S. I., & Pavlyuk, N. N. 2001, Astron. Lett., 27, 411 [NASA ADS] [CrossRef]
- Tsvetkov, D. Y., Pavlyuk, N. N., & Bartunov, O. S. 2004, Astron. Lett., 30, 729 [NASA ADS] [CrossRef]
- Turatto, M. 2003, in Supernovae and Gamma-Ray Bursters, ed. K. Weiler, Lecture Notes in Physics (Berlin: Springer Verlag), 598, 21
- Turatto, M., Benetti, S., & Pastorello, A. 2007, in Supernova 1987A: 20 Years After: Supernovae and Gamma-Ray Bursters, ed. S. Immler, K. Weiler, & R. McCray, AIP Conf. Ser., 937, 187
- van den Bergh, S. 1997, AJ, 113, 197 [NASA ADS] [CrossRef]
- van den Bergh, S., Li, W., & Filippenko, A. V. 2005, PASP, 117, 773 [NASA ADS] [CrossRef]
- Van Dyk, S. D., Hamuy, M., & Filippenko, A. V. 1996, AJ, 111, 2017 [NASA ADS] [CrossRef]
- Van Dyk, S. D., Li, W., & Filippenko, A. V. 2003, PASP, 115, 1 [NASA ADS] [CrossRef]
- Vettolani, G., & Zamorani, G. 1977, MNRAS, 178, 693 [NASA ADS]
- Wang, L., Hoeflich, P., & Wheeler, J. C. 1997, ApJ, 483, L29 [NASA ADS] [CrossRef]
- Woosley, S. E., & Weaver, T. A. 1986, ARA&A, 24, 205 [NASA ADS] [CrossRef]
Footnotes
- ...(Barbon et al. 1999)
![[*]](/icons/foot_motif.png)
- http://web.oapd.inaf.it/supern/cat
- ...
HyperLeda
- http://leda.univ-lyon1.fr
All Tables
Table 1: Parameters of the scale length vs. luminosity relation (Eq. (4)).
Table 2: Distribution of SN types and host galaxy morphological types.
Table 3: Maximum likelihood fits of an exponential surface density profile to the radial distribution of CCSNe.
Table 4: Kolmogorov-Smirnov tests of the consistency of different CCSN distributions with two exponential disk models.
Table 5: Kolmogorov-Smirnov tests of the consistency of the radial distributions of CCSNe among different pairs of subsamples.
All Figures
|
|
Figure 1:
Location of the SN within its host galaxy. The
center of the galaxy is at the origin of coordinate systems
and the star symbol is the projected location of the SN.
|
| Open with DEXTER | |
| In the text | |
|
|
Figure 2: Comparison of h / R25 and R25, where the scale length h is computed according to Eq. (4) and Table 1. Red filled circles and blue crosses respectively show the early-type (Sa-Sbc) and late-type (Sc-Sd) galaxies. The solid line is a best fit to the full sample of CCSNe. |
| Open with DEXTER | |
| In the text | |
|
|
Figure 3: Distribution of central disk surface brightness obtained from Eqs. (3) ( open bars) and (6) ( filled bars), using our statistical measurement of disk scale length. |
| Open with DEXTER | |
| In the text | |
|
|
Figure 4: Distribution of deprojected isophotal-normalized radial distances for SNe of types Ib/c ( open bars) and II ( filled bars). |
| Open with DEXTER | |
| In the text | |
|
|
Figure 5: Deprojected isophotal-normalized SN-to-host distances vs. radial velocity of host galaxy (as a proxy for distance). SNe Ib/c and SNe II are shown as green filled circles and red plus signs, respectively. |
| Open with DEXTER | |
| In the text | |
|
|
Figure 6:
Top: surface density profiles (with arbitrary normalization)
of all CCSNe, with host galaxy isophotal
radius normalization ( left), and with disk scale length normalization
( right).
The thick solid line shows the maximum likelihood exponential surface
density profile of CCSNe.
The thin solid line represents the stellar
exponential disk of the host galaxies.
Bottom: same as top panels, for SNe Ib/c
( green open circles) and SNe II ( red filled circles).
The thick lines indicate the maximum likelihood
exponential surface density profiles for the SNe Ib/c ( green dashed) and SNe II
( red solid).
The error bars assume a Poisson distribution
(with |
| Open with DEXTER | |
| In the text | |
Copyright ESO 2009
Current usage metrics show cumulative count of Article Views (full-text article views including HTML views, PDF and ePub downloads, according to the available data) and Abstracts Views on Vision4Press platform.
Data correspond to usage on the plateform after 2015. The current usage metrics is available 48-96 hours after online publication and is updated daily on week days.
Initial download of the metrics may take a while.