| Issue |
A&A
Volume 508, Number 2, December III 2009
|
|
|---|---|---|
| Page(s) | 869 - 876 | |
| Section | Stellar structure and evolution | |
| DOI | https://doi.org/10.1051/0004-6361/200912699 | |
| Published online | 04 November 2009 | |
A&A 508, 869-876 (2009)
Impact of helium diffusion and helium-flash-induced carbon production on gravity-mode pulsations in subdwarf B stars
Haili Hu1,2 - G. Nelemans1 - C. Aerts1,2 - M.-A. Dupret3
1 - Department of Astrophysics, IMAPP, Radboud University Nijmegen, PO Box 9010, 6500 GL Nijmegen, The Netherlands
2 -
Instituut voor Sterrenkunde, K.U.Leuven, Celestijnenlaan 200D, 3001 Leuven, Belgium
3 -
Institute d'Astrophysique et Géophysique, université de Liège, Belgium
Received 15 June 2009 / Accepted 1 October 2009
Abstract
Context. Realistic stellar models are essential to the
forward modelling approach in asteroseismology. For practicality
however, certain model assumptions are also required. For example, in
the case of subdwarf B stars, one usually starts with zero-age
horizontal branch structures without following the progenitor
evolution.
Aims. We analyse the effects of common assumptions in subdwarf B models on the g-mode
pulsational properties. We investigate if and how the pulsation periods
are affected by the H-profile in the core-envelope transition zone.
Furthermore, the effects of C-production and convective mixing during
the core helium flash are evaluated. Finally, we reanalyse the effects
of stellar opacities on the mode excitation in subdwarf B stars.
Methods. We computed detailed stellar evolutionary models of
subdwarf B stars, and their non-adiabatic pulsational properties.
Atomic diffusion of H and He is included consistently during the
evolution calculations. The number fractions of Fe and Ni are gradually
increased by up to a factor of 10 around
![]() .
This is necessary for mode excitation and to approximate the resulting
effects of radiative levitation. We performed a pulsational stability
analysis on a grid of subdwarf B models constructed with OPAL and OP
opacities.
.
This is necessary for mode excitation and to approximate the resulting
effects of radiative levitation. We performed a pulsational stability
analysis on a grid of subdwarf B models constructed with OPAL and OP
opacities.
Results. We find that helium settling causes a shift in the theoretical blue edge of the g-mode
instability domain to higher effective temperatures. This results in a
closer match to the observed instability strip of long-period sdB
pulsators, particularly for ![]() modes. We show further that the g-mode
spectrum is extremely sensitive to the H-profile in the core-envelope
transition zone. If atomic diffusion is efficient, details of the
initial shape of the profile become less important in the course of
evolution. Diffusion broadens the chemical gradients, and results in
less effective mode trapping and different pulsation periods.
Furthermore, we report on the possible consequences of the He-flash for
the g-modes. The outer edge of a flash-induced convective
region introduces an additional chemical transition in the stellar
models, and the corresponding spike in the Brünt-Väisälä frequency
produces a complicated mode trapping signature in the period spacings.
modes. We show further that the g-mode
spectrum is extremely sensitive to the H-profile in the core-envelope
transition zone. If atomic diffusion is efficient, details of the
initial shape of the profile become less important in the course of
evolution. Diffusion broadens the chemical gradients, and results in
less effective mode trapping and different pulsation periods.
Furthermore, we report on the possible consequences of the He-flash for
the g-modes. The outer edge of a flash-induced convective
region introduces an additional chemical transition in the stellar
models, and the corresponding spike in the Brünt-Väisälä frequency
produces a complicated mode trapping signature in the period spacings.
Key words: subdwarfs - stars: evolution - stars: oscillations - methods: numerical
1 Introduction
Hot B-type subdwarfs are identified as core He-burning stars surrounded by a very thin H-envelope (Heber 1986). This places them at the blue extension of the horizontal branch in the Hertzsprung-Russell diagram. Hence, they are also referred to as extreme horizontal branch (EHB) stars. Subdwarf B (sdB) stars are ubiquitous in our Galaxy, where they dominate the population of faint blue objects at high galactic latitudes (Green et al. 1986). They are also believed to be responsible for the ultraviolet excess or ``UV upturn'' in giant elliptical galaxies (Yi et al. 1997; Brown et al. 1997). A thorough review of hot subdwarfs is given by Heber (2009).
The future evolution of sdB stars is straightforward and undisputed. After He in the core is exhausted, a short phase of He-shell burning follows, and the star may be identified as a hotter subdwarf of O-type (sdO). The H-envelope is too thin to sustain H-shell burning, so the star will end as a C-O white dwarf without evolving through the asymptotic giant branch phase. The formation of sdBs on the other hand, remains a much debated topic. Many formation channels have been proposed such as enhanced mass loss on the RGB (D'Cruz et al. 1996), mass loss through binary interaction (Mengel et al. 1976), and the mergers of two He white dwarfs (Webbink 1984). The relative importance of different formation scenarios has been evaluated by binary population synthesis studies (Han et al. 2002,2003). While these studies are valuable, it should not be forgotten that they are dependent on parametric descriptions of binary interaction. Detailed mass determinations of subdwarf B stars could provide important constraints on the binary interaction mechanism. Accurate astrophysical mass determinations are only possible in special circumstances such as in eclipsing binary systems. Asteroseismology provides an alternative method, since it allows a detailed study of the interior of non-radially pulsating stars. The consistency of both approaches has been achieved for PG 1336-018 (see Vuckovic et al. 2007; Hu et al. 2007; Charpinet et al. 2008).
Subdwarf B stars exhibit a variety of pulsations. The first sdB pulsator, EC 14026-2647, was observed by Kilkenny et al. (1997)
to pulsate in multiple short-period modes. This prototype represents
the variable class V361 Hya stars which now includes 42
rapid sdB pulsators, with periods in the range 80-600 s. The
short-period modes have been interpreted as low radial order, low
spherical degree p-modes (Charpinet et al. 1997).
The V361 Hya stars are amongst the hottest sdB stars
with effective temperatures between 28 000 K and
35 000 K and surface gravities
![]() .
At the cooler end of the EHB, 31 sdB pulsators with periods between 30 min and two hours have been discovered by Green et al. (2003).
This variable class is named V1093 Her but is also often referred to as
PG 1716+426 stars after the class prototype. The long
periods suggest that these stars pulsate in high radial order g-modes. Especially interesting are the sdB pulsators that exhibit both p- and g-mode
pulsations. Three of these so-called hybrid pulsators have been found
at the intersection of the V361 Hya and
V1093 Her stars (Lutz et al. 2008; Schuh et al. 2006; Baran et al. 2005; Oreiro et al. 2005).
.
At the cooler end of the EHB, 31 sdB pulsators with periods between 30 min and two hours have been discovered by Green et al. (2003).
This variable class is named V1093 Her but is also often referred to as
PG 1716+426 stars after the class prototype. The long
periods suggest that these stars pulsate in high radial order g-modes. Especially interesting are the sdB pulsators that exhibit both p- and g-mode
pulsations. Three of these so-called hybrid pulsators have been found
at the intersection of the V361 Hya and
V1093 Her stars (Lutz et al. 2008; Schuh et al. 2006; Baran et al. 2005; Oreiro et al. 2005).
The opacity mechanism operating in the Fe opacity bump around
![]() has been successfully used to explain the excitation of p- as well as the g-modes (Fontaine et al. 2003; Charpinet et al. 1996).
This opacity bump is caused by Fe accumulation owing to the competing
diffusion processes of gravitational settling and radiative levitation.
While seismic mass determinations have been achieved for a dozen
V361 Hya stars using static envelope models (see Fontaine et al. 2008,
and references therein), this is not yet the case for
V1093 Her stars. The reason is twofold. First of all,
the g-modes have lower amplitudes and longer pulsation periods
and thus require higher precision observations and longer observing
runs to detect the frequencies. Secondly, envelope models may suffice
to describe the V361 Hya stars' shallow p-modes that probe only the outer layers. However, they are not suitable for modelling g-modes
that penetrate to deeper stellar regions. Stellar models with detailed
information about the He-rich core are required to predict reliable g-mode periods.
has been successfully used to explain the excitation of p- as well as the g-modes (Fontaine et al. 2003; Charpinet et al. 1996).
This opacity bump is caused by Fe accumulation owing to the competing
diffusion processes of gravitational settling and radiative levitation.
While seismic mass determinations have been achieved for a dozen
V361 Hya stars using static envelope models (see Fontaine et al. 2008,
and references therein), this is not yet the case for
V1093 Her stars. The reason is twofold. First of all,
the g-modes have lower amplitudes and longer pulsation periods
and thus require higher precision observations and longer observing
runs to detect the frequencies. Secondly, envelope models may suffice
to describe the V361 Hya stars' shallow p-modes that probe only the outer layers. However, they are not suitable for modelling g-modes
that penetrate to deeper stellar regions. Stellar models with detailed
information about the He-rich core are required to predict reliable g-mode periods.
Another problem for the V1093 Her stars is the discrepancy between the
observed and theoretically predicted instability strip. The first
theoretical models that show unstable g-mode pulsations (Fontaine et al. 2003) have much lower effective temperatures than observed with a discrepancy of ![]() 5000 K. Jeffery & Saio (2006b) managed to place the blue edge of the instability strip within
5000 K. Jeffery & Saio (2006b) managed to place the blue edge of the instability strip within ![]() 1000 K of the observed blue edge. They did this by using OP opacities (Badnell et al. 2005) rather than OPAL opacities (Iglesias & Rogers 1996),
and by enhancing the Ni abundance in the envelope in addition to Fe.
Thus, their work suggests that sophisticated models including
up-to-date opacities and diffusion of other Fe-group elements are
required to address the instability issue properly.
1000 K of the observed blue edge. They did this by using OP opacities (Badnell et al. 2005) rather than OPAL opacities (Iglesias & Rogers 1996),
and by enhancing the Ni abundance in the envelope in addition to Fe.
Thus, their work suggests that sophisticated models including
up-to-date opacities and diffusion of other Fe-group elements are
required to address the instability issue properly.
An exploratory study of how the pulsational properties of sdB stars are related to their internal structure has been carried out by Charpinet et al. (2000). They showed that the He-H transition zone between the He-rich core and H-rich envelope is responsible for trapping and confining g-modes in sdB stars. This is similar to the well-known mode trapping phenomenon in compositionally stratified white dwarfs (Winget et al. 1981). Mode trapping results in deviations from the asymptotic constant period spacing, making the g-modes sensitive to the mass of the H-envelope. Furthermore, the C-O/He-transition region between the convective and the radiative part of the core will also influence the g-mode period distribution. This may be a new interesting way to follow the He-core evolution, which would also have implications in a broader context for horizontal branch stars.
Here, we shall explore the sensitivity of the g-modes
to certain assumptions about the He-flash. This energetic event
characterizes the start of He-ignition in degenerate cores of low-mass
stars (<2
![]() ).
Most stellar evolution codes encounter numerical difficulties in
calculating this phase, and even in successful cases uncertainties
remain because of the approximative treatment of convection.
Three-dimensional hydrodynamic calculations are necessary to
investigate this enigmatic phase of stellar evolution (e.g., Deupree 1996; Mocak et al. 2008; Dearborn et al. 2006),
but these are expensive in computing time. When many models are needed,
as in forward modelling, it is more practical to construct post-flash
models without following the previous evolution in detail. One should
then use the outcome of detailed studies to ensure that the stellar
models are as realistic as possible. Most simulations indicate that the
initial flash starts off-centre, followed by several mini-flashes
moving towards the centre. While it is generally found that most of the
inner region will be convectively mixed, there are uncertainties in the
outer extent of the convective region and the amount of He-burning
during the He-flash varying from 3% to 7% in mass fraction (Serenelli & Weiss 2005; Piersanti et al. 2004).
The edge of the He-flash-induced convective region will leave a
chemical composition gradient, which we believe can produce additional
mode trapping features.
).
Most stellar evolution codes encounter numerical difficulties in
calculating this phase, and even in successful cases uncertainties
remain because of the approximative treatment of convection.
Three-dimensional hydrodynamic calculations are necessary to
investigate this enigmatic phase of stellar evolution (e.g., Deupree 1996; Mocak et al. 2008; Dearborn et al. 2006),
but these are expensive in computing time. When many models are needed,
as in forward modelling, it is more practical to construct post-flash
models without following the previous evolution in detail. One should
then use the outcome of detailed studies to ensure that the stellar
models are as realistic as possible. Most simulations indicate that the
initial flash starts off-centre, followed by several mini-flashes
moving towards the centre. While it is generally found that most of the
inner region will be convectively mixed, there are uncertainties in the
outer extent of the convective region and the amount of He-burning
during the He-flash varying from 3% to 7% in mass fraction (Serenelli & Weiss 2005; Piersanti et al. 2004).
The edge of the He-flash-induced convective region will leave a
chemical composition gradient, which we believe can produce additional
mode trapping features.
We start with constructing zero age extreme horizontal branch (ZAEHB) models in Sect. 2. We make an analytical fit to the H-profile in the core-envelope transition region and examine its influence on the g-mode periods (Sect. 2.2). The effects of uncertainties in the He-flash treatment, i.e. convective mixing and C-production, are explored in Sect. 2.3. In Sect. 3, we perform a stability analysis on a grid of evolutionary sdB structures during the core He-burning phase. We show the impact of the opacities and H/He-diffusion on the instability strip. The conclusions are summarized in Sect. 4.
![\begin{figure}
\par\includegraphics[width=8.5cm,clip]{12699fig1.eps} \end{figure}](/articles/aa/full_html/2009/47/aa12699-09/img18.png)
|
Figure 1: The effect of the H-profile on mode trapping. Upper panel: the H-profile in the core-envelope transition zone. We compare the H-profile of a red giant model (thick solid line) to our polynomial Eq. (1) (blue dashed line) and to the sinusoidal Eq. (2) (thin solid line). The three lower panels give the period spacing between modes of increasing radial order n as a function of the pulsation period for the modes of spherical degree l=1,2,3. We indicated with the horizontal dotted lines the asymptotic constant period spacing. |
| Open with DEXTER | |
2 Zero age extreme horizontal branch models
2.1 Approach
The stellar models were calculated using the stellar evolution code STARS (Pols et al. 1995; Eggleton 1971; Han et al. 1994). The details of the input physics used in this work are described in Hu et al. (2009). By default, we constructed the stellar models with OPAL opacities (except in Sect. 3.3). The pulsational properties were calculated with the adiabatic oscillation code OSC (Scuflaire et al. 2008) in combination with the non-adiabatic code MAD by Dupret (2001).
Our procedure of constructing ZAEHB models is as follows. First, we
take the stellar structure model of a higher mass (2.25 ![]() )
model that just ignited helium non-degenerately. We then impose an artificial mass loss (10-6 M* yr-1)
until the remaining mass is of our choice. Finally, we allow the star
to evolve, while slowly changing the chemical abundances to the values
we wish (see Sect. 2.2), and
after switching off composition changes produced by nuclear reactions
and convective mixing. We ensure that the new ZAEHB model is fully
converged by checking the increase in the timestep that the evolution
code gives for converged models.
)
model that just ignited helium non-degenerately. We then impose an artificial mass loss (10-6 M* yr-1)
until the remaining mass is of our choice. Finally, we allow the star
to evolve, while slowly changing the chemical abundances to the values
we wish (see Sect. 2.2), and
after switching off composition changes produced by nuclear reactions
and convective mixing. We ensure that the new ZAEHB model is fully
converged by checking the increase in the timestep that the evolution
code gives for converged models.
2.2 The He-H chemical transition profile
Commonly, one constructs ZA(E)HB models without following the previous evolution. However, special care must be taken when reconstructing the stellar chemical abundances. In particular, the shape of the H-profile in the core-envelope transition zone is very important to g-modes because of the associated mode trapping. Therefore, we first evolved a 1.00We found that the values M1=0.46575
We compared our approximation to a sinusoidal profile as proposed by Sweigart & Gross (1976) and used in the ZAHB models of Jeffery & Saio (2006a). The H abundance in the transition zone according their approximation is given by:
![\begin{displaymath}
X (M_{\rm r}) = 0.5X_{\rm surf}\Big[1-\cos \Big(\pi\frac{M_{...
...-M_1}\Big) \Big] ~~~~\textrm{for }M_1\leq M_{\rm r} \leq M_2.
\end{displaymath}](/articles/aa/full_html/2009/47/aa12699-09/img27.png)
In the top panel of Fig. 1, we show both approximations, and find that our fit provides a more accurate representation of the red giant's H-profile.
We constructed three ZAEHB models of total mass 0.470 ![]() ,
i.e., with a H-rich envelope of
,
i.e., with a H-rich envelope of
![]()
![]() above the He-H transition zone. In model (i), the abundances were taken
from the red giant model throughout the star. In models (ii) and (iii),
the H-profile is given by our suggested Eq. (1) and by the sinusoidal Eq. (2), respectively. In the latter two cases, we simply assume that Z=0.02 and there is a Grevesse & Noels (1993)
metal mixture throughout the star. In model (i), there are minor
effects on the metallicity because of CNO cycling, atomic diffusion,
and convective mixing in the previous evolution. We note that we have
not yet accounted for flash-induced C-production or mixing. This is to
ensure that our comparison is meaningful here. The effects of the
He-flash will be evaluated separately in Sect. 3.
above the He-H transition zone. In model (i), the abundances were taken
from the red giant model throughout the star. In models (ii) and (iii),
the H-profile is given by our suggested Eq. (1) and by the sinusoidal Eq. (2), respectively. In the latter two cases, we simply assume that Z=0.02 and there is a Grevesse & Noels (1993)
metal mixture throughout the star. In model (i), there are minor
effects on the metallicity because of CNO cycling, atomic diffusion,
and convective mixing in the previous evolution. We note that we have
not yet accounted for flash-induced C-production or mixing. This is to
ensure that our comparison is meaningful here. The effects of the
He-flash will be evaluated separately in Sect. 3.
It is well known that in the asymptotic limit the g-mode periods are equally spaced in the radial order n (Tassoul 1980).
However, sharp features in the Brünt-Väisälä frequency cause mode
trapping, which manifests itself in deviations from the uniform period
spacing. For an in-depth treatment of mode trapping in white dwarfs,
sdB stars, and main-sequence stars, we refer the interested reader to
e.g., Brassard et al. (1992), Charpinet et al. (2000), and Miglio et al. (2008), respectively. Here, it is important to realize that the period spacing between two consecutive modes in radial order (
![]() )
can be described by an oscillatory component superposed on the asymptotic constant period spacing. The periodicity
)
can be described by an oscillatory component superposed on the asymptotic constant period spacing. The periodicity ![]() of the oscillatory component is related to the location of the chemical gradient, while its amplitude is determined by the steepness of the gradient. Trapped modes are then located at the minima in the
of the oscillatory component is related to the location of the chemical gradient, while its amplitude is determined by the steepness of the gradient. Trapped modes are then located at the minima in the ![]() versus P diagram. From the asymptotic theory (Tassoul 1980), one can derive the approximative relations
versus P diagram. From the asymptotic theory (Tassoul 1980), one can derive the approximative relations
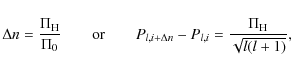
where
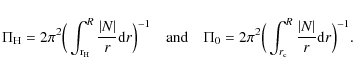
The Brünt-Väisälä (BV) frequency N is given by
The integration boundary
Figure 1 shows the sensitivity of the g-modes to the exact shape of the H-profile. We plotted the period spacing ![]() against the pulsation period P, for the modes l=1,2,3. We see that our polynomial fit to the H-profile reproduces the g-mode
spectrum of model (i) very well. In contrast, the sinusoidal H-profile
leads to a significantly different mode trapping signature. The
deviations become more distinct at higher spherical degree l and higher radial order n. Another interesting feature can be seen especially for l=3 in the
against the pulsation period P, for the modes l=1,2,3. We see that our polynomial fit to the H-profile reproduces the g-mode
spectrum of model (i) very well. In contrast, the sinusoidal H-profile
leads to a significantly different mode trapping signature. The
deviations become more distinct at higher spherical degree l and higher radial order n. Another interesting feature can be seen especially for l=3 in the ![]() versus P diagrams, where there are two oscillatory components in the period spacing. We see a short periodicity in the radial order of
versus P diagrams, where there are two oscillatory components in the period spacing. We see a short periodicity in the radial order of
![]() ,
modulated by a long periodicity of
,
modulated by a long periodicity of
![]() .
This is at first instance unexpected, since we only have one chemical transition zone in our ZAEHB models.
.
This is at first instance unexpected, since we only have one chemical transition zone in our ZAEHB models.
Numerical integration of Eq. (4) for our model (ii) gives
![]() ,
which accounts for the short periodicity. The long periodicity,
however, cannot be explained by the above relations. To understand this
effect, one should realize that trapping occurs for a mode if the nodes
of its eigenfunctions are suitably located with respect to the
BV-discontinuity. In other words, only modes with a certain phase with
respect to the discontinuity are trapped, which gives rise to the
periodicity of Eq. (3). In reality, the BV-discontinuity of course has a finite width, which was not accounted for in the derivation of Eq. (3). Therefore, depending on the change of phase within
the BV-discontinuity, certain modes can be trapped more efficiently
than others, leading to the second periodicity. Again from the
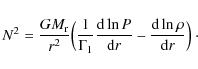
asymptotic theory of Tassoul (1980), but now taking into account the finite width of the BV-spike, it can be shown that approximately (Hu et al., in preparation),
,
which accounts for the short periodicity. The long periodicity,
however, cannot be explained by the above relations. To understand this
effect, one should realize that trapping occurs for a mode if the nodes
of its eigenfunctions are suitably located with respect to the
BV-discontinuity. In other words, only modes with a certain phase with
respect to the discontinuity are trapped, which gives rise to the
periodicity of Eq. (3). In reality, the BV-discontinuity of course has a finite width, which was not accounted for in the derivation of Eq. (3). Therefore, depending on the change of phase within
the BV-discontinuity, certain modes can be trapped more efficiently
than others, leading to the second periodicity. Again from the
asymptotic theory of Tassoul (1980), but now taking into account the finite width of the BV-spike, it can be shown that approximately (Hu et al., in preparation),
where r1 is the radius at the inner boundary of the BV-spike and r2 is at the outer boundary. Numerical integration of Eq. (5) for our model (ii) indeed results in
To clarify this, it is helpful to examine the displacement eigenfunctions,
![]() (radial) and
(radial) and
![]() (horizontal). We find that a mode is trapped when it has a node in
(horizontal). We find that a mode is trapped when it has a node in
![]() at the bottom of the He-H transition zone directly followed by a node in
at the bottom of the He-H transition zone directly followed by a node in
![]() .
This is consistent with the findings of Brassard et al. (1992) for white dwarfs.
In Fig. 2, we plot for model (ii) the displacements for three trapped modes of radial order n=36, n=45, and
.
This is consistent with the findings of Brassard et al. (1992) for white dwarfs.
In Fig. 2, we plot for model (ii) the displacements for three trapped modes of radial order n=36, n=45, and
![]() .
These have a small, large, and again small amplitude in
.
These have a small, large, and again small amplitude in ![]() ,
respectively (see Fig. 1). We see that mode n=36 also has a node in
,
respectively (see Fig. 1). We see that mode n=36 also has a node in
![]() at the top of the transition zone, while mode n=45 has a node there in
at the top of the transition zone, while mode n=45 has a node there in
![]() .
We find this to be generally true and conclude that modes are more
efficiently trapped when the first node encountered in the He-H
transition zone corresponds to
.
We find this to be generally true and conclude that modes are more
efficiently trapped when the first node encountered in the He-H
transition zone corresponds to
![]() and the last node to
and the last node to
![]() .
After
.
After
![]() modes, the nodes are again suitably placed. This can be seen by comparing n=36 and n=64: the location of the nodes of
modes, the nodes are again suitably placed. This can be seen by comparing n=36 and n=64: the location of the nodes of
![]() with respect to the boundaries is approximately the same, while for n=64,
there is one additional node in-between. The interpretation of this
interesting phenomenon will the subject of a forthcoming paper (Hu et
al., in preparation).
with respect to the boundaries is approximately the same, while for n=64,
there is one additional node in-between. The interpretation of this
interesting phenomenon will the subject of a forthcoming paper (Hu et
al., in preparation).
![\begin{figure}
\par\includegraphics[width=8.5cm,clip]{12699fig2.eps} \vspace*{-3mm}
\end{figure}](/articles/aa/full_html/2009/47/aa12699-09/img44.png)
|
Figure 2:
Normalized displacement eigenfunctions
|
| Open with DEXTER | |
![\begin{figure}
\par\includegraphics[width=16.5cm,clip]{12699fig3.eps} \end{figure}](/articles/aa/full_html/2009/47/aa12699-09/img46.png)
|
Figure 3:
Effects of different assumptions about the He-flash on the g-mode spectrum of ZAEHB models. Left: the BV-frequency throughout the star in terms of the temperature. The dashed curves are shifted upwards with |
| Open with DEXTER | |
2.3 The helium core flash
In previous models we did not account for the inner core abundances
being in reality affected by nuclear burning and convective mixing
during the He-flash. From now on, we treat the He-flash in a
``standard'' way by converting 5% of the He-mass fraction into C and
assume that the He-flash-induced convection region extends to 90% of
the He-rich core (i.e.,
![]()
![]() )
as suggested by 3D hydrodynamical simulations of Dearborn et al. (2006).
To test the influence of nuclear burning and convective mixing during
the He-flash, we also constructed post-flash ZAEHB models where i) C is
increased by 3% and 7%, respectively, and ii) the core is convectively
mixed with up to 97% (0.45
)
as suggested by 3D hydrodynamical simulations of Dearborn et al. (2006).
To test the influence of nuclear burning and convective mixing during
the He-flash, we also constructed post-flash ZAEHB models where i) C is
increased by 3% and 7%, respectively, and ii) the core is convectively
mixed with up to 97% (0.45 ![]() )
and 100% (0.46575
)
and 100% (0.46575 ![]() )
of the core, respectively.
)
of the core, respectively.
Figure 3 shows the effects of the different assumptions about the He-flash on the g-mode spectrum. The upper panels indicate that increasing C in the entire He-core does not have a significant effect. There is only a minor shift to higher pulsation periods because of a slight increase in the stellar radius, but the g-mode spectrum remains qualitatively the same. However, if the He-flash-induced C-production is not mixed throughout the entire core, there is an additional chemical gradient, and thus an additional spike in the BV-frequency. This results in a complicated mode trapping pattern in the period spacings, that depends on the location of this spike, as shown in the middle panels of Fig. 3. In the lower panels, one can see that the strength of the BV-spike, and thus the effect of mode trapping, is sensitive to the amount of C produced during the He-flash.
We emphasize that the ZAEHB models do not yet have a C-O
convective core, and thus the He-H transition and the edge of the
He-flash-induced convective region are mainly responsible for mode
trapping in these models. The thin He-convection zone near the surface,
which is visible in Fig. 3 as negative N2 around
![]() ,
has only a very small effect on the g-modes.
,
has only a very small effect on the g-modes.
3 Evolutionary extreme horizontal branch models
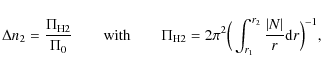
3.1 Approach
During the EHB evolution, Fe accumulates in the driving region (aroundWe increased the enhancement factor f during the EHB evolution from 1 to 10 with a Gaussian centred around
![]() .
Already after 107 yr, we have
.
Already after 107 yr, we have
![]() (see Fig. 1 of Hu et al. 2008). The opacity is then calculated by interpolating between the opacity tables for different f.
We note that Fe/Ni-accumulation is only accounted for in the opacities.
This is reasonable since the mass fractions of Fe and Ni are low even
after enhancement, and these elements are not involved in nuclear
reactions. Thus, the only relevant effect of the enhancement is in the
stellar opacities.
We follow the approach by Hu et al. (2008), but with two noteworthy differences taking into account the work of Jeffery & Saio (2006b).
First of all, as we have already mentioned, Ni is enhanced in addition
to Fe. Secondly, the mass fractions of the non-enhanced metals remain
constant resulting in a slight increase in the total metallicity,
whereas in our previous work, the other metals were reduced to keep the
total metallicity constant.
(see Fig. 1 of Hu et al. 2008). The opacity is then calculated by interpolating between the opacity tables for different f.
We note that Fe/Ni-accumulation is only accounted for in the opacities.
This is reasonable since the mass fractions of Fe and Ni are low even
after enhancement, and these elements are not involved in nuclear
reactions. Thus, the only relevant effect of the enhancement is in the
stellar opacities.
We follow the approach by Hu et al. (2008), but with two noteworthy differences taking into account the work of Jeffery & Saio (2006b).
First of all, as we have already mentioned, Ni is enhanced in addition
to Fe. Secondly, the mass fractions of the non-enhanced metals remain
constant resulting in a slight increase in the total metallicity,
whereas in our previous work, the other metals were reduced to keep the
total metallicity constant.
| Figure 4:
Comparison of sdB models with (dashed line) and without (solid line) atomic diffusion at an EHB age of
|
|
| Open with DEXTER | |
3.2 Atomic diffusion
Our models include H/He-diffusion as described in Hu et al. (2009).
In the presence of diffusion, steep composition gradients are broadened
leading to less efficient mode trapping. This can be seen in Fig. 4, where we show the same ZAEHB model evolved with and without atomic diffusion. Both models have an EHB age of
![]() years. As expected, the amplitude of the oscillatory component in the
period spacing is much smaller in the case of diffusion. Because of the
lower amplitude, the effect of
years. As expected, the amplitude of the oscillatory component in the
period spacing is much smaller in the case of diffusion. Because of the
lower amplitude, the effect of
![]() (
(![]() 30
in this case) is less significant, although still visible. The mode
trapping pattern is at this stage even more complicated, because the
sdB star has developed a convective core, which leads to another
BV-discontinuity (see left panel of Fig. 4).
30
in this case) is less significant, although still visible. The mode
trapping pattern is at this stage even more complicated, because the
sdB star has developed a convective core, which leads to another
BV-discontinuity (see left panel of Fig. 4).
In Sect. 2.2, we detected the extreme sensitivity of the g-mode spectrum to the shape of the H-profile. This shows that special care must be taken when modelling the He-H transition. However, as atomic diffusion tends to wash away the differences in the initial chemical profiles, the significance of modelling the H-profile very precisely becomes less for evolved models.
Another interesting effect of He-settling is the disappearance of the
He-convection zone, as can be seen in the left panel of Fig. 4. The negative N2 around
![]() corresponds to the Fe surface convection zone. We note that the Fe
convection zone was not present in our ZAEHB models, since our models
accumulate Fe during the evolution. It is not expected that the surface convection zones have a significant effect on the g-mode periods because of the small contributions of the surface layers to the weight function (see Fig. 9 of Charpinet et al. 2000).
corresponds to the Fe surface convection zone. We note that the Fe
convection zone was not present in our ZAEHB models, since our models
accumulate Fe during the evolution. It is not expected that the surface convection zones have a significant effect on the g-mode periods because of the small contributions of the surface layers to the weight function (see Fig. 9 of Charpinet et al. 2000).
![\begin{figure}
\par\includegraphics[width=9cm,clip]{12699fig5.eps} \end{figure}](/articles/aa/full_html/2009/47/aa12699-09/img52.png)
|
Figure 5:
Evolutionary tracks of our sdB models in the
|
| Open with DEXTER | |
3.3 Stability analysis of a grid of sdB models
The previous models all have a mass of 0.470 ![]() .
For a stability analysis, we constructed models of varying mass so that the observed V1093 Her
.
For a stability analysis, we constructed models of varying mass so that the observed V1093 Her
![]() region is mapped. We computed sdB models with a fixed core mass defined as before at 0.46575
region is mapped. We computed sdB models with a fixed core mass defined as before at 0.46575 ![]() ,
and envelope masses:
,
and envelope masses:
![]() ,
,
![]() ,
,
![]() ,
,
![]() ,
,
![]() ,
,
![]() ,
and
,
and
![]()
![]() .
To make the models as realistic as possible, we took the abundances
from the red giant model at the tip of the RGB. The inner 0.42
.
To make the models as realistic as possible, we took the abundances
from the red giant model at the tip of the RGB. The inner 0.42 ![]() of the core is assumed to be mixed during the He-flash and C production is taken to be 5%.
of the core is assumed to be mixed during the He-flash and C production is taken to be 5%.
![\begin{figure}
\par\includegraphics[angle=-90,width=17.5cm,clip]{12699fig6.eps} \end{figure}](/articles/aa/full_html/2009/47/aa12699-09/img60.png)
|
Figure 6:
Pulsation periods of stable (green |
| Open with DEXTER | |
Figure 5 shows the evolutionary tracks computed with OP opacities in the
![]() diagram. The tracks for OPAL overlap with these, thus the differences
between OP and OPAL opacities have a negligible effect on the global
evolution.
The structure models for which we calculated non-adiabatic pulsational
properties, are represented by circles. The time interval between the
pulsation models is 107 years.
diagram. The tracks for OPAL overlap with these, thus the differences
between OP and OPAL opacities have a negligible effect on the global
evolution.
The structure models for which we calculated non-adiabatic pulsational
properties, are represented by circles. The time interval between the
pulsation models is 107 years.
Figure 6 shows the
instability strip of our models obtained using OPAL opacities (upper
panels) and OP opacities (middle panels). In agreement with previous
studies (Jeffery & Saio 2006b; Miglio et al. 2007),
we find that with OP opacities, unstable modes are found in hotter
stars than with OPAL opacities. This is related to differences in the
strength and location of the Fe-group opacity bump as a function of the
temperature. For OP opacities, this bump is slightly larger and occurs
at higher temperatures (see Seaton & Badnell 2004). The thermal relaxation time (
![]() )
in the driving region, i.e., around the opacity bump, is then large enough for efficient driving of the g-modes. This is because, first of all, the opacity driving mechanism works most efficiently on modes with periods comparable to
)
in the driving region, i.e., around the opacity bump, is then large enough for efficient driving of the g-modes. This is because, first of all, the opacity driving mechanism works most efficiently on modes with periods comparable to
![]() .
Secondly, only high-order g-modes (with long periods) can be excited, for low-order g-modes are affected by significant radiative damping. The same phenomenon occurs in SPB stars (Dupret et al. 2008; Dziembowski et al. 1993).
.
Secondly, only high-order g-modes (with long periods) can be excited, for low-order g-modes are affected by significant radiative damping. The same phenomenon occurs in SPB stars (Dupret et al. 2008; Dziembowski et al. 1993).
Interestingly, the blue edge of the ![]() instability strip of our sdB models with OP opacities corresponds to the observed blue edge of the V1093 Her variables at
instability strip of our sdB models with OP opacities corresponds to the observed blue edge of the V1093 Her variables at
![]() .
Thus, we have identified that atomic diffusion represents another step
towards solving the ``blue edge problem'', in addition to the use of OP
opacities and Fe/Ni enhancement suggested by Jeffery & Saio (2006a,b).
The closer match between the theoretical and observational instability
strips is caused by the settling of He and the outward diffusion of H.
As a result, the envelope's mass density decreases and the opacity bump
at
.
Thus, we have identified that atomic diffusion represents another step
towards solving the ``blue edge problem'', in addition to the use of OP
opacities and Fe/Ni enhancement suggested by Jeffery & Saio (2006a,b).
The closer match between the theoretical and observational instability
strips is caused by the settling of He and the outward diffusion of H.
As a result, the envelope's mass density decreases and the opacity bump
at
![]() moves inwards within the star because of the relation
moves inwards within the star because of the relation
![]() .
This is towards regions that have a longer thermal relaxation time, and
as explained before, modes with longer pulsation periods can now be
efficiently driven. These are high-order g-modes for which no significant radiative damping occurs.
For a grid that was evolved without H/He-diffusion and with OP opacities (lower panels of Fig. 6), we indeed find the same blue edge as Jeffery & Saio (2006b), i.e.,
.
This is towards regions that have a longer thermal relaxation time, and
as explained before, modes with longer pulsation periods can now be
efficiently driven. These are high-order g-modes for which no significant radiative damping occurs.
For a grid that was evolved without H/He-diffusion and with OP opacities (lower panels of Fig. 6), we indeed find the same blue edge as Jeffery & Saio (2006b), i.e.,
![]() for l=3
modes. However, Ni enhancement remains an essential ingredient, as we
checked for models with only Fe enhancement (see Table 1). Observations confirm the effect of settling, because most sdB stars are He-deficient with
for l=3
modes. However, Ni enhancement remains an essential ingredient, as we
checked for models with only Fe enhancement (see Table 1). Observations confirm the effect of settling, because most sdB stars are He-deficient with
![]() (Heber & Edelmann 2004; Saffer et al. 1994).
However, the effect of He-settling is probably less efficient in
reality than in our models because of counteracting processes such as
weak stellar winds (Unglaub & Bues 2001), turbulent mixing, and radiative levitation (although the effect of radiative levitation on He is found to be small, see Michaud & Richer 2008).
(Heber & Edelmann 2004; Saffer et al. 1994).
However, the effect of He-settling is probably less efficient in
reality than in our models because of counteracting processes such as
weak stellar winds (Unglaub & Bues 2001), turbulent mixing, and radiative levitation (although the effect of radiative levitation on He is found to be small, see Michaud & Richer 2008).
Table 1:
Blue edge in terms of
![]() of the g-mode instability strip for our sdB modelsa.
of the g-mode instability strip for our sdB modelsa.
4 Conclusions
The precise details of chemical transitions in subdwarf B stars have a considerable influence on the period spacings of high order g-modes. This is a signature of mode trapping that occurs due to discontinuities in the BV-frequency. We have shown that the structure of mode trapping depends sensitively on the exact shape of the H-profile in the core-envelope transition zone. Thus, when constructing ZAEHB models without following the previous evolution, the chemical profiles must be modelled carefully. Since the action of mode trapping is so sensitive to the shape of the chemical transition, it is necessary to include atomic diffusion during the evolution, i.e., the processes of gravitational settling, temperature and concentration diffusion.Furthermore, if the sdB star started He-fusion in a run-away flash, the
inner part of the core is convectively mixed and C is produced up to ![]() 7%.
The edge of the He-flash-induced convective core is accompanied by a
chemical transition. We showed that this can cause additional mode
trapping features resulting in a complicated behaviour of the period
spacings. Multiple composition gradients lead to simultaneous mode
trapping in different regions. The g-mode
spectra become very complicated, and it will be difficult to directly
infer detailed information about the composition gradients from
observed g-modes. It is therefore crucial to evaluate the
importance of different physical processes, and to account for all of
them realistically, as we do here.
7%.
The edge of the He-flash-induced convective core is accompanied by a
chemical transition. We showed that this can cause additional mode
trapping features resulting in a complicated behaviour of the period
spacings. Multiple composition gradients lead to simultaneous mode
trapping in different regions. The g-mode
spectra become very complicated, and it will be difficult to directly
infer detailed information about the composition gradients from
observed g-modes. It is therefore crucial to evaluate the
importance of different physical processes, and to account for all of
them realistically, as we do here.
Finally, and perhaps most importantly, we report on a possible
step forward in solving the ``blue edge problem'' of the V1093 Her
instability strip. Our evolutionary sdB models with (i) OP opacities,
(ii) the inclusion of H/He diffusion, and (iii) a parametric Fe/Ni
enhancement, show unstable ![]() g-modes for effective temperatures up to 30 000 K. This is
only achieved when all three ingredients are included in the
computations. It should be noted that it remains unclear which l-values
the observed long-period pulsation modes have. Thus, although we have
demonstrated the importance of H/He diffusion, solving the blue edge
problem effectively will require mode identification, in addition to a
realistic treatment of radiative levitation and other transport
mechanisms.
g-modes for effective temperatures up to 30 000 K. This is
only achieved when all three ingredients are included in the
computations. It should be noted that it remains unclear which l-values
the observed long-period pulsation modes have. Thus, although we have
demonstrated the importance of H/He diffusion, solving the blue edge
problem effectively will require mode identification, in addition to a
realistic treatment of radiative levitation and other transport
mechanisms.
H.H. acknowledges a PhD scholarship through the ``Convenant Katholieke Universiteit Leuven, Belgium - Radboud Universiteit Nijmegen, the Netherlands''. G.N. is supported by NWO VIDI grant 639.042.813. The research leading to these results has received funding from the European Research Council under the European Community's Seventh Framework Programme (FP7/2007-2013)/ERC grant agreement No. 227224 (PROSPERITY), as well as from the Research Council of K.U. Leuven grant agreement GOA/2008/04.
References
- Badnell, N. R., Bautista, M. A., Butler, K., et al. 2005, MNRAS, 360, 458 [NASA ADS] [CrossRef]
- Baran, A., Pigulski, A., Kozie, D., et al. 2005, MNRAS, 360, 737 [NASA ADS] [CrossRef]
- Brassard, P., Fontaine, G., Wesemael, F., & Hansen, C. J. 1992, ApJS, 80, 369 [NASA ADS] [CrossRef]
- Brown, T. M., Ferguson, H. C., Davidsen, A. F., & Dorman, B. 1997, ApJ, 482, 685 [NASA ADS] [CrossRef]
- Cassisi, S., Potekhin, A. Y., Pietrinferni, A., Catelan, M., & Salaris, M. 2007, ApJ, 661, 1094 [NASA ADS] [CrossRef]
- Charpinet, S., Fontaine, G., Brassard, P., et al. 1997, ApJ, 483, L123 [NASA ADS] [CrossRef]
- Charpinet, S., Fontaine, G., Brassard, P., & Dorman, B. 1996, ApJ, 471, L103 [NASA ADS] [CrossRef]
- Charpinet, S., Fontaine, G., Brassard, P., & Dorman, B. 2000, ApJS, 131, 223 [NASA ADS] [CrossRef]
- Charpinet, S., van Grootel, V., Reese, D., et al. 2008, A&A, 489, 377 [NASA ADS] [EDP Sciences] [CrossRef]
- D'Cruz, N. L., Dorman, B., Rood, R. T., & O'Connell, R. W. 1996, ApJ, 466, 359 [NASA ADS] [CrossRef]
- Dearborn, D. S. P., Lattanzio, J. C., & Eggleton, P. P. 2006, ApJ, 639, 405 [NASA ADS] [CrossRef]
- Deupree, R. G. 1996, ApJ, 471, 377 [NASA ADS] [CrossRef]
- Dupret, M. A. 2001, A&A, 366, 166 [NASA ADS] [EDP Sciences] [CrossRef]
- Dupret, M. A., Miglio, A., Montalban, J., Grigahcène, A., & Noels, A. 2008, J. Phys. Conf. Ser., 118, 012020 [NASA ADS] [CrossRef]
- Dziembowski, W. A., Moskalik, P., & Pamyatnykh, A. A. 1993, MNRAS, 265, 588 [NASA ADS]
- Eggleton, P. P. 1971, MNRAS, 151, 351 [NASA ADS]
- Ferguson, J. W., Alexander, D. R., Allard, F., et al. 2005, ApJ, 623, 585 [NASA ADS] [CrossRef]
- Fontaine, G., Brassard, P., Charpinet, S., & Chayer, P. 2006, Mem. Soc. Astron. It., 77, 49 [NASA ADS]
- Fontaine, G., Brassard, P., Charpinet, S., et al. 2003, ApJ, 597, 518 [NASA ADS] [CrossRef]
- Fontaine, G., Brassard, P., Charpinet, S., et al. 2008, in Hot Subdwarf Stars and Related Objects, ed. U. Heber, C. S. Jeffery, & R. Napiwotzki, ASP Conf. Ser., 392, 231
- Green, E. M., Fontaine, G., Reed, M. D., et al. 2003, ApJ, 583, L31 [NASA ADS] [CrossRef]
- Green, R. F., Schmidt, M., & Liebert, J. 1986, ApJS, 61, 305 [NASA ADS] [CrossRef]
- Grevesse, N., & Noels, A. 1993, in Origin and Evolution of the Elements, ed. S. Kubono, & T. Kajino, 15
- Han, Z., Podsiadlowski, P., & Eggleton, P. P. 1994, MNRAS, 270, 121 [NASA ADS]
- Han, Z., Podsiadlowski, P., Maxted, P. F. L., & Marsh, T. R. 2003, MNRAS, 341, 669 [NASA ADS] [CrossRef]
- Han, Z., Podsiadlowski, P., Maxted, P. F. L., Marsh, T. R., & Ivanova, N. 2002, MNRAS, 336, 449 [NASA ADS] [CrossRef]
- Heber, U. 1986, A&A, 155, 33 [NASA ADS]
- Heber, U. 2009, ARA&A, 47, 211 [CrossRef]
- Heber, U., & Edelmann, H. 2004, Ap&SS, 291, 341 [NASA ADS] [CrossRef]
- Hu, H., Dupret, M.-A., Aerts, C., et al. 2008, A&A, 490, 243 [NASA ADS] [EDP Sciences] [CrossRef]
- Hu, H., Glebbeek, E., Thoul, A., et al. 2009, A&A, submitted
- Hu, H., Nelemans, G., Østensen, R., et al. 2007, A&A, 473, 569 [NASA ADS] [EDP Sciences] [CrossRef]
- Iglesias, C. A., & Rogers, F. J. 1996, ApJ, 464, 943 [NASA ADS] [CrossRef]
- Jeffery, C. S., & Saio, H. 2006a, MNRAS, 371, 659 [NASA ADS] [CrossRef]
- Jeffery, C. S., & Saio, H. 2006b, MNRAS, 372, L48 [NASA ADS]
- Kilkenny, D., Koen, C., O'Donoghue, D., & Stobie, R. S. 1997, MNRAS, 285, 640 [NASA ADS]
- Lutz, R., Schuh, S., Silvotti, R., et al. 2008, in Hot Subdwarf Stars and Related Objects, ed. U. Heber, C. S. Jeffery, & R. Napiwotzki, ASP Conf. Ser., 392, 339
- Mengel, J. G., Norris, J., & Gross, P. G. 1976, ApJ, 204, 488 [NASA ADS] [CrossRef]
- Michaud, G., & Richer, J. 2008, Mem. Soc. Astron. It., 79, 592 [NASA ADS]
- Miglio, A., Montalbán, J., & Dupret, M.-A. 2007, MNRAS, 375, L21 [NASA ADS]
- Miglio, A., Montalbán, J., Noels, A., & Eggenberger, P. 2008, MNRAS, 386, 1487 [NASA ADS] [CrossRef]
- Mocak, M., Mueller, E., Weiss, A., & Kifonidis, K. 2009, A&A, 501, 659 [NASA ADS] [EDP Sciences] [CrossRef]
- Oreiro, R., Pérez Hernández, F., Ulla, A., et al. 2005, A&A, 438, 257 [NASA ADS] [EDP Sciences] [CrossRef]
- Piersanti, L., Tornambé, A., & Castellani, V. 2004, MNRAS, 353, 243 [NASA ADS] [CrossRef]
- Pols, O. R., Tout, C. A., Eggleton, P. P., & Han, Z. 1995, MNRAS, 274, 964 [NASA ADS]
- Saffer, R. A., Bergeron, P., Koester, D., & Liebert, J. 1994, ApJ, 432, 351 [NASA ADS] [CrossRef]
- Schuh, S., Huber, J., Dreizler, S., et al. 2006, A&A, 445, L31 [NASA ADS] [EDP Sciences] [CrossRef]
- Scuflaire, R., Montalbán, J., Théado, S., et al. 2008, Ap&SS, 316, 149 [NASA ADS] [CrossRef]
- Seaton, M. J. 2005, MNRAS, 362, L1 [NASA ADS] [CrossRef]
- Seaton, M. J., & Badnell, N. R. 2004, MNRAS, 354, 457 [NASA ADS] [CrossRef]
- Serenelli, A., & Weiss, A. 2005, A&A, 442, 1041 [NASA ADS] [EDP Sciences] [CrossRef]
- Sweigart, A. V., & Gross, P. G. 1976, ApJS, 32, 367 [NASA ADS] [CrossRef]
- Tassoul, M. 1980, ApJS, 43, 469 [NASA ADS] [CrossRef]
- Unglaub, K., & Bues, I. 2001, A&A, 374, 570 [NASA ADS] [EDP Sciences] [CrossRef]
- Vuckovic, M., Aerts, C., Østensen, R., et al. 2007, A&A, 471, 605 [NASA ADS] [EDP Sciences] [CrossRef]
- Webbink, R. F. 1984, ApJ, 277, 355 [NASA ADS] [CrossRef]
- Winget, D. E., van Horn, H. M., & Hansen, C. J. 1981, ApJ, 245, L33 [NASA ADS] [CrossRef]
- Yi, S., Demarque, P., & Oemler, A. J. 1997, ApJ, 486, 201 [NASA ADS] [CrossRef]
All Tables
Table 1:
Blue edge in terms of
![]() of the g-mode instability strip for our sdB modelsa.
of the g-mode instability strip for our sdB modelsa.
All Figures
|
|
Figure 1: The effect of the H-profile on mode trapping. Upper panel: the H-profile in the core-envelope transition zone. We compare the H-profile of a red giant model (thick solid line) to our polynomial Eq. (1) (blue dashed line) and to the sinusoidal Eq. (2) (thin solid line). The three lower panels give the period spacing between modes of increasing radial order n as a function of the pulsation period for the modes of spherical degree l=1,2,3. We indicated with the horizontal dotted lines the asymptotic constant period spacing. |
| Open with DEXTER | |
| In the text | |
|
|
Figure 2:
Normalized displacement eigenfunctions
|
| Open with DEXTER | |
| In the text | |
|
|
Figure 3:
Effects of different assumptions about the He-flash on the g-mode spectrum of ZAEHB models. Left: the BV-frequency throughout the star in terms of the temperature. The dashed curves are shifted upwards with |
| Open with DEXTER | |
| In the text | |
| |
Figure 4:
Comparison of sdB models with (dashed line) and without (solid line) atomic diffusion at an EHB age of
|
| Open with DEXTER | |
| In the text | |
|
|
Figure 5:
Evolutionary tracks of our sdB models in the
|
| Open with DEXTER | |
| In the text | |
|
|
Figure 6:
Pulsation periods of stable (green |
| Open with DEXTER | |
| In the text | |
Copyright ESO 2009
Current usage metrics show cumulative count of Article Views (full-text article views including HTML views, PDF and ePub downloads, according to the available data) and Abstracts Views on Vision4Press platform.
Data correspond to usage on the plateform after 2015. The current usage metrics is available 48-96 hours after online publication and is updated daily on week days.
Initial download of the metrics may take a while.