| Issue |
A&A
Volume 508, Number 1, December II 2009
|
|
|---|---|---|
| Page(s) | 1 - 7 | |
| Section | Astrophysical processes | |
| DOI | https://doi.org/10.1051/0004-6361/200911833 | |
| Published online | 01 October 2009 | |
A&A 508, 1-7 (2009)
Nuclear interaction gamma-ray lines from the Galactic center region
V. A. Dogiel1,2 - V. Tatischeff3 - K. S. Cheng4 - D. O. Chernyshov1,2,4,5 - C. M. Ko2 - W. H. Ip2
1 - I.E. Tamm Theoretical Physics Division of P.N. Lebedev
Institute, Leninskii pr, 53, 119991 Moscow, Russia
2 -
Institute of Astronomy, National Central University, Jhongli 320, Taiwan
3 -
Centre de Spectrométrie Nucléaire et de
Spectrométrie de Masse, IN2P3-CNRS and Univ Paris-Sud, 91405
Orsay Campus, France
4 - Department of Physics, University of
Hong Kong, Pokfulam Road, Hong Kong, PR China
5 -
Moscow Institute of Physics and Technology, Institutskii lane, 141700
Moscow Region, Dolgoprudnii, Russia
Received 12 February 2009 / Accepted 1 September 2009
Abstract
Aims. The accretion of stars onto the central supermassive
black hole at the center of the Milky Way is predicted to generate
large fluxes of subrelativistic ions in the Galactic center region. We
analyze the intensity, shape, and spatial distribution of de-excitation
gamma-ray lines produced by nuclear interactions of these energetic
particles with the ambient medium.
Methods. We first estimated the amount and mean kinetic energy
of particles released from the central black hole during star
disruption. We then calculated the energy and spatial distributions of
these particles in the Galactic center region from a kinetic equation.
These particle distributions were then used to derive the
characteristics of the main nuclear interaction gamma-ray lines.
Results. Because the time period of star capture by the
supermassive black hole is expected to be shorter than the lifetime of
the ejected fast particles against Coulomb losses, the gamma-ray
emission is predicted to be stationary. We find that the nuclear
de-excitation lines should be emitted from a region with a maximum 5![]() angular radius. The total gamma-ray line flux below 8 MeV is calculated to be
angular radius. The total gamma-ray line flux below 8 MeV is calculated to be ![]() 10-4 photons cm-2 s-1. The most promising lines for detection are those at 4.44 and
10-4 photons cm-2 s-1. The most promising lines for detection are those at 4.44 and ![]() 6.2 MeV, with a predicted flux in each line of
6.2 MeV, with a predicted flux in each line of ![]() 10-5 photons cm-2 s-1.
Unfortunately, it is unlikely that this emission can be detected with
the INTEGRAL observatory. But the predicted line intensities appear to
be within reach of future gamma-ray space instruments. A future
detection of de-excitation gamma-ray lines from the Galactic center
region would provide unique information on the high-energy processes
induced by the central supermassive black hole and the physical
conditions of the emitting region.
10-5 photons cm-2 s-1.
Unfortunately, it is unlikely that this emission can be detected with
the INTEGRAL observatory. But the predicted line intensities appear to
be within reach of future gamma-ray space instruments. A future
detection of de-excitation gamma-ray lines from the Galactic center
region would provide unique information on the high-energy processes
induced by the central supermassive black hole and the physical
conditions of the emitting region.
Key words: Galaxy: center - radiation mechanisms: non-thermal - gamma rays: theory
1 Introduction
Massive black holes (MBH) at galactic centers are sources of high energetic activity. X-ray observations of these sources have revealed flares of hard X-ray photons releasing a maximum power of 1044 erg s-1. These flares are supposed to caused by processes of accretion and tidal disruption of stars by the massive black holes (see, e.g., Sirota et al. 2005, and references thererin).
The capture radius of a black hole - the maximal distance from the
MBH where the tidal forces can overwhelm the stellar
self-gravity and tear the star apart - is given by
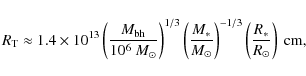
where M* and R* are the star's mass and radius,
Total tidal disruption of a star occurs when the penetration
parameter
![]() ,
where b is the ratio of
,
where b is the ratio of ![]() ,
the
periapse distance (distance of closest approach) to the tidal
radius
,
the
periapse distance (distance of closest approach) to the tidal
radius ![]() .
The tidal disruption rate
.
The tidal disruption rate
![]() can be
approximated to within an order of magnitude from an analysis of
star dynamics near a black hole via the Fokker-Planck equation.
For the parameters of the GC, it gives the rate
can be
approximated to within an order of magnitude from an analysis of
star dynamics near a black hole via the Fokker-Planck equation.
For the parameters of the GC, it gives the rate
![]() years-1 (see the review of Alexander 2005), which
agrees with the more detailed calculations of Syer & Ulmer (1999),
who obtained
years-1 (see the review of Alexander 2005), which
agrees with the more detailed calculations of Syer & Ulmer (1999),
who obtained
![]() years-1. Tidal
disruption processes have perhaps already been observed in cosmological
galaxy surveys (see, e.g. Donley et al. 2002).
years-1. Tidal
disruption processes have perhaps already been observed in cosmological
galaxy surveys (see, e.g. Donley et al. 2002).
As observations show, there is a supermassive black hole (Sgr
A![]() )
in the center of our Galaxy with a mass of
)
in the center of our Galaxy with a mass of
![]() (Gillessen et al. 2008). In the close vicinity of
the Galactic black hole (less than 0.04 pc from it), about 35 low-mass stars
(1-3
(Gillessen et al. 2008). In the close vicinity of
the Galactic black hole (less than 0.04 pc from it), about 35 low-mass stars
(1-3 ![]() )
and about 10 massive stars
(3-15
)
and about 10 massive stars
(3-15 ![]() )
are present (see Alexander & Livio 2004); i.e.,
processes of star accretion in the Galactic center seems to be
quite possible. However, attempts to find a strong X-ray source in
the Galactic center failed. The Chandra X-ray
Observatory only resolved a weak X-ray point source at the
position of Sgr A
)
are present (see Alexander & Livio 2004); i.e.,
processes of star accretion in the Galactic center seems to be
quite possible. However, attempts to find a strong X-ray source in
the Galactic center failed. The Chandra X-ray
Observatory only resolved a weak X-ray point source at the
position of Sgr A![]() with a flux
with a flux
![]() erg s-1 (see Baganoff et al. 2003), though moderate X-ray
flares were observed by Chandra (Porquet et al. 2008). As mentioned by
Koyama et al. (1996) and Muno et al. (2004), this ``X-ray
quiet'' Sgr A
erg s-1 (see Baganoff et al. 2003), though moderate X-ray
flares were observed by Chandra (Porquet et al. 2008). As mentioned by
Koyama et al. (1996) and Muno et al. (2004), this ``X-ray
quiet'' Sgr A![]() sharply contrasts to the high X-ray
activity of the surrounding diffuse hot plasmas. One likely
scenario is that the Galactic nucleus was brighter in the past,
possibly caused by surge accretion onto the massive back hole.
sharply contrasts to the high X-ray
activity of the surrounding diffuse hot plasmas. One likely
scenario is that the Galactic nucleus was brighter in the past,
possibly caused by surge accretion onto the massive back hole.
Cheng et al. (2006,2007) suggested that this scenario may explain the origin of the 511 keV annihilation flux from the GC region, if up to 10% of captured stellar matter is ejected in the form of a jet of relativistic protons. In this case the origin of the 511 keV line emission from the GC region is supposed to caused by annihilation of secondary positrons generated by p-p collisions.
An attempt to find independent evidence of active processes in the GC in the form of a flux of fast charged particles was undertaken by Dogiel et al. (2008), who conclude that these primary relativistic protons (if generated) penetrating the dense molecular clouds produced a flux there of nuclear de-excitation gamma-ray lines coming from the GC region. However, the origin of relativistic protons is still rather speculative since we do not have direct evidence of their production near black holes (see, however, Abraham et al. 2007; Istomin & Sol 2009). Besides, the gamma-ray line flux would be strongly time variable in this case, making the estimates of its value at present are highly model-dependent.
Below we examine a different model of gamma-ray line emission, assuming nuclear interactions of subrelativistic protons generated by processes of star disruption at the GC.
2 Flux of subrelativistic protons generated by star disruption
An alternative (and to our view more reliable) mechanism of
gamma-ray line production follows from the analysis of processes of
star disruption near black holes. The energy budget of a tidal
disruption event follows from analysis of star matter dynamics.
Once passing the pericenter, the star is tidally disrupted into a
very long and dilute gas stream. The outcome of tidal disruption
is that some energy is extracted out of the orbit to unbind the
star and accelerate the debris. Initially about 50% of the
stellar mass becomes tightly bound to the black hole, while the
remainder 50% of the stellar mass is forcefully ejected
(see, e.g. Ayal et al. 2000). The kinetic energy carried by the
ejected debris is a function of the penetration parameter b-1 that
can significantly exceed that released by a normal supernova
(![]() 1051 erg) if the orbit is highly penetrating
(see Alexander 2005),
1051 erg) if the orbit is highly penetrating
(see Alexander 2005),
Thus, the mean kinetic energy per escaping nucleon is given by
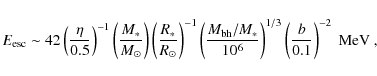
where
![\begin{displaymath}
Q_0^{\rm esc}=\frac{N}{\sigma\sqrt{2\pi}}
\exp\left[-~\frac{(E-E_{\rm esc})^2}{2\sigma^2}\right],
\end{displaymath}](/articles/aa/full_html/2009/46/aa11833-09/img30.png)
where N is total amount of particles ejected by one stellar capture. Results of calculations for different values of
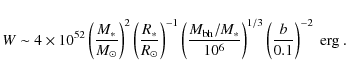
For a single capture of a one-solar mass star, the total number of
unbounded particles is
![]() ,
and the total kinetic
energy in these particles is
,
and the total kinetic
energy in these particles is
![]() erg,
if their energy is about 68 MeV (see above).
For the star capture frequency
erg,
if their energy is about 68 MeV (see above).
For the star capture frequency
![]() year-1 and
year-1 and
![]() about
several ten MeV (see, Dogiel et al. 2009b) it gives a power input
about
several ten MeV (see, Dogiel et al. 2009b) it gives a power input
![]() erg s-1, which is a few times
more than the total power contained in Galactic cosmic rays. The
average energy output depends, of course, on the capture
frequency.
erg s-1, which is a few times
more than the total power contained in Galactic cosmic rays. The
average energy output depends, of course, on the capture
frequency.
A capture of a massive star should eject more fast particles into
the GC region than a capture of a low-mass star. However, the
energy of the ejected particles is expected to be similar. This
can be seen from Eq. (3), recalling that the radius of
main-sequence stars varies as
![]() in first approximation. The frequency of massive star capture is
lower than for low-mass stars (see, e.g. Syer & Ulmer 1999).
Therefore, we expect the capture of a massive star to have
relatively little effect in comparison with the cumulative effect
from low-mass star captures. The latter is calculated below
assuming M*=1
in first approximation. The frequency of massive star capture is
lower than for low-mass stars (see, e.g. Syer & Ulmer 1999).
Therefore, we expect the capture of a massive star to have
relatively little effect in comparison with the cumulative effect
from low-mass star captures. The latter is calculated below
assuming M*=1 ![]() for all captured stars.
for all captured stars.
3 Proton propagation in the Galactic center region
Details of the proton spatial distribution in the GC region, as well as the mechanism of proton propagation are inessential for calculations of the total gamma-ray line flux. We use, nevertheless, kinetic equations in which processes of propagation, are included, and then integrate the obtained solution over the volume of emission. The effect of propagation reduces in this case to a proper estimate of the proton flux leaving the emission region.
Propagation of cosmic rays in the Galaxy is described as a diffusion phenomenon, with a phenomenological diffusion coefficient whose value and energy dependence is derived from observational data, e.g., from the chemical composition of cosmic rays measured near Earth. This method leads to a diffusion coefficient of about 1027 cm2 s-1(for details see Berezinskii et al. 1990). Processes of particle propagation in the GC region are questionable since we do not know much about the physical conditions of the ambient medium.
From the general theory of cosmic ray origin, it is clear that
particle propagation in the interstellar medium is described as
diffusion due to scattering on magnetic fluctuations. The
effective coefficient of diffusion is
![]() ,
where v is the particle velocity and
,
where v is the particle velocity and
![]() is the scattering frequency of particles, which is a
function of particle energy E and coordinates
is the scattering frequency of particles, which is a
function of particle energy E and coordinates ![]() .
Fairly
simple estimates provided by Jean et al. (2006) for the GC region in the
frame of the quasi-linear theory gives
.
Fairly
simple estimates provided by Jean et al. (2006) for the GC region in the
frame of the quasi-linear theory gives
![]() cm2 s-1 for MeV particles. A similar estimate was
obtained by LaRosa et al. (2001) from analysis of radio emission
from the central region. These authors conclude that electrons of
0.14 GeV diffuse about 13 pc in
cm2 s-1 for MeV particles. A similar estimate was
obtained by LaRosa et al. (2001) from analysis of radio emission
from the central region. These authors conclude that electrons of
0.14 GeV diffuse about 13 pc in
![]() years, which again gives
years, which again gives
![]() cm2 s-1.
cm2 s-1.
Estimates of the diffusion coefficient for subrelativistic protons in the GC have been derived by Dogiel et al. (2009c) from the observed hard X-ray emission, which is assumed to be due to inverse bremsstrahlung. They estimated D to be in the range 1026-1027 cm2 s-1. Below we provide our calculations for the diffusion coefficient D = 1027 cm2 s-1, though, in principle, its value may be a function of particle energy (as well as of spatial coordinates and even time). We suppose, however, that this simplification is acceptable because the energy range of relevance for gamma-ray line production is quite narrow, less than one order of magnitude.
Another important parameter of the model is the mean density of the medium into which the fast nuclei propagate. Observations show that the interstellar medium near the GC is highly nonuniform. Thus, within the central 2 pc of the shell of the supernova remnant Sgr A East, there is a hot plasma of temperature 2 keV and density as high as 103 cm-3 (Maeda et al. 2002). This local density fluctuation is insignificant for our treatments since energetic particles capable of producing de-excitation gamma-ray lines lose little energy passing through this local fluctuation by diffusion.
A significant part of the gas in the GC region is in the form of molecular
hydrogen, ![]() 90% of which is contained in dense and massive molecular
clouds with a volume-filling factor of only a few per cent. The total mass
of molecular hydrogen in the nuclear bulge, which is estimated to be
90% of which is contained in dense and massive molecular
clouds with a volume-filling factor of only a few per cent. The total mass
of molecular hydrogen in the nuclear bulge, which is estimated to be
![]() ,
significantly exceeds the mass contained in
the intercloud hot plasma (see Launhardt et al. 2002).
,
significantly exceeds the mass contained in
the intercloud hot plasma (see Launhardt et al. 2002).
However, subrelativistic charged particles may not be able to penetrate freely inside molecular clouds (see, e.g., Skilling & Strong 1976). Theoretical investigations performed by Dogiel et al. (1987, 2005) showed that turbulent motions of neutral gas could excite small-scale electromagnetic fluctuations that could prevent charged particles to penetrate deeply into clouds. Thus, subrelativistic cosmic-ray particles are expected to fill only a small portion of molecular clouds. This conclusion is supported by calculations performed by Dogiel et al. (2009a), who show that the flux of bremsstrahlung emission produced by subrelativistic protons inside molecular clouds is lower than produced in the intercloud hot plasma. If this is true, we expect that most of the gamma-ray line emission should also be generated in the intercloud hot plasma.
Recent observations with the satellites ASCA, Chandra,
and Suzaku have shown that the
![]() radius central region
is filled with a hot gas of temperature 6-10 keV.
The density of plasma derived from these observations ranges between
radius central region
is filled with a hot gas of temperature 6-10 keV.
The density of plasma derived from these observations ranges between
![]() cm-3 (Koyama et al. 1996; Muno et al. 2004; Koyama et al. 2007).
In the calculations we use the average value n= 0.2 cm-3.
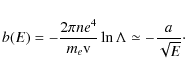
For these parameters the
average time of Coulomb losses for 10-100 MeV protons is
(see, e.g. Hayakawa 1969)
cm-3 (Koyama et al. 1996; Muno et al. 2004; Koyama et al. 2007).
In the calculations we use the average value n= 0.2 cm-3.
For these parameters the
average time of Coulomb losses for 10-100 MeV protons is
(see, e.g. Hayakawa 1969)
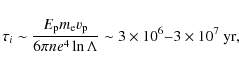
where
4 Spatial and energy distributions of subrelativistic protons in the Galactic center region
![\begin{figure}
\par\includegraphics[width=9cm,clip]{11833fg1.eps}
\end{figure}](/articles/aa/full_html/2009/46/aa11833-09/img50.png)
|
Figure 1:
Energy spectra of primary protons at r=0 pc and t=103 years ( thick dashed line), r=0 pc and t=104 years ( thick solid line), r=150 pc and
t=104 years ( thin solid line), and r=300 pc, t=104 years ( thin dashed line). For r>10 pc the proton spectra are almost stationary. These spectra were calculated for
|
| Open with DEXTER | |
The time-dependent spectrum of subrelativistic protons
erupted from the central region can be calculated from the equation
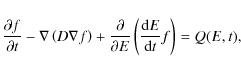
where
The injection of protons by processes of star capture can be described by
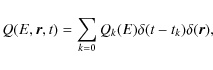
|
(8) |
where
We can derive the Green function of Eq. (6) for the injection time tk (see Syrovatskii 1959; Gratton 1972) and then sum over injections. The equation for the Green function is
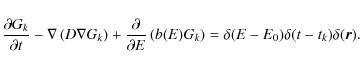
|
(9) |
Using variables
|
(10) |
the Green function can be written as
![\begin{displaymath}G_k(\vec{r},E,t;E_0,t_k)={{1}\over{\mid\!b(E)\!\mid}}
{{\del...
...mbda)^{3/2}}}\exp\left[-\frac{\vec{r}^2}{4\lambda}\right]\cdot
\end{displaymath}](/articles/aa/full_html/2009/46/aa11833-09/img59.png)
|
(11) |
Then,
In the nonrelativistic case, i.e. for energy losses in the form of Eq. (7), the solution (12) can be simplified to
![\begin{displaymath}
f(\vec{r},E,t)=\sum\limits_{k=0}\frac{N_k\sqrt{E}}{\sigma\s...
...c{r}^2}{4D(t-t_k)}\right]}{ \left(4\pi D(t-t_k)\right)^{3/2}},
\end{displaymath}](/articles/aa/full_html/2009/46/aa11833-09/img62.png)
where
![\begin{displaymath}Y_k(t,E)=\left[\frac{3a}{2}(t-t_k)+E^{3/2}\right].
\end{displaymath}](/articles/aa/full_html/2009/46/aa11833-09/img63.png)
|
(14) |
As one can see, this solution is characterized by two different spatial scales. The first one is
Since the Galactic black hole was inactive for a long time, we
calculated the gamma-ray line emission the proton spectrum at time t=T
after the last star capture. This will give us a lower limit on the
gamma-ray line flux. However, the density of subrelativistic protons in
the GC is expected to be almost independent of time, except for a very
compact region around the massive black hole. The proton spectrum
should reach its saturation level after ![]()
![]() capture events. In our calculations we summarized the cumulative effect of 2000 captures.
capture events. In our calculations we summarized the cumulative effect of 2000 captures.
To predict the total gamma-ray line flux from the GC we need to
estimate the total (integrated over volume) spectrum of subrelativistic
protons
We note that for simple estimates one can derive this spectrum from the assumption of a stationary injection of protons with the rate Q=N/T. Then the approximate solution has the form
![\begin{displaymath}
\bar{F}(E)=\frac{Q\sqrt{E}}{2a}\left[1+\mbox{Erf}\left(\frac{E_{\rm esc}-E}
{\sqrt{2}\sigma}\right)\right]
\end{displaymath}](/articles/aa/full_html/2009/46/aa11833-09/img70.png)
where Erf(x) is the error function.
![\begin{figure}
\includegraphics[width=9cm,clip]{11833fg2.eps}
\end{figure}](/articles/aa/full_html/2009/46/aa11833-09/img71.png)
|
Figure 2:
Densities in protons of energies 10, 50, 80, and 100 MeV, as a
function of radial distance from the GC. These spatial distributions
were calculated for
|
| Open with DEXTER | |
5 Nuclear interaction gamma-ray line emission from the Galactic center region
Unlike relativistic particles, subrelativistic nuclei do not effectively produce continuous radiation (except, may be, inverse bremsstrahlung, which is discussed in Dogiel et al. 2009a,b,c). However, collisions of subrelativistic nuclei with ambient matter can lead to nuclear excitation and emission of de-excitation gamma-ray lines. These lines may be a good tracer for subrelativistic cosmic rays, because the line brightness can give us information about the amount of subrelativistic particles.
Thus, prominent nuclear de-excitation lines are observed in emission spectra of solar flares, which allows derivation of valuable information on solar ambient abundances, density and temperature, as well as on accelerated particle composition, spectra, and transport in the solar atmosphere (see e.g., Smith et al. 2003; and Kiener et al. 2006, for recent solar observations with RHESSI and INTEGRAL, respectively). Dogiel (2001) predicted that galaxy clusters could emit a detectable flux of de-excitation gamma-ray lines. Later, Iyudin et al. (2004) found traces of gamma-ray line emission towards the Coma and Virgo clusters, though this detection has not been confirmed yet.
Detection of the gamma-ray line emission produced by cosmic-ray interactions in the interstellar medium would provide insightful information on low-energy cosmic rays and give a significant advance in the development of the theory of cosmic-ray origin. Theoretical estimates for the line emission in the Galaxy were provided by Ramaty et al. (1979), who calculated spectra of the nuclear de-excitation line emission for different assumed spectra of subrelativistic ions. However, attempts to measure a prominent flux of nuclear interaction lines were failed up to now.
Galactic center observations in the MeV range were performed by
the COMPTEL group but with a rather poor angular resolution
(Bloemen et al. 1997). They detected a marginal excess of emission in the
range 3-7 MeV. The total flux from the central region
![]() was estimated to be
10-4 cm-2 s-1 rad-1. This excess was
interpreted as emission in nuclear de-excitation lines generated
by cosmic-ray interaction in the GC region. However, neither the
COMPTEL group nor subsequent observations with INTEGRAL have
confirmed this result. In particular, Teegarden & Watanabe (2006) carried
out an extensive search for gamma-ray lines in the first year of
public data from the INTEGRAL spectrometer SPI and found
no evidence of any previously unknown lines in the energy range
20-8000 keV.
was estimated to be
10-4 cm-2 s-1 rad-1. This excess was
interpreted as emission in nuclear de-excitation lines generated
by cosmic-ray interaction in the GC region. However, neither the
COMPTEL group nor subsequent observations with INTEGRAL have
confirmed this result. In particular, Teegarden & Watanabe (2006) carried
out an extensive search for gamma-ray lines in the first year of
public data from the INTEGRAL spectrometer SPI and found
no evidence of any previously unknown lines in the energy range
20-8000 keV.
We suppose that processes of star accretion by the massive black hole at the GC can generate a significant number of subrelativistic protons and heavier nuclei. These energetic particles could in turn produce a significant flux of nuclear de-excitation gamma-ray lines in a relatively compact region of the GC. Unlike the gamma-ray emission that might be produced by relativistic protons (Dogiel et al. 2008), the emission produced by subrelativistic protons is expected to be almost stationary, so should be less dependent on model parameters.
![\begin{figure}
\includegraphics[width=7.5cm]{11833fg3.eps}
\end{figure}](/articles/aa/full_html/2009/46/aa11833-09/img73.png)
|
Figure 3:
Radial profiles of enclosed fluxes in a) the 4.44 MeV line and
b) the |
| Open with DEXTER | |
Though the origin of subrelativistic cosmic rays near the GC is different
than in other part of the galactic disk according to the present model,
a positive detection of de-excitation gamma-ray lines would provide important
information about star accretion processes at the GC.
We can calculate the gamma-ray flux emitted at time t=T after a star
capture in a given nuclear de-excitation line from
where i and j range over the accelerated and ambient particle species that contribute to the production of the gamma-ray line considered,
![\begin{figure}
\includegraphics[width=7.5cm]{11833fg4.eps}
\end{figure}](/articles/aa/full_html/2009/46/aa11833-09/img80.png)
|
Figure 4:
Predicted fluxes from the GC region of angular radius
|
| Open with DEXTER | |
Noteworthy is that the total steady-state emission obtained from Eq. (17)
independent of the assumed mean density in the interaction region, as can be seen
by introducing in this equation the particle distribution Fi(E,t), which is
inversely proportional to ![]() (see, e.g., Eq. (16)). This is true,
however, as long as
(see, e.g., Eq. (16)). This is true,
however, as long as
![]() cm-3, because for higher density
values the Coulomb loss time
cm-3, because for higher density
values the Coulomb loss time
![]() and the particle distribution is no longer
stationary. In any case, even if the predicted emission were time dependent,
the total fluxes given below can be interpreted as mean values over the period
of star capture T.
and the particle distribution is no longer
stationary. In any case, even if the predicted emission were time dependent,
the total fluxes given below can be interpreted as mean values over the period
of star capture T.
Figure 3 shows calculated radial profiles of the predicted line
emission at 4.44 and ![]() 6.2 MeV. These two lines are mainly produced by proton
and
6.2 MeV. These two lines are mainly produced by proton
and ![]() -particle reactions with ambient 12C and 16O (see below).
In contrast to the total emission from the GC region (i.e. integrated over space), the
radial profiles depend on the assumed value of
-particle reactions with ambient 12C and 16O (see below).
In contrast to the total emission from the GC region (i.e. integrated over space), the
radial profiles depend on the assumed value of ![]() :
the higher the ambient
medium density, the lower the spatial extend of the gamma-ray line emission. We see in
Fig. 3 that, for
:
the higher the ambient
medium density, the lower the spatial extend of the gamma-ray line emission. We see in
Fig. 3 that, for
![]() cm-3 and
cm-3 and
![]() MeV nucleon-1, the gamma-ray lines are emitted from a
region of maximum
MeV nucleon-1, the gamma-ray lines are emitted from a
region of maximum ![]() angular radius. Such emission would
appear as small-scale diffuse emission for a gamma-ray instrument like SPI, whose
angular resolution is
angular radius. Such emission would
appear as small-scale diffuse emission for a gamma-ray instrument like SPI, whose
angular resolution is ![]() 3
3![]() FWHM (see, e.g., Teegarden & Watanabe 2006).
FWHM (see, e.g., Teegarden & Watanabe 2006).
Figure 4 shows calculated fluxes in the 4.44 and ![]() 6.2 MeV lines as a
function of
6.2 MeV lines as a
function of
![]() ranging from 10 to 100 MeV nucleon-1, which corresponds
to
ranging from 10 to 100 MeV nucleon-1, which corresponds
to
![]() (see Eq. (3)).
We see that the predicted fluxes increase with increasing escape energy up to values
(see Eq. (3)).
We see that the predicted fluxes increase with increasing escape energy up to values
![]() 10-5 photons cm-2 s-1 for
10-5 photons cm-2 s-1 for
![]() MeV nucleon-1.
We also see that the fluxes are not strongly dependent on the assumed
width of the adopted Gaussian distribution (
MeV nucleon-1.
We also see that the fluxes are not strongly dependent on the assumed
width of the adopted Gaussian distribution (![]() in Eq. (4)).
in Eq. (4)).
![\begin{figure}
\par\includegraphics[width=9.cm]{11833fg5.eps}\vspace*{3mm}
\end{figure}](/articles/aa/full_html/2009/46/aa11833-09/img89.png)
|
Figure 5:
Spectrum of the predicted gamma-ray line emission from the GC region
of angular radius
|
| Open with DEXTER | |
Dogiel et al. (2009b) show that the hard X-rays observed with Suzaku from the GC region (Yuasa et al. 2008) can be produced by
inverse bremsstrahlung from subrelativistic protons accelerated by
star disruption near Sgr A![]() .
In this scenario, the measured
spectrum of this hard X-ray emission would imply that
.
In this scenario, the measured
spectrum of this hard X-ray emission would imply that
![]() MeV nucleon-1. Figure 5 shows
a gamma-ray line spectrum calculated for
MeV nucleon-1. Figure 5 shows
a gamma-ray line spectrum calculated for
![]() MeV nucleon-1 and
MeV nucleon-1 and
![]() ,
using the code developed by Ramaty et al. (1979). The calculated total
flux in gamma-ray lines below 8 MeV is
,
using the code developed by Ramaty et al. (1979). The calculated total
flux in gamma-ray lines below 8 MeV is
![]() photons cm-2 s-1. In the 3-7 MeV
range, it is
photons cm-2 s-1. In the 3-7 MeV
range, it is
![]() photons cm-2 s-1.
photons cm-2 s-1.
We see relatively strong lines of various widths in Fig. 5,
which are superimposed on a continuum-like emission due to all the
unresolved gamma-ray lines, mostly arising from
cascade transitions in high-lying levels of heavy nuclei. Among
the strongest lines are those produced in excitations of low-lying
nuclear levels of abundant ambient ions, e.g. at 4.44 MeV from
12C* and 0.847 MeV from 56Fe*. Other important
lines are those arising from transitions in the spallation
products of abundant ambient nuclei, e.g. at 0.718 MeV from
10B*, which is produced by spallation of ambient 12C
and 16O, at 0.931 MeV from 55Fe*, which is mainly
produced by the reaction 56Fe(p, pn)55Fe* and
at ![]() 5.2 MeV from 15N* and 15O* resulting from
spallation of 16O (see Kozlovsky et al. 2002). The broad line
feature at
5.2 MeV from 15N* and 15O* resulting from
spallation of 16O (see Kozlovsky et al. 2002). The broad line
feature at ![]() 6.2 MeV comes from the merging of the 6.129 MeV
line from de-excitations in 16O* with two lines at
6.175 MeV from 15O* and 6.322 MeV from 15N*produced in spallation reactions. The characteristics of the main
gamma-ray lines are summarized in Table 1.
6.2 MeV comes from the merging of the 6.129 MeV
line from de-excitations in 16O* with two lines at
6.175 MeV from 15O* and 6.322 MeV from 15N*produced in spallation reactions. The characteristics of the main
gamma-ray lines are summarized in Table 1.
The lines produced in a gaseous ambient medium are broadened by
the recoil velocity of the excited nucleus. The line width
generally decreases with increasing mass of the target atoms,
because the recoil velocity of heavier nuclei is lower. Thus, in
Fig. 5, FWHM (of the
0.847 MeV line produced by proton and ![]() -particle inelastic
scattering of 56Fe is 6 keV (0.7% of the transition energy),
whereas the FWHM of the 4.44 MeV from 12C* is 160 keV
(
-particle inelastic
scattering of 56Fe is 6 keV (0.7% of the transition energy),
whereas the FWHM of the 4.44 MeV from 12C* is 160 keV
(
![]() %).
However, some gamma-ray lines produced in interstellar dust grains
can be very narrow, because some of the excited nuclei can stop in
solid materials before emitting gamma rays (Lingenfelter & Ramaty 1977). It
requires that the mean lifetime of the excited nuclear level or of
its radioactive nuclear parent is longer than the slowing down
time of the excited nucleus in the grain material. The most
promising of such lines is that at 6.129 MeV from 16O*.
Thus, future measurements of the profile of the
%).
However, some gamma-ray lines produced in interstellar dust grains
can be very narrow, because some of the excited nuclei can stop in
solid materials before emitting gamma rays (Lingenfelter & Ramaty 1977). It
requires that the mean lifetime of the excited nuclear level or of
its radioactive nuclear parent is longer than the slowing down
time of the excited nucleus in the grain material. The most
promising of such lines is that at 6.129 MeV from 16O*.
Thus, future measurements of the profile of the ![]() 6.2 MeV line
could allow us to probe for the presence of dust grains in the
GC region and perhaps to
measure the grain size distribution (Tatischeff & Kiener 2004).
6.2 MeV line
could allow us to probe for the presence of dust grains in the
GC region and perhaps to
measure the grain size distribution (Tatischeff & Kiener 2004).
Table 1: Main gamma-ray lines expected from the GC region
Very narrow lines can also result from the decay of
spallation-produced long-lived radionuclei, which can come to rest
essentially in the ambient medium before decaying to
excited states of their daughter nuclei and emitting gamma rays.
For
![]() cm-3, the slowing-down time of
recoiling heavy nuclei excited by fast proton and
cm-3, the slowing-down time of
recoiling heavy nuclei excited by fast proton and ![]() -particle
collisions is around 104 years. Thus, only radionuclei
with mean lifetimes longer than 104 yr can produce very
narrow lines in the GC environment. The most intense of
these lines is expected to be that at 1.809 MeV from the decay of
26Al (
-particle
collisions is around 104 years. Thus, only radionuclei
with mean lifetimes longer than 104 yr can produce very
narrow lines in the GC environment. The most intense of
these lines is expected to be that at 1.809 MeV from the decay of
26Al (
![]() years). This radioisotope can be
synthesized by the reactions 26Mg(p, n)26Al and
28Si(p, x)26Al (Ramaty et al. 1979). However, the calculated
flux in the 1.809 MeV line is only
3.5
years). This radioisotope can be
synthesized by the reactions 26Mg(p, n)26Al and
28Si(p, x)26Al (Ramaty et al. 1979). However, the calculated
flux in the 1.809 MeV line is only
3.5![]() 10-7 photons cm-2 s-1 (Table 1).
In comparison, the flux observed with INTEGRAL/SPI from the inner
Galaxy (
10-7 photons cm-2 s-1 (Table 1).
In comparison, the flux observed with INTEGRAL/SPI from the inner
Galaxy (
![]() )
is
)
is
![]() cm-2 s-1 rad-1. It
is produced by a present-day equilibrium mass of
cm-2 s-1 rad-1. It
is produced by a present-day equilibrium mass of
![]() of 26Al synthesized by massive stars in the
Milky Way (Diehl et al. 2006).
of 26Al synthesized by massive stars in the
Milky Way (Diehl et al. 2006).
The gamma-ray lines above 4 MeV are better candidates for a
future detection. Our predicted fluxes, however, are below currently
available sensitivity limits of INTEGRAL. After one year of
observation and ![]() 3 Ms of exposure of the GC region, the SPI
sensitivity for detection of a narrow line at
3 Ms of exposure of the GC region, the SPI
sensitivity for detection of a narrow line at ![]() 5 MeV from a
small-scale diffuse region at the center of the Galaxy was
5 MeV from a
small-scale diffuse region at the center of the Galaxy was
![]() cm-2 s-1 (Teegarden & Watanabe 2006, see Table 5).
But for a broad line of
cm-2 s-1 (Teegarden & Watanabe 2006, see Table 5).
But for a broad line of ![]() 200 keV FWHM (see Table 1)
the sensitivity limit increases by a factor of
200 keV FWHM (see Table 1)
the sensitivity limit increases by a factor of ![]() 8. It is thus
unlikely that the predicted gamma-ray line emission will be detected
with INTEGRAL.
8. It is thus
unlikely that the predicted gamma-ray line emission will be detected
with INTEGRAL.
6 Discussion and conclusions
In spite of many uncertainties of the model parameters, we should state that their estimates cannot vary more than an order of magnitude. Thus, the injection energy should be close to 100 MeV, the average energy output is about 1041 erg s-1, and the spatial diffusion coefficient is about 1027 cm2 s-1in order to reproduce the observed spatial distribution of hard X-rays in the GC (Dogiel et al. 2009a,b,c).We showed that the accretion of stars onto the central supermassive
black hole periodically ejects an intense flux of subrelativistic protons
and nuclei capable of producing a significant emission of nuclear de-excitation
gamma-ray lines in the GC region. The production rate of
these energetic particles is about 1045 s-1. Because
the time period of star capture by the black hole is expected to be shorter
than the lifetime of the ejected protons against Coulomb losses, the density
of these particles in the GC region is expected to be almost stationary. The
radius of the volume filled with these energetic particles is found
to be ![]() 700 pc or
700 pc or ![]() 5
5![]() if observed from Earth.
if observed from Earth.
Based on the spectrum of the diffuse hard X-ray emission observed with
Suzaku from the GC region (Yuasa et al. 2008), we estimated the energy of
the nuclei accelerated in the vicinity of the black hole to be
![]() MeV nucleon-1. Further assuming that the mean
metallicity in the GC region is two times higher than in the solar
neighborhood (see, e.g., Koyama et al. 2009), we calculated the total gamma-ray
line flux below 8 MeV to be
MeV nucleon-1. Further assuming that the mean
metallicity in the GC region is two times higher than in the solar
neighborhood (see, e.g., Koyama et al. 2009), we calculated the total gamma-ray
line flux below 8 MeV to be
![]() photons cm-2 s-1.
The most promising lines for detection are those at 4.44 and
photons cm-2 s-1.
The most promising lines for detection are those at 4.44 and ![]() 6.2 MeV,
with a predicted flux in each line of
6.2 MeV,
with a predicted flux in each line of ![]() 10-5 photons cm-2 s-1.
These lines should be broad,
10-5 photons cm-2 s-1.
These lines should be broad,
![]() of 3-4%, which
unfortunately renders their detection with the INTEGRAL spectrometer unlikely.
of 3-4%, which
unfortunately renders their detection with the INTEGRAL spectrometer unlikely.
But future gamma-ray missions like the Nuclear Compton Telescope (Chang et al. 2007), the
GRIPS project (Greiner et al. 2008), and the Advanced Compton Telescope (Boggs et al. 2006) may be
able to test our predictions. In particular, the GRIPS mission proposed for ESA's
``Cosmic Vision'' program could achieve more than an order of magnitude sensitivity improvement
after 5 years in orbit over COMPTEL (in 9 years), which would allow clear
detection of the predicted gamma-ray line emission at 4.44 and ![]() 6.2 MeV from the GC
region. The Advanced Compton Telescope project proposed as a future NASA mission aims at
even better sensitivity, near 10-6 photons cm-2 s-1 for 3% broad lines.
A future detection of the predicted gamma-ray lines with such an instrument would
provide unique information on the high-energy processes induced by the the central
black hole, as well as on the physical conditions of the emitting region.
6.2 MeV from the GC
region. The Advanced Compton Telescope project proposed as a future NASA mission aims at
even better sensitivity, near 10-6 photons cm-2 s-1 for 3% broad lines.
A future detection of the predicted gamma-ray lines with such an instrument would
provide unique information on the high-energy processes induced by the the central
black hole, as well as on the physical conditions of the emitting region.
Finally, we note that nuclear interactions of subrelativistic ions with ambient
material can also synthesize ![]() radioisotopes, whose decay can inject positrons
into the GC region. From the radioisotope production yields given by Kozlovsky et al. (1987), we
estimate that, for
radioisotopes, whose decay can inject positrons
into the GC region. From the radioisotope production yields given by Kozlovsky et al. (1987), we
estimate that, for
![]() MeV nucleon-1, the number of positrons
produced by this mechanism is
MeV nucleon-1, the number of positrons
produced by this mechanism is ![]() 5 times the number of gamma-rays emitted in the
4.44 and
5 times the number of gamma-rays emitted in the
4.44 and ![]() 6.2 MeV lines. With a predicted gamma-ray production rate of
6.2 MeV lines. With a predicted gamma-ray production rate of
![]() photons s-1 as the sum of these two lines (see Table 1),
it gives a positron production rate
photons s-1 as the sum of these two lines (see Table 1),
it gives a positron production rate ![]()
![]()
![]() s-1.
This limit is more than an order of magnitude lower than the positron annihilation
rate measured with INTEGRAL/SPI (Weidenspointner et al. 2008).
s-1.
This limit is more than an order of magnitude lower than the positron annihilation
rate measured with INTEGRAL/SPI (Weidenspointner et al. 2008).
First of all we would like to mention that the referee's report was very helpful for us and we thank him for comments. The authors are also grateful to H.-K. Chang, Y. Chou, Ya. N. Istomin, and Y. Maeda, for helpful discussions, and to W. Hermsen and H. Bloemen for valuable input.
V.A.D. and D.O.C. are partly supported by the RFBR grant 08-02-00170-a, the NSC-RFBR Joint Research Project RP09N04 and 09-02-92000-HHC-a, and by the grant of the President of the Russian Federation ``Scientific School of Academician V.L. Ginzburg''. K.S.C. is supported by an RGC grant of the Hong Kong Government under HKU 7014/07P and a National Basic Research Program of China under 2009CB824800. C.M.K. is supported by the Taiwan National Science Council grants NSC 96-2112-M-008-014-MY3 and NSC-98-2923-M-008-001-MY3. W.H.I. is supported by the Taiwan National Science Council grants NSC 96-2752-M-008-011-PAE and NSC 96-2111-M-008-010.
The last version of the paper was partly prepared in ISAS/JAXA (Sagamihara, Japan). V.A.D. thanks ISAS and particularly Prof. Kazuhisa Mitsuda and the ISAS director Prof. Hajime Inoue for hospitality.
References
- Abraham, J., Abreu, P., Aglietta, M. et al. (Pierre Auger Collaboration), 2007, Science, 318, 938 [NASA ADS] [CrossRef]
- Alexander, T. 2005, PhR, 419, 65 [NASA ADS]
- Alexander, T., & Livio, M. 2004, ApJ, 606, L21 [NASA ADS] [CrossRef]
- Ayal, S., Livio, M., & Piran, T. 2000, ApJ, 545, 772 [NASA ADS] [CrossRef]
- Baganoff, F. K., Maeda, Y., Morris, M., et al. 2003, ApJ, 591, 891 [NASA ADS] [CrossRef]
- Berezinskii, V. S., Bulanov, S. V., Dogiel, V. A., Ginzburg, V. L., & Ptuskin, V. S. 1990, Astrophysics of Cosmic Rays, ed. V. L. Ginzburg (Amsterdam: Norht-Holland)
- Bloemen, H., Bykov, A. M.., Diehl, R., et al. 1997, Proceedings of the Fourth Compton Symposium, ed. C. D. Dermer, M. S. Strickman, & J. D. Kurfess, Williamsburg, VA, AIP Conf. Proc., 410, 107
- Boggs, S., Kurfess, J., Ryan, J., et al. 2006, Space Telescopes and Instrumentation II: Ultraviolet to Gamma Ray, ed. M. J. L. Turner, & G. Hasinger, Proc. SPIE, 6266, 62
- Chang, H.-K., Boggs, S., & Chang, Y.-H. 2007, Adv. Space Res., 40, 1281 [NASA ADS] [CrossRef]
- Cheng, K. S., Chernyshov, D. O., & Dogiel, V. A. 2006, ApJ, 645, 1138 [NASA ADS] [CrossRef]
- Cheng, K. S., Chernyshov, D. O., & Dogiel, V. A. 2007, A&A, 473, 351 [NASA ADS] [CrossRef] [EDP Sciences]
- Cunha, K., Sellgren, K., Smith, V. V., et al. 2007, ApJ, 669, 1011 [NASA ADS] [CrossRef]
- Diehl, R., Halloin, H., Kretschmer, K., et al. 2006, Nature, 439, 45 [NASA ADS] [CrossRef]
- Dogiel, V. A. 2001, Proc. 4th Integral Workshop, in Exploring the Gamma-Ray Universe, ed. A. Gimenez, V. Reglero, & C. Winkler, ESA SP-459, 139
- Dogiel, V. A., Gurevich, A. V., Istomin, Ya. N., & Zybin, K. P. 1987, MNRAS, 228, 843 [NASA ADS]
- Dogiel, V. A., Gurevich, A. V., Istomin, Ya. N., & Zybin, K. P. 2005, Ap&SS, 297, 201 [NASA ADS] [CrossRef]
- Dogiel, V. A., Cheng, K.-S., Chernyshov, D. O., et al. 2008, New Astron. Rev., 52, 460 [NASA ADS] [CrossRef]
- Dogiel, V., Chernyshov D., Cheng, K.-S., et al. 2009a, PASJ, 61, 901 [NASA ADS]
- Dogiel, V., Chernyshov D., Yuasa, T., et al. 2009b, to be published in PASJ, 61, No. 5
- Dogiel, V., Chernyshov D., Yuasa, T., et al. 2009c, to be published in PASJ, 61, No. 5
- Donley, J. L., Brandt, W. N., Eracleous, M., & Boller, Th. 2002, ApJ, 124, 1308 [NASA ADS]
- Gillessen, S., Eisenhauer, F., Trippe, S., et al. 2008, A Giant Step: from Milli- to Micro-arcsecond Astrometry, Proc. IAU, IAU Symp., 248, 466[arXiv:0810.4674]
- Gratton, L. 1972, Ap&SS, 16, 81 [NASA ADS] [CrossRef]
- Greiner, J., Iyudin, A., Kanbach, G., et al. 2008, Exper. Astron., 23, 91 [NASA ADS] [CrossRef]
- Grönewegen, M. A. T., Udalski, A., & Bono, G. 2008, A&A, 481, 441 [NASA ADS] [CrossRef] [EDP Sciences]
- Hayakawa, S. 1969, Cosmic Ray Physics (Wiley-Interscience)
- Istomin, Ya. N., & Sol, H. 2009, Ap&SS, 321, 57I [NASA ADS] [CrossRef]
- Iyudin, A. F., Böhringer, H., Dogiel, V. A., & Morfill, G. 2004, A&A, 413, 817 [NASA ADS] [CrossRef] [EDP Sciences]
- Jean, P., Knödlseder, J., Gillard, W., et al. 2006, A&A, 445, 579 [NASA ADS] [CrossRef] [EDP Sciences]
- Kiener, J., Gros, M., Tatischeff, V., & Weidenspointner, G. 2006, A&A, 445, 725 [NASA ADS] [CrossRef] [EDP Sciences]
- Koyama, K., Maeda, Y., Sonobe, T., et al. 1996, PASJ, 48, 249 [NASA ADS]
- Koyama, K., Hyodo, Y., Inui, T., et al. 2007, PASJ, 59, 245
- Koyama, K., Takikawa, Y., Hyodo, Y., et al. 2009, PASJ, 61, S255
- Kozlovsky, B., Lingenfelter, R. E., & Ramaty, R. 1987, ApJ, 316, 801 [NASA ADS] [CrossRef]
- Kozlovsky, B., Murphy, R. J., & Ramaty, R. 2002, ApJS, 141, 523 [NASA ADS] [CrossRef]
- LaRosa, T. N., Lazio, T., Joseph, W., & Kassim, N. E. 2001, ApJL, 563, 163 [NASA ADS] [CrossRef]
- Launhardt, R., Zylka, R., & Mezger, P. G. 2002, A&A, 384, 112 [NASA ADS] [CrossRef] [EDP Sciences]
- Lingenfelter, R. E., & Ramaty, R. 1977, ApJ, 211, L19 [NASA ADS] [CrossRef]
- Lodders, K. 2003, ApJ, 591, 1220 [NASA ADS] [CrossRef]
- Maeda, Y., Baganoff, F. K., Feigelson, E. D., et al. 2002, ApJ, 570, 671 [NASA ADS] [CrossRef]
- Morris, M., & Serabyn, E. 1996, ARA&A, 34, 645 [NASA ADS] [CrossRef]
- Muno, M. P., Baganoff, F. K., Bautz, M. W., et al. 2004, ApJ, 613, 326 [NASA ADS] [CrossRef]
- Phinney, E. S. 1989, Nature, 340, 595 [NASA ADS] [CrossRef]
- Porquet, D., Grosso, N., Predehl, P., et al. 2008, A&A, 488, 549 [NASA ADS] [CrossRef] [EDP Sciences]
- Ramaty, R., Kozlovsky, B., & Lingenfelter, R. E. 1979, ApJS, 40, 487 [NASA ADS] [CrossRef]
- Rees, M. J. 1988, Nature, 333, 523 [NASA ADS] [CrossRef]
- Sirota, V. A., Il'in, A. S., Zybin, K. P., & Gurevich, A. V. 2005, JETP, 100, 294 [NASA ADS] [CrossRef]
- Skilling, J., & Strong, A. W. 1976, A&A, 53, 253 [NASA ADS]
- Smith, D. M., Share, G. H., Murphy, R. J. et al. 2003, ApJ, 595, L81 [NASA ADS] [CrossRef]
- Syer, D., & Ulmer, A. 1999, MNRAS, 306, 35 [NASA ADS] [CrossRef]
- Syrovatskii, S. I. 1959, Sov. Astron., 3, 22 [NASA ADS]
- Tatischeff, V., & Kiener, J. 2004, New Astron. Rev., 48, 99 [NASA ADS] [CrossRef]
- Teegarden, B. J., & Watanabe, K. 2006, ApJ, 646, 965 [NASA ADS] [CrossRef]
- Ulmer, A. 1999, ApJ, 514, 180 [NASA ADS] [CrossRef]
- Weidenspointner, G., Skinner, G., Jean, P., et al. 2008, Nature, 451, 159 [NASA ADS] [CrossRef]
- Yuasa, T., Tamura, K., Nakazawa, K., et al. 2008, PASJ, 60, S207 [NASA ADS]
All Tables
Table 1: Main gamma-ray lines expected from the GC region
All Figures
|
|
Figure 1:
Energy spectra of primary protons at r=0 pc and t=103 years ( thick dashed line), r=0 pc and t=104 years ( thick solid line), r=150 pc and
t=104 years ( thin solid line), and r=300 pc, t=104 years ( thin dashed line). For r>10 pc the proton spectra are almost stationary. These spectra were calculated for
|
| Open with DEXTER | |
| In the text | |
|
|
Figure 2:
Densities in protons of energies 10, 50, 80, and 100 MeV, as a
function of radial distance from the GC. These spatial distributions
were calculated for
|
| Open with DEXTER | |
| In the text | |
|
|
Figure 3:
Radial profiles of enclosed fluxes in a) the 4.44 MeV line and
b) the |
| Open with DEXTER | |
| In the text | |
|
|
Figure 4:
Predicted fluxes from the GC region of angular radius
|
| Open with DEXTER | |
| In the text | |
|
|
Figure 5:
Spectrum of the predicted gamma-ray line emission from the GC region
of angular radius
|
| Open with DEXTER | |
| In the text | |
Copyright ESO 2009
Current usage metrics show cumulative count of Article Views (full-text article views including HTML views, PDF and ePub downloads, according to the available data) and Abstracts Views on Vision4Press platform.
Data correspond to usage on the plateform after 2015. The current usage metrics is available 48-96 hours after online publication and is updated daily on week days.
Initial download of the metrics may take a while.