| Issue |
A&A
Volume 507, Number 3, December I 2009
|
|
|---|---|---|
| Page(s) | 1729 - 1737 | |
| Section | Astronomical instrumentation | |
| DOI | https://doi.org/10.1051/0004-6361/200912851 | |
| Published online | 01 October 2009 | |
A&A 507, 1729-1737 (2009)
Light curve analysis of variable stars using Fourier decomposition and principal component analysis
S. Deb1 - H. P. Singh1,2
1 - Department of Physics & Astrophysics, University of Delhi,
Delhi 110007, India
2 - CRAL-Observatoire de Lyon, CNRS UMR 142, 69561 Saint-Genis Laval,
France
Received 8 July 2009 / Accepted 1 September 2009
Abstract
Context. Ongoing and future surveys of variable
stars will require new techniques to analyse their light curves as well
as to tag objects according to their variability class in an automated
way.
Aims. We show the use of principal component
analysis (PCA) and Fourier decomposition (FD) method as tools for
variable star light curve analysis and compare their relative
performance in studying the changes in the light curve structures of
pulsating Cepheids and in the classification of variable stars.
Methods. We have calculated the Fourier parameters
of 17 606 light curves of a variety of variables,
e.g., RR Lyraes, Cepheids, Mira Variables and extrinsic
variables for our analysis. We have also performed PCA on the same
database of light curves. The inputs to the PCA are the
100 values of the magnitudes for each of these
17 606 light curves in the database interpolated
between phase 0 to 1. Unlike some previous studies,
Fourier coefficients are not used as input to the PCA.
Results. We show that in general, the first few
principal components (PCs) are enough to reconstruct the original light
curves compared to the FD method where 2 to
3 times more parameters are required to satisfactorily
reconstruct the light curves. The computation of the required number of
Fourier parameters on average needs 20 times more
CPU time than the computation of the required number
of PCs. Therefore, PCA does have some advantages over the
FD method in analysing the variable stars in a larger
database. However, in some cases, particularly in finding the
resonances in fundamental mode (FU) Cepheids, the
PCA results show no distinct advantages over the
FD method. We also demonstrate that the PCA technique
can be used to classify variables into different variability classes in
an automated, unsupervised way, a feature that has immense potential
for larger databases in the future.
Key words: methods: data analysis - stars: binaries: eclipsing - stars: variables: RR Lyraes - stars: variables: Cepheids - methods: statistical
1 Introduction
The recent interest in the structure and properties of light curves of variable stars has increased because of the large amount of observational data from variable star projects like OGLE (optical gravitational lensing experiment), MACHO (massive compact halo object), ASAS (All Sky automated survey) and NSVS (Northern Sky variability survey). In addition, new techniques to tag variable objects expected in huge numbers from satellite missions like CoRoT (Convection Rotation and Planetary Transits), Kepler, and Gaia in a robust and automated manner are being explored (Debosscher et al. 2007; Sarro et al. 2009). The Fourier decomposition technique is a reliable and efficient way of describing the structure of light curves of variable stars. Schaltenbrand & Tammann (1971) derived UBV light curve parameters for 323 galactic Cepheids by Fourier analysis. The first systematic use of the Fourier technique was made by Simon (1979) to analyze the observed light variations and radial velocity variation of AI Velorum. The first-order amplitudes and phases from the Fourier fits were then compared with those obtained from linear adiabatic pulsation models to obtain the mass of AI Vel. Simon & Lee (1981) made the first attempt to reconstruct the light curves of Cepheid variables using Fourier decomposition and to describe the Hertzsprung progression in Cepheid light curves. The method has been applied extensively by various authors for light curve reconstruction, mode discrimination and classification of pulsating stars (Antonello et al. 1986; Mantegazza & Poretti 1992; Hendry et al. 1999; Poretti 2001; Ngeow et al. 2003; Moskalik & Poretti 2003; Jin et al. 2004; Tanvir et al. 2005). However, Fourier decomposition by itself is not perfectly suitable for classification of variable stars in large databases as the method works only for individual stars, but it can be used as a preprocessor for other automated schemes (Kanbur et al. 2002; Kanbur & Mariani 2004; Sarro et al. 2009).
Principal component analysis transforms the original data set of variables with an orthogonal transformation to a new set of uncorrelated variables or principal components. The technique amounts to a straightforward rotation from the original axes to the new ones and the principal components are derived in decreasing order of importance (Singh et al. 1998). The first few components thus account for most of the variation in the original data (Chatfield & Collins 1980; Murtagh & Heck 1987). The technique has been used for stellar spectral classification (Murtagh & Heck 1987; Storrie-Lombardi et al. 1994; Singh et al. 1998), QSO spectra (Francis et al. 1992) and for galaxy spectra (Sodré & Cuevas 1994; Connolly et al. 1995; Lahav et al. 1996; Folkes et al. 1996). There have been a number of studies on the use of PCA in analyzing Cepheid light curves (Kanbur et al. 2002) and RR Lyrae light curves (Kanbur & Mariani 2004). In both these studies, the input data to the principal component analysis (PCA) are the Fourier coefficients rather than the light curves themselves. Nevertheless, it was noted that PCA was able to reproduce the light curves with about half the number of parameters (PCs) needed by the Fourier technique. In PCA, the first few PCs are usually examined as they contain most of the information about the data.
Table 1: Data selected for the present analysis.
The PCA has been applied to the light curves of Cepheid
variable stars by Kanbur et al. (2002) and
RR Lyrae stars by Kanbur & Mariani (2004). They
concluded that PCA is more efficient than the
FD method in bringing out changes in the light curve structure
of these variables. In our opinion, there is no advantage in the way
the PCA was applied because the Fourier coefficients were used as
input to the PCA which are themselves the information-bearing
coefficients of the light curve structure. Therefore PCA will not
extract any additional information except the dimensionality
reduction to a few orders. In the case of databases where a variety of
variables is present, the method of application of PCA on Fourier
coefficients is further complicated by the fact that the
optimal order of fit to different light curves is different. When using
Fourier coefficients as input to the PCA one has to decide where to
make a cut in the Fourier fitting orders. For Fourier
decomposition of FU Cepheids, one needs precise Fourier
components up to order ![]() 10-15
in explaining the Cepheid bump progression whereas RR Lyraes
need fewer Fourier components (
10-15
in explaining the Cepheid bump progression whereas RR Lyraes
need fewer Fourier components (![]() 2-7) to completely describe the light curve
structure. Also, if the phase coverage is not smooth, then fitting such
light curves with higher orders of the fit may give rise to false bumps
that are not associated with the true light curve structures. Therefore
it is not meaningful to
use Fourier coefficients as input to the PCA when light curves of a
large number of variable stars having different variability classes are
to be analysed. We demonstrate this fact with the
following example:
2-7) to completely describe the light curve
structure. Also, if the phase coverage is not smooth, then fitting such
light curves with higher orders of the fit may give rise to false bumps
that are not associated with the true light curve structures. Therefore
it is not meaningful to
use Fourier coefficients as input to the PCA when light curves of a
large number of variable stars having different variability classes are
to be analysed. We demonstrate this fact with the
following example:
Suppose a larger database of stars contains RRab, RRc and
FU Cepheid variables. The RRc stars are always fitted
with a lower order of the Fourier fit as compared to RRab and
FU Cepheids. Generally RRc stars need ![]() 2-5 orders
of the fit because of the sinusoidal and symmetric nature of their
light curves, RRab
2-5 orders
of the fit because of the sinusoidal and symmetric nature of their
light curves, RRab ![]() 3-7 orders of fit because of their asymmetric light curve,
whereas
some of the FU Cepheids need to be fitted with
3-7 orders of fit because of their asymmetric light curve,
whereas
some of the FU Cepheids need to be fitted with ![]() 10-15 orders
of the fit to explain the bump progression. Therefore for
FU Cepheids, if the light curves are fitted with fewer orders,
the bump
progression will not be fitted properly and one will miss the important
bump feature. On the other hand, if all the light curves are fitted
with higher orders of the fit then one is basically
fitting the noise in the case of RR Lyrae stars which will
also be reflected in the PCA.
10-15 orders
of the fit to explain the bump progression. Therefore for
FU Cepheids, if the light curves are fitted with fewer orders,
the bump
progression will not be fitted properly and one will miss the important
bump feature. On the other hand, if all the light curves are fitted
with higher orders of the fit then one is basically
fitting the noise in the case of RR Lyrae stars which will
also be reflected in the PCA.
One of the most important advantages of PCA over the FD method is that in PCA, all the light curve data can be processed and analysed in one go if all the phased light curve data can be made of similar dimensions, as we shall demonstrate later, whereas in the FD method each light curve has to be fitted with the optimal order of the fit and analysed individually. This is a very time consuming process for large databases. Therefore, the decision regarding the cut in the order of the fit is manual and hence very cumbersome. Unlike FD, one can decide where to make a cut in the PCA order in light curve reconstruction for all the light curves simply by looking at the cumulative percentages of variance in the data set. The optimal data compression using PCA is enormous, a fact that is quite relevant with the larger databases of the future.
PCA has also the advantage of preferential removal of noise from the light curve data and isolating the bogus light curves, whereas for precise Fourier decomposition, one needs very well-defined and accurate light curves free from noisy, scattered data points and having a good phase coverage. The most significant PCs contain those features which are most strongly correlated in many of the light curves. Therefore, the noise that is uncorrelated with any other features will be represented in the less significant components. Also, by retaining only the most significant PCs to represent the light curves we achieve a data compression that preferentially removes the noise. PCA can be used to filter out bogus features in the data as it is sensitive to the relative frequency of occurrence of features in the data set (Bailer-Jones et al. 1998). However, one distinct disadvantage of PCA is that addition of a single light curve in the analysis requires the entire PCA to be redone.
In this paper, we show the use of PCA directly on the light
curve data of more than 17 000 stars
(RR Lyraes, Cepheids, Eclipsing binaries and Mira variables)
taken from the literature and different
existing databases. We also apply the FD method to these light
curves to determine the Fourier parameters. Denoising should be carried
out before the Fourier decomposition if the light curves are
noisy. However, the photometric error in the light curves in the case
of the present selected database is very small, i.e., the light curve
data have a good photometric accuracy (![]() 0.006-0.14 mag in the case of the OGLE
database and
0.006-0.14 mag in the case of the OGLE
database and ![]() 0.02-0.220 mag
in the case of the ASAS database). To investigate the
noise in the light curves, we have calculated the unit-lag
auto-correlation function on the residual light curves. The
auto-correlations are found to be
0.02-0.220 mag
in the case of the ASAS database). To investigate the
noise in the light curves, we have calculated the unit-lag
auto-correlation function on the residual light curves. The
auto-correlations are found to be ![]() 1. Therefore no denoising has been carried out.
However, in some light curves there were outliers present.
To remove these outliers, we used a robust multi-pass non
linear fitting
algorithm in IDL (Interactive Data Language). We use light curves
(magnitudes at different epochs) as input to PCA and compare the
relative performance of the ability of PCA in finding resonances in
Cepheids and in the classification of different types of variables as
compared to the FD method. We have, therefore, performed
independent automated Fourier analysis of all the data sets described
in the paper using a computer code developed by us.
1. Therefore no denoising has been carried out.
However, in some light curves there were outliers present.
To remove these outliers, we used a robust multi-pass non
linear fitting
algorithm in IDL (Interactive Data Language). We use light curves
(magnitudes at different epochs) as input to PCA and compare the
relative performance of the ability of PCA in finding resonances in
Cepheids and in the classification of different types of variables as
compared to the FD method. We have, therefore, performed
independent automated Fourier analysis of all the data sets described
in the paper using a computer code developed by us.
Another aim of this paper is to analyze the performance of PCA as a fast, automated and unsupervised classification tool for variable stars. Since one of the important aspects of this paper is to do a preliminary PCA based classification in an unsupervised way on a larger sets of astronomical data, we explore the possibility of its use for future databases. PCA can be used for preliminary classification of variable stars such as classification between pulsating stars and eclipsing binaries and different variability classes.
We present the Fourier decomposition technique using the Levenberg-Marquardt algorithm for non-linear least square fitting (Press et al. 1992) in Sect. 2. We also describe the unit-lag auto-correlation function for finding the optimal order of the fit. Section 3 describes the PCA for dimensionality reduction and light curve reconstruction. Section 4 describes the results obtained by the FD and PCA techniques when applied to study the structure of Cepheid light curves. In addition, we compare the relative performance of FD and PCA for classification of various variability classes in the database selected for the present analysis. In Sect. 5, we present the important conclusions of the study.
2 Fourier decomposition technique
Since the light curves of the selected ensemble of variable stars are
periodic, they can
be written as a sum of cosine and sine series:
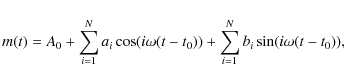
|
(1) |
where m(t) is the observed magnitude at time t, A0 is the mean magnitude, ai, bi are the amplitude components of
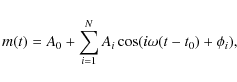
|
(2) |
where
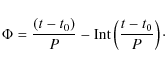
|
(3) |
The value of
|
(4) |
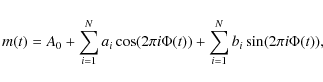
![\begin{displaymath}%
m(t) = A_{0}+\sum_{i=1}^{N} A_{i} \cos [2\pi i \Phi(t)+\phi_{i}],
\end{displaymath}](/articles/aa/full_html/2009/45/aa12851-09/img18.png)
|
(5) |
with relative Fourier parameters as

where i > 1. The combination of coefficients Ri1,
The estimation of the optimal number of terms to be used in
the Fourier decomposition of the individual light curve is not
straightforward. As has been pointed out by Petersen (1986), if N
is chosen too small, a larger number of Fourier parameters can be
calculated from a given observation and the resulting parameters will
have systematic deviations from the best estimate. On the
other hand, if N is chosen too large, we
are fitting the noise. Following Baart (1982), Petersen (1986) adopted the
calculation of the unit-lag auto-correlation of the sequence of the
residuals in order to decide the right N so
that the residuals consist of noise only. It as
defined as

where vj is the
![\begin{eqnarray*}v=m(t)-[A_{0}+\sum_{i=1}^{N} A_{i} \cos (2\pi i \Phi(t)\ + \phi_{i})].
\end{eqnarray*}](/articles/aa/full_html/2009/45/aa12851-09/img24.png)
It should be noted that for the calculation of
![\begin{displaymath}%
{\it\rho}_{\rm c}=\rho(cut)=[2(n-1)]^{-1/2}.
\end{displaymath}](/articles/aa/full_html/2009/45/aa12851-09/img29.png)
|
(6) |
While computing the Fourier parameters of all the light curve data selected for the present analysis we have taken care that Baart's condition is satisfied. The optimal order of the fit for RRc, RRab, FU Cepheids (OGLE), first overtone (FO) Cepheids, eclipsing binaries and Mira variables are 3, 5, 12, 10, 4 and 4 respectively. The longer period data for FU Cepheids from Martin et al. (1979) and Moffett et al. (1998) are fitted with the fifth order of the fit because of the relatively small numbers of data points. A typical example of a fitted light curve of all types of variables with the optimal order of the fit is shown in Fig. 2.
All the data sets in Table 1
are finally fitted with the optimal order of the fit and the fitted
light curves are used to derive the Fourier phase and amplitude
parameters from the Fourier
coefficients. Figure 1
shows the fitted light curves of FU Cepheids. Although the
number of data points for the longer periods are less, the phase
coverage is sufficient to do the Fourier decomposition. Although the
phase coverage is poor, the fits are reasonably good. The lower right
panel shows an example of a short period fundamental mode Cepheid from
the OGLE-III database which has a good phase coverage. ![]() is
the chi square per degree of freedom (
is
the chi square per degree of freedom (![]() )
of the fit. The degree of freedom (
)
of the fit. The degree of freedom (![]() )
is the number of data points minus the number of parameters of the fit.
The Fourier decomposition parameters (ai,
bi) for
Cepheids have been computed based on the optimal order of the fit by
the calculation of the unit-lag auto-correlation function
)
is the number of data points minus the number of parameters of the fit.
The Fourier decomposition parameters (ai,
bi) for
Cepheids have been computed based on the optimal order of the fit by
the calculation of the unit-lag auto-correlation function
![\begin{figure}
\par\includegraphics[height=9cm,width=8.5cm,clip]{12851fg1.eps}
\end{figure}](/articles/aa/full_html/2009/45/aa12851-09/img32.png)
|
Figure 1: Fitted light curves for fundamental mode long period Cepheids from Moffett et al. (1998). |
| Open with DEXTER | |
![\begin{figure}
\par\includegraphics[height=8.8cm,width=8.8cm,clip]{12851fg2.eps}
\end{figure}](/articles/aa/full_html/2009/45/aa12851-09/img33.png)
|
Figure 2: Fitted light curves of different classes of variables used in the analysis obtained with the optimal order of the fit. The caption at the top of each panel shows the variable name, period and type of variable respectively. We have RR Lyrae variables (RRc, RRab), Cepheid variables (Fundamental mode (FU) and first overtone (FO)), eclipsing binaries (EB) and Mira variables (MIRA). |
| Open with DEXTER | |
3 Principal component analysis
The principal component analysis transforms the original set
of p variables by an orthogonal
transformation to a new set of uncorrelated variables or principal
components (PCs). It involves a
simple rotation from the original axes to the new ones resulting in
principal components in decreasing order of importance. The first few q components
(![]() )
usually contain most of the variation in the original data (Chatfield
& Collins 1980;
Murtagh & Heck 1987).
This feature of the PCA has been used in astronomical data analysis
primarily for the purpose of reducing the dimensionality of the data
and as a preprocessor for other automated techniques like artificial
neural networks (ANN). The application of PCA to the light curve
analysis of variable stars has been limited to a few studies (Hendry
et al. 1999;
Kanbur et al. 2002,
2004; Tanvir et al. 2005).
In the following, we briefly describe the transformation.
)
usually contain most of the variation in the original data (Chatfield
& Collins 1980;
Murtagh & Heck 1987).
This feature of the PCA has been used in astronomical data analysis
primarily for the purpose of reducing the dimensionality of the data
and as a preprocessor for other automated techniques like artificial
neural networks (ANN). The application of PCA to the light curve
analysis of variable stars has been limited to a few studies (Hendry
et al. 1999;
Kanbur et al. 2002,
2004; Tanvir et al. 2005).
In the following, we briefly describe the transformation.
Let mij
be the p magnitudes corresponding to n
light curves. Let us define the n ![]() p matrix by X
= xij,
p matrix by X
= xij,

with

and

where
|
(7) |
with the axis of maximum variance being the largest eigenvector
| (8) |
The next (second) axis is to be orthogonal to the first and another solution of Eq. (8) gives the second largest eigenvalue
Let us suppose that the first q principal
components are sufficient to retain the information on the original p variables.
Therefore, we now have a (p ![]() q)
matrix
q)
matrix ![]() of
eigenvectors. The projection vector
of
eigenvectors. The projection vector ![]() onto the q principal components can be
found by
onto the q principal components can be
found by

|
(9) |
where

and can be represented by

|
(10) |
We obtain the final light curve
With the phase (![]() )
as the epoch for each light curve available from Eq. (3), we
interpolate and obtain 100 mag for phase 0
to 1 in steps of 0.01. Therefore, each light curve
now consists of 100 data points (magnitudes) normalized to
unity. The input to the PCA are these 100 points of magnitudes
for each of the light curves. We also emphasize that while applying PCA
to the phased magnitudes of light curves, Fourier coefficients are not
used to interpolate the light curves. We have used standard
interpolation routines in IDL to generate interpolated magnitudes in a
light curve. Two examples of the result of interpolation are shown in
Fig. 3.
There are 223 actual data points for the Mira variable (lower
panel) and 100 interpolated magnitudes have been obtained.
)
as the epoch for each light curve available from Eq. (3), we
interpolate and obtain 100 mag for phase 0
to 1 in steps of 0.01. Therefore, each light curve
now consists of 100 data points (magnitudes) normalized to
unity. The input to the PCA are these 100 points of magnitudes
for each of the light curves. We also emphasize that while applying PCA
to the phased magnitudes of light curves, Fourier coefficients are not
used to interpolate the light curves. We have used standard
interpolation routines in IDL to generate interpolated magnitudes in a
light curve. Two examples of the result of interpolation are shown in
Fig. 3.
There are 223 actual data points for the Mira variable (lower
panel) and 100 interpolated magnitudes have been obtained.
4 Analysis of light curves
In the following analysis, we compare the capabilities of FD and PCA for structural analysis of Cepheids and the classification accuracy for different classes of variable stars.
4.1 Structural analysis and classification
4.1.1 Fundamental mode (FU) Cepheids
We use the light curve data for 1829 FU classical Cepheids from various sources as mentioned in Table 1 (Data set IIA+IIB+IIC). The majority of the data used in the analysis are from the OGLE database. The Fourier decomposition of all the 1829 Cepheid light curves was independently done by us for the calculation of the Fourier decomposition parameters as described in Sect. 2. We verified that all the Cepheid light curves selected in the present study give a satisfactory light curve shape with no numerical bumps or deviations when reconstructed using the Fourier parameters.
PCA is performed on an input matrix consisting of
a 1829 ![]() 100 array corresponding to 100 mag from phase 0
to 1 for 1829 FU Cepheids. The result of the
PCA output is shown in
Table 2.
We see that first 10 PCs contain nearly 90 percent of
the variance in the data. Figure 4 shows the
reconstruction of four FU Cepheid light curves using the
first 1, 3, 7 and 10 PCs.
100 array corresponding to 100 mag from phase 0
to 1 for 1829 FU Cepheids. The result of the
PCA output is shown in
Table 2.
We see that first 10 PCs contain nearly 90 percent of
the variance in the data. Figure 4 shows the
reconstruction of four FU Cepheid light curves using the
first 1, 3, 7 and 10 PCs.
![\begin{figure}
\par\includegraphics[height=8.5cm,width=8.5cm,clip]{12851fg3.eps}
\end{figure}](/articles/aa/full_html/2009/45/aa12851-09/img56.png)
|
Figure 3: Examples of interpolation of magnitudes for 100 points. The upper panel shows the light curve with 100 interpolated data points for the OGLE longer period eclipsing binary while the lower panel shows the interpolated data of a long period Mira variable from the ASAS database. The lighter points denote the interpolated data while the bigger black dots represent the original data. |
| Open with DEXTER | |
Table 2:
The first 10 eigenvectors, their percentage variance and the cumulative
percentage of variance of 1829 fundamental mode Cepheids. The
input matrix is an 1829 ![]() 100 array.
100 array.
![\begin{figure}
\par\includegraphics[height=9cm,width=8.5cm,clip]{12851fg4.eps}
\end{figure}](/articles/aa/full_html/2009/45/aa12851-09/img57.png)
|
Figure 4: Reconstruction of FU Cepheid light curves using the first 1, 3, 7 and 10 principal components. The input matrix is an array of 1829 rows (stars) and 100 columns (magnitudes from phase 0 to 1). The black dots represent the original 100 interpolated data points normalized to unit magnitude. |
| Open with DEXTER | |
![\begin{figure}
\par\includegraphics[height=8.5cm,width=8.5cm,clip]{12851fg5.eps}
\end{figure}](/articles/aa/full_html/2009/45/aa12851-09/img58.png)
|
Figure 5:
Fourier parameters R21, R31,
|
| Open with DEXTER | |
![\begin{figure}
\par\includegraphics[height=8.8cm,width=8.8cm,clip]{12851fg6.eps}
\end{figure}](/articles/aa/full_html/2009/45/aa12851-09/img59.png)
|
Figure 6: First two PCs as a function of log (Period) for the 1829 FU Cepheids (Data set IIA+IIB+IIC, Table 1). The Fourier parameters for the I band stars and V band stars are marked with filled circles and filled triangles respectively. |
| Open with DEXTER | |
Kanbur et al. (2002)
have tried to explain the resonances using the PCA on the Fourier
coefficients (
ai,
bi). But
due to the relatively smaller number of data points, they did not give
any definite conclusions about some of the resonances suggested by
Antonello & Morelli (1996)
in the period range 1.38 < ![]() < 1.43. By
doing the PCA analysis of the same data as used by Antonello
& Morelli (1996),
Kanbur et al. (2002)
could not find any feature in that period range. Based on the available
light curves covering a wide range of periods, we have plotted R21,
R31,
< 1.43. By
doing the PCA analysis of the same data as used by Antonello
& Morelli (1996),
Kanbur et al. (2002)
could not find any feature in that period range. Based on the available
light curves covering a wide range of periods, we have plotted R21,
R31, ![]() ,
,
![]() versus
versus
![]() in
Fig. 5.
It is evident from the plots that there is a definite
structural change in the Fourier coefficients at periods
in
Fig. 5.
It is evident from the plots that there is a definite
structural change in the Fourier coefficients at periods ![]()
![]() 1.0 and 1.5, the latter being close to the period range
1.38 <
1.0 and 1.5, the latter being close to the period range
1.38 < ![]() <
1.43 suggested by Antonello & Morelli (1996). We see that
the Fourier decomposition parameters R21
and R31 decrease
until
<
1.43 suggested by Antonello & Morelli (1996). We see that
the Fourier decomposition parameters R21
and R31 decrease
until ![]()
![]() 1.0, increase thereafter until
1.0, increase thereafter until ![]()
![]() 1.5 and after that R21 and R31
fall gradually again until
1.5 and after that R21 and R31
fall gradually again until ![]() .
Similarly in the
.
Similarly in the ![]() and
and ![]() plane,
we see a sharp discontinuity around
plane,
we see a sharp discontinuity around ![]()
![]() 1. The sharp and the more prominent discontinuity around
1. The sharp and the more prominent discontinuity around ![]()
![]() 1.0 is reflected in both
1.0 is reflected in both ![]() and
and ![]() plots,
whereas the other changes in the light curve
structures around the period
plots,
whereas the other changes in the light curve
structures around the period ![]()
![]() 1.5 are visible in all the Fourier parameter plots.
1.5 are visible in all the Fourier parameter plots.
In Fig. 6
we plot the first two PCs and PC1 ![]() PC2 (PC1
PC2 (PC1 ![]() 2)
against
2)
against ![]() .
For PC1, PC2 and PC1
.
For PC1, PC2 and PC1 ![]() 2, a discontinuity
around
2, a discontinuity
around ![]() =
1.0 is visible. PC1, PC2 and PC1
=
1.0 is visible. PC1, PC2 and PC1 ![]() 2 clearly show a
change around the period
2 clearly show a
change around the period ![]()
![]() 1.5.
But the discontinuity around
1.5.
But the discontinuity around ![]()
![]() 1
as revealed by the Fourier parameters
1
as revealed by the Fourier parameters ![]() and
and ![]() in Fig. 5
is much more pronounced compared to the PC plots.
in Fig. 5
is much more pronounced compared to the PC plots.
Kanbur et al. (2002),
using the PCA analysis on the Fourier coefficients, did not find any
structure changes in the period range ![]() <
1.43. Using PCA on a larger light curve data set, we have found that in
fact there are structural changes around
<
1.43. Using PCA on a larger light curve data set, we have found that in
fact there are structural changes around ![]()
![]() 1
and 1.5 and hence there may exist resonances around these
periods. While the resonance around the period
1
and 1.5 and hence there may exist resonances around these
periods. While the resonance around the period ![]()
![]() 1
is well-known, the first two PCs and PC1
1
is well-known, the first two PCs and PC1 ![]() 2 show a change in
the light curve structure around
2 show a change in
the light curve structure around ![]() = 1.5. It
is difficult to pinpoint the exact location of the change in structure
because of fewer stars in the period around
= 1.5. It
is difficult to pinpoint the exact location of the change in structure
because of fewer stars in the period around ![]()
![]() 1.5. Model calculations are necessary to confirm the existence of this
resonance. Further, Antonello & Poretti (1996) also used a
number of data points of the longer period side and found some evidence
of a decrease of R21
at longer periods around (
1.5. Model calculations are necessary to confirm the existence of this
resonance. Further, Antonello & Poretti (1996) also used a
number of data points of the longer period side and found some evidence
of a decrease of R21
at longer periods around (![]()
![]() 2).
It is difficult to confirm the existence of such a resonance
from either FD or PCA although we see some change in trend in the first
two PCs around this period. Therefore, although there are changes in
the light curve structures around the periods
2).
It is difficult to confirm the existence of such a resonance
from either FD or PCA although we see some change in trend in the first
two PCs around this period. Therefore, although there are changes in
the light curve structures around the periods ![]()
![]() 1.5 and 2.10 days, one cannot confirm the existence
of resonances around these periods. Such information about these
resonances are generally derived from the combined photometric and
spectroscopic observations and radiative hydrodynamical model
calculations (Kienzle et al. 1999).
1.5 and 2.10 days, one cannot confirm the existence
of resonances around these periods. Such information about these
resonances are generally derived from the combined photometric and
spectroscopic observations and radiative hydrodynamical model
calculations (Kienzle et al. 1999).
![\begin{figure}
\par\includegraphics[height=8.5cm,width=8.5cm,clip]{12851fg7.eps}
\end{figure}](/articles/aa/full_html/2009/45/aa12851-09/img63.png)
|
Figure 7:
Fourier parameters R21, R31,
|
| Open with DEXTER | |
4.1.2 First overtone (FO) Cepheids
The light curves of FO Cepheids show a discontinuity in the Fourier
phase parameters ![]() and
and ![]() around a period of
around a period of ![]() 3.2 days.
This is shown in Fig. 7
for the OGLE data (Data set III) of
1228 FO Cepheids. This feature was interpreted as the
signature of 2:1 resonance between the first and fourth
overtones (Antonello & Poretti 1986). This feature
was however not reproduced in the hydrodynamical models and in the
Fourier parameters of highly accurate observational radial velocity
curves of FO Cepheids (Kienzle et al. 1999). By means of
hydrodynamical models for FO Cepheids, Kienzle et al.
(1999) have
shown that the 3.2 day is not the resonance, the true
resonance is at around 4.5 d and 3.2 d is not a
resonance. On the other hand Buchler et al. (1996) suggested that
for a consistent picture on the evolutionary mass-luminosity relations,
the FO Cepheid resonance should occur at P =
4.3 days. Therefore, not all such structures in the
photometric Fourier parameters need to be connected to the resonances.
3.2 days.
This is shown in Fig. 7
for the OGLE data (Data set III) of
1228 FO Cepheids. This feature was interpreted as the
signature of 2:1 resonance between the first and fourth
overtones (Antonello & Poretti 1986). This feature
was however not reproduced in the hydrodynamical models and in the
Fourier parameters of highly accurate observational radial velocity
curves of FO Cepheids (Kienzle et al. 1999). By means of
hydrodynamical models for FO Cepheids, Kienzle et al.
(1999) have
shown that the 3.2 day is not the resonance, the true
resonance is at around 4.5 d and 3.2 d is not a
resonance. On the other hand Buchler et al. (1996) suggested that
for a consistent picture on the evolutionary mass-luminosity relations,
the FO Cepheid resonance should occur at P =
4.3 days. Therefore, not all such structures in the
photometric Fourier parameters need to be connected to the resonances.
On the other hand, by analyzing the Fourier coefficients of a
large number of FO LMC Cepheids in the
OGLE III database, Soszynski et al. (2008) found a change
in the photometric Fourier parameters around a period of ![]() 0.35 d.
The short-period discontinuity at 0.35 d can be explained by
the presence of the 2:1 resonance between the first and fifth
overtones in stars with masses of about 2.5
0.35 d.
The short-period discontinuity at 0.35 d can be explained by
the presence of the 2:1 resonance between the first and fifth
overtones in stars with masses of about 2.5 ![]() (Dziembowski & Smolec 2009).
(Dziembowski & Smolec 2009).
In Fig. 7,
we plot the Fourier parameters R21,
![]() ,
R31,
,
R31, ![]() for 1228 LMC FO Cepheids (Data
set III in Table 1).
The optimal order of the fit to the Fourier method has been found to
be 10. There is a definitive marked structure of
discontinuity in the Fourier plots at periods around 0.35 and
3.2 days.
for 1228 LMC FO Cepheids (Data
set III in Table 1).
The optimal order of the fit to the Fourier method has been found to
be 10. There is a definitive marked structure of
discontinuity in the Fourier plots at periods around 0.35 and
3.2 days.
We now try to find out whether our PCA procedure can extract
the information about the structure changes. We carry out PCA on
a 1228 ![]() 100 matrix of 1228 LMC FO Cepheids with
100 I band magnitudes
corresponding to phase 0 to 1 in steps
of 0.01. Figure 8
shows the plot of first three PCs versus the period. A sharp
discontinuity around the shorter period end near 0.35 day is
evident in all the PC plots. Also, some change in the light
curve structure seems to occur near to 4 days for all the
PC plots. There is no change in the light curve structure
around 3.2 days in PC2 and PC3 whereas in PC1, there is a
change in the light curve shape around a
period of
100 matrix of 1228 LMC FO Cepheids with
100 I band magnitudes
corresponding to phase 0 to 1 in steps
of 0.01. Figure 8
shows the plot of first three PCs versus the period. A sharp
discontinuity around the shorter period end near 0.35 day is
evident in all the PC plots. Also, some change in the light
curve structure seems to occur near to 4 days for all the
PC plots. There is no change in the light curve structure
around 3.2 days in PC2 and PC3 whereas in PC1, there is a
change in the light curve shape around a
period of ![]() 3.2 days.
3.2 days.
Thus, we see that the Fourier parameters performed better in bringing out the structural changes in FU Cepheids while for FO Cepheids the performance of FD and PCA techniques is similar.
![\begin{figure}
\par\includegraphics[height=10.5cm,width=8cm,clip]{12851fg8.eps}
\end{figure}](/articles/aa/full_html/2009/45/aa12851-09/img65.png)
|
Figure 8: First three PCs versus period for LMC overtone Cepheids (data set III). The change in the light curve shape as shown in Fig. 7 is also seen from the PC plots. The input matrix is an array of 1228 rows (stars) and 100 columns (magnitudes from phase 0 to 1). |
| Open with DEXTER | |
4.1.3 Classification
We now explore the possibility of classification of different classes
of variable stars on the basis of FD & PCA. We use the Fourier
decomposition parameter R21
and the first principal component PC1 to classify all the
17 606 stars of different variability classes in
Table 1.
In Fig. 9
we plot the Fourier parameter R21
versus ![]() .
As may be seen, the Mira variables form a separate group
because of their longer periods and not because of separation
in R21. However, in
the intermediate period range (1 to 100 days),
eclipsing binaries have distinct R21 values
from other classes of variables. Figure 10 shows the plot of
.
As may be seen, the Mira variables form a separate group
because of their longer periods and not because of separation
in R21. However, in
the intermediate period range (1 to 100 days),
eclipsing binaries have distinct R21 values
from other classes of variables. Figure 10 shows the plot of ![]() to demonstrate the complete range of R21
for 4085 eclipsing binaries. In the short period range there
is a considerable overlap between the FO Cepheids and
RRc stars. This degeneracy in the Fourier parameter R21
in the short period range cannot be lifted and the classification
accuracy cannot be improved by further manipulation.
to demonstrate the complete range of R21
for 4085 eclipsing binaries. In the short period range there
is a considerable overlap between the FO Cepheids and
RRc stars. This degeneracy in the Fourier parameter R21
in the short period range cannot be lifted and the classification
accuracy cannot be improved by further manipulation.
![\begin{figure}
\par\includegraphics[height=8.8cm,width=8.6cm,clip]{12851fg9.eps}
\end{figure}](/articles/aa/full_html/2009/45/aa12851-09/img67.png)
|
Figure 9: The classification based on R21 obtained from the FD method. L and S denote the LMC and SMC objects respectively. |
| Open with DEXTER | |
![\begin{figure}
\includegraphics[height=8.8cm,width=8.8cm,clip]{12851fg10.eps}
\end{figure}](/articles/aa/full_html/2009/45/aa12851-09/img68.png)
|
Figure 10:
The classification based on |
| Open with DEXTER | |
![\begin{figure}
\par\includegraphics[height=8.8cm,width=8.8cm,clip]{12851fg11.eps}
\end{figure}](/articles/aa/full_html/2009/45/aa12851-09/img69.png)
|
Figure 11: The classification based on PC1 obtained from PCA of 100 interpolated magnitudes for the phase from 0 to 1 in steps of 0.01. |
| Open with DEXTER | |
![\begin{figure}
\par\includegraphics[height=8.6cm,width=8.8cm,clip]{12851fg12.eps}
\end{figure}](/articles/aa/full_html/2009/45/aa12851-09/img70.png)
|
Figure 12: The classification between RR Lyraes (RRab & RRc) and Cepheids (FU & FO) based on PC1. |
| Open with DEXTER | |
We carry out the PCA on a 17 606 ![]() 100 matrix of 17 606 stars, each star having
100 values of magnitudes in their light curves. We have used
the first principal component (PC1) as it contains the maximum
variance in this data set. As in the case of FD, the PCA is
able to separate the Mira variables and the eclipsing binaries and the
separation is more effective in the case of PCA (Fig. 11). The plot of PC1-
100 matrix of 17 606 stars, each star having
100 values of magnitudes in their light curves. We have used
the first principal component (PC1) as it contains the maximum
variance in this data set. As in the case of FD, the PCA is
able to separate the Mira variables and the eclipsing binaries and the
separation is more effective in the case of PCA (Fig. 11). The plot of PC1-![]() space
also shows that although PC1 is able to separate the eclipsing binaries
and Mira variables, there is some overlap in the regions dominated by
RR Lyraes and Cepheids. In the next step, we choose only the
samples of RR Lyraes (RRab & RRc) and
Cepheids (FU & FO) that could not be separated well by
the use of PCA on the whole data set. We now run PCA on
10 643 light curves (Data
set IA+IB+IIA+IIB+IIC+III) of RR Lyraes and Cepheids.
The result of PCA on this 10 643
space
also shows that although PC1 is able to separate the eclipsing binaries
and Mira variables, there is some overlap in the regions dominated by
RR Lyraes and Cepheids. In the next step, we choose only the
samples of RR Lyraes (RRab & RRc) and
Cepheids (FU & FO) that could not be separated well by
the use of PCA on the whole data set. We now run PCA on
10 643 light curves (Data
set IA+IB+IIA+IIB+IIC+III) of RR Lyraes and Cepheids.
The result of PCA on this 10 643 ![]() 100 array is shown in Fig. 12. It may
be noted that PC1 is able to separate FU Cepheids and
RRab stars to a large extent while there is some overlap
between RRc and FO Cepheids in a narrow period range
(0.25-0.5 d). We hope to return to this degeneracy problem in
a subsequent study in which we also intend to increase the sample by
adding more classes of variables.
100 array is shown in Fig. 12. It may
be noted that PC1 is able to separate FU Cepheids and
RRab stars to a large extent while there is some overlap
between RRc and FO Cepheids in a narrow period range
(0.25-0.5 d). We hope to return to this degeneracy problem in
a subsequent study in which we also intend to increase the sample by
adding more classes of variables.
5 Conclusions
Fourier decomposition is a trusted and much applied technique for analyzing the behaviour of light curves of periodic variable stars. It is well suited for studying individual light curves as the Fourier parameters can be easily determined. However, when the purpose is to tag a large number of stars for their variable class using photometric data from large surveys, the technique becomes slow and cumbersome and each light curve has to be fitted individually and then analyzed. The same is true if the aim is to look for resonances in the light curves in an automated way for a large class of pulsators. It is, therefore, desirable to look for methods that are reliable, automated and unsupervised and can be applied to the available light curve data directly.
Some attempts have been made in the recent past to use the well known PCA for the light curve analysis, but the major drawback of these studies was that they required the calculation of the Fourier parameters which then went as input to the PCA. This meant that the PCA, which was supposed to replace the Fourier decomposition, in fact relied on it. Also for precise and accurate determination of Fourier parameters, the light curve should have good phase coverage and less noisy data points so that the fit to the light curve is good enough to rely on its parameters. But this is not the case for every light curve data generated from the automated surveys. Sometimes there are gaps and/or outliers in the data. The fitting of such a light curve will give a wrong estimation of the Fourier parameters.
In this paper we have used the original light curve data for computation of the principal components. It involves four simple steps: a) to phase each light curve between 0 to 1 with the respective period in days. b) Interpolation of light curve magnitudes in short steps (0.01) between phase 0 to 1 to obtain 100 points of magnitude for each light curve. c) Normalize the magnitudes between 0 and 1 for each of the light curves and d) to do PCA on the normalized magnitudes of 100 points for all the light curves.
The PCA is then used to analyse the structure of the light curves of classical Cepheids and the results compared with those obtained from the analysis of the Fourier parameters. In addition, the two techniques are compared regarding their ability to classify stars into different variability classes.
We applied the PCA technique to study the structure of light
curves of fundamental and first overtone Cepheids. By choosing a large
data set of a large range of periods, we have shown that the
structure of the fundamental mode Cepheid light curves shows
significant changes around the periods ![]()
![]() 1
and 1.5. The resonance around the period
1
and 1.5. The resonance around the period ![]()
![]() 1
is well known. The
first two PCs also show that the behavior of the light curves changes
around the period
1
is well known. The
first two PCs also show that the behavior of the light curves changes
around the period ![]()
![]() 1.5 which is close to the resonance suggested by Antonello &
Poretti (1996) in the period range 1.38 <
1.5 which is close to the resonance suggested by Antonello &
Poretti (1996) in the period range 1.38 < ![]() <
1.43. There is some evidence of a structural change in the light curve
shape around the period
<
1.43. There is some evidence of a structural change in the light curve
shape around the period ![]()
![]() 2.0 also but this can be confirmed only when longer period data become
available. We find that the Fourier parameters performed better in
bringing out the discontinuities in FU light curves at periods
around
2.0 also but this can be confirmed only when longer period data become
available. We find that the Fourier parameters performed better in
bringing out the discontinuities in FU light curves at periods
around ![]()
![]() 1.
1.
For the first overtone LMC Cepheids, we find a discontinuity
at a shorter period of ![]() 0.35 d.
The first few PCs also show a clear trend of structural changes of the
first overtone Cepheids at this short period. For FO Cepheids,
the performance of FD and PCA is similar in bringing out the structural
changes around a period of 0.35 days. We have been able to
find this feature because of the availability of a significant number
of light curves towards the shorter period end of the
LMC Cepheids in the OGLE database. The
PCA technique can easily find similar resonances in the
Galactic and SMC first overtone Cepheids as and when there is
substantial data available for the short period objects of
this class.
0.35 d.
The first few PCs also show a clear trend of structural changes of the
first overtone Cepheids at this short period. For FO Cepheids,
the performance of FD and PCA is similar in bringing out the structural
changes around a period of 0.35 days. We have been able to
find this feature because of the availability of a significant number
of light curves towards the shorter period end of the
LMC Cepheids in the OGLE database. The
PCA technique can easily find similar resonances in the
Galactic and SMC first overtone Cepheids as and when there is
substantial data available for the short period objects of
this class.
We have also demonstrated the ability of PCA and its distinct advantage over the FD method in classifying stars into different variability classes. Although alternative automated methods for variable star classification exist, the PCA based technique can be used as a first step in a hierarchical classification scheme because of its accuracy and efficiency.
The data compression ratio using PCA on the direct light curve data is enormous, a fact that has great relevance when dealing with large databases of the future. Also, we have shown some preliminary results of variable star classification for an ensemble of 17 606 stars selected in the present analysis. In a future paper, we will describe the application of the PCA technique to a larger, more diverse database by looking at the classification accuracy and errors.
The authors thank the anonymous referee for helpful comments which improved the presentation of the paper and Manabu Yuasa for correcting the first draft. Igor Soszynski is thanked for providing valuable information regarding the OGLE data. S.D. thanks Council of Scientific & Industrial Research (CSIR), Govt. of India, for a Senior Research Fellowship. H.P.S. thanks CRAL-Observatoire de Lyon for an invited Professorship.
References
- Antonello, E. 1994, A&A, 282, 835 [NASA ADS]
- Antonello, E., & Morelli, P. L. 1996, A&A, 314, 541 [NASA ADS]
- Antonello, E., & Poretti, E. 1986, A&A, 169, 149 [NASA ADS]
- Bailer-Jones, C. A. L., Irwin, M., & von Hippel, T. 1998, MNRAS, 298, 361 [NASA ADS] [CrossRef]
- Baart, M. L. 1982, IMA J. Num. Analysis, 2, 241 [CrossRef]
- Berdnikov, L. N. 2008, VizieR On-line Data Catalog: II/285, originally published in: Sternberg Astronomical Institute, Moscow
- Buchler, J. R., Kollath, Z., Beaulieu, J. P., et al. 1996, ApJ, 462, L83 [NASA ADS]
- Chatfield, C., & Collins, A. J. 1980, introduction to Multivariate Analysis (London: Chapman & Hall)
- Connolly, A. J., Szalay, A. S., Bershady, M. A., Kinney, A. L., & Calzetti, D. 1995, AJ, 110, 1071 [NASA ADS] [CrossRef]
- Debosscher, J., Sarro, L. M., Aerts, C., et al. 2007, A&A, 475, 1159 [NASA ADS] [CrossRef] [EDP Sciences]
- Dziembowski, W. A., & Smolec, R. 2009, Acta Astron., 59, 19 [NASA ADS]
- Folkes, S. R., Lahav, O., & Maddox, S. J. 1996, MNRAS, 283, 651 [NASA ADS]
- Francis, P. J., Hewett, P. C., Foltz, C. B., & Chaffee, F. H. 1992, ApJ, 398, 476 [NASA ADS] [CrossRef]
- Hendry, M. A., Tanvir, N. R., & Kanbur, S. M. 1999, ASP Conf. Ser. (San Francisco), 167, 192 [NASA ADS]
- Jin, H., Kim, S. -L., Lee, C. -U., et al. 2004, AJ, 126, 1847 [NASA ADS] [CrossRef]
- Kanbur, S. M., & Mariani, H. 2004, MNRAS, 355, 1361 [NASA ADS] [CrossRef]
- Kanbur, S. M., Iono, D., Tanvir, N. R., & Hendry, M. A. 2002, MNRAS, 329, 126 [NASA ADS] [CrossRef]
- Kienzle, F., Moskalik, P., Bersier, D., et al. 1999, A&A, 341, 818 [NASA ADS]
- Lahav, O., Naim, A., Sodré, L., Jr., & Storrie-Lombardie, M. C. 1996, MNRAS, 283, 207 [NASA ADS]
- Mantegazza, L., & Poretti, E. 1992, A&A, 261, 137 [NASA ADS]
- Martin, W. L., Warren, P. R., & Feast, M. W. 1979, MNRAS, 188, 139 [NASA ADS]
- Moffett, T. J., Gieren, W. P., Barnes, T. G. III, & Gomez, M. 1998, ApJS, 117, 135 [NASA ADS] [CrossRef]
- Moskalik, P., & Poretti, E. 2003, A&A, 398, 213 [NASA ADS] [CrossRef] [EDP Sciences]
- Murtagh, F., & Heck, A. 1987, Multivariate Data Analysis (Dordrecht: Reidel)
- Ngeow, C.-C, Kanbur, S. M., Nikolaev, S., et al. 2003, ApJ, 586, 959 [NASA ADS] [CrossRef]
- Petersen, J. O. 1986, A&A, 170, 59 [NASA ADS]
- Poretti, E. 2001, A&A, 371, 986 [NASA ADS] [CrossRef] [EDP Sciences]
- Press, W., Teukolsky, S., Vetterling, W., & Flannery, B. 1992, Numerical Recipes in FORTRAN, 2nd edn. (Cambridge Univ. Press)
- Sarro, L. M., Debosscher, J., López, M., & Aerts, C. 2009, A&A, 494, 739 [NASA ADS] [CrossRef] [EDP Sciences]
- Schaltenbrand, R., & Tammann, G. A. 1971, A&AS, 4, 265 [NASA ADS]
- Simon, N. R. 1979, A&A, 74, 30 [NASA ADS]
- Simon, N. R., & Lee, A. S. 1981, ApJ, 248, 291 [NASA ADS] [CrossRef]
- Singh, H. P., Gulati, R. K., & Gupta, R. 1998, MNRAS, 295, 312 [NASA ADS] [CrossRef]
- Sodré, L. Jr., & Cuevas, H. 1994, Vistas Astron., 38, 287 [NASA ADS] [CrossRef]
- Soszynski, I., Udalski, A., Szymanski, M., et al. 2002, Acta Astron., 52, 369 [NASA ADS]
- Soszynski, I., Udalski, A., Szymanski, M., et al. 2003, Acta Astron., 53, 93 [NASA ADS]
- Soszynski, I., Poleski, R., & Udalski, A. 2008, Acta Astron., 58, 163 [NASA ADS]
- Storrie-Lombardi, M. C., Irwin, M, J., von Hippel, T., & Storrie-Lombardi, L. J. 1994, Vistas Astron., 38, 331 [NASA ADS] [CrossRef]
- Tanvir, N. R., Hendry, M. A., Watkins, A., et al. 2005, MNRAS, 363, 749 [NASA ADS] [CrossRef]
- Udalski, A., Soszynski, I., Szymanski, M., et al. 1999, Acta Astron., 49, 437 [NASA ADS]
- Udalski, A., Soszynski, I., Szymanski, M. K., et al. 2008, Acta Astron., 58, 89 [NASA ADS]
- Wyrzykowski, L., Udalski, A., Kubiak, K., et al. 2003, Acta Astron., 53, 1 [NASA ADS] [CrossRef]
- Wyrzykowski, L., Udalski, A., Kubiak, K., et al. 2004, Acta Astron., 54, 1 [NASA ADS] [CrossRef]
All Tables
Table 1: Data selected for the present analysis.
Table 2:
The first 10 eigenvectors, their percentage variance and the cumulative
percentage of variance of 1829 fundamental mode Cepheids. The
input matrix is an 1829 ![]() 100 array.
100 array.
All Figures
|
|
Figure 1: Fitted light curves for fundamental mode long period Cepheids from Moffett et al. (1998). |
| Open with DEXTER | |
| In the text | |
|
|
Figure 2: Fitted light curves of different classes of variables used in the analysis obtained with the optimal order of the fit. The caption at the top of each panel shows the variable name, period and type of variable respectively. We have RR Lyrae variables (RRc, RRab), Cepheid variables (Fundamental mode (FU) and first overtone (FO)), eclipsing binaries (EB) and Mira variables (MIRA). |
| Open with DEXTER | |
| In the text | |
|
|
Figure 3: Examples of interpolation of magnitudes for 100 points. The upper panel shows the light curve with 100 interpolated data points for the OGLE longer period eclipsing binary while the lower panel shows the interpolated data of a long period Mira variable from the ASAS database. The lighter points denote the interpolated data while the bigger black dots represent the original data. |
| Open with DEXTER | |
| In the text | |
|
|
Figure 4: Reconstruction of FU Cepheid light curves using the first 1, 3, 7 and 10 principal components. The input matrix is an array of 1829 rows (stars) and 100 columns (magnitudes from phase 0 to 1). The black dots represent the original 100 interpolated data points normalized to unit magnitude. |
| Open with DEXTER | |
| In the text | |
|
|
Figure 5:
Fourier parameters R21, R31,
|
| Open with DEXTER | |
| In the text | |
|
|
Figure 6: First two PCs as a function of log (Period) for the 1829 FU Cepheids (Data set IIA+IIB+IIC, Table 1). The Fourier parameters for the I band stars and V band stars are marked with filled circles and filled triangles respectively. |
| Open with DEXTER | |
| In the text | |
|
|
Figure 7:
Fourier parameters R21, R31,
|
| Open with DEXTER | |
| In the text | |
|
|
Figure 8: First three PCs versus period for LMC overtone Cepheids (data set III). The change in the light curve shape as shown in Fig. 7 is also seen from the PC plots. The input matrix is an array of 1228 rows (stars) and 100 columns (magnitudes from phase 0 to 1). |
| Open with DEXTER | |
| In the text | |
|
|
Figure 9: The classification based on R21 obtained from the FD method. L and S denote the LMC and SMC objects respectively. |
| Open with DEXTER | |
| In the text | |
|
|
Figure 10:
The classification based on |
| Open with DEXTER | |
| In the text | |
|
|
Figure 11: The classification based on PC1 obtained from PCA of 100 interpolated magnitudes for the phase from 0 to 1 in steps of 0.01. |
| Open with DEXTER | |
| In the text | |
|
|
Figure 12: The classification between RR Lyraes (RRab & RRc) and Cepheids (FU & FO) based on PC1. |
| Open with DEXTER | |
| In the text | |
Copyright ESO 2009
Current usage metrics show cumulative count of Article Views (full-text article views including HTML views, PDF and ePub downloads, according to the available data) and Abstracts Views on Vision4Press platform.
Data correspond to usage on the plateform after 2015. The current usage metrics is available 48-96 hours after online publication and is updated daily on week days.
Initial download of the metrics may take a while.