| Issue |
A&A
Volume 507, Number 3, December I 2009
|
|
|---|---|---|
| Page(s) | 1585 - 1595 | |
| Section | Stellar structure and evolution | |
| DOI | https://doi.org/10.1051/0004-6361/200912686 | |
| Published online | 24 September 2009 | |
A&A 507, 1585-1595 (2009)
A VLT/FLAMES survey for massive binaries in Westerlund 1
I. First observations of luminous evolved
stars![[*]](/icons/foot_motif.png)
B. W. Ritchie1,2 - J. S. Clark1 - I. Negueruela3 - P. A. Crowther4
1 - Department of Physics and Astronomy, The Open University, Walton
Hall, Milton Keynes MK7 6AA, UK
2 - IBM United Kingdom Laboratories, Hursley Park, Winchester,
Hampshire SO21 2JN, UK
3 - Departamento de Física, Ingeniería de Sistemas y Teoría de la
Señal, Universidad de Alicante, Apdo. 99, 03080 Alicante,
Spain
4 - Department of Physics and Astronomy, University of Sheffield,
Sheffield S3 7RH, UK
Received 12 June 2009 / Accepted 17 September 2009
Abstract
Aims. Multiwavelength observations of the young
massive
cluster Westerlund 1 have revealed evidence for a large number
of
OB supergiant and Wolf-Rayet binaries. However, in most cases these
findings are based on the detection of secondary binary
characteristics, such as hard X-ray emission and/or non-thermal radio
spectra and hence provide little information on binary properties such
as mass ratio and orbital period. To overcome this shortcoming we have
initiated a long temporal baseline, multi-epoch radial velocity survey
that will provide the first direct constraints on these parameters.
Methods. VLT/FLAMES+GIRAFFE observations of Wd1 were
made on seven epochs from late-June to early-September 2008, covering ![]() 35 confirmed
members of Wd1 and
35 confirmed
members of Wd1 and ![]() 70
photometrically-selected candidate members. Each target was observed on
a minimum of three epochs, with brighter cluster members observed on
five (or, in a few cases, seven) occasions. Individual spectra cover
the 8484-9001 Å range, and strong Paschen-series absorption
lines
are used to measure radial velocity changes in order to identify
candidate binary systems for follow-up study.
70
photometrically-selected candidate members. Each target was observed on
a minimum of three epochs, with brighter cluster members observed on
five (or, in a few cases, seven) occasions. Individual spectra cover
the 8484-9001 Å range, and strong Paschen-series absorption
lines
are used to measure radial velocity changes in order to identify
candidate binary systems for follow-up study.
Results. This study presents first-epoch results
from twenty of
the most luminous supergiant stars in Wd1. Four new OB supergiant
members of Wd1 are identified, while statistically significant radial
velocity changes are detected in ![]() 60%
of the targets. W43a is identified as a short-period binary, while W234
and the newly-identified cluster member W3003 are probable
binaries and W2a is a strong binary candidate. The cool hypergiants
W243 and W265 display photospheric pulsations, while a number of
early-mid B supergiants display significant radial velocity changes of
60%
of the targets. W43a is identified as a short-period binary, while W234
and the newly-identified cluster member W3003 are probable
binaries and W2a is a strong binary candidate. The cool hypergiants
W243 and W265 display photospheric pulsations, while a number of
early-mid B supergiants display significant radial velocity changes of ![]() 15-25 km s-1
that we cannot distinguish between orbital or photospheric motion in
our initial short-baseline survey. When combined with existing
observations, we find 30% of our sample to be binary (6/20)
while
additional candidate binaries support a binary fraction amongst Wd1
supergiants in excess of
15-25 km s-1
that we cannot distinguish between orbital or photospheric motion in
our initial short-baseline survey. When combined with existing
observations, we find 30% of our sample to be binary (6/20)
while
additional candidate binaries support a binary fraction amongst Wd1
supergiants in excess of ![]() 40%,
a figure that is likely to increase as further data become available.
40%,
a figure that is likely to increase as further data become available.
Key words: stars: evolution - supergiants - binaries: general - techniques: radial velocities
1 Introduction
Despite direct observational confirmation of stars with dynamical
masses in excess of 80 ![]() (e.g. Rauw et al. 2005;
Schnurr et al. 2008),
the production of massive stars is poorly understood, largely as a
result of their intrinsic rarity, apparent rapidity of formation and
extreme extinction due to veiling by their natal envelopes. Moreover,
their production is problematic on theoretical grounds, primarily
because accretion rates must be both extreme in order to build the star
and yet must overcome the resultant radiation pressure. Hence it is not
clear if the process is simply a scaled up version of low mass
formation or whether it proceeds by a different mechanism (e.g. Bonnell & Bate 2005 and refs.
therein). An additional problem is that even if radiation pressure can
be overwhelmed, sufficient material must be present to accrete from in
order to yield the stars themselves (Davies
et al. 2006).
(e.g. Rauw et al. 2005;
Schnurr et al. 2008),
the production of massive stars is poorly understood, largely as a
result of their intrinsic rarity, apparent rapidity of formation and
extreme extinction due to veiling by their natal envelopes. Moreover,
their production is problematic on theoretical grounds, primarily
because accretion rates must be both extreme in order to build the star
and yet must overcome the resultant radiation pressure. Hence it is not
clear if the process is simply a scaled up version of low mass
formation or whether it proceeds by a different mechanism (e.g. Bonnell & Bate 2005 and refs.
therein). An additional problem is that even if radiation pressure can
be overwhelmed, sufficient material must be present to accrete from in
order to yield the stars themselves (Davies
et al. 2006).
Nevertheless, several differing scenarios have been advanced to surmount these difficulties. Disc mediated accretion has been suggested to overcome radiation pressure (Yorke & Sonnhalter 2002) but sufficient material must still be supplied to the protostar. One mechanism proposed to accomplish this is competitive accretion onto high mass protostars in cluster cores (Bonnell & Bate 2006). An alternative, which also circumvents the constraints imposed by radiation pressure, is that massive stars form as the result of stellar mergers (e.g. Bonnell et al. 1998; Davies et al. 2006), though both processes may be relevant (Bonnell & Bate 2005).
While direct observations of in situ massive star
formation are technically highly challenging, significant observational
constraints on this process exist. For instance, the finding that
massive stars appear to form in clusters (e.g. Zinnecker
et al. 1993; Clarke
et al. 2000) appears difficult to reconcile with
turbulent fragmentation of the molecular cloud leading to the
production of protostellar cores, since the resultant clump masses are
significantly lower than required to form massive O stars (Clark & Bonnell 2004). A second
constraint is provided by the observed binary fraction
and properties of massive stars; competitive accretion predicts their
formation via accretion onto wide low mass systems leading to massive
close binaries (![]() 1 AU;
Bonnell & Bate 2005),
while massive star formation via stellar mergers leads to a reduction
in the number of primordial binaries, and hence requires a very high
initial fraction. As such, recent observational results demonstrating a
large binary fraction amongst massive stars have the potential to
directly test current theories of star formation (e.g. García & Mermilliod 2001; Kiminki et al. 2007; Sana et al. 2008; Bosch et al. 2009; Clark et al. 2009a).
The properties of these populations, such as the distribution of
eccentricities, mass ratio and orbital separations place stringent
constraints on the production rates and channels of both high and low
mass X-ray binaries - and ultimately double degenerate systems - as
well as both type Ib/c and blue type II supernovae
and
potentially gamma ray bursters (Kobulnicky
& Fryer 2007 and refs. therein).
1 AU;
Bonnell & Bate 2005),
while massive star formation via stellar mergers leads to a reduction
in the number of primordial binaries, and hence requires a very high
initial fraction. As such, recent observational results demonstrating a
large binary fraction amongst massive stars have the potential to
directly test current theories of star formation (e.g. García & Mermilliod 2001; Kiminki et al. 2007; Sana et al. 2008; Bosch et al. 2009; Clark et al. 2009a).
The properties of these populations, such as the distribution of
eccentricities, mass ratio and orbital separations place stringent
constraints on the production rates and channels of both high and low
mass X-ray binaries - and ultimately double degenerate systems - as
well as both type Ib/c and blue type II supernovae
and
potentially gamma ray bursters (Kobulnicky
& Fryer 2007 and refs. therein).
The starburst cluster Westerlund 1 (hereafter Wd1; Westerlund 1961) contains a rich
population of massive, evolved stars including Wolf-Rayets, OB
supergiants, yellow hypergiants, a luminous blue variable, and red
supergiants
(Clark et al. 2005).
This unique population has been the subject of extensive study in
recent years at radio (Dougherty
& Clark 2008), infra-red (Crowther
et al. 2006), visual (Clark
& Negueruela 2002; Clark
et al. 2005; Negueruela
et al. 2009) and X-ray wavelengths (Skinner et al. 2006; Clark et al. 2008). These
studies have shown that 17 of the 24 identified Wolf-Rayet
stars are binary (Crowther
et al. 2006; Clark
et al. 2008), while photometric (Bonanos 2007) and X-ray (Clark et al. 2008)
studies also imply a significant binary fraction amongst the
transitional OB supergiants that are the evolutionary
precursors
of the Wolf-Rayet population. However, the existing studies are largely
based on secondary binary diagnostics such as the presence of
non-thermal radio emission, hard and/or high luminosity X-ray emission
and a significant near-mid IR excess, all of which are thought
to
be observational signatures of colliding wind binaries (CWBs).
Moreover, the single epoch observations used to identify CWBs provide
little information on the nature of the binary, save that the secondary
is expected to be massive enough to support a powerful stellar wind![]() . Binaries have been
directly detected in only a few cases, e.g. the eclipsing binaries
W13 and W36 (Bonanos
2007) or the double-lined spectroscopic binary W10 (Negueruela et al. 2009).
. Binaries have been
directly detected in only a few cases, e.g. the eclipsing binaries
W13 and W36 (Bonanos
2007) or the double-lined spectroscopic binary W10 (Negueruela et al. 2009).
Consequently we have initiated a long temporal baseline,
multi-epoch
VLT/FLAMES spectroscopic radial velocity (RV) survey designed
to
identify and characterise binaries within Wd1. The sensitivity offered
is high enough to identify both short- and long-period binaries and is
sensitive to low mass companions within short period systems. This is
the first of three
planned papers, describing target selection, data reduction and
analysis for our survey, and presenting the first results from a subset
of the VLT/FLAMES dataset containing a sample of luminous, evolved
supergiants observed on five epochs between 29/06/2008 and 04/09/2008.
Paper II will present analysis of our full dataset![]() , consisting of
, consisting of ![]() 105
spectroscopically-and photometrically-selected targets observed on a
minimum of six epochs during 2008 and 2009. A final paper will present
follow-up observations and numerical modeling of the observed RV
variability (cf. Kobulnicky &
Fryer 2007)
aimed at placing limits on the close, high-mass binary fraction, the
orbital and mass-ratio distributions and the permitted formation
channels for low- and high-mass X-ray binaries within Wd1.
105
spectroscopically-and photometrically-selected targets observed on a
minimum of six epochs during 2008 and 2009. A final paper will present
follow-up observations and numerical modeling of the observed RV
variability (cf. Kobulnicky &
Fryer 2007)
aimed at placing limits on the close, high-mass binary fraction, the
orbital and mass-ratio distributions and the permitted formation
channels for low- and high-mass X-ray binaries within Wd1.
2 Observations and data reduction
Observations were made using the Fibre Large Array Multi
Element Spectrograph (FLAMES; Pasquini
et al. 2002), located on VLT UT2 Kueyen
at Cerro Paranal. FLAMES provides multi-object spectroscopy using the
GIRAFFE medium-high resolution and/or UVES high resolution
spectrographs, with the red arm of UVES fed by up to eight fibres and
the MEDUSA mode of GIRAFFE allowing simultaneous observation of up to
132 separate objects![]() .
Our observations use GIRAFFE in MEDUSA mode, but the high degree of
crowding towards the core of Wd1 means that we cannot simultaneously
allocate fibres to all spectroscopically-confirmed cluster members due
to limitations imposed by
the physical size of the MEDUSA fibres and the need to avoid
collisions. Instead we use FPOSS (the FLAMES Fibre
Positioner Observation Support Software) to optimally allocate fibres
to targets drawn from four
lists of candidates:
.
Our observations use GIRAFFE in MEDUSA mode, but the high degree of
crowding towards the core of Wd1 means that we cannot simultaneously
allocate fibres to all spectroscopically-confirmed cluster members due
to limitations imposed by
the physical size of the MEDUSA fibres and the need to avoid
collisions. Instead we use FPOSS (the FLAMES Fibre
Positioner Observation Support Software) to optimally allocate fibres
to targets drawn from four
lists of candidates:
- known cluster members catalogued by Westerlund (1987). The brightest OB and transitional supergiant members of Wd1 are assigned the highest priority for fibre allocation, while other catalogued OB I/II stars are assigned moderate priority. Yellow hypergiants and the Wolf-Rayet population are assigned low priority; the YHGs are presumed too large to allow a close companion, while the binary fraction of the Wolf-Rayet population has been examined by Crowther et al. (2006);
- candidate cluster members with SuSI2 photometry (Clark et al. 2005). These
targets are located in a
 -arcmin
field centred just north-east of the core of Wd1. These are again
assigned moderate priority, with increasing likelihood of selection
away from the highest-priority OB supergiants in the cluster core;
-arcmin
field centred just north-east of the core of Wd1. These are again
assigned moderate priority, with increasing likelihood of selection
away from the highest-priority OB supergiants in the cluster core;
- bright stars away from the cluster core with WFI photometry (Baade et al. 1999) suggestive of cluster membership. These are assigned low priority, but still have a high probability of selection during fibre configuration due to the lack of alternative targets away from the cluster core;
- objects around the cluster core that are likely to be members based on their general colour, but have no existing photometry or spectroscopy. These targets are assigned a low priority for fibre configuration and serve as backup targets for fibres that cannot be allocated in any other way.
Table 1: Summary of observations of the four sets of targets.
Table 2: List of targets.
![\begin{figure}
\par\includegraphics[width=14cm,clip]{12686f1.eps}
\end{figure}](/articles/aa/full_html/2009/45/aa12686-09/img14.png)
|
Figure 1:
VLT/FORS1 R-band finding chart ( |
| Open with DEXTER | |
![\begin{figure}
\par\includegraphics[width=14cm,clip]{12686f2.eps}
\end{figure}](/articles/aa/full_html/2009/45/aa12686-09/img15.png)
|
Figure 2: Spectral sequence of selected targets, from the M2II/III field star F1 to the O9.5Ib cluster member W84 with the rest wavelengths of the principal absorption lines marked. Residual sky lines, as discussed in Sect. 2, are visible in some spectra. |
| Open with DEXTER | |
Due to the high degree of reddening towards Wd1 (
![]() ;
Clark et al. 2005)
the expected
signal-to-noise ratio at the blue end of the spectrum would be too poor
to allow high-precision RV measurements to be obtained. Instead, we use
the near-IR atmospheric window at
;
Clark et al. 2005)
the expected
signal-to-noise ratio at the blue end of the spectrum would be too poor
to allow high-precision RV measurements to be obtained. Instead, we use
the near-IR atmospheric window at ![]() 8350-9000 Å, which
covers a number of strong, well defined Paschen-series absorption lines
in the spectra of OB supergiants (Clark et al. 2005; Negueruela
et al. 2009). This region is free from telluric
features, and the line formation region deep in the stellar photosphere
implies the observed absorption lines should be free from wind
contamination
8350-9000 Å, which
covers a number of strong, well defined Paschen-series absorption lines
in the spectra of OB supergiants (Clark et al. 2005; Negueruela
et al. 2009). This region is free from telluric
features, and the line formation region deep in the stellar photosphere
implies the observed absorption lines should be free from wind
contamination![]() . The GIRAFFE spectrograph
was therefore used with setup HR21 covering the 8484-9001 Å
range with
. The GIRAFFE spectrograph
was therefore used with setup HR21 covering the 8484-9001 Å
range with ![]() .
Two 600 s integrations were used for the bright targets, while
three 895s
integrations were used for the faint targets. The FLAMES data were
bias-subtracted, flat-fielded to correct for pixel-to-pixel variation
and
fibre transmission differences, and wavelength-calibrated using version
2.5.3 of the FLAMES-GIRAFFE pipeline
.
Two 600 s integrations were used for the bright targets, while
three 895s
integrations were used for the faint targets. The FLAMES data were
bias-subtracted, flat-fielded to correct for pixel-to-pixel variation
and
fibre transmission differences, and wavelength-calibrated using version
2.5.3 of the FLAMES-GIRAFFE pipeline![]() with version 4.1.0 of the Common Pipeline Library (CPL),
with individual spectra extracted from the final pipeline frames using
the IRAF
with version 4.1.0 of the Common Pipeline Library (CPL),
with individual spectra extracted from the final pipeline frames using
the IRAF![]() task onedspec.
The signal-to-noise ratio of
our co-added spectra varies with the I-band
luminosity of the target, ranging from S/N>
200 for the very luminous transitional hypergiants W243 and
W265 to
task onedspec.
The signal-to-noise ratio of
our co-added spectra varies with the I-band
luminosity of the target, ranging from S/N>
200 for the very luminous transitional hypergiants W243 and
W265 to ![]() 65-75
amongst the least luminous O9.5Ib targets in
our bright sample. A master sky spectrum was
created from individual fibre sky spectra, and this was subtracted from
stellar spectra
using the skysub task. Notable fibre-to-fibre
variations in the sky spectra are apparent across the FLAMES field, and
as a result the removal of sky lines from stellar spectra is frequently
imperfect (see also discussion
in Evans et al. 2005).
As can be seen from Fig. 2,
residual sky lines are not generally significant, but in a few cases
unsubtracted sky lines overlapped absorption lines used for RV
measurement and had to be removed by manually interpolating between
levels on either side of the emission line. Finally, spectra were
corrected for heliocentric velocity using dopcor
and normalized using the continuum task. A
serendipitous check for zero-point errors in our data is provided by a
strong, well-defined diffuse interstellar band at
65-75
amongst the least luminous O9.5Ib targets in
our bright sample. A master sky spectrum was
created from individual fibre sky spectra, and this was subtracted from
stellar spectra
using the skysub task. Notable fibre-to-fibre
variations in the sky spectra are apparent across the FLAMES field, and
as a result the removal of sky lines from stellar spectra is frequently
imperfect (see also discussion
in Evans et al. 2005).
As can be seen from Fig. 2,
residual sky lines are not generally significant, but in a few cases
unsubtracted sky lines overlapped absorption lines used for RV
measurement and had to be removed by manually interpolating between
levels on either side of the emission line. Finally, spectra were
corrected for heliocentric velocity using dopcor
and normalized using the continuum task. A
serendipitous check for zero-point errors in our data is provided by a
strong, well-defined diffuse interstellar band at ![]() 8620 Å
(Munari 2000). As this
feature is unassociated with Wd1 it displays a constant profile and a
RV that varies by less than
8620 Å
(Munari 2000). As this
feature is unassociated with Wd1 it displays a constant profile and a
RV that varies by less than ![]() 1 km s-1
in all spectra, implying that there are no systematic shifts in line
centre or profile between epochs.
1 km s-1
in all spectra, implying that there are no systematic shifts in line
centre or profile between epochs.
In this work only the bright target list
is examined; a list of targets is given in Table 2 and a finder
chart is plotted in Fig. 1![]() . A representative spectral
sequence, extending from
the earliest objects in our bright sample (O9.5Ib,
e.g. W84 and W234) is plotted in Fig. 2 with the
Paschen-series and He I lines labeled, along with the DIB at
. A representative spectral
sequence, extending from
the earliest objects in our bright sample (O9.5Ib,
e.g. W84 and W234) is plotted in Fig. 2 with the
Paschen-series and He I lines labeled, along with the DIB at ![]() 8620 Å,
the C III
8620 Å,
the C III ![]() 8500 line that blends with the
Pa-16 line in stars of B0.5I and earlier, and the neutral and
singly-ionized metal lines that become prominent in the cooler stars.
Radial velocities were determined from the strong Paschen-series and
(when available) He I absorption lines, with the
Pa-16
8500 line that blends with the
Pa-16 line in stars of B0.5I and earlier, and the neutral and
singly-ionized metal lines that become prominent in the cooler stars.
Radial velocities were determined from the strong Paschen-series and
(when available) He I absorption lines, with the
Pa-16 ![]() 8502
line excluded in stars earlier than B1I due to blending with
C III
8502
line excluded in stars earlier than B1I due to blending with
C III ![]() 8500
(this effect can be clearly seen in the bluewards shift in the
Pa-16/C III blend in the O9.5Ib spectrum plotted in
Fig. 2).
In the case of the cool hypergiants W243 and W265,
the Paschen-series lines are frequently blended with adjacent
Ca II and N I lines, and instead nine strong,
unblended N I absorption lines from high-excitation multiplets
(
8500
(this effect can be clearly seen in the bluewards shift in the
Pa-16/C III blend in the O9.5Ib spectrum plotted in
Fig. 2).
In the case of the cool hypergiants W243 and W265,
the Paschen-series lines are frequently blended with adjacent
Ca II and N I lines, and instead nine strong,
unblended N I absorption lines from high-excitation multiplets
(
![]() eV)
were used. Measurements were made in a similar manner to Bosch et al. (2009), by
using the IRAF ngaussfit task within the stsdas
package to fit Gaussian profiles to the absorption lines, with the
measured stellar radial velocity at each epoch an error-weighted
average of the individual absorption lines. Rest wavelengths for RV
measurement are taken from the NIST Atomic Spectra database
eV)
were used. Measurements were made in a similar manner to Bosch et al. (2009), by
using the IRAF ngaussfit task within the stsdas
package to fit Gaussian profiles to the absorption lines, with the
measured stellar radial velocity at each epoch an error-weighted
average of the individual absorption lines. Rest wavelengths for RV
measurement are taken from the NIST Atomic Spectra database![]() . Errors are
. Errors are ![]() 4 km s-1
unless noted.
4 km s-1
unless noted.
3 Results
The bright target list contains 16 stars that are
known members of Wd1 with previously published spectral classifications
(Clark
et al. 2005,2008; Negueruela et al. 2008).
The previously-unclassified target W373, located to the south
of Wd1, is classified as B0Iab based on the strength the Paschen-series
and He I absorption lines, with a spectrum very similar to
W60 (also B0Iab; Negueruela
et al. 2009). Four of the five candidate targets
are confirmed as members of Wd1. W3002 and W3004
display very similar spectra to W373, and are again
classified as B0Iab.
W3005 is slightly earlier, displaying a similar spectrum to
W84 and W234 (O9.5Ib; Negueruela
et al. 2009),
while W3003
displays slightly broader Paschen-series lines than the B0Iab stars and
is classified as B0Ib. Finally, although the fifth candidate target
(F1) has a similar colour to the highly-reddened OB supergiants in Wd1,
the lack of a well-defined DIB at 8620 Å and the strength of
the
TiO ![]() 8860 bandhead
(Ramsey 1981) show it to be a
foreground early-M giant and not a cluster member.
8860 bandhead
(Ramsey 1981) show it to be a
foreground early-M giant and not a cluster member.
Table A.1 lists the measured radial velocities for the target stars. In the case of W30a, the I-band spectrum shows only very broad, weak Paschen-series absorption lines that preclude accurate measurement; we return to this in Sect. 4. Selected targets are examined further in the following sections. Although the detection of binaries in Wd1 is the long-term goal of our project, at this stage we are also interested in characterising possible photospheric sources of variations in RV. Both sources of variability are therefore discussed.
3.1 The eclipsing binary W13
Bonanos (2007) report
W13 to be a contact eclipsing binary with a 9.2-day orbital
period, and it is also listed as an X-ray source with ![]() erg s-1
by Clark et al. (2008).
Negueruela et al. (2009)
classify W13 as a B0.5Ia++OB binary,
with one component being an emission-line object displaying strong H
erg s-1
by Clark et al. (2008).
Negueruela et al. (2009)
classify W13 as a B0.5Ia++OB binary,
with one component being an emission-line object displaying strong H![]() emission
alongside C II
emission
alongside C II
![]() 6578, 6583 and
He I
6578, 6583 and
He I
![]() 6678, 7065 lines in VLT/FLAMES
LR6-mode spectra (Clark et al.
2009b).
By chance, three of our observations are separated by almost integer
multiples of this orbital period: the second spectrum was obtained
2.05 orbital periods after the first, while the fourth
spectrum
was taken after 4.98 orbital periods had elapsed. The other two are out
of phase, taken after 2.71 and 7.26 orbital periods. We would therefore
expect to see absorption lines at almost the same RV in three spectra
with two discrepant, and this can be seen in Fig. 3. An emission
component is seen in all Paschen-series lines, weakening noticeably
between the first and fourth spectra. Weak He I absorption
features are also seen, with He I
6678, 7065 lines in VLT/FLAMES
LR6-mode spectra (Clark et al.
2009b).
By chance, three of our observations are separated by almost integer
multiples of this orbital period: the second spectrum was obtained
2.05 orbital periods after the first, while the fourth
spectrum
was taken after 4.98 orbital periods had elapsed. The other two are out
of phase, taken after 2.71 and 7.26 orbital periods. We would therefore
expect to see absorption lines at almost the same RV in three spectra
with two discrepant, and this can be seen in Fig. 3. An emission
component is seen in all Paschen-series lines, weakening noticeably
between the first and fourth spectra. Weak He I absorption
features are also seen, with He I
![]() 8583, 8777 (van
Helden 1972)
most prominent. The radial velocities of the He I absorption
lines
closely match the absorption components of the Paschen-series lines,
and although no obvious He I emission is detected in our I-band
spectra the expected strength is low. Radial
velocity measurements and the virtual absence of an emission line
component at phase
8583, 8777 (van
Helden 1972)
most prominent. The radial velocities of the He I absorption
lines
closely match the absorption components of the Paschen-series lines,
and although no obvious He I emission is detected in our I-band
spectra the expected strength is low. Radial
velocity measurements and the virtual absence of an emission line
component at phase ![]() 0.7
(corresponding to the 24/07/2008, MJD = 54671.1
spectrum)
when the emission-line component is near (or at) eclipse show
W13 to be a spectroscopic binary, with the emission component
originating in a B0.5I+/WNVL primary and the
absorption component in the secondary. The weakness of the
Paschen-series absorption lines suggests a
0.7
(corresponding to the 24/07/2008, MJD = 54671.1
spectrum)
when the emission-line component is near (or at) eclipse show
W13 to be a spectroscopic binary, with the emission component
originating in a B0.5I+/WNVL primary and the
absorption component in the secondary. The weakness of the
Paschen-series absorption lines suggests a ![]() O8-9I
classification for the secondary, but this is inconsistent with the
observed He I absorption lines which imply a later spectral
type,
and it is likely that there is significant infilling of the
Paschen-series lines from the wind of the emission-line primary.
W13 therefore appears to be an immediate precursor to the
binary-rich Wolf-Rayet population in Wd1 (Crowther
et al. 2006). Radial velocity measurements and
orbital parameters for W13 will appear in a forthcoming
paper.
O8-9I
classification for the secondary, but this is inconsistent with the
observed He I absorption lines which imply a later spectral
type,
and it is likely that there is significant infilling of the
Paschen-series lines from the wind of the emission-line primary.
W13 therefore appears to be an immediate precursor to the
binary-rich Wolf-Rayet population in Wd1 (Crowther
et al. 2006). Radial velocity measurements and
orbital parameters for W13 will appear in a forthcoming
paper.
3.2 The Wolf-Rayet W239 (F/WR77n)
The WC9d star W239 (F/WR77n in the nomenclatures of Clark & Negueruela 2002; van der Hucht 2006 respectively) has
previously been highlighted as a likely binary due to its strong
near-IR excess and hard X-ray emission (Crowther
et al. 2006; Clark
et al. 2008), while Dougherty
& Clark (2008) report radio emission that is also
consistent with a CWB. Our spectra are dominated by two strong
C III
![]() 8500,8664 emission lines, with
weak C IV
8500,8664 emission lines, with
weak C IV![]() 8856
emission also apparent; the C III
8856
emission also apparent; the C III ![]() 8664 line
and nearby DIB at
8664 line
and nearby DIB at ![]() 8620 Å
are plotted in Fig. 4.
Significant radial velocity changes are apparent in all three emission
lines, although the measured values of the two C III lines
generally differ by
8620 Å
are plotted in Fig. 4.
Significant radial velocity changes are apparent in all three emission
lines, although the measured values of the two C III lines
generally differ by ![]() 20-40 km s-1,
a result of excess emission on the
redwards side of the C III
20-40 km s-1,
a result of excess emission on the
redwards side of the C III ![]() 8500 line shifting the profile
fit relative
to C III
8500 line shifting the profile
fit relative
to C III ![]() 8664 and also possibly the
influence of a weak secondary component at 8653 Å shifting the
C III
8664 and also possibly the
influence of a weak secondary component at 8653 Å shifting the
C III ![]() 8664
fit bluewards. Measurement is also complicated by the emission line
profiles, which are sometimes skewed or weakly double-peaked. However,
over the course of our observations RVs measured from the
C III
8664
fit bluewards. Measurement is also complicated by the emission line
profiles, which are sometimes skewed or weakly double-peaked. However,
over the course of our observations RVs measured from the
C III ![]() 8664
line span a range of -82 km s-1
to +14 km s-1, with the
C III
8664
line span a range of -82 km s-1
to +14 km s-1, with the
C III ![]() 8500
line giving a very similar overall range that is redshifted by
8500
line giving a very similar overall range that is redshifted by ![]() 25 km s-1
(errors estimated at
25 km s-1
(errors estimated at ![]() 10 km s-1
in both cases), with a large delta of
10 km s-1
in both cases), with a large delta of ![]() 65 km s-1
between the 24/07/2008 (MJD = 54671.1) and 14/08/2008
(MJD = 54692.0) spectra. Although
WRs typically display low-level variability in emission lines due to
clumping
in the wind, the RV changes seen here are strongly suggestive of
binarity. Dust-forming WC stars are generally considered to be binary
systems with an OB companion (e.g. Tuthill
et al. 1999), and the observed RVs are consistent
with a
65 km s-1
between the 24/07/2008 (MJD = 54671.1) and 14/08/2008
(MJD = 54692.0) spectra. Although
WRs typically display low-level variability in emission lines due to
clumping
in the wind, the RV changes seen here are strongly suggestive of
binarity. Dust-forming WC stars are generally considered to be binary
systems with an OB companion (e.g. Tuthill
et al. 1999), and the observed RVs are consistent
with a ![]() 15
15 ![]() WR primary (Crowther et al.
2006)
and more massive OB secondary in a short-period orbit viewed at
moderate inclination (unlike B/WR77o, eclipses are not visible in W239;
Bonanos 2007). The limited
sampling of our five epochs precludes estimation of an orbital period,
but our long-term dataset will allow us to constrain the orbital
parameters of W239.
WR primary (Crowther et al.
2006)
and more massive OB secondary in a short-period orbit viewed at
moderate inclination (unlike B/WR77o, eclipses are not visible in W239;
Bonanos 2007). The limited
sampling of our five epochs precludes estimation of an orbital period,
but our long-term dataset will allow us to constrain the orbital
parameters of W239.
3.3 The spectroscopic (candidate) binaries W2a, W43a, W234 and W3003
![\begin{figure}
\par\includegraphics[width=8.5cm,clip]{12686f3.eps}
\end{figure}](/articles/aa/full_html/2009/45/aa12686-09/img23.png)
|
Figure 3:
Pa-14 |
| Open with DEXTER | |
![\begin{figure}
\par\includegraphics[width=8.5cm,clip]{12686f4.eps}
\end{figure}](/articles/aa/full_html/2009/45/aa12686-09/img24.png)
|
Figure 4:
C III |
| Open with DEXTER | |
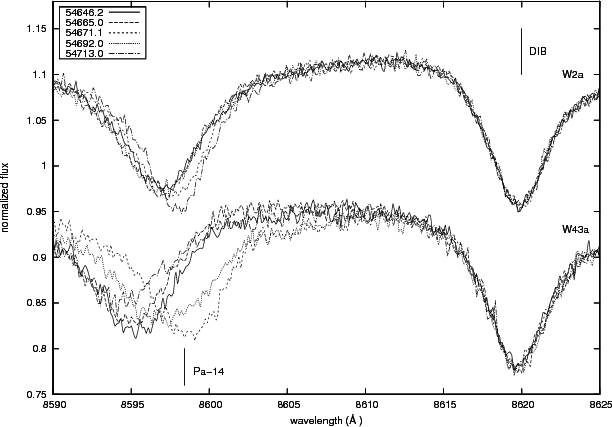
|
Figure 5:
Pa-14 |
| Open with DEXTER | |
Figure 5
plots the Pa-14 ![]() 8598
line and the adjacent DIB at 8620 Å for W2a and
W43a, with both objects displaying notable RV variations in
the photospheric absorption lines. W43a is unambiguously a
short-period binary, with the measured radial velocities spanning a
range of
8598
line and the adjacent DIB at 8620 Å for W2a and
W43a, with both objects displaying notable RV variations in
the photospheric absorption lines. W43a is unambiguously a
short-period binary, with the measured radial velocities spanning a
range of ![]() 140 km s-1
and including a delta of
140 km s-1
and including a delta of ![]() 131 km s-1
in the space of six days between 18/07/2008
(MJD = 54665.0)
and 24/07/2008 (MJD = 54671.1). No eclipses are
reported by Bonanos (2007),
but the relatively high radial velocities suggest that the system must
be near the sin i
131 km s-1
in the space of six days between 18/07/2008
(MJD = 54665.0)
and 24/07/2008 (MJD = 54671.1). No eclipses are
reported by Bonanos (2007),
but the relatively high radial velocities suggest that the system must
be near the sin i ![]() 0.7
limit where eclipses would become visible. The
0.7
limit where eclipses would become visible. The ![]() 35
35 ![]() initial mass of the B0Ia primary requires a massive companion to
produce the observed RV changes, and although there is not direct
spectroscopic evidence for this secondary, changes in the He I
line profiles are tentatively suggestive of an OB companion.
However, we note
that changes in the Paschen-series absorption line strengths are also
apparent
in our spectra, and it seems likely that we are also observing
photospheric variations superimposed on the changes in line centre due
to orbital motion. This may explain changes in the He I
profile, and follow-up observations at other wavelengths may be
required to identify the companion. Nevertheless, W43a
represents an encouraging prospect for accurate parameter estimation as
further data become available.
initial mass of the B0Ia primary requires a massive companion to
produce the observed RV changes, and although there is not direct
spectroscopic evidence for this secondary, changes in the He I
line profiles are tentatively suggestive of an OB companion.
However, we note
that changes in the Paschen-series absorption line strengths are also
apparent
in our spectra, and it seems likely that we are also observing
photospheric variations superimposed on the changes in line centre due
to orbital motion. This may explain changes in the He I
profile, and follow-up observations at other wavelengths may be
required to identify the companion. Nevertheless, W43a
represents an encouraging prospect for accurate parameter estimation as
further data become available.
W234 is duplicated on the bright
and faint1 lists
and therefore observed on seven occasions. The overall range of
observed RVs
is far smaller than W43a (![]() 36 km s-1),
but relatively rapid RV changes are again present with spectra from
18/07/2008 (MJD = 54665.0) and 24/07/2008
(MJD = 54671.1) showing a delta of
36 km s-1),
but relatively rapid RV changes are again present with spectra from
18/07/2008 (MJD = 54665.0) and 24/07/2008
(MJD = 54671.1) showing a delta of ![]() 35 km s-1.
This is large for bulk photospheric motions in the Paschen-series line
forming region, and it is more likely that W234 is a similar
short-period binary to W43a but viewed at a less favourable
angle for RV measurement. W2a displays RVs ranging from
-56.2 km s-1 to
-18.6 km s-1 over the course
of our observations, including a change of
35 km s-1.
This is large for bulk photospheric motions in the Paschen-series line
forming region, and it is more likely that W234 is a similar
short-period binary to W43a but viewed at a less favourable
angle for RV measurement. W2a displays RVs ranging from
-56.2 km s-1 to
-18.6 km s-1 over the course
of our observations, including a change of ![]() 22 km s-1
within the six days separating the 18/07/2008
(MJD = 54665.0)
and 24/07/2008 (MJD = 54671.1) spectra, and a change
of
22 km s-1
within the six days separating the 18/07/2008
(MJD = 54665.0)
and 24/07/2008 (MJD = 54671.1) spectra, and a change
of ![]() 36 km s-1
between the final two spectra. The variability on short timescales is
less pronounced than in W234, but the amplitude of the RV
changes is still large relative to the majority of our sample. However,
we cannot categorically rule out a photospheric origin for these
variations and classify W234 as a probable
binary
based on the magnitude of its short-term RV changes and W2a
as a candidate binary pending further observation.
36 km s-1
between the final two spectra. The variability on short timescales is
less pronounced than in W234, but the amplitude of the RV
changes is still large relative to the majority of our sample. However,
we cannot categorically rule out a photospheric origin for these
variations and classify W234 as a probable
binary
based on the magnitude of its short-term RV changes and W2a
as a candidate binary pending further observation.
Finally, the newly-confirmed cluster member W3003
displays RVs
spanning ![]() 50 km s-1
over the course of our observations. Unlike the other short-period
(candidate) binaries identified here, W3003 shows no rapid
deltas in RV but increases from -4.4 km s-1
in the first spectrum (29/06/2008, MJD = 54646.2) to
-54.6 km s-1 in the third
(24/07/2008, MJD = 54671.1) before turning around and
decreasing to -10.6 km s-1
in the final spectrum (04/09/2008, MJD = 54713.0).
Like
W234, additional observations are required to confirm the
binary nature of the system, but the pattern of RV changes appears best
explained by a limited sampling of a longer-period orbit viewed at
moderate inclination. We therefore classify W3003 as a second
probable binary.
50 km s-1
over the course of our observations. Unlike the other short-period
(candidate) binaries identified here, W3003 shows no rapid
deltas in RV but increases from -4.4 km s-1
in the first spectrum (29/06/2008, MJD = 54646.2) to
-54.6 km s-1 in the third
(24/07/2008, MJD = 54671.1) before turning around and
decreasing to -10.6 km s-1
in the final spectrum (04/09/2008, MJD = 54713.0).
Like
W234, additional observations are required to confirm the
binary nature of the system, but the pattern of RV changes appears best
explained by a limited sampling of a longer-period orbit viewed at
moderate inclination. We therefore classify W3003 as a second
probable binary.
3.4 The pulsating hypergiants W243 and W265
W243 (LBV ![]() A3Ia+;
Ritchie et al. 2009)
and W265 (F5Ia+; Clark
et al. 2005) represent two of the population of cool
hypergiants in Wd1. Turning first to the yellow hypergiant
W265,
the VLT/FLAMES spectra reveal pronounced spectral variability in the
neutral metal lines, and in particular in low-excitation multiplets of
Fe I,
Mg I and Si I. This can be seen in Fig. 6, which plots
the
regions around the Pa-14
A3Ia+;
Ritchie et al. 2009)
and W265 (F5Ia+; Clark
et al. 2005) represent two of the population of cool
hypergiants in Wd1. Turning first to the yellow hypergiant
W265,
the VLT/FLAMES spectra reveal pronounced spectral variability in the
neutral metal lines, and in particular in low-excitation multiplets of
Fe I,
Mg I and Si I. This can be seen in Fig. 6, which plots
the
regions around the Pa-14 ![]() 8598 line and the N I
triplet at
8598 line and the N I
triplet at ![]() 8683 Å
on two epochs, separated by
8683 Å
on two epochs, separated by ![]() 46 days,
that correspond approximately to apparent minimum and maximum
46 days,
that correspond approximately to apparent minimum and maximum ![]() (29/06/2008, MJD = 54646.2 and 14/08/2008,
MJD = 54692.0 respectively). The first spectrum
displays strong Fe I lines from multiplets 60 (a5P-z5P
(29/06/2008, MJD = 54646.2 and 14/08/2008,
MJD = 54692.0 respectively). The first spectrum
displays strong Fe I lines from multiplets 60 (a5P-z5P![]() ,
,
![]() eV),
339
(b3P-z3P
eV),
339
(b3P-z3P![]() ,
,
![]() eV)
and 401 (b3G-z3G
eV)
and 401 (b3G-z3G![]() ,
,
![]() eV),
but in the later spectrum the multiplet 60 line (
eV),
but in the later spectrum the multiplet 60 line (![]() 8689) has
weakened substantially while the multiplet 339 lines (
8689) has
weakened substantially while the multiplet 339 lines (![]()
![]() 8611, 8675)
are undetectable and the multiplet 401 line (
8611, 8675)
are undetectable and the multiplet 401 line (![]() 8582) is
weakly in emission. This pattern
continues in the left panel of Fig. 7
8582) is
weakly in emission. This pattern
continues in the left panel of Fig. 7![]() , which plots the adjacent
Fe I
, which plots the adjacent
Fe I ![]() 8824
(multiplet 60) and
8824
(multiplet 60) and ![]() 8828
(multiplet 1269, x5D
8828
(multiplet 1269, x5D![]() -e3D,
-e3D, ![]() eV)
lines over all five VLT/FLAMES epochs.
eV)
lines over all five VLT/FLAMES epochs.
![\begin{figure}
\par\includegraphics[width=8.8cm,clip]{12686f6.eps}
\end{figure}](/articles/aa/full_html/2009/45/aa12686-09/img31.png)
|
Figure 6:
Spectral variability in W265. The left panel plots
the region around the Pa-14 |
| Open with DEXTER | |
![\begin{figure}
\par\includegraphics[angle=270,width=8.5cm,clip]{12686f7.eps}
\end{figure}](/articles/aa/full_html/2009/45/aa12686-09/img32.png)
|
Figure 7:
Spectral variability in W265. The left panel plots
Fe I |
| Open with DEXTER | |
![\begin{figure}
\par\includegraphics[width=8.5cm,clip]{12686f8.eps}
\end{figure}](/articles/aa/full_html/2009/45/aa12686-09/img35.png)
|
Figure 8:
Heliocentric radial velocity changes in low- and high-excitation
absorption lines in W265. Plotted are Fe I
(multiplet 60, |
| Open with DEXTER | |
The behaviour of the Fe I lines is remarkably similar to the
well-studied
YHG ![]() Cassiopeia (Lobel et al.
2003), with the multiplet 60 line in Fig. 7 developing a
similar triangular profile with excess
absorption in the blue wing
Cassiopeia (Lobel et al.
2003), with the multiplet 60 line in Fig. 7 developing a
similar triangular profile with excess
absorption in the blue wing![]() to that reported by Lobel
et al. (1998) for the low-excitation
Fe I
to that reported by Lobel
et al. (1998) for the low-excitation
Fe I ![]() 5572.8
line. Our limited spectral coverage prevents us from examining other
low-excitation absorption lines used by Lobel
et al. (1998) to interpret the spectrum of
5572.8
line. Our limited spectral coverage prevents us from examining other
low-excitation absorption lines used by Lobel
et al. (1998) to interpret the spectrum of ![]() Cas, but, given the similarities, it is likely the Fe I
lines share a common origin in a (non-radially) pulsating photosphere.
Cas, but, given the similarities, it is likely the Fe I
lines share a common origin in a (non-radially) pulsating photosphere.
Finally, we note the weak emission evident in the core of the
strong Ca II ![]() 8498 line in Fig. 7; a similar
effect
is seen in the core of the other Ca II
8498 line in Fig. 7; a similar
effect
is seen in the core of the other Ca II ![]() 8542,8662
multiplet-2 lines, but in these cases infilling of the line centre
redwards of the
emission peak is seen, leading to an asymmetric core profile. The 42P
8542,8662
multiplet-2 lines, but in these cases infilling of the line centre
redwards of the
emission peak is seen, leading to an asymmetric core profile. The 42P![]() (
(
![]() eV)
lower level of the near-IR Ca II triplet is fed by the
Ca II-K and -H lines in the near-UV, and core
emission in the Fraunhoffer lines is an indicator of chromospheric
activity in cool stars. Such cores are reported in
eV)
lower level of the near-IR Ca II triplet is fed by the
Ca II-K and -H lines in the near-UV, and core
emission in the Fraunhoffer lines is an indicator of chromospheric
activity in cool stars. Such cores are reported in ![]() Orionis but are not observed in the near-IR triplet (Lobel & Dupree 2000),
implying a higher chromospheric temperature in W265.
Observations of
Orionis but are not observed in the near-IR triplet (Lobel & Dupree 2000),
implying a higher chromospheric temperature in W265.
Observations of ![]() Cas show that core emission in the chromospheric Ca II-H
and K lines is not constant (Lobel
et al. 2003),
implying that a permanent chromosphere is not present, and this may
also be the case for W265; no apparent chromospheric X-ray
emission was detected (Clark
et al. 2008, Sect. 4.2.3), suggesting that
the chromospheric activity implied by the Ca II lines may also
be transitory. Further observation and modeling of W265 is
required to determine
the origin of these features. Lobel
et al. (2003) report line-splitting in
low-excitation (
Cas show that core emission in the chromospheric Ca II-H
and K lines is not constant (Lobel
et al. 2003),
implying that a permanent chromosphere is not present, and this may
also be the case for W265; no apparent chromospheric X-ray
emission was detected (Clark
et al. 2008, Sect. 4.2.3), suggesting that
the chromospheric activity implied by the Ca II lines may also
be transitory. Further observation and modeling of W265 is
required to determine
the origin of these features. Lobel
et al. (2003) report line-splitting in
low-excitation (
![]() eV)
Fe I multiplets and other low-excitation metals. However, our
limited spectral coverage precludes examination of the multiplets with
in which splitting is reported. Sargent
(1961) lists Fe I multiplet 60 as containing double
lines in
eV)
Fe I multiplets and other low-excitation metals. However, our
limited spectral coverage precludes examination of the multiplets with
in which splitting is reported. Sargent
(1961) lists Fe I multiplet 60 as containing double
lines in ![]() Cas, but no evidence of core doubling in this multiplet is seen in
our spectra of W265.
Cas, but no evidence of core doubling in this multiplet is seen in
our spectra of W265.
![\begin{figure}
\par\includegraphics[width=8.5cm,clip]{12686f9.eps}
\end{figure}](/articles/aa/full_html/2009/45/aa12686-09/img39.png)
|
Figure 9:
Spectral variability in the LBV W243. The left panel
plots N I |
| Open with DEXTER | |
Significant pulsational variability is also observed in W243.
The highly-variable Fe I lines observed in W265 are
not present in the hotter LBV (A3Ia+), which
displays a complex Fe II spectrum along with absorption lines
from other neutral and singly-ionized metals and an emission-line
spectrum containing Balmer- and Paschen-series lines, He I and
Ca II. This emission-line spectrum is a result of a hot
companion star ionizing the wind of the LBV primary (Ritchie et al. 2009),
but this is not directly reflected in the cool-state absorption lines
which display radial velocities in a narrow range of
-45 km s-1 to
-15 km s-1
across ten epochs of VLT/UVES and VLT/FLAMES data. These lines display
RV variations on timescales of days, but - if they were due to orbital
motion - we would expect a much wider range of radial velocities than
observed unless, by chance, we are observing the system from almost
directly above the orbital plane. The variations are most clearly seen
in the Si II ![]() 6349, 6371
doublet (obtained using VLT/UVES with cross-disperser #3,
6349, 6371
doublet (obtained using VLT/UVES with cross-disperser #3, ![]() )
and in the near-IR N I lines; an example of the latter is
shown in Fig. 9.
In addition, VLT/UVES observations of the N I lines reveal the
formation of excess bluewards absorption similar to that seen in the
Fe I multiplet 60 line in W265 at a time
when Fe II emission lines develop pronounced P-cygni profiles
indicating enhanced mass loss. W243 therefore appears to be
undergoing very similar pulsational mass-loss to W265, albeit
at higher
)
and in the near-IR N I lines; an example of the latter is
shown in Fig. 9.
In addition, VLT/UVES observations of the N I lines reveal the
formation of excess bluewards absorption similar to that seen in the
Fe I multiplet 60 line in W265 at a time
when Fe II emission lines develop pronounced P-cygni profiles
indicating enhanced mass loss. W243 therefore appears to be
undergoing very similar pulsational mass-loss to W265, albeit
at higher ![]() ;
we examine the spectrum of W243 in detail in Ritchie et al. (2009).
;
we examine the spectrum of W243 in detail in Ritchie et al. (2009).
3.5 The early-B supergiants
Statistically-significant RV changes are also apparent in a number of the early-B supergiants, including W8b, W21, W23a, W71 and W3004. Of these, W71 (B2.5Ia; Negueruela et al. 2009) is one of the latest of the continuous sequence of OB supergiants in Wd1, displaying strong Paschen-series and He I absorption lines along with weak N I lines indicative of its cooler state. W8b and W23a are slightly earlier, displaying no apparent N I lines. Finally, W21 and W3004 are the earliest of this group, with spectral types B0.5Ia and B0Iab respectively. With the exception of W8b all are listed as aperiodic variables by Bonanos (2007), and none are significant detections at X-ray wavelengths (Clark et al. 2008).
In all cases, the observed RV variations lie in a narrow range
of ![]() 15-25 km s-1
with no rapid variations between epochs. Although this is compatible
with longer-period orbital motion, the radial velocity changes in the
Paschen-series lines are accompanied by changes in absorption line
strength and profile, and it is more likely that the origin of the RV
changes is photospheric. This is best illustrated by W71 and
the cooler transitional supergiant W57a (B4Ia; Negueruela et al. 2009)
which is included in the faint1 list and was
observed on three occasions; both are plotted in Fig. 10. As
well as variations in the Paschen-series lines, both objects also show
pronounced changes in the strength of the N I
15-25 km s-1
with no rapid variations between epochs. Although this is compatible
with longer-period orbital motion, the radial velocity changes in the
Paschen-series lines are accompanied by changes in absorption line
strength and profile, and it is more likely that the origin of the RV
changes is photospheric. This is best illustrated by W71 and
the cooler transitional supergiant W57a (B4Ia; Negueruela et al. 2009)
which is included in the faint1 list and was
observed on three occasions; both are plotted in Fig. 10. As
well as variations in the Paschen-series lines, both objects also show
pronounced changes in the strength of the N I ![]() 8680 triplet
over the course of our observations, a sensitive indicator of
temperature that strengthens rapidly from B2Ia to B4Ia (Negueruela et al. 2009)
and is therefore strongly suggestive of photospheric changes. In
addition, W78 (B1Ia) does not display statistically
significant RV changes (
8680 triplet
over the course of our observations, a sensitive indicator of
temperature that strengthens rapidly from B2Ia to B4Ia (Negueruela et al. 2009)
and is therefore strongly suggestive of photospheric changes. In
addition, W78 (B1Ia) does not display statistically
significant RV changes (![]() 10 km s-1
during the course of our observations) but nevertheless displays
notable changes in the strength of the Paschen-series absorption lines.
These changes, plotted in Fig. 11, are not
apparent in the adjacent He I line which again suggests a
photospheric origin. Radial velocity or line profile changes are
therefore observed in all
stars later than
10 km s-1
during the course of our observations) but nevertheless displays
notable changes in the strength of the Paschen-series absorption lines.
These changes, plotted in Fig. 11, are not
apparent in the adjacent He I line which again suggests a
photospheric origin. Radial velocity or line profile changes are
therefore observed in all
stars later than ![]() B0.5Ia
in our sample, and it is possible that the early- to mid-B supergiants
in our sample all lie within a region of pulsational instability that
extends to the cool hypergiants (Maeder & Rufener 1972; Schaller 1990).
Unless the stars are short-period binaries at favourable inclination
(as with W43a, which displays clear signs of both
orbital and pulsational variations; see Fig. 12) we cannot
conclusively detect binarity with our short baseline of observations,
although the longer baseline survey will be sensitive to long-term
trends in these objects.
B0.5Ia
in our sample, and it is possible that the early- to mid-B supergiants
in our sample all lie within a region of pulsational instability that
extends to the cool hypergiants (Maeder & Rufener 1972; Schaller 1990).
Unless the stars are short-period binaries at favourable inclination
(as with W43a, which displays clear signs of both
orbital and pulsational variations; see Fig. 12) we cannot
conclusively detect binarity with our short baseline of observations,
although the longer baseline survey will be sensitive to long-term
trends in these objects.
![\begin{figure}
\par\includegraphics[width=8.5cm,clip]{12686f10.eps}
\end{figure}](/articles/aa/full_html/2009/45/aa12686-09/img41.png)
|
Figure 10:
The Pa-14 |
| Open with DEXTER | |
![\begin{figure}
\par\includegraphics[width=8.5cm,clip]{12686f11.eps}
\end{figure}](/articles/aa/full_html/2009/45/aa12686-09/img42.png)
|
Figure 11:
Variations in the Paschen-series absorption lines in W78. The
left panel plots the Pa-14 |
| Open with DEXTER | |
![\begin{figure}
\par\includegraphics[width=8.5cm,clip]{12686f12.eps}
\end{figure}](/articles/aa/full_html/2009/45/aa12686-09/img43.png)
|
Figure 12: As Fig. 11, but showing variations in the Paschen-series absorption lines in the short-period binary W43a. |
| Open with DEXTER | |
4 Discussion and conclusions
4.1 Binary detections
In this work we present first-epoch results from a VLT/FLAMES radial velocity survey designed to identify high-mass binaries in the starburst cluster Westerlund 1. As expected, large RV changes are detected in the short-period eclipsing binary W13 (Bonanos 2007) which displays variable emission from a B0.5Ia+/WNVL emission line primary and He I and infilled Paschen-series absorption in an early-B secondary. As such, it appears to represent the immediate evolutionary precursor to the binary-rich Wolf-Rayet population in Wd1, such as the eclipsing binary B/WR77o (Bonanos 2007). The WC9d star W239 (F/WR77n) also shows significant RV changes compatible with a short-period WR+OB CWB viewed at moderate inclination: the OB secondary is already strongly implied by the presence of hot dust (Crowther et al. 2006), hard X-ray emission (also seen in W13; Clark et al. 2008) and non-thermal radio emission (Dougherty & Clark 2008). In addition we identify W43a as a new short-period binary with a massive, so-far unresolved companion. W234 and W3003 are probable binaries, and W2a is a strong candidate binary. Both W2a and W234 appear to be short-period binaries, with W234, at spectral type O9.5Ib, earlier than the apparently pulsationally-variable early-B supergiants discussed in Sect. 3.5. Finally, the measured RVs for W3003 are consistent with limited sampling of a short- or longer-period binary. Future observations will resolve the nature of these systems.
A second important group of objects in the context of our RV
survey are W6a, W15, W17 (included in the
faint lists) and W30a, which have all been
identified as strong binary candidates in previous studies of Wd1.
W30a is the strongest X-ray source in Wd1 after the magnetar
CXOU J164710.2-455216 (Clark
et al. 2008) and a factor of ![]() 10 more luminous than would be
expected from a single star
10 more luminous than would be
expected from a single star![]() ,
while W6a is a periodic variable (Bonanos
2007) that is also a hard X-ray source. Both display almost
featureless I-band spectra with very broad, shallow
Paschen-series absorption lines typical of spectroscopic binaries (see
also Negueruela et al. 2009)
and broad, variable H
,
while W6a is a periodic variable (Bonanos
2007) that is also a hard X-ray source. Both display almost
featureless I-band spectra with very broad, shallow
Paschen-series absorption lines typical of spectroscopic binaries (see
also Negueruela et al. 2009)
and broad, variable H![]() emission (Clark et al. 2008).
W15 and W17 are both detected at radio (Dougherty & Clark 2008)
wavelengths: the spectral index of W15 suggests composite
stellar+non-thermal emission
emission (Clark et al. 2008).
W15 and W17 are both detected at radio (Dougherty & Clark 2008)
wavelengths: the spectral index of W15 suggests composite
stellar+non-thermal emission![]() ,
while the index of W17 is unambiguously non-thermal. The
radio observations therefore suggest that both are CWBs, although they
are only weak detections at X-ray wavelengths (Clark
et al. 2008). None of these objects show significant
RV variations in our data. In the case of W6 and
W30a this is unsurprising, as the broad, weak I-band
spectral features are insensitive to changes in RV due to the
difficulty in determining the line centre, although at favourable
inclination the large RV changes expected of a short-period, high-mass
binary would still be apparent. In contrast, W15 and
W17 display well-defined Paschen-series absorption lines but
no significant variations in RV. However, in these cases it is likely
that wider orbits are required in order for non-thermal radio emission
to be detectable, and the relatively short baseline of our first
observations remains insensitive to longer-period, radio-strong
binaries.
,
while the index of W17 is unambiguously non-thermal. The
radio observations therefore suggest that both are CWBs, although they
are only weak detections at X-ray wavelengths (Clark
et al. 2008). None of these objects show significant
RV variations in our data. In the case of W6 and
W30a this is unsurprising, as the broad, weak I-band
spectral features are insensitive to changes in RV due to the
difficulty in determining the line centre, although at favourable
inclination the large RV changes expected of a short-period, high-mass
binary would still be apparent. In contrast, W15 and
W17 display well-defined Paschen-series absorption lines but
no significant variations in RV. However, in these cases it is likely
that wider orbits are required in order for non-thermal radio emission
to be detectable, and the relatively short baseline of our first
observations remains insensitive to longer-period, radio-strong
binaries.
Radial velocity surveys are also expected to be incomplete, as a subset of objects will be viewed at unsuitable orbital inclinations while others do not display spectra that allow accurate RV measurement. There is also an element of chance in conclusively detecting binarity from a limited number of RV measurements, as is apparent from the observations of W13 and W43a: only one of five observations W43a unambiguously identifies it as binary, while by chance three observations of W13 fall at almost exactly the same orbital phase. However, while the short-period binary W13 was detected photometrically (Bonanos 2007) and was also as a strong binary candidate from spectroscopic (Negueruela et al. 2009) and X-ray (Clark et al. 2008) surveys, neither W43a or the probable/candidate binaries W2a, W234 and W3003 have been identified in previous work. Therefore, although the principle aim of our VLT/FLAMES survey is to build a dataset that is sensitive to long-period binaries, there is also great value to close-spaced RV measurements (e.g. the pair from 18/07/2008, MJD = 54665.0 and 24/07/2008, MJD = 54671.1, separated by six days) that effectively detect short-period binaries that are not apparent from photometry or single-epoch spectroscopy.
4.2 Pulsations and the cluster velocity dispersion
The cool hypergiants W243 and W265 are both
undergoing photospheric pulsations, with W265 showing strong
spectroscopic similarities with the non-radially pulsating yellow
hypergiant ![]() Cas (Lobel et al. 2003).
Chromospheric activity is also apparent from core emission in the
near-IR Ca II triplet. We also find significant RV variations
of
Cas (Lobel et al. 2003).
Chromospheric activity is also apparent from core emission in the
near-IR Ca II triplet. We also find significant RV variations
of ![]() 15-25 km s-1
in five early-B targets: while these could
be orbital, in all targets later than spectral type
15-25 km s-1
in five early-B targets: while these could
be orbital, in all targets later than spectral type
![]() B1Ia these
RV
changes are accompanied by changes in absorption line profile
suggestive of photospheric pulsations. The two-month baseline of our
initial data offers prevents us from distinguishing a limited sampling
of a long-period orbit
from photospheric pulsations in the early-B supergiants, and
further observations are required to break this degeneracy. However,
regardless of their origin, these variations imply that care must be
taken in deriving a stellar velocity dispersion for Wd1 from a single
epoch of data. Bosch et al.
(2009) find that the binary population leads to a significant
overestimation of the velocity dispersion for
NGC 2070 unless binaries
are removed from the sample, and the pulsational variations reported
here may have a similar effect on infra-red determinations of the
velocity dispersion for Wd1 (e.g. Mengel
& Tacconi-Garman 2008). We note that separate
VLT/FLAMES observations of the F2Ia+ YHG
W4 also reveal apparent pulsational variations in the
Fe I lines (Clark
et al. 2009b)
and consider it likely that photospheric pulsations are a general
characteristic of the transitional B-type supergiant and cool
hypergiant populations of Wd1.
B1Ia these
RV
changes are accompanied by changes in absorption line profile
suggestive of photospheric pulsations. The two-month baseline of our
initial data offers prevents us from distinguishing a limited sampling
of a long-period orbit
from photospheric pulsations in the early-B supergiants, and
further observations are required to break this degeneracy. However,
regardless of their origin, these variations imply that care must be
taken in deriving a stellar velocity dispersion for Wd1 from a single
epoch of data. Bosch et al.
(2009) find that the binary population leads to a significant
overestimation of the velocity dispersion for
NGC 2070 unless binaries
are removed from the sample, and the pulsational variations reported
here may have a similar effect on infra-red determinations of the
velocity dispersion for Wd1 (e.g. Mengel
& Tacconi-Garman 2008). We note that separate
VLT/FLAMES observations of the F2Ia+ YHG
W4 also reveal apparent pulsational variations in the
Fe I lines (Clark
et al. 2009b)
and consider it likely that photospheric pulsations are a general
characteristic of the transitional B-type supergiant and cool
hypergiant populations of Wd1.
4.3 Binary fraction
Despite the expected limitations of our short-baseline initial dataset,
the results presented here support the high binary fraction implied
from the earlier photometric and multiwavelength observations of Wd1.
Considering just the sample presented here, RV measurements show
W13, W239 and W43a are binaries with
W234, W3003 and W2a likely candidates.
Radio and X-ray measurements strongly suggest a further four targets
(W6, W15, W17 and W30a) are
binaries but RV variations are undetected - and, in two cases,
potentially undetectable - in our VLT/FLAMES data. Any signature of
orbital motion in the two cool hypergiants is masked by photospheric
pulsations, but the LBV W243 requires a hot companion to
produce the observed He I and Ly![]() -pumped Fe II and
O I emission lines that are incompatible with the cool-phase
LBV primary (Ritchie et al.
2009). The YHG W265 is also plausibly binary, being
associated with a compact, resolved radio source (Dougherty & Clark 2008)
which could not be ionized by the YHG itself. While the source of
ionizing photons could simply be the OB supergiant population of Wd1,
the YHG HR 8752 is also detected at radio wavelengths as a
result of the wind being ionized by a B1V companion (Piters
et al. 1988; Stickland & Harmer 1978).
The hot companion also explains the observed [N II] emission
in the spectrum of HR 8752; notably [N II]
-pumped Fe II and
O I emission lines that are incompatible with the cool-phase
LBV primary (Ritchie et al.
2009). The YHG W265 is also plausibly binary, being
associated with a compact, resolved radio source (Dougherty & Clark 2008)
which could not be ionized by the YHG itself. While the source of
ionizing photons could simply be the OB supergiant population of Wd1,
the YHG HR 8752 is also detected at radio wavelengths as a
result of the wind being ionized by a B1V companion (Piters
et al. 1988; Stickland & Harmer 1978).
The hot companion also explains the observed [N II] emission
in the spectrum of HR 8752; notably [N II]
![]() 6548, 6583 emission is visible
in VLT/FLAMES LR6-mode spectra of W265 (but
not in the other YHGs; Clark
et al. 2009b) and [N II]
6548, 6583 emission is visible
in VLT/FLAMES LR6-mode spectra of W265 (but
not in the other YHGs; Clark
et al. 2009b) and [N II] ![]() 6583
emission was also reported by Westerlund
(1987).
6583
emission was also reported by Westerlund
(1987).
Therefore even a conservative estimate that includes just the
robust RV detections![]() and the two objects that lack RV detections but have binarity strongly
implied by other
observations
and the two objects that lack RV detections but have binarity strongly
implied by other
observations![]() suggests a binary fraction of 30% (6/20)
amongst our initial bright sample of supergiant
stars in Wd1, increasing to
suggests a binary fraction of 30% (6/20)
amongst our initial bright sample of supergiant
stars in Wd1, increasing to ![]() 40%
if other candidate binaries are included
40%
if other candidate binaries are included![]() .
Both percentages are likely to increase as more data become available.
If the more evolved WR/WNVL binaries and transitional hypergiants are
excluded, then we find
.
Both percentages are likely to increase as more data become available.
If the more evolved WR/WNVL binaries and transitional hypergiants are
excluded, then we find ![]() 19%
(3/16) of the OB supergiants in our sample are strong binary
detections, rising
to
19%
(3/16) of the OB supergiants in our sample are strong binary
detections, rising
to ![]() 30%
(5/16) if candidates are included. Robust estimates of the binary
fraction amongst the OB supergiant population of Wd1 will become
available once
the full FLAMES dataset is analysed in Paper II of this
series.
However, these values are broadly consistent with the high binary
fraction in the Wolf-Rayet population (Crowther
et al. 2006); future observations and Monte-Carlo
simulations planned
for Paper III will reveal if the binary fraction of the two populations
are equivalent.
30%
(5/16) if candidates are included. Robust estimates of the binary
fraction amongst the OB supergiant population of Wd1 will become
available once
the full FLAMES dataset is analysed in Paper II of this
series.
However, these values are broadly consistent with the high binary
fraction in the Wolf-Rayet population (Crowther
et al. 2006); future observations and Monte-Carlo
simulations planned
for Paper III will reveal if the binary fraction of the two populations
are equivalent.
J.S.C. gratefully acknowledges the support of an RCUK fellowship. I.N. has been funded by grants AYA2008-06166-C03-03 and Consolider-GTC CSD-2006-00070 from the Spanish Ministerio de Ciencia e Innovación (MICINN). We thank an anonymous referee for detailed and constructive comments.
Note added in proof. Further
observations obtained since this paper was submitted confirm W3003 as
a short-period binary.
Appendix A: Radial velocity measurements
Table A.1: Error-weighted radial velocity measurements for the targets listed in Table 2a, b.
References
- Baade, D., Meisenheimer, K., Iwert, O. et al., ESO Messenger, 95, 15
- Bonanos, A. Z. 2007, AJ, 133, 2696 [NASA ADS] [CrossRef]
- Bonnell, I. A., & Bate, M. R. 2005, MNRAS, 362, 915 [NASA ADS] [CrossRef]
- Bonnell, I. A., & Bate, M. R. 2006, MNRAS, 370, 488 [NASA ADS]
- Bonnell, I. A., Bate, M. R., & Zinnecker, H. 1998, MNRAS, 289, 93 [NASA ADS] [CrossRef]
- Bosch, G., Terlevich, E., & Terlevich, R. 2009, AJ, 137, 3437 [NASA ADS] [CrossRef]
- Clark, J. S., & Negueruela, I. 2002, A&A, 396, L25 [NASA ADS] [CrossRef] [EDP Sciences]
- Clark, J. S., Negueruela, I., Crowther, P. A., et al. 2005, A&A, 434, 949 [NASA ADS] [CrossRef] [EDP Sciences]
- Clark, J. S., Muno, M. P., Negueruela, I., et al. 2008, A&A, 477, 147 [NASA ADS] [CrossRef] [EDP Sciences]
- Clark, J. S., Crowther, P. A., & Mikles, V. J. 2009a, A&A, 507, 1567 [CrossRef] [EDP Sciences]
- Clark, J. S., Ritchie, B. W., & Negueruela, I. 2009b, A&A, in prep
- Clark, P. C., & Bonnell, I. A. 2004, MNRAS, 347, L36 [NASA ADS] [CrossRef]
- Clarke, C. J., Bonnell, I. A., & Hillenbrand, L. A. 2000, in Mannings V, ed. A. P. Boss, & S. S. Russell Protostars and Planets IV. (Tucson: Univ. Arizona Press), 151
- Crowther, P. A., Hadfield, L. J., Clark, J. S., Negueruela, I., & Vacca, W. D. 2006, MNRAS, 372, 1407 [NASA ADS] [CrossRef]
- Davies, M. B., Bate, M. R., Bonnell, I. A., Bailey, V. C., & Tout, C. A. 2006, MNRAS, 370, 2038 [NASA ADS] [CrossRef]
- Dougherty, S. M., & Clark, J. S. 2008 in Massive Stars: Fundamental Parameters and Circumstellar Interactions, RMxAC, 33, 68
- Evans, C. J., Smartt, S. J., Lee, J.-K., et al. 2005, A&A, 437, 467 [NASA ADS] [CrossRef] [EDP Sciences]
- García, B., & Mermilliod, J. C., 2001, A&A, 368, 122 [NASA ADS] [CrossRef] [EDP Sciences]
- van der Hucht 2006, A&A, 458, 453 [NASA ADS] [CrossRef] [EDP Sciences]
- Howarth, I. D., Murray, J., Mills, D., et al. 2003, in Starlink User Note 50.24, Rutherford Appleton Laboratory
- Kiminki, D. C., Kobulnicky, H. A., Kinemuchi, K., et al. 2007, ApJ, 664, 1102 [NASA ADS] [CrossRef]
- Kobulnicky, H. A., & Fryer, C. L. 2007, ApJ, 670, 747 [NASA ADS] [CrossRef]
- Lobel, A., Israelian, G., de Jager, C. et al. 1998, A&A, 330, 659 [NASA ADS]
- Lobel, A., & Dupree, A. K. 2000, ApJ, 545, 454 [NASA ADS] [CrossRef]
- Lobel, A., Dupree, A. K., Stefanik, R. P. et al. 2003, ApJ, 583, 923 [NASA ADS] [CrossRef]
- Maeder, A., & Rufener, F. 1972, A&A, 20, 437 [NASA ADS]
- Mengel, S., & Tacconi-Garman, L. E. 2008 in proceedings of the meeting young massive star clusters - initial conditions and environments, [arXiv:0803.4471]
- Moore, C. E. 1945, A multiplet table of astrophysical interest, Contribution from the Princeton University Observatory No. 20
- Munari, U. 2000 in Molecules in Space and in the Laboratory, Italian Phys. Soc., 67, 179
- Negueruela, I., Clark, J. S., Hadfield, L. J., et al. 2008, in Massive Stars as Cosmic Engines, Proceedings of the International Astronomical Union, IAU Symp., 250, 301
- Negueruela, I., Clark, J. S., et al. 2009, A&A, in prep
- Pasquani, L., Avila, G., Blecha, A., et al. 2002, The Messenger, 110, 1 [NASA ADS]
- Piters, A., de Jager, C., & Nieuwenhuijzen, H. 1988, A&A, 196, 115 [NASA ADS]
- Ramsey, L. W. 1981, AJ, 86, 557 [NASA ADS] [CrossRef]
- Rauw, G., Crowther, P. A., De Becker, M., et al., 2005, A&A, 432, 985 [NASA ADS] [CrossRef] [EDP Sciences]
- Ritchie, B. W., Clark, J. S., Negueruela, I., & Najarro, F. 2009, A&A, 507, 1597 [CrossRef] [EDP Sciences]
- Sargent, W. L. 1961, ApJ, 134, 142 [NASA ADS] [CrossRef]
- Sana, H., Antokhina, E., Royer, P., et al. 2005, A&A, 441, 213 [NASA ADS] [CrossRef] [EDP Sciences]
- Sana, H., Gosset, E., Naze, Y., Rauw, G., & Linder, N. 2008, MNRAS, 386, 447 [NASA ADS] [CrossRef]
- Schaller, G. 1990 in confrontation between stellar pulsation and evolution, ASP Conf. Ser. 11, 300
- Schnurr, O., Casoli, J., Chené, A.-N., Moffat, A. F. J., & St-Louis, N. 2008, MNRAS, 389, L38 [NASA ADS] [CrossRef]
- Skinner, S. L., Perna, R., & Zhekov, S. A. 2006, ApJ, 653, 587 [NASA ADS] [CrossRef]
- Stickland, D. J., & Harmer, D. L. 1978, A&A, 70, L53 [NASA ADS]
- Tuthill, P. G., Monnier, J. D., & Danchi, W. C. 1999, Nature, 398, 487 [NASA ADS] [CrossRef]
- van Helden, R. 1972, A&A, 19, 388 [NASA ADS]
- Westerlund, B. E. 1961, PASP, 73, 51 [NASA ADS] [CrossRef]
- Westerlund, B. E. 1987, A&AS, 70, 311 [NASA ADS]
- Yorke, H., & Sonnhalter, C. 2002, ApJ, 569, 846 [NASA ADS] [CrossRef]
- Zinnecker, H., McCaughrean, M. J., & Wilking, B. A. 1993, in Protostars and Planets III. UNiv. Arizona Press, Tucson, ed. E. H. Levy, J. I. Lunine, 429
Footnotes
- ... stars
- This work is based on observations collected at the European Southern Observatory, Paranal Observatory under programme ID ESO 81.D-0324A...E.
- ... wind
- Wind-photosphere interaction may also
result in X-ray emission in systems where the secondary lacks a strong
wind (e.g. the O9V + B1-1.5V binary
CPD -41
 7742;
Sana et al. 2005).
7742;
Sana et al. 2005).
- ... dataset
- Additional data during 2009 is anticipated under ESO program ID 383.D-0633.
- ... objects
- Two GIRAFFE integral field unit modes are also available.
- ... contamination
- To test this hypothesis we have calculated non-LTE model atmosphere synthetic spectra for a range of parameters, with the synthetic spectra showing no evidence for wind contamination, even with mass loss rates an order of magnitude above expected values.
- ...
pipeline
- http://www.eso.org/sci/data-processing/software/pipelines/
- ...
IRAF
- IRAF is distributed by the National Optical Astronomy Observatories, which are operated by the Association of Universities for Research in Astronomy, Inc., under cooperative agreement with the National Science Foundation.
- ...
- W373 lies outside the field of view of Fig. 1 and is located to the south of Wd1 16 arcseconds east of the bright field star HD151018.
- ... database
- http://physics.nist.gov/PhysRefData/ASD/lines_form.html
- ...
- Note that for clarity only four epochs of data are shown in the right panel, with the omitted 17/08/2008 (MJD = 54665.0) profile very similar to the plotted profile from 24/08/2008 (MJD = 54671.1).
- ... wing
- The excess blue-wing absorption forms in a cool, optically-thick expanding wind at smaller optical depth (Lobel et al. 2003).
- ...
star
- The optical spectrum of W30a is also indicative of an interacting binary (Clark et al. 2008).
- ... emission
- Purely thermal emission from W15 would imply a very high mass loss rate inconsistent with the observed spectral type.
- ...
detections
- W13, W43a, W239 and W3003.
- ...
observations
- W30a, a strong X-ray and spectroscopic binary candidate, (Clark et al. 2008), and W243, which displays an emission line spectrum incompatible with an isolated cool hypergiant, (Ritchie et al. 2009).
- ... included
- W6a, W15 and W17 are not included in these percentages, as they are specifically selected from the faint lists as objects we believe to be binary but do not show RV changes in our initial data.
All Tables
Table 1: Summary of observations of the four sets of targets.
Table 2: List of targets.
Table A.1: Error-weighted radial velocity measurements for the targets listed in Table 2a, b.
All Figures
|
|
Figure 1:
VLT/FORS1 R-band finding chart ( |
| Open with DEXTER | |
| In the text | |
|
|
Figure 2: Spectral sequence of selected targets, from the M2II/III field star F1 to the O9.5Ib cluster member W84 with the rest wavelengths of the principal absorption lines marked. Residual sky lines, as discussed in Sect. 2, are visible in some spectra. |
| Open with DEXTER | |
| In the text | |
|
|
Figure 3:
Pa-14 |
| Open with DEXTER | |
| In the text | |
|
|
Figure 4:
C III |
| Open with DEXTER | |
| In the text | |
|
|
Figure 5:
Pa-14 |
| Open with DEXTER | |
| In the text | |
|
|
Figure 6:
Spectral variability in W265. The left panel plots
the region around the Pa-14 |
| Open with DEXTER | |
| In the text | |
|
|
Figure 7:
Spectral variability in W265. The left panel plots
Fe I |
| Open with DEXTER | |
| In the text | |
|
|
Figure 8:
Heliocentric radial velocity changes in low- and high-excitation
absorption lines in W265. Plotted are Fe I
(multiplet 60, |
| Open with DEXTER | |
| In the text | |
|
|
Figure 9:
Spectral variability in the LBV W243. The left panel
plots N I |
| Open with DEXTER | |
| In the text | |
|
|
Figure 10:
The Pa-14 |
| Open with DEXTER | |
| In the text | |
|
|
Figure 11:
Variations in the Paschen-series absorption lines in W78. The
left panel plots the Pa-14 |
| Open with DEXTER | |
| In the text | |
|
|
Figure 12: As Fig. 11, but showing variations in the Paschen-series absorption lines in the short-period binary W43a. |
| Open with DEXTER | |
| In the text | |
Copyright ESO 2009
Current usage metrics show cumulative count of Article Views (full-text article views including HTML views, PDF and ePub downloads, according to the available data) and Abstracts Views on Vision4Press platform.
Data correspond to usage on the plateform after 2015. The current usage metrics is available 48-96 hours after online publication and is updated daily on week days.
Initial download of the metrics may take a while.