| Issue |
A&A
Volume 507, Number 3, December I 2009
|
|
|---|---|---|
| Page(s) | 1211 - 1215 | |
| Section | Astrophysical processes | |
| DOI | https://doi.org/10.1051/0004-6361/200912317 | |
| Published online | 01 October 2009 | |
A&A 507, 1211-1215 (2009)
Quenching of the strong aperiodic accretion disk variability at the magnetospheric boundary
M. Revnivtsev1,2 - E. Churazov3,2 - K. Postnov4 - S. Tsygankov3,2
1 - Excellence Cluster Universe, Technische Universität München, Boltzmannstr. 2, 85748 Garching, Germany
2 -
Space Research Institute, Russian Academy of Sciences, Profsoyuznaya 84/32, 117997 Moscow, Russia
3 -
Max-Planck-Institut für Astrophysics, Karl-Schwarzschild-str. 1, 85741 Garching, Germany
4 -
Sternberg Astronomical Institute, Moscow State University, Universitetskij pr. 13, 119899 Moscow, Russia
Received 10 April 2009 / Accepted 8 September 2009
Abstract
We study power density spectra (PDS) of X-ray flux variability in
binary systems, where the accretion flow is truncated by the
magnetosphere. PDS of accreting X-ray pulsars, where the neutron star
is almost corotating with the accretion disk at the magnetospheric
boundary, have a distinct break/cutoff at the neutron star spin
frequency. This break can naturally be explained by the ``perturbation
propagation'' model, which assumes that at any given radius in the
accretion disk stochastic perturbations are introduced in flow with
frequencies that are characteristic of this radius. These perturbations
are then advected to the region of main energy release leading to a
self-similar variability in the X-ray flux
![]() .
The break in the PDS is then a natural manifestation of the transition
from the disk to the magnetospheric flow at the frequency
characteristic of the accretion disk truncation radius (magnetospheric
radius). The proximity of the PDS break frequency to the spin
frequency in corotating pulsars strongly suggests that the typical
variability timescale in accretion disks is close to the Keplerian one.
In transient accreting X-ray pulsars characterized by large variations
in the mass accretion rate during outbursts, the
PDS break frequency follows the variations in the X-ray flux,
reflecting the change in the magnetosphere size with the accretion
rate. Above the break frequency, the PDS steepens to close to f-2 law which holds over a broad frequency range. These results suggest that strong
f-1...-1.5 aperiodic variability, which is ubiquitous in accretion disks, is not characteristic of magnetospheric flows.
.
The break in the PDS is then a natural manifestation of the transition
from the disk to the magnetospheric flow at the frequency
characteristic of the accretion disk truncation radius (magnetospheric
radius). The proximity of the PDS break frequency to the spin
frequency in corotating pulsars strongly suggests that the typical
variability timescale in accretion disks is close to the Keplerian one.
In transient accreting X-ray pulsars characterized by large variations
in the mass accretion rate during outbursts, the
PDS break frequency follows the variations in the X-ray flux,
reflecting the change in the magnetosphere size with the accretion
rate. Above the break frequency, the PDS steepens to close to f-2 law which holds over a broad frequency range. These results suggest that strong
f-1...-1.5 aperiodic variability, which is ubiquitous in accretion disks, is not characteristic of magnetospheric flows.
Key words: accretion, accretion disks - instabilities - turbulence - stars: binaries: general - stars: magnetic fields - X-rays: general
1 Introduction
Since the beginning of X-ray astronomy it has been recognized, that the flux of accreting X-ray binaries exhibits strong aperiodic variability (see e.g., Oda et al. 1974; Rappaport et al. 1971). Almost immediately after the discovery, the noise in the X-ray light curves of accreting binaries (such as e.g., Cyg X-1) was explained as a superposition of randomly occurring X-ray emission flashes (shots) of similar duration (the shot-noise model, Terrell 1972). This provided an explanation of the shape of the power density spectra (PDS, the Fourier transform of the autocorrelation function of the lightcurve of a source) of different X-ray sources.
However, the accumulation of more data posed serious questions about this paradigm. In particular, it was difficult to explain the enormous range of X-ray variability timescales observed for some sources (see e.g., Churazov et al. 2001) and the linear correlation between the variability amplitude and the average sources flux (Uttley & McHardy 2001). To explain the observed large variability amplitude, the individual flashes or shots in the shot-noise model must be powerful. Therefore, these flashes must originate in the innermost region of the accretion flow, where most of the energy is released. The characteristic timescales in this region are very short - milliseconds or tens of milliseconds for stellar-mass compact objects. However, very often, e.g., in the soft/high state of accreting binaries, the observed power spectra have a power-law shape that extends to frequencies as low as 10 -5-10-6 of Hz, i.e., 5-7 orders of magnitude longer timescales than all timescales characteristic for the region of the main energy release (see Churazov et al. 2001; Gilfanov & Arefiev 2005).
A very promising model for the aperiodic X-ray variability of accreting sources is the ``perturbation propagation'' model (Churazov et al. 2001; Kotov et al. 2001; Arévalo & Uttley 2006; Lyubarskii 1997). In this model, the X-ray flux variability is caused by variations in the instantaneous value of the mass accretion rate in the inner accretion flow. The variations in the mass accretion rate are then related to the perturbations introduced to the accretion flow by the stochastic variations of the disk viscous stresses. In this model the observed variability is a multiplicative superposition of perturbations introduced at different radii. Assuming that the fractional amplitudes of the mass accretion rate perturbations are the same at all radii, the PDS of the emerging lightcurve will naturally appear as a self-similar power law with slope -1...-1.5 up to the maximal frequencies that can be generated in the disk (Lyubarskii 1997). Direct magnetohydrodynamic simulations of accretion flows (see e.g., Hirose et al. 2006; Brandenburg et al. 1995; Balbus & Papaloizou 1999) have predictions that are in agreement with this semi-phenomenological model. In particular, these simulations show that perturbations in the instantaneous mass accretion rate generated at any given radius of the disk have characteristic timescales proportional to the local dynamical time.
This model of the aperiodic X-ray flux variability implies that the presence of the accretion disk edges, both outer and inner, should be reflected in the noise properties of the X-ray light curve. Signatures of the outer edges of accretion disks were found by Gilfanov & Arefiev (2005) in the low frequency parts of the noise power spectra of low mass X-ray binaries.
Accretion disks around compact stars in X-ray binaries should also have inner edges, which should manifest itself in the power spectrum of their X-ray light curves. Specifically, a definite break is expected to be present in the PDS at the characteristic frequency of variability generated at the inner edge of the disk. At frequencies below this break, the power spectrum is expected to be produced in the accretion disk and have a self-similar slope about -1.0...-1.5 (Churazov et al. 2001; Gilfanov & Arefiev 2005; Revnivtsev et al. 2006; Lyubarskii 1997), while at higher frequencies the character of the flow changes and the PDS slope may differ.
In accreting X-ray pulsars and intermediate polars, the central compact object (a neutron star or a white dwarf) has a strong magnetic field, which can disrupt the disk-like accretion flow at the magnetospheric boundary, or even prevent the formation of the accretion disk (as in polars), dividing the flow into two distinct parts - the accretion disk and the magnetospheric flow. The noise properties of these flows may differ.
In the present paper, we compare the PDS of different types of accreting X-ray binaries and discuss observational support for the qualitative picture of aperiodic variability outlined above.
2 Truncated accretion disks in different classes of sources
We consider several classes of accretion X-ray binaries:
- X-ray binaries with compact objects, which have magnetospheres powerful enough to disrupt the accretion disk at large distances (e.g., accreting X-ray pulsars, intermediate polars);
- X-ray binaries with large magnetospheres in which the accretion disk does not form and the accretion proceeds along the magnetosphere from the very beginning (polars).
In contrast, because of the much higher moments of inertia of white dwarfs, it takes a much longer time to bring accreting magnetic white dwarfs in cataclysmic variables into corotation with surrounding accretion disks, and their magnetospheres rotate with periods much longer than the Keplerian ones at the inner disk edge.
The perturbation propagation model makes clear predictions for the noise properties of accretion flows in these classes of objects, namely:
- 1.
- The noise power spectra of accreting sources with large magnetospheres and without an accretion disk (polars, e.g., AM Her), in which matter is transferred directly from the companion star to the compact star via magnetospheric accretion, should differ from those of sources both with accretion disks and without magnetospheres (e.g., accreting black holes like Cyg X-1 in their soft state).
- 2.
- The noise power spectra of sources with an accretion disk truncated at the magnetospheric boundary should have a break corresponding to the characteristic frequency of the disk close to its inner boundary.
- 3.
- If the size of the magnetosphere changes (e.g., in response to a change in the mass accretion rate, as in transient pulsars), the break frequency must change correspondingly.
- 4.
- For persistent X-ray pulsars close to corotation, the comparison between the PDS break frequency and the compact object spin frequency can be used to determine the ratio of the characteristic frequency of perturbations generated in the disk to the Keplerian frequency.
![\begin{figure}
\par\includegraphics[width=8.5cm,clip]{12317_fig1.ps}
\end{figure}](/articles/aa/full_html/2009/45/aa12317-09/img10.png)
|
Figure 1: Power density spectra of
persistent accretion powered X-ray pulsars. The frequency shown along
the X-axis is expressed in units of the compact object spin frequency.
The power density spectra are multiplied by frequency to show the
square of the fractional rms per decade of frequency. For
comparison with the observed profiles, the thick dashed curve
shows an analytical model
|
| Open with DEXTER | |
2.1 Breaks in the power spectra spectra of magnetized accretors
It has been noted in earlier studies (e.g., Hoshino & Takeshima 1993) that noise power spectra of accreting X-ray pulsars typically have breaks close to the pulse frequency. This is shown more clearly in Fig. 1, where we plot the noise power spectra of several persistent X-ray pulsars, including Cen X-3, 4U 1626-67, Vela X-1, 4U 1538-52, GX 301-2, X Persei, and GX 1+4, and of the magnetic white dwarf (polar) AM Her. The frequency scale of their power spectra is normalized by multiplying by the pulse period of the sources. The variability associated with regular pulsations was removed from the original X-ray light curves by subtracting folded segments of light curves with a duration of 10-20 spin periods. This procedure does not remove the contribution of regular pulsations completely since the periodic and aperiodic variabilities often exhibits nonlinear interactions (see e.g., the discussion in Tsygankov et al. 2007); however, it is good enough as the first approximation (see e.g., Finger et al. 1996).
It is seen that all power spectra of accreting X-ray pulsars have clear breaks at approximately their spin frequency. PDSs of all sources have a similar power-law slope above the break frequency, irrespective of the PDS form at lower frequencies.
In the framework of the perturbation propagation model (see e.g. Churazov et al. 2001; Lyubarskii 1997), we can interpret this observational fact as a signature of the truncation of the accretion disk flow and its conversion into a magnetospheric flow.
The proximity of the PDS break frequency to the spin frequency (which in the case of corotating systems is close to the frequency of the Keplerian rotation around the compact object at the inner edge of the accretion disk) allows us to conclude that the characteristic timescale of variability produced at some distance from the central compact objects are close to the local Keplerian timescale.
Figure 1 shows that
above the break frequency the power spectrum of the flux variability is
typically a power law with a slope close to ![]() .
We cannot exclude this slope of the flux
variability being a property of magnetospheric accretion, however, similar power spectra slopes
sometimes observed in accreting systems without magnetospheric accretion, e.g., unmagnetized cataclysmic variables (see e.g. Kraicheva et al. 1999; Pandel et al. 2003).
.
We cannot exclude this slope of the flux
variability being a property of magnetospheric accretion, however, similar power spectra slopes
sometimes observed in accreting systems without magnetospheric accretion, e.g., unmagnetized cataclysmic variables (see e.g. Kraicheva et al. 1999; Pandel et al. 2003).
2.2 Change in the magnetospheric size with mass accretion rate
If the break frequency in the noise power spectra of accreting X-ray pulsars reflects the timescale of noise generation at the inner boundary of the accretion disk/flow, its value should depend on the mass accretion rate of the binary system. An increase in the mass accretion rate decreases the size of the magnetosphere (and hence the inner radius of the disk) and brings the system away from the corotation, so that the characteristic frequency at the inner edge of the disk/flow increase. A similar situation should be observed in the case of luminous intermediate polars (accreting magnetized white dwarfs with moderate magnetospheres), which are typically out of the corotation.
We can verify this hypothesis by examining power spectra of bright transient X-ray pulsars (such as A0535+26, 4U0115+63, V0332+53, KS 1947+300), which illustrate the wide range of X-ray luminosities occurring during outbursts, and power spectra of luminous intermediate polars (e.g., V1223 Sgr).
In Fig. 2, we show
examples of the power spectra of the pulsar A0535+26 during its bright
outburst in 2005 and the power spectrum of V1223 Sgr. The power
spectra of A0535+26 were averaged over two time intervals: a) of
low X-ray luminosity (
![]() erg/s) (low mass accretion rate) and b) of higher luminosity (
erg/s) (low mass accretion rate) and b) of higher luminosity (
![]() erg/s)
(higher mass accretion rate). The power spectrum of V1223 Sgr is
averaged for all publicly available RXTE observations.
erg/s)
(higher mass accretion rate). The power spectrum of V1223 Sgr is
averaged for all publicly available RXTE observations.
From Fig. 2, it is clear that the power spectra of A0535+26 for different luminosity states differ significantly at frequencies higher than the pulse frequency, while at lower frequencies the PDSs are almost identical. The difference at high frequencies is essentially the addition of an extra noise component, which is presumably generated in the ring of an accretion disk between the radii corresponding to the magnetosphere size at a high accretion rate (small radius) and low accretion rate (large radius). This ring and its associated variability were absent for a low accretion rate.
The noise power spectrum of V1223 Sgr closely resembles that of A0535+26 in the bright state. This similarity reflects that both systems are out of corotation with their accretion disks - the magnetospheres are squeezed by the increased accretion flow, and the inner parts of the accretion disks rotate much faster than the central object.
![\begin{figure}
\par\includegraphics[width=8.5cm,clip]{12317_fig2.ps}
\vspace*{3mm}
\end{figure}](/articles/aa/full_html/2009/45/aa12317-09/img14.png)
|
Figure 2: Power density spectra of accreting X-ray pulsar A0535+26 at low accretion rate (labeled as ``faint'') and in the strong spin-up regime during the outburst (labeled as ``bright''). The upper curves shows the power spectrum of the luminous intermediate polar V1223 Sgr. |
| Open with DEXTER | |
If the characteristic frequency f0 of the noise at the magnetospheric boundary ![]() is proportional to the frequency of the Keplerian rotation
is proportional to the frequency of the Keplerian rotation
![]() of matter at the inner edge of the accretion disk
of matter at the inner edge of the accretion disk
![]() ,
we can relate the observed break frequency to the instantaneous value of the mass accretion rate
,
we can relate the observed break frequency to the instantaneous value of the mass accretion rate ![]() (see e.g., Lamb et al. 1973; Pringle& Rees 1972; Bildsten et al. 1997; Davidson & Ostriker 1973) with
(see e.g., Lamb et al. 1973; Pringle& Rees 1972; Bildsten et al. 1997; Davidson & Ostriker 1973) with
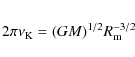
where
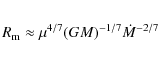
is the standard expression for the magnetospheric radius, and
![\begin{figure}
\par\includegraphics[width=8.5cm,clip]{12317_fig3.ps}
\end{figure}](/articles/aa/full_html/2009/45/aa12317-09/img23.png)
|
Figure 3:
Dependence of the break frequency in the noise power spectrum
of A0535+26 on the 3-20 keV X-ray flux (filled circles). The dependence of the QPO frequency observed by Finger et al. (1996) during the source outburst in 1994, is shown by open dotted circles. The solid circles show the results of Finger et al. (1996) when the QPO frequency is recalculated at the break frequency to be
|
| Open with DEXTER | |
This is exactly what was seen during the evolution of the outburst of
A0535+262 observed by RXTE in 2005 (we inserted X-ray luminosity
![]() instead of the
mass accretion rate
instead of the
mass accretion rate ![]() into Eq. (1)). The dependence of the break frequency (
into Eq. (1)). The dependence of the break frequency (![]() in Eq. (1)) on the X-ray flux of A0535+262 is shown in Fig. 3 (filled circles). In this plot we show used all RXTE observations of this outburst after
in Eq. (1)) on the X-ray flux of A0535+262 is shown in Fig. 3 (filled circles). In this plot we show used all RXTE observations of this outburst after ![]() MJD 53 613, when the stable regime of accretion was established (see Postnov et al. 2008; Caballero et al. 2008).
MJD 53 613, when the stable regime of accretion was established (see Postnov et al. 2008; Caballero et al. 2008).
![\begin{figure}
\par\includegraphics[width=8cm,clip]{12317_fig4top.ps}\vspace*{5mm}
\par\includegraphics[width=8.2cm,clip]{12317_fig4bottom.ps}
\end{figure}](/articles/aa/full_html/2009/45/aa12317-09/img26.png)
|
Figure 4:
Upper panel: power spectra of Cen X-3 and 4U1626-67 with
low-frequency QPOs (the variability associated with regular pulsations
has been subtracted from the original X-ray light curves). The
frequency axis has been scaled by the break frequency in the
corresponding power spectrum. Lower panel: the broadband X-ray
energy spectrum of A0535+26 observed by RXTE during its outburst in
2005. For this spectrum, the ratio of energy fluxes
in 20-100 keV to those in 3-20 keV energy band is
approximately |
| Open with DEXTER | |
We note that the dependence
![]() was previously established for the centroid frequency of quasi-periodic
X-ray oscillations in the power spectra of A0535+26 detected during its
giant outburst in 1994 (Finger et al. 1996).
The authors argued that the oscillations originate in the inner
boundary of the accretion disk and are related to either the Keplerian
rotation at the inner edge of the disk or the beat frequency between
the Keplerian rotation and rotation of the neutron star magnetosphere
(e.g., Alpar & Shaham 1985).
was previously established for the centroid frequency of quasi-periodic
X-ray oscillations in the power spectra of A0535+26 detected during its
giant outburst in 1994 (Finger et al. 1996).
The authors argued that the oscillations originate in the inner
boundary of the accretion disk and are related to either the Keplerian
rotation at the inner edge of the disk or the beat frequency between
the Keplerian rotation and rotation of the neutron star magnetosphere
(e.g., Alpar & Shaham 1985).
We can attempt to combine our present RXTE measurements with QPO studies by Finger et al. (1996) by assuming that:
- a)
- when low-frequency QPOs are observed in power spectra of
accreting pulsars, their centroid frequency is related to the break
frequency as
 1:2.5 (Fig. 4, upper panel, see also Angelini et al. 1989,
for QPO in EXO 2030+375). The correlation of the QPO and the break
frequencies is also observed in LMXBs, although in these objects the
centroid of the QPO feature is usually above the break frequency
(see e.g. Wijnands & van der Klis 1999);
1:2.5 (Fig. 4, upper panel, see also Angelini et al. 1989,
for QPO in EXO 2030+375). The correlation of the QPO and the break
frequencies is also observed in LMXBs, although in these objects the
centroid of the QPO feature is usually above the break frequency
(see e.g. Wijnands & van der Klis 1999);
- b)
- during RXTE observations of the source outburst in 2005, the X-ray flux of the A0535+26 in the energy band 20-100 keV (the range where measurements by Finger et al. 1996 were done) is approximately a factor of 0.55 of the X-ray flux in the energy band 3-20 keV (see the RXTE spectrum shown in the lower panel of Fig. 4).
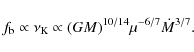
Prominent QPO features similar to those detected by Finger et al. (1996) are not always observed in the power spectra of accreting X-ray pulsars. On the other hand a break in the PDS is more ubiquitous, and therefore the diagnostics of the accretion flow based on the break frequency can be applied to larger datasets. For example, the break frequency in the noise power spectrum can be used as an estimate of the dipole magnetic moment of compact objects using Eq. (1).
3 Conclusions
We have studied the aperiodic variability of the X-ray flux from accreting binaries, in which the truncation of the disk-like accretion flow by the magnetosphere of the compact object is important. The results can be summarized as follows:
- There is a distinct break in the power density spectra of accreting magnetized neutron stars and white dwarfs, apparently associated with the change of the disk-like accretion flow to the magnetospheric flow cloe to the Alfvenic surface.
- In transient systems with variable X-ray luminosity, the PDS break frequency
 changes with the X-ray luminosity (mass accretion rate) as
 ,
in agreement with the standard theory of accretion onto magnetized compact stars.
,
in agreement with the standard theory of accretion onto magnetized compact stars.
- This break can naturally be explained by the
``perturbation propagation'' model, which assumes that at any given
radius in the accretion disk stochastic perturbations at frequencies
characteristic of this radius are introduced to the flow. These
perturbations are then advected by the flow to the region of main
energy release, procuding a self-similar form of the PDS,
 .
The break in the PDS corresponds to a frequency that is characteristic
of the accretion disk truncation radius (the magnetospheric radius).
.
The break in the PDS corresponds to a frequency that is characteristic
of the accretion disk truncation radius (the magnetospheric radius).
- We suggest that the PDS break frequency is directly related to the magnetospheric radius for a given value of the mass accretion rate and can be used to estimate the magnetic moment of accreting compact stars.
- For systems close to corotation (accreting X-ray pulsars), the PDS break frequency is close to the spin frequency of the neutron star. This strongly suggests that the characteristic frequency of perturbations introduced to the accretion flow in the disk is of the order of the local Keplerian frequency.
- In all studied objects, the PDS above the break frequency follows the
 law over a broad range of frequencies, suggesting that the strong
f-1...-1.5 aperiodic variability which is ubiquitous in accretion disks is not characteristic of magnetospheric flows.
law over a broad range of frequencies, suggesting that the strong
f-1...-1.5 aperiodic variability which is ubiquitous in accretion disks is not characteristic of magnetospheric flows.
The authors thank the anonymous referee for useful comments. Authors thank Marat Gilfanov for useful discussions. This research made use of data obtained from the High Energy Astrophysics Science Archive Research Center Online Service, provided by the NASA/Goddard Space Flight Center. K.P. thanks the MPA for hospitality. This work was supported by DFG-Schwerpunktprogramme (SPP 1177), grants of Russian Foundation of Basic Research 07-02-01051, 07-02-00961-a, 08-08-13734, NSh-5579.2008.2 and the RAS program ``The origin and evolution of stars and galaxies'' (P04).
References
- Alpar, M. A., & Shaham, J. 1985, Nature, 316, 239 [NASA ADS] [CrossRef]
- Angelini, L., Stella, L., & Parmar, A. N. 1989, ApJ, 346, 906 [NASA ADS] [CrossRef]
- Arévalo, P., & Uttley, P. 2006, MNRAS, 367, 801 [NASA ADS] [CrossRef]
- Balbus, S. A., & Papaloizou, J. C. B. 1999, ApJ, 521, 650 [NASA ADS] [CrossRef]
- Bildsten, L., Chakrabarty, D., Chiu, J., et al. 1997, ApJS, 113, 367 [NASA ADS] [CrossRef]
- Bradt, H. V., Rothschild, R. E., & Swank, J. H. 1993, A&AS, 97, 355 [NASA ADS]
- Brandenburg, A., Nordlund, A., Stein, R. F., & Torkelsson, U. 1995, ApJ, 446, 741 [NASA ADS] [CrossRef]
- Caballero, I., Santangelo, A., Kretschmar, P., et al. 2008, A&A, 480, L17 [NASA ADS] [CrossRef] [EDP Sciences]
- Churazov, E., Gilfanov, M., & Revnivtsev, M. 2001, MNRAS, 321, 759 [NASA ADS] [CrossRef]
- Corbet, R. H. D. 1984, A&A, 141, 91 [NASA ADS]
- Davidson, K., & Ostriker, J. P. 1973, ApJ, 179, 585 [NASA ADS] [CrossRef]
- Finger, M. H., Wilson, R. B., & Harmon, B. A. 1996, ApJ, 459, 288 [NASA ADS] [CrossRef]
- Ghosh, P., & Lamb, F. K. 1979, ApJ, 234, 296 [NASA ADS] [CrossRef]
- Gilfanov, M., & Arefiev, V. 2005, MNRAS, submitted [arXiv:astro-ph/0501215]
- Hirose, S., Krolik, J. H., & Stone, J. M. 2006, ApJ, 640, 901 [NASA ADS] [CrossRef]
- Hoshino, M., & Takeshima, T. 1993, ApJ, 411, L79 [NASA ADS] [CrossRef]
- Kotov, O., Churazov, E., & Gilfanov, M. 2001, MNRAS, 327, 799 [NASA ADS] [CrossRef]
- Kraicheva, Z., Stanishev, V., Genkov, V., & Iliev, L. 1999, A&A, 351, 607 [NASA ADS]
- Lamb, F. K., Pethick, C. J., & Pines, D. 1973, ApJ, 184, 271 [NASA ADS] [CrossRef]
- Lipunov, V. M., & Shakura, N. I. 1976, SvAL, 2, 133 [NASA ADS]
- Lyubarskii, Y. E. 1997, MNRAS, 292, 679 [NASA ADS]
- Matthaeus, W. H, Klein, L. W., Ghosh, S., & Brown, M. R. 1991, J. Geophys. Res., 96, 5421 [NASA ADS] [CrossRef]
- Oda, M., Takagishi, K., Matsuoka, M., Miyamoto, S., & Ogawara, Y. 1974, PASJ, 26, 303 [NASA ADS]
- Pandel, D., Córdova, F. A., & Howell, S. B. 2003, MNRAS, 346, 1231 [NASA ADS] [CrossRef]
- Postnov, K., Staubert, R., Santangelo, A., et al. 2008, A&A, 480, L21 [NASA ADS] [CrossRef] [EDP Sciences]
- Pringle, J. E., & Rees, M. J. 1972, A&A, 21, 1 [NASA ADS]
- Rappaport, S., Doxsey, R., & Zaumen, W. 1971, ApJ, 168, L43 [NASA ADS] [CrossRef]
- Revnivtsev, M., Fabrika, S., Abolmasov, P., et al. 2006, A&A, 447, 545 [NASA ADS] [CrossRef] [EDP Sciences]
- Shakura, N. I. 1975, SvAL, 1, 223 [NASA ADS]
- Terrell, N. J. J. 1972, ApJ, 174, L35 [NASA ADS] [CrossRef]
- Tsygankov, S. S., Lutovinov, A. A., Churazov, E. M., & Sunyaev, R. A. 2007, AstL, 33, 368 [NASA ADS]
- Uttley, P., & McHardy, I. M. 2001, MNRAS, 323, L26 [NASA ADS] [CrossRef]
- Wijnands, R., & van der Klis, M. 1999, ApJ, 514, 939 [NASA ADS] [CrossRef]
- Ziolkowski, J. 1985, AcA, 35, 185 [NASA ADS]
All Figures
|
|
Figure 1: Power density spectra of
persistent accretion powered X-ray pulsars. The frequency shown along
the X-axis is expressed in units of the compact object spin frequency.
The power density spectra are multiplied by frequency to show the
square of the fractional rms per decade of frequency. For
comparison with the observed profiles, the thick dashed curve
shows an analytical model
|
| Open with DEXTER | |
| In the text | |
|
|
Figure 2: Power density spectra of accreting X-ray pulsar A0535+26 at low accretion rate (labeled as ``faint'') and in the strong spin-up regime during the outburst (labeled as ``bright''). The upper curves shows the power spectrum of the luminous intermediate polar V1223 Sgr. |
| Open with DEXTER | |
| In the text | |
|
|
Figure 3:
Dependence of the break frequency in the noise power spectrum
of A0535+26 on the 3-20 keV X-ray flux (filled circles). The dependence of the QPO frequency observed by Finger et al. (1996) during the source outburst in 1994, is shown by open dotted circles. The solid circles show the results of Finger et al. (1996) when the QPO frequency is recalculated at the break frequency to be
|
| Open with DEXTER | |
| In the text | |
|
|
Figure 4:
Upper panel: power spectra of Cen X-3 and 4U1626-67 with
low-frequency QPOs (the variability associated with regular pulsations
has been subtracted from the original X-ray light curves). The
frequency axis has been scaled by the break frequency in the
corresponding power spectrum. Lower panel: the broadband X-ray
energy spectrum of A0535+26 observed by RXTE during its outburst in
2005. For this spectrum, the ratio of energy fluxes
in 20-100 keV to those in 3-20 keV energy band is
approximately |
| Open with DEXTER | |
| In the text | |
Copyright ESO 2009
Current usage metrics show cumulative count of Article Views (full-text article views including HTML views, PDF and ePub downloads, according to the available data) and Abstracts Views on Vision4Press platform.
Data correspond to usage on the plateform after 2015. The current usage metrics is available 48-96 hours after online publication and is updated daily on week days.
Initial download of the metrics may take a while.