| Issue |
A&A
Volume 506, Number 3, November II 2009
|
|
|---|---|---|
| Page(s) | L45 - L48 | |
| Section | Letters | |
| DOI | https://doi.org/10.1051/0004-6361/200913026 | |
| Published online | 01 October 2009 | |
A&A 506, L45-L48 (2009)
LETTER TO THE EDITOR
Observations and 3D MHD simulations of a solar active region jet
C. Gontikakis1 - V. Archontis2 - K. Tsinganos3
1 - Research Center for Astronomy and Applied Mathematics, Academy of Athens, 4 Soranou Efessiou Str., Athens 11527, Greece
2 -
School of Mathematics and Statistics. St. Andrews University, St. Andrews, KY16 9SS, UK
3 - Section of Astrophysics, Astronomy and Mechanics, Department of
Physics, University of Athens, Panepistimiopolis, Zografos 157 84,
Athens, Greece
Received 30 July 2009 / Accepted 22 September 2009
Abstract
Aims. We study an active region jet originating from NOAA 8531
on May 15 1999. We perform 3D MHD numerical simulations of
magnetic flux emergence and its subsequent reconnection with
preexisting magnetic flux. Then, we compare the physical properties of
the observed jet with the reconnecting outflow produced in the
numerical model.
Methods. We report observations of this jet using a series of
TRACE 171 Å filtergrams, simultaneous observations from SUMER in
Ne VIII 770Å and C IV 1548 Å
as well as MDI magnetograms. In the numerical simulation, the full
compressible and resistive MHD equations are solved, including
viscous and Ohmic heating.
Results. A high-velocity upflow (![]() 100 km s-1)
is observed after the emergence of new magnetic flux at the edge of the
active region. The jet is recorded over a range of temperatures between
105 K and
100 km s-1)
is observed after the emergence of new magnetic flux at the edge of the
active region. The jet is recorded over a range of temperatures between
105 K and
![]() K.
In our numerical experiments, we find that the jet is the result of
magnetic reconnection between newly emerging flux and the preexisting
magnetic field of the active region.
K.
In our numerical experiments, we find that the jet is the result of
magnetic reconnection between newly emerging flux and the preexisting
magnetic field of the active region.
Conclusions. The hot and high-velocity bidirectional flows occur
as a result of the interaction between oppositely directed magnetic
fields. Observations and numerical results are strongly suggestive of
effective reconnection process being responsible for producing jets
when emerging flux appears in solar active regions.
Key words: magnetohydrodynamics (MHD) - methods: numerical - Sun: activity - Sun: corona - Sun: magnetic fields
1 Introduction
Jets are transient, thin, elongated features that occur mainly in polar coronal holes and at the edges of active regions. They have been observed in various wavelengths (X-ray, EUV and HIn many numerical simulations (Yokoyama & Shibata 1996; Moreno Insertis et al. 2008; Archontis et al. 2005), the process of reconnection between an emerging sub-photospheric magnetic flux and preexisting magnetic field in the ambient atmosphere has been used to reproduce solar-like jets. These are reconnection jets where the plasma acceleration is due to the slingshot effect (Shibata 1996). Other studies (Shimojo et al. 2001; Chifor et al. 2008b) suggest that an X-ray jet is the evaporation flow produced by e.g. flaring activity in the close vicinity of a large-scale loop. Observations and numerical models indicate that a fraction of jets exhibit helical structure undergoing untwisting (Canfield et al. 1996; Patsourakos et al. 2008; Pariat et al. 2009).
In this Letter we present observations of jets occurring close to an active region, cospatial with a flux emergence event. We use the observations to determine the kinetic and thermodynamic properties of the jets. Then, we briefly present the first results of a systematic effort to couple 3D MHD simulations of flux emergence and associated magnetic reconnection with observations of solar active region jets. Our numerical results show that the physical properties of the reconnecting outflows produced in the simulations are in good qualitative and quantitative agreement with the corresponding properties of jets observed in solar active regions.
2 Observations
The jet under study occured in the active region NOAA 8541 on May 15, 1999. The event, followed over time in TRACE 171 Å, (![\begin{figure}
\par\includegraphics[width=8cm,clip]{13026fig1.eps}
\end{figure}](/articles/aa/full_html/2009/42/aa13026-09/img6.png)
|
Figure 1: Summary of the TRACE 171 Å (panels a- f), SUMER (panels g- j) and MDI (panels k, l) observations of the jet. SUMER panels show: the Ne VIII 770 Å, intensity g), dopplergram h), C IV 1548 Å, intensity i) and dopplergram j). Panels k) and l) show the MDI magnetogram at 14:24 UT and the difference between the 14:24 and 12:48 magnetograms. In panel h) Doppler shifts range from -100 km s-1 (blueshift, black) to 40 km s-1 (redshift, white) while in panel j), they range from -20 km s-1 (blueshift, black) to 33 km s-1 (redshift, white) and in panel k), magnetic fields range from -450 Gauss (black) to 50 Gauss (white). The jet in panels a) to d) has its maximum brightness. In panels e) and f) the jet is observed simultaneously with the SUMER observations of panels g) to j). The intensity isocontours of panel g), when overlaid on panel h) include upward motions along the jet (black on the dopplergram) and downward motions at the bright area. In panels k), l) the two arrows indicate the emerging magnetic flux. In panel d), the white isocontour shows the emerging flux while the grey isocontour shows a pre-existing, negative polarity. |
| Open with DEXTER | |
We applied standard treatment for the SUMER data (Teriaca et al. 1999). Moreover, for the dopplergrams
derived with SUMER, a reference velocity is computed by using chromospheric
lines with an uncertainty of ![]() 6 km s-1 (see Gontikakis et al. 2006).
The proper motions along the jet, measured from the variation of the jet length in successive 171 Å filtergrams
from 14:42 UT to 14:47 UT, are of
6 km s-1 (see Gontikakis et al. 2006).
The proper motions along the jet, measured from the variation of the jet length in successive 171 Å filtergrams
from 14:42 UT to 14:47 UT, are of ![]() 90 km s-1. At the same time,
the average blue shifts measured along the jet, using Ne VIII
770 Å, was of
90 km s-1. At the same time,
the average blue shifts measured along the jet, using Ne VIII
770 Å, was of ![]() km s-1, with blueshift/redshift corresponding to negative/positive velocities through our work. In Gontikakis et al. 2006, we considered that these were two components of the same plasma flow,
one in the plane of the sky (the proper motions) and one along the
line of sight (the Doppler shifts). Their combination provided a
full velocity of 117 km s-1 and an angle of the jet of 26
km s-1, with blueshift/redshift corresponding to negative/positive velocities through our work. In Gontikakis et al. 2006, we considered that these were two components of the same plasma flow,
one in the plane of the sky (the proper motions) and one along the
line of sight (the Doppler shifts). Their combination provided a
full velocity of 117 km s-1 and an angle of the jet of 26![]() to
the normal on the solar surface. The jet is apparent as blueshifted with velocities -10 to -20 km s-1 in the C IV
1548 Å line. The bright structure, which appears to be composed
of small unresolved loops in one 171 image (Fig. 1 panels c, d), appears redshifted in the C IV and
Ne VIII lines by
to
the normal on the solar surface. The jet is apparent as blueshifted with velocities -10 to -20 km s-1 in the C IV
1548 Å line. The bright structure, which appears to be composed
of small unresolved loops in one 171 image (Fig. 1 panels c, d), appears redshifted in the C IV and
Ne VIII lines by ![]() km s-1 (Fig. 1 panel j). The upflow together with the
lower, bright feature, form a structure with an ``L-like'' shape.
km s-1 (Fig. 1 panel j). The upflow together with the
lower, bright feature, form a structure with an ``L-like'' shape.
Applying the emission measure loci technique (Schmelz et al. 1996), the jet plasma seems to have a transition region component observed in the C IV 1548 and 1550 Å lines with an emission measure of ![]() 1042.5 cm-3 and a coronal component appearing in Ne VIII 770 Å, and in 171 filtergrams with a temperature range of 600 000 K to
1042.5 cm-3 and a coronal component appearing in Ne VIII 770 Å, and in 171 filtergrams with a temperature range of 600 000 K to
![]() K with an emission measure of
K with an emission measure of
![]() cm-3. The jet does not appear in the chromospheric temperature line of Si II 1533 Å,
nor in the continuum, restricting the temperature range of the jet
plasma only in the transition region and coronal temperatures. From the
emission measure value, a jet width of
cm-3. The jet does not appear in the chromospheric temperature line of Si II 1533 Å,
nor in the continuum, restricting the temperature range of the jet
plasma only in the transition region and coronal temperatures. From the
emission measure value, a jet width of
![]() derived from 171 filtergrams and a unity filling factor, we can estimate the coronal plasma electron density as
derived from 171 filtergrams and a unity filling factor, we can estimate the coronal plasma electron density as
![]() cm-3 within a factor of 2.
cm-3 within a factor of 2.
3 Numerical model
The numerical experiment was performed in a three-dimensional Cartesian box of dimensionless size
using a 3D version of the Lare shock-capturing code
(see Arber et al. 2001). The time-dependent, resistive and compressible MHD
equations are solved by a Lagrangian remap scheme.
The energy equation includes small shock viscosity and Joule dissipation terms.
The resistivity is uniform, with a value of
![]() .
Radiative transfer and heat conduction are not included.
The equations are solved in a uniform grid of (256,256,256) in the
two horizontal (x,y) and the vertical (z) directions, respectively.
The dimensionless size of the domain is
.
Radiative transfer and heat conduction are not included.
The equations are solved in a uniform grid of (256,256,256) in the
two horizontal (x,y) and the vertical (z) directions, respectively.
The dimensionless size of the domain is
![]() in
the (x,y,z) directions.
The physical size of the box is
in
the (x,y,z) directions.
The physical size of the box is
![]() Mm.
We use a uniformly spaced coordinate system in all directions.
The background stratification includes
a constant-entropy region of 3.4 Mm thickness that simulates the
uppermost layers of the solar interior just below the surface; an
isothermal layer (T=6500 K) with thickness 1.7 Mm that represents
the photosphere and the chromosphere and an isothermal
corona at T=106 K with a thickness of 16.1 Mm. The photosphere
and chromosphere are joined to the corona through a transition region
with a steep temperature gradient.
Our aim is to study the interaction of an emerging bipolar region and a small active region.
The latter is formed by the dynamic rise of a flux rope in the photosphere and
its lateral expansion into the higher atmosphere. The appearance of new magnetic flux at the
outskirts of the preexisting active region is simulated by the emergence of another flux rope, smaller in size
and weaker in field strength.
Mm.
We use a uniformly spaced coordinate system in all directions.
The background stratification includes
a constant-entropy region of 3.4 Mm thickness that simulates the
uppermost layers of the solar interior just below the surface; an
isothermal layer (T=6500 K) with thickness 1.7 Mm that represents
the photosphere and the chromosphere and an isothermal
corona at T=106 K with a thickness of 16.1 Mm. The photosphere
and chromosphere are joined to the corona through a transition region
with a steep temperature gradient.
Our aim is to study the interaction of an emerging bipolar region and a small active region.
The latter is formed by the dynamic rise of a flux rope in the photosphere and
its lateral expansion into the higher atmosphere. The appearance of new magnetic flux at the
outskirts of the preexisting active region is simulated by the emergence of another flux rope, smaller in size
and weaker in field strength.
Rising buoyant magnetic flux tubes, subject to fragmentation by the
Rayleigh-Taylor and Kelvin-Helmholtz instabilities, have been
treated in Tsinganos (1980).
In the present simulations, the flux ropes are considered as curved loops with footpoints anchored in the deeper layer of the
convection zone. We use the same boundary and initial conditions as the work by Hood et al. 2009, who studied
the emergence of one toroidal flux tube in a stratified atmosphere. Thus, the curved loops in our experiment are made buoyant
by setting the temperature inside the loops equal to the temperature of the external medium.
The excess pressure is
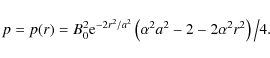
|
(1) |
Where B0 is the axial magnetic field strength, a is the minor radius of the flux tube, r is the radial distance and
When the first flux rope reaches the photosphere, at t=3.5 min, a bipolar region is formed. Eventually, the two main polarities drift apart, moving along the y-direction. The magnetic field spreads out, forming a magnetic layer at the isothermal photosphere. Now, magnetic pressure builds up as more internal magnetic layers rise to the photosphere. This enhancement of magnetic pressure triggers the magnetic buoyancy instability and, thus, the field rises further into the non-magnetized corona. The lateral expansion creates an ambient magnetic field for the following emerging tube to rise into. The flux emergence of the second toroidal loop is followed by dynamical interaction (e.g., reconnection) between the upcoming and the ambient field.
![\begin{figure}
\par\includegraphics[width=8.2cm,clip]{13026fig2.eps}
\end{figure}](/articles/aa/full_html/2009/42/aa13026-09/img22.png)
|
Figure 2:
Distribution of
|
| Open with DEXTER | |
Figure 2 shows the distribution of
![]() at the photosphere and the topology of the fieldlines
around the active region. New magnetic flux (fieldlines in white) emerges close to one of the sides
of the active region (yellow fieldlines): the positive polarity of the emerging field intersects the photosphere at the vicinity
of the negative polarity of the preexisting field.
at the photosphere and the topology of the fieldlines
around the active region. New magnetic flux (fieldlines in white) emerges close to one of the sides
of the active region (yellow fieldlines): the positive polarity of the emerging field intersects the photosphere at the vicinity
of the negative polarity of the preexisting field.
Eventually, the magnetic pressure force of the emerging field leads to the expansion of the field, which is pressed against
the ambient field. A current layer is formed at the interface between the two magnetic flux systems. The value
of the relative angle between the emerging fieldlines and the preexisting field changes over the dynamical
evolution of the system in the three-dimensional space. It increases as the two polarities of the emerging field move
away from each other along the y-direction. A typical value of the relative angle at t=20 min is ![]() 150 degrees and, thus,
the orientation of the fieldlines becomes favorable for effective reconnection.
150 degrees and, thus,
the orientation of the fieldlines becomes favorable for effective reconnection.
![\begin{figure}
\par\mbox{\includegraphics[width=5.8cm,clip]{13026fig3a.eps} \hspace*{3mm}
\includegraphics[width=5.8cm,clip]{13026fig3b.eps} }
\par
\end{figure}](/articles/aa/full_html/2009/42/aa13026-09/img24.png)
|
Figure 3: Left: Distribution of the vertical velocity (colormap) and projection of the full magnetic field vector (arrows) onto the vertical (x=1 Mm) plane. Right: distribution of temperature (colormap) and vertical velocity (arrows) onto the same plane. Time is, t=20 min. |
| Open with DEXTER | |
Figure 3 is a vertical cut at x=1 Mm and t=20 min, showing the distribution of ![]() (left panel) and temperature (right panel).
The full magnetic field vector and vertical velocity are overplotted (arrows) in the two panels.
As reconnection occurs across the current structure, new links are established between the emerging and the pre-existing
coronal field. Underneath the current layer, reconnected fieldlines adopt a loop-like shape
and join the positive polarity of the emerging field with the negative polarity of the active region. At the upper edge, another set of reconnected fieldlines
lie over the emerging field and couple the two remaining polarities.
(left panel) and temperature (right panel).
The full magnetic field vector and vertical velocity are overplotted (arrows) in the two panels.
As reconnection occurs across the current structure, new links are established between the emerging and the pre-existing
coronal field. Underneath the current layer, reconnected fieldlines adopt a loop-like shape
and join the positive polarity of the emerging field with the negative polarity of the active region. At the upper edge, another set of reconnected fieldlines
lie over the emerging field and couple the two remaining polarities.
Emission of a high velocity outflow occurs at the upper edge of the current layer. This is a reconnection jet, which is
moving with speeds of around 100 km s-1 (which is comparable to the local Alfvén speed). The jet is magnetically driven and accelerated by the tension
of the reconnected magnetic field lines.
The flow, which is propagating downward from the reconnection site, reaches lower speeds (![]() 30 km s-1).
There is a good correlation
between the high velocity flows and hot plasma emission from the
reconnection site. High temperature values of the order of 1 MK
are reached
along the jet. The plasma density of the jet, shortly after the
emission, is more than 10 times the density of the initial
background plasma
at the same height. Hot plasma is also found at the reconnection site
and at the top of the flux pile-up regime (with a loop-like shape)
underneath
the current layer. There, the plasma is also highly compressed and the
temperature could reach values of a few MK during the evolution.
The overall configuration resembles the ``L-like'' shape of the
observed jet in Fig. 1.
30 km s-1).
There is a good correlation
between the high velocity flows and hot plasma emission from the
reconnection site. High temperature values of the order of 1 MK
are reached
along the jet. The plasma density of the jet, shortly after the
emission, is more than 10 times the density of the initial
background plasma
at the same height. Hot plasma is also found at the reconnection site
and at the top of the flux pile-up regime (with a loop-like shape)
underneath
the current layer. There, the plasma is also highly compressed and the
temperature could reach values of a few MK during the evolution.
The overall configuration resembles the ``L-like'' shape of the
observed jet in Fig. 1.
The different magnetic domains in 3D are shown in Fig. 4. The emerging field lines (in blue) reconnect with the preexisting field (in yellow), producing a high-velocity, hot plasma emission. The isosurface (in red) represents temperature of 1 MK along the jet, which extends over the interface between the interacting magnetic fields. High-temperature loops are formed when the hot plasma is ejected downward, at the crests of the low-lying reconnected fieldlines (in white). At larger heights, a new magnetic domain is formed (in green). It consists of new and long, reconnected fieldlines that join the two far ends of the emerging and the active region's field. At this stage of the evolution, the orientation of the jet is slightly oblique. This phase of emission, during which the jet keeps the same plasma properties, lasts for about 7 min.
![\begin{figure}
\par\includegraphics[width=6.8cm,clip]{13026fig4a.eps}\par\vspace*{2mm}
\includegraphics[width=6.8cm,clip]{13026fig4b.eps}
\end{figure}](/articles/aa/full_html/2009/42/aa13026-09/img26.png)
|
Figure 4: 3D topology of fieldlines around the emission of the jet, at t=20 min ( top) and t=23 min ( bottom). Temperature is shown by the isosurface (in red). Arrows show the direction of the magnetic field lines. |
| Open with DEXTER | |
However, the shape and direction of the jet changes during the dynamical
interaction of the two magnetic systems. The curvature of the surrounding, ambient
fieldlines determines the direction of the jet. In the early stages of
the evolution, the reconnected fieldlines above the jet (in green in Fig. 3, top panel)
are oriented almost in a transverse direction to the jet. The tension of these fieldlines must be released
for the jet to rise vertically and reach higher levels of the atmosphere. On the contrary, the numerical results
show that the jet is trapped by the ambient field and it is compelled to move laterally, along the
direction of the upper reconnected fieldlines that join the two systems. Now, the jet adopts an arch-like shape
as it moves away (with speeds of around 100 km s-1) from the reconnection site and towards the
preexisting magnetic domain. The bottom panel in Fig. 4 shows the connectivity
of the magnetic lines around the reconnection site at t=23 min. High temperature (![]() 2 MK)
is shown by the red isosurface.
2 MK)
is shown by the red isosurface.
4 Discussion and conclusions
The computed plasma presents a jet of 15 Mm length and 1 Mm width, presenting upflow velocities ofIn our simulations, we did not include the effect of conduction. Thus, we cannot study whether evaporation flows, which might account for jets, form during the evolution of the system. The 3D geometric shape of the jets (see bottom panel in Fig. 4) reveals a bent structure. To show whether the jets adopt helical shapes undergoing untwisting while they are lifting off requires a detailed study of the fieldline topology during the temporal and spatial evolution of the jets. This important issue together with the recurrent appearance of the observed jets (a process that also occurs in our numerical experiments) will be addressed in a future study.
AcknowledgementsFinancial support by the European Commission through the SOLAIRE network (MTRM-CT-2006-035484) is gratefully acknowledged.
References
- Arnaud, M., & Rothenflug, R. 1985, A&AS, 60, 425 [NASA ADS]
- Arber, T. D., Longbottom, A. W., Gerrard, C. L., & Milne, A. M. 2001, JCoPh., 171, 151 [NASA ADS]
- Archontis, V., Moreno-Insertis, F., Galsgaard, K., & Hood, A. W. 2005, ApJ, 635, 1299 [NASA ADS] [CrossRef]
- Canfield, R. C., Reardon, K. P., Leka, K. D., et al. 1996, ApJ, 464, 1016 [NASA ADS] [CrossRef]
- Chae, J., Qiu, J., Wang, H., & Goode, P. R. 1999, ApJ, 513, 75 [NASA ADS] [CrossRef]
- Chifor, C., Young, P. R., Isobe, H., et al. 2008a, A&A, 481, 57 [NASA ADS] [CrossRef]
- Chifor, C., Isobe, H., Mason, H. E., et al. 2008b, A&A, 491, 279 [NASA ADS] [CrossRef] [EDP Sciences]
- Gontikakis, C., Dara, H. C., Zachariadis, Th. G., et al. 2006, Sol. Phys., 233, 57 [NASA ADS] [CrossRef]
- Hood, A. W., Archontis, V., Galsgaard, K., & Moreno-Insertis, F. 2009, A&A, 503, 999 [NASA ADS] [CrossRef] [EDP Sciences]
- Moreno Insertis, F., Galsgaard, K., & Uggarte-Urra, I. 2008, ApJ, 673, 211 [NASA ADS] [CrossRef]
- Pariat, E., Antiochos, S., & DeVore, C. R. 2009, ApJ, 691, 61 [NASA ADS] [CrossRef]
- Patsourakos, S., Pariat, E., Vourlidas, A., et al. 2008, ApJ, 680, 73 [NASA ADS] [CrossRef]
- Schmelz, J. T., Saba, J. L. R., Ghosh, D., & Strong, K. T. 1996, ApJ, 473, 519 [NASA ADS] [CrossRef]
- Shibata, K. 1996, ASP Conf. Ser., 111
- Shimojo, M., Hashimoto, S., Shibata, K., et al. 1996, PASJ, 48, 123 [NASA ADS]
- Shimojo, M., Shibata, K., Yokoyama, T., et al. 2001, ApJ, 550, 1051 [NASA ADS] [CrossRef]
- Teriaca, L., Banerjee, D., & Doyle, J. G. 1999, A&A, 349, 636 [NASA ADS]
- Tsinganos, K. 1980, ApJ, 239, 746 [NASA ADS] [CrossRef]
- Yokoyama, T., & Shibata, K. 1996, PASJ, 48, 353 [NASA ADS]
All Figures
|
|
Figure 1: Summary of the TRACE 171 Å (panels a- f), SUMER (panels g- j) and MDI (panels k, l) observations of the jet. SUMER panels show: the Ne VIII 770 Å, intensity g), dopplergram h), C IV 1548 Å, intensity i) and dopplergram j). Panels k) and l) show the MDI magnetogram at 14:24 UT and the difference between the 14:24 and 12:48 magnetograms. In panel h) Doppler shifts range from -100 km s-1 (blueshift, black) to 40 km s-1 (redshift, white) while in panel j), they range from -20 km s-1 (blueshift, black) to 33 km s-1 (redshift, white) and in panel k), magnetic fields range from -450 Gauss (black) to 50 Gauss (white). The jet in panels a) to d) has its maximum brightness. In panels e) and f) the jet is observed simultaneously with the SUMER observations of panels g) to j). The intensity isocontours of panel g), when overlaid on panel h) include upward motions along the jet (black on the dopplergram) and downward motions at the bright area. In panels k), l) the two arrows indicate the emerging magnetic flux. In panel d), the white isocontour shows the emerging flux while the grey isocontour shows a pre-existing, negative polarity. |
| Open with DEXTER | |
| In the text | |
|
|
Figure 2:
Distribution of
|
| Open with DEXTER | |
| In the text | |
|
|
Figure 3: Left: Distribution of the vertical velocity (colormap) and projection of the full magnetic field vector (arrows) onto the vertical (x=1 Mm) plane. Right: distribution of temperature (colormap) and vertical velocity (arrows) onto the same plane. Time is, t=20 min. |
| Open with DEXTER | |
| In the text | |
|
|
Figure 4: 3D topology of fieldlines around the emission of the jet, at t=20 min ( top) and t=23 min ( bottom). Temperature is shown by the isosurface (in red). Arrows show the direction of the magnetic field lines. |
| Open with DEXTER | |
| In the text | |
Copyright ESO 2009
Current usage metrics show cumulative count of Article Views (full-text article views including HTML views, PDF and ePub downloads, according to the available data) and Abstracts Views on Vision4Press platform.
Data correspond to usage on the plateform after 2015. The current usage metrics is available 48-96 hours after online publication and is updated daily on week days.
Initial download of the metrics may take a while.