| Issue |
A&A
Volume 505, Number 3, October III 2009
|
|
|---|---|---|
| Page(s) | 1265 - 1268 | |
| Section | The Sun | |
| DOI | https://doi.org/10.1051/0004-6361/200811499 | |
| Published online | 18 August 2009 | |
A method for the treatment of supergranulation advection
by giant cells
(Research Note)
P. E. Williams![]() -
M. Cuntz
-
M. Cuntz
Department of Physics, University of Texas at Arlington, Science Hall, Arlington, TX 76019, USA
Received 10 December 2008 / Accepted 10 August 2009
Abstract
Aims. We present a new method for the treatment of the advection of solar supergranulation by giant cells, a large-scale analogue to the observed property of granule advection by supergranules.
Methods. The proposed method is derived from a description of solar convection via spherical harmonics and spectral coefficients, allowing the investigation of the influence of a giant cell component on a realistic supergranule signal.
Results. We show that a supergranule pattern derived from real data, as well as a simplified test signal, can be advected by a giant cell component of various sizes.
Conclusions. The identified behaviour is in analogy to observed supergranulation patterns, including those based on MDI Dopplergrams, which show wavelike supergranulation patterns, even after the removal of the geometric projection effect. Our method is an important step towards the construction of future models involving supergranule flow patterns advected by a giant cell flow. Nevertheless, additional efforts are required to obtain a final verification of giant cells as a separate component of the solar photospheric convection spectrum.
Key words: convection - methods: numerical - Sun: helioseismology - Sun: photosphere - turbulence - waves
1 Introduction
The different components of solar convection are well seen at the
solar surface despite requiring their own methods of observation.
Intensity and Doppler observations of the surface reveal bright
cellular granule patterns that evolve over time. This granulation
(![]() 1 Mm across,
1 Mm across, ![]() 1 h lifetime) is considered to be
convective flow driven by the recombination of atomic hydrogen below
the photosphere. Supergranulation (
1 h lifetime) is considered to be
convective flow driven by the recombination of atomic hydrogen below
the photosphere. Supergranulation (![]() 30 Mm across,
30 Mm across, ![]() 24 h
lifetime), however, is not as readily observable as their smaller
counterparts and requires Doppler measurements of the solar surface
for it to be seen. The process of producing supergranules is not yet
understood as those previously proposed such as helium recombination
(Leighton et al. 1962) or accumulated downdrafts of granules (Rast 2003)
seem not to create an independent supergranule component when
scrutinized by numerical simulations (Stein & Nordlund 1998; Stein
2008, private communication), although granules with a spatial size
comparable to supergranules are found.
24 h
lifetime), however, is not as readily observable as their smaller
counterparts and requires Doppler measurements of the solar surface
for it to be seen. The process of producing supergranules is not yet
understood as those previously proposed such as helium recombination
(Leighton et al. 1962) or accumulated downdrafts of granules (Rast 2003)
seem not to create an independent supergranule component when
scrutinized by numerical simulations (Stein & Nordlund 1998; Stein
2008, private communication), although granules with a spatial size
comparable to supergranules are found.
Mesogranules were claimed to exist as an independent convection
component with size scales located between granules and
supergranules (November et al. 1981). However, from studying the distribution
of cell sizes using a photospheric convection spectrum derived from
MDI Doppler maps (Hathaway et al. 2000), no exclusive mesogranule component
seems to exist. Signals that are found at sizes typical of
mesogranules (![]() 7 Mm) are more appropriately ascribed to large
granules or small supergranules.
7 Mm) are more appropriately ascribed to large
granules or small supergranules.
The largest component of convection, giant cells, still remain an
enigma. Their existence was proposed by Simon & Weiss (1968) after models
predicted the production of cells ![]() 300 Mm across with lifetimes
of
300 Mm across with lifetimes
of ![]() 34 days. Physical evidence for these features, however,
has been sparse and circumstantial at best. Observational techniques
have been proposed and executed, but with no definitive results
(Strous & Simon 1998; Kitai et al. 1999). Other implicit signals may, however, betray the existence of giant
cells (Ulrich 2001; Beck et al. 1998). Despite this lack of solid observational evidence of giant cells,
extensive modelling has been performed (Miesch et al. 2007).
34 days. Physical evidence for these features, however,
has been sparse and circumstantial at best. Observational techniques
have been proposed and executed, but with no definitive results
(Strous & Simon 1998; Kitai et al. 1999). Other implicit signals may, however, betray the existence of giant
cells (Ulrich 2001; Beck et al. 1998). Despite this lack of solid observational evidence of giant cells,
extensive modelling has been performed (Miesch et al. 2007).
Previous observations of supergranules have revealed a large array
of properties, including (1) their size, shape and their coincidence
with the chromospheric network (Küveler 1983; Simon & Leighton 1964); (2) their flow
speeds (Hathaway et al. 2002; Küveler 1983); and (3) their advection of granules
(Rieutord et al. 2008). Their Doppler signal also exhibits a superrotation
characteristic with respect to the underlying plasma Duvall (1980).
Hathaway et al. (2006) were able to attribute the majority of the signal to a
geometric projection effect, but a remaining signal, including a
retrograde component (Gizon et al. 2003), was still unaccounted for.
Besides these extra longitudinal velocity signals, Schou (2003)
detects northbound and southbound wave propagation at 40![]() latitude that may correspond to poleward and equatorward flow
signals, providing further tentative evidence of giant cells.
latitude that may correspond to poleward and equatorward flow
signals, providing further tentative evidence of giant cells.
Future efforts to verify the existence of giant cells will require detailed simulations of the advection of supergranules by giant cell flows. This is the underlying motivation for the development of our method described in Sect. 2. In Sect. 3 we provide a summary of the work and a brief outlook.
2 Methods and results
2.1 Background
Both previous and envisioned data simulations are aimed at obtaining insight into the scales and dynamics of solar photospheric convection. These types of simulations are not hydrodynamic nor MHD numerical simulations but rather simulations of the Doppler data itself in the form of vector velocities over the full solar surface that are projected onto the line-of-sight to reproduce the Doppler data characteristics (e.g., Hathaway et al. 2000, 2002).
In general, any vector velocity field on a spherical surface can be represented in terms of a radial component, a solenoidal (or poloidal) component (curl-free horizontal flow), and a toroidal component (divergence-free horizontal flow) with
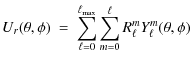
![$\displaystyle U_\theta(\theta,\phi) \ = \ \sum_{\ell=0}^{\ell_{\rm max}}
\sum_{...
...theta}+
T_\ell^m\frac{1}{\sin\theta}
\frac{{\partial}Y_l^m}{\partial\phi}
\Big]$](/articles/aa/full_html/2009/39/aa11499-08/img4.png)
![$\displaystyle U_\phi(\theta,\phi) \ = \ \sum_{\ell=0}^{\ell_{\rm max}}
\sum_{m=...
...tial}Y_l^m}{\partial\phi}-
T_\ell^m\frac{{\partial}Y_l^m}{\partial\theta}
\Big]$](/articles/aa/full_html/2009/39/aa11499-08/img5.png)
where the complex coefficients
![]() ,
,
![]() ,
and
,
and
![]() give the radial, solenoidal, and toroidal parts
(Chandrasekhar 1961), the
give the radial, solenoidal, and toroidal parts
(Chandrasekhar 1961), the
![]() are the spherical-harmonic
functions, and
are the spherical-harmonic
functions, and
![]() and
and
![]() are related through
the mass continuity equation. Each of these four quantities are
described over a range of spherical-harmonic degrees
are related through
the mass continuity equation. Each of these four quantities are
described over a range of spherical-harmonic degrees ![]() and
azimuthal orders m. The angular quantities
and
azimuthal orders m. The angular quantities ![]() and
and ![]() measure the colatitude southward from the north pole and the azimuth
prograde from the central meridian, respectively. Given input values
for these complex spectral coefficients, vector velocities can be
computed and projected onto the line-of-sight to produce Doppler
velocity images (Hathaway 1988b).
measure the colatitude southward from the north pole and the azimuth
prograde from the central meridian, respectively. Given input values
for these complex spectral coefficients, vector velocities can be
computed and projected onto the line-of-sight to produce Doppler
velocity images (Hathaway 1988b).
The values for the spectral coefficients are obtained by modelling convection spectra
obtained from full-disk solar observations made by the MDI instrument (Scherrer et al. 1995) aboard
the SOHO spacecraft. The spectra show power (kinetic energy) per wavenumber
for a large range of spherical harmonic degrees ![]() (Hathaway et al. 2000). Models
are constructed from a two-component spectrum representing
supergranules (with
(Hathaway et al. 2000). Models
are constructed from a two-component spectrum representing
supergranules (with
![]() )
and granules (with
)
and granules (with
![]() )
using two broad Lorentzian profiles for the spectral amplitudes along with random
phases to match the observations. This method has been used to create spectral
coefficients used as input in recent studies (e.g., Hathaway et al. 2006; Williams et al. 2007) and
continues to be used in the further development of the previously described data simulations (Hathaway et al. 2008).
)
using two broad Lorentzian profiles for the spectral amplitudes along with random
phases to match the observations. This method has been used to create spectral
coefficients used as input in recent studies (e.g., Hathaway et al. 2006; Williams et al. 2007) and
continues to be used in the further development of the previously described data simulations (Hathaway et al. 2008).
![\begin{figure}
\par\includegraphics[width=11cm,clip]{11499fg1.eps}
\end{figure}](/articles/aa/full_html/2009/39/aa11499-08/img15.png) |
Figure 1: Time plot series depicting the advection of a sinusoidal pattern by a giant cell component based on a numerical simulation. The plots show a domain of 20 degrees in longitude to either side of the central meridian. Adjacent giant cells exhibit converging flows which bunches up the supergranule pattern, while the centers of the giant cells spread the pattern out. These convergent and divergent flows are prograde or retrograde with respect to any underlying rotational flow that is left out of this simulation for simplicity. |
| Open with DEXTER | |
![\begin{figure}
\par\includegraphics[width=11cm,clip]{11499fg2.eps}
\end{figure}](/articles/aa/full_html/2009/39/aa11499-08/img16.png) |
Figure 2: A similar time plot as shown and described in Fig. 1, but this time showing the advection of a supergranule pattern derived from spectral coefficients extracted from a MDI Doppler image. The amplitudes are velocities which are representative of the flow signals and measured in m/s. |
| Open with DEXTER | |
2.2 Advection of supergranulation by a giant cell component
Next we describe how to consider the advection of supergranulation by a giant cell component. To study how flows of different length scales may interact, we formulate the following time-dependent approach. To begin with, a simplified synthetic flow pattern comprising of a single sinusoidal component at a wavenumber m = 100 is constructed in a one-dimensional domain. Our aim is to advect this flow pattern signal with an underlying component constructed at a wavenumber m= 20.
The advection is carried out by evolving the amplitude and phase
information of the small-scale pattern. To synthesize this
advection, we apply a one-dimensional version of the momentum
equation given by
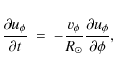
where
Using a sinusoidal distribution for the one-dimensional poloidal
flows along the equator only, ![]() is given as
is given as
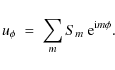
The complex spectral amplitudes Sm are initially set to unity at m=100 only, while for all other wavenumbers (within the range of m=0 to m=1024), the amplitudes are zero. The non-zero spectral amplitude is accompanied by a random phase. The latter is applied using the exponential term. The large-scale flow pattern is constructed using
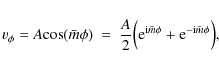
where
Substituting Eqs. (5) and (6) into
Eq. (4), and normalizing and expressing the changes in Smand t as discrete quantities results in a change in amplitude
![]() at a given wavenumber m over a given timestep
at a given wavenumber m over a given timestep ![]() .
This can be expressed as
.
This can be expressed as
![\begin{displaymath}
\Delta S_{m} \ = \
-\frac{iA}{2}\Big[(m-\bar{m}) S_{m-\bar{m}} + (m+\bar{m}) S_{m+\bar{m}}\Big]
\Delta t .
\end{displaymath}](/articles/aa/full_html/2009/39/aa11499-08/img26.png)
By progressing the amplitudes from Smt to Smt+1(i.e., by
The timestep and the advection velocity, although arbitrary, were chosen such that the flow pattern changes slowly to yield a smooth evolution with a reasonable temporal resolution. Additionally, the number of timesteps were chosen so that the supergranule pattern would be evolved long enough to observe stretching in some regions and bunching up in others. The longitudinal domain from
Figure 1 shows a series of images sampled at regular time-steps
displaying the distribution of the velocity pattern across the
domain. It can be seen that as time progresses the pattern evolves.
In some regions the pattern is compressed corresponding to the
convergent velocities at the boundaries of advecting flow, while in
other regions the pattern is stretched out, corresponding to
divergent velocities at the centre of the advecting flow. The
spacing of the boundaries is coincidental with the wavenumber of the
advecting flow in that there exists a boundary every 18![]() along the domain. It can be seen that the boundary width continues
to reduce as there is no restricting force on the convergent
velocities. Its numerical size is of no physical consequence.
along the domain. It can be seen that the boundary width continues
to reduce as there is no restricting force on the convergent
velocities. Its numerical size is of no physical consequence.
This method has also been applied to a convection pattern derived
directly from data supplied by MDI (Scherrer et al. 1995). Temporal averages
of de-rotated Doppler images that remove p-mode signals from the
original data (Hathaway 1988a) are followed by the subtraction of the
axisymmetric flows (Hathaway 1992), which yield images that contain
signals solely due to convective flows. The images are spectrally
filtered in the spatial domain to extract flow-cells that lie within
a given wavenumber range (Hathaway et al. 2002). In the present case, the
images were filtered with a Gaussian-shaped window function having a
FWHM of 128 wavenumbers and centered on
![]() (Hathaway et al. 2002),
a wavenumber near the supergranule peak seen in the convection
spectrum (Hathaway et al. 2000). A one-dimensional longitudinal strip (1000 pixels across by 1 pixel in latitude) is extracted near the equator
of such a filtered image (May 25, 1996 00:00 UT). The strip
containing the Doppler pattern is Fourier transformed in space and
the complex spectral amplitudes, Sm, extracted, each being
accompanied by a synthetically produced random phase. The spectral
amplitudes are then evolved using the previously described method to
simulate the advection of the supergranule pattern by the giant cell
component.
(Hathaway et al. 2002),
a wavenumber near the supergranule peak seen in the convection
spectrum (Hathaway et al. 2000). A one-dimensional longitudinal strip (1000 pixels across by 1 pixel in latitude) is extracted near the equator
of such a filtered image (May 25, 1996 00:00 UT). The strip
containing the Doppler pattern is Fourier transformed in space and
the complex spectral amplitudes, Sm, extracted, each being
accompanied by a synthetically produced random phase. The spectral
amplitudes are then evolved using the previously described method to
simulate the advection of the supergranule pattern by the giant cell
component.
Figure 2 shows a series of images similar to that shown in Fig. 1,
but using data from a real Doppler image. Although the amplitudes
are modulated by the spectral filter, the velocities are still
representative of supergranular flows. The top image shows the
initial supergranule Doppler pattern, while the subsequent images
show the pattern undergoing advection. As in Fig. 1, the giant
cell component, with
![]() ,
produces boundaries of
convergent/divergent flows every 18
,
produces boundaries of
convergent/divergent flows every 18![]() along the domain.
along the domain.
The simulation was repeated to model giant cell components situated
at other wavenumbers. Figure 3 shows the resulting wavenumber
patterns after advection by giant cells of
![]() ,
20 and 40,
with respectively corresponding boundaries at every 36
,
20 and 40,
with respectively corresponding boundaries at every 36![]() ,
18
,
18![]() and 9
and 9![]() along the domain. Note the correlation
between the number of giant cells contained within the domain to the
rate of supergranule advection.
along the domain. Note the correlation
between the number of giant cells contained within the domain to the
rate of supergranule advection.
![\begin{figure}
\par\includegraphics[width=11cm,clip]{11499fg3.eps}
\end{figure}](/articles/aa/full_html/2009/39/aa11499-08/img32.png) |
Figure 3: The top image shows an initial supergranule pattern. Those that follow show the resultant patterns of advection by different sized giant cell components after a particular number of timesteps. |
| Open with DEXTER | |
3 Conclusions and outlook
The main focus of this work is to present a new method for the
treatment of the advection of solar supergranulation by giant cells,
which is a large-scale analogue to the observation of granule
advection by supergranules (Rieutord et al. 2008). Our underlying goal is to
provide the methodology for computing more detailed models that
allow the exploration of the effects of a giant cell component on
simulated supergranulation patterns in conjunction with empirical
data. As a test case, we illustrate the advection of a velocity
signal described by a sinusoidal component of a given wavenumber by
a large scale flow described by another sinusoidal component with a
significantly smaller wavenumber. The wavenumbers of the flows
(m=100,
![]() )
were chosen to be representative of
supergranules and giant cells, respectively.
)
were chosen to be representative of
supergranules and giant cells, respectively.
We extend our studies to simulate the advection of a real supergranule signal, derived from MDI Dopplergrams, by giant cells. The results show that in some regions of the domain the supergranule signal becomes bunched, whereas in other regions they spread apart. This relates to divergent and convergent flows at the centres and boundaries of giant cells, respectively. Such convergent and divergent flows of giant cells have been derived by studies of the proper motions of Ca II mottles (Schwan & Wöhl 1978). Note that such signals could be visible at the solar surface either by spectral analysis or correlation tracking. We have also performed these simulations using giant cells of different sizes and find that the advection occurs faster for a domain consisting of smaller giant cells that for larger ones.
Previous spectral analysis of MDI Dopplergrams by Gizon et al. (2003) and
Schou (2003) provide observational evidence of prograde and
retrograde motions of the supergranule signal along the equator.
Additionally, Schou (2003) presents observations that indicate the
signal also showing poleward and equatorward motions. He suggests
that this is evidence of the wavelike nature of supergranulation.
Earlier suggestions of wavelike evidence derived from results by
Duvall (1980), Snodgrass & Ulrich (1990), and Beck & Schou (2000) seem to have been
explained by Hathaway et al. (2006) who were able to attribute the majority of
the equatorial signal to a geometric projection effect. However, a
remaining signal, including a retrograde component (Gizon et al. 2003),
was still unaccounted for. Thus, it may be possible to attribute
this remaining signal to the advection of supergranules by giant
cells, which will require more detailed studies in the future. Such
studies may include simulating the giant cell influence within a
two-dimensional domain that would require analysing the coupling
between the latitudinal and longitudinal (![]() and m,
respectively) in a similar vein to how the advection due to
differential rotation has recently been performed Hathaway et al. (2008).
Further refinements have to be made to evolve the supergranule
pattern over time so that the simulation may essentially run
indefinitely.
and m,
respectively) in a similar vein to how the advection due to
differential rotation has recently been performed Hathaway et al. (2008).
Further refinements have to be made to evolve the supergranule
pattern over time so that the simulation may essentially run
indefinitely.
Acknowledgements
This work was supported by NASA's Office of Space Science through a grant from its Solar and Heliospheric Supporting Research and Technology Program. We also acknowledge valuable discussions with D. H. Hathaway and welcome the comments of an anonymous referee. SOHO is a project of international cooperation between ESA and NASA.
References
- Beck, J. G., & Schou, J. 2000, Sol. Phys., 193, 333 [NASA ADS] [CrossRef] (In the text)
- Beck, J. G., Duvall, Jr., T. L., & Scherrer, P. H. 1998, Nature, 394, 653 [NASA ADS] [CrossRef]
- Chandrasekhar, S. 1961, Hydrodynamic and Hydromagnetic Stability (London: Oxford University Press) (In the text)
- Duvall Jr., T. L. 1980, Sol. Phys., 66, 213 [NASA ADS] [CrossRef] (In the text)
- Gizon, L., Duvall Jr., T. L., & Schou, J. 2003, Nature, 421, 43 [NASA ADS] [CrossRef] (In the text)
- Hathaway, D. H. 1988a, Sol. Phys., 117, 1 [NASA ADS] [CrossRef] (In the text)
- Hathaway, D. H. 1988b, Sol. Phys., 117, 329 [NASA ADS] [CrossRef] (In the text)
- Hathaway, D. H. 1992, Sol. Phys., 137, 15 [NASA ADS] [CrossRef] (In the text)
- Hathaway, D. H., Beck, J. G., Bogart, R. S., et al. 2000, Sol. Phys., 193, 299 [NASA ADS] [CrossRef] (In the text)
- Hathaway, D. H., Beck, J. G., Han, S., & Raymond, J. 2002, Sol. Phys., 205, 25 [NASA ADS] [CrossRef]
- Hathaway, D. H., Williams, P. E., & Cuntz, M. 2006, ApJ, 644, 598 [NASA ADS] [CrossRef] (In the text)
- Hathaway, D. H., Williams, P. E., & Cuntz, M. 2008, in Solar-Stellar Dynamos as Revealed by Helio- and Asteroseismology, ed. M. Dikpati, I. Gonzalez-Hernandez, T. Arentoft, & F. Hill (San Francisco: ASP), ASP Conf. Proc., in press (In the text)
- Kitai, R., Kurokawa, H., Funakoshi, Y., et al. 1999, Adv. Space Res., 24, 237 [NASA ADS] [CrossRef]
- Küveler, G. 1983, Sol. Phys., 88, 13 [NASA ADS]
- Leighton, R. B., Noyes, R. W., & Simon, G. W. 1962, ApJ, 135, 474 [NASA ADS] [CrossRef] (In the text)
- Miesch, M. S., Brun, A. S., DeRosa, M. L., & Toomre, J. 2007, ApJ, 673, 557 [NASA ADS] [CrossRef] (In the text)
- November, L. J., Toomre, J., Gebbie, K. B., & Simon, G. W. 1981, ApJ, 245, L123 [NASA ADS] [CrossRef] (In the text)
- Rast, M. P. 2003, in Local and Global Helioseismology: The Present and Future, ed. H. Sawaya-Lacoste, Noorwijk: ESA, ESA SP-517, 163 (In the text)
- Rieutord, M., Meunier, M., Roudier, T., et al. 2008, A&A, 479, 17 [NASA ADS] [CrossRef] (In the text)
- Scherrer, P. H., Bogart, R. S., Bush, R. I., et al. 1995, Sol. Phys., 162, 129 [NASA ADS] [CrossRef] (In the text)
- Schou, J. 2003, ApJ, 596, L262 [NASA ADS] [CrossRef] (In the text)
- Schwan, H., & Wöhl, H. 1978, A&A, 70, 297 [NASA ADS] (In the text)
- Simon, G. W., & Leighton, R. B. 1964, ApJ, 140, 1120 [NASA ADS] [CrossRef]
- Simon, G. W., & Weiss, N. O. 1968, ZAp, 69, 435 [NASA ADS] (In the text)
- Snodgrass, H. B., & Ulrich, R. K. 1990, ApJ, 351, 309 [NASA ADS] [CrossRef] (In the text)
- Stein, R. F., & Nordlund, Å. 1998, ApJ, 499, 914 [NASA ADS] [CrossRef]
- Strous, L. H., & Simon, G. W. 1998, in Synoptic Solar Physics, ed. K. S. Balasubramaniam, J. Harvey, & D. Rabin (San Francisco: ASP), 140, 161
- Ulrich, R. K. 2001, ApJ, 560, 466 [NASA ADS] [CrossRef]
- Williams, P. E., Hathaway, D. H., & Cuntz, M. 2007, ApJ, 662, L135 [NASA ADS] [CrossRef]
Footnotes
- ... Williams
![[*]](/icons/foot_motif.png)
- New address: NASA Goddard Space Flight Center, Greenbelt, MD 20771, USA.
All Figures
| |
Figure 1: Time plot series depicting the advection of a sinusoidal pattern by a giant cell component based on a numerical simulation. The plots show a domain of 20 degrees in longitude to either side of the central meridian. Adjacent giant cells exhibit converging flows which bunches up the supergranule pattern, while the centers of the giant cells spread the pattern out. These convergent and divergent flows are prograde or retrograde with respect to any underlying rotational flow that is left out of this simulation for simplicity. |
| Open with DEXTER | |
| In the text | |
| |
Figure 2: A similar time plot as shown and described in Fig. 1, but this time showing the advection of a supergranule pattern derived from spectral coefficients extracted from a MDI Doppler image. The amplitudes are velocities which are representative of the flow signals and measured in m/s. |
| Open with DEXTER | |
| In the text | |
| |
Figure 3: The top image shows an initial supergranule pattern. Those that follow show the resultant patterns of advection by different sized giant cell components after a particular number of timesteps. |
| Open with DEXTER | |
| In the text | |
Copyright ESO 2009
Current usage metrics show cumulative count of Article Views (full-text article views including HTML views, PDF and ePub downloads, according to the available data) and Abstracts Views on Vision4Press platform.
Data correspond to usage on the plateform after 2015. The current usage metrics is available 48-96 hours after online publication and is updated daily on week days.
Initial download of the metrics may take a while.