| Issue |
A&A
Volume 505, Number 2, October II 2009
|
|
|---|---|---|
| Page(s) | 569 - 575 | |
| Section | Extragalactic astronomy | |
| DOI | https://doi.org/10.1051/0004-6361/200912662 | |
| Published online | 03 August 2009 | |
Time resolved spectral behavior of bright BATSE precursors![[*]](/icons/foot_motif.png)
D. Burlon1 - G. Ghirlanda2 - G. Ghisellini2 - J. Greiner1 - A. Celotti 3
1 - Max-Planck-Institut für Extraterrestrische Physik,
Giessenbachstraße 1, 85740 Garching, Germany
2 - Osservatorio Astronomico di Brera,
via E. Bianchi 46, 23807 Merate, Italy
3 - SISSA, via Beirut 2-4,
34151 Trieste, Italy
Received 9 June 2009 / Accepted 24 July 2009
Abstract
Aims. Gamma ray bursts (GRBs) are sometimes preceded by dimmer emission episodes, called ``precursors'', whose nature is still a puzzle: they could either have the same origin as the main emission episode or they could be due to another mechanism. We investigate if precursors have some spectral distinctive feature with respect to the main GRB episodes.
Methods. To this aim we compare the spectral evolution of the precursor with that of the main GRB event. We also study if and how the spectral parameters, and in particular the peak of the
![]() spectrum of time resolved spectra, correlates with the flux. This allows us to test if the spectra of the precursor and of the main event belong to the same correlation (if any). We searched GRBs with precursor activity in the complete sample of 2704 bursts detected by BATSE finding that 12% of GRBs have one or more precursors. Among these we considered the bursts with time resolved spectral analysis performed by Kaneko et al. (2006, ApJS, 166, 298), selecting those having at least two time resolved spectra for the precursor.
spectrum of time resolved spectra, correlates with the flux. This allows us to test if the spectra of the precursor and of the main event belong to the same correlation (if any). We searched GRBs with precursor activity in the complete sample of 2704 bursts detected by BATSE finding that 12% of GRBs have one or more precursors. Among these we considered the bursts with time resolved spectral analysis performed by Kaneko et al. (2006, ApJS, 166, 298), selecting those having at least two time resolved spectra for the precursor.
Results. We find that precursors and main events have very similar spectral properties. The spectral evolution within precursors has similar trends as the spectral evolution observed in the subsequent peaks. Also the typical spectral parameters of the precursors are similar to those of the main GRB events. Moreover, in several cases we find that within the precursors the peak energy of the spectrum is correlated with the flux similarly to what happens in the main GRB event. This strongly favors models in which the precursor is due to the same fireball physics of the main emission episodes.
Key words: gamma rays: bursts - radiation mechanisms: non-thermal - gamma rays: observations
1 Introduction
How does a gamma ray burst (GRB) behave before the onset of the main emission is a debated issue. The so-called ``precursor'' activity has been observationally addressed by e.g. Koshut et al. (1995) [hereafter K95], Lazzati (2005) [L05] and Burlon et al. (2008) [B08].
K95 searched in the Burst Alert and Transient Source Experiment
(BATSE) sample for precursors defined as pulses with a peak
intensity lower than that of the main GRB and separated from it by
a quiescent phase at least as long as the duration of the main
event. They found precursors in ![]() 3% out of a sample of GRBs
detected by BATSE up to 1994 May. Their duration appeared weakly
correlated with those of the main GRBs and on average shorter than
that of the burst. The spectral properties of these precursors
showed no systematic difference with respect to those of the main
GRB event, being both softer and harder. However, the comparison
of the spectral properties of the precursors and of the main event
were based on the hardness ratio (HR) which is only a proxy of the
real shape of burst spectra.
3% out of a sample of GRBs
detected by BATSE up to 1994 May. Their duration appeared weakly
correlated with those of the main GRBs and on average shorter than
that of the burst. The spectral properties of these precursors
showed no systematic difference with respect to those of the main
GRB event, being both softer and harder. However, the comparison
of the spectral properties of the precursors and of the main event
were based on the hardness ratio (HR) which is only a proxy of the
real shape of burst spectra.
L05 searched for precursors as weak events preceding the
BATSE trigger. He found, within a sample of 133 bright GRBs, that
![]() 20% showed precursor activity. These precursors were on
average extremely dimmer than the main GRB event, and their
durations are weakly correlated with that of the main event. In
contrast with the results of K95, the precursors studied by L05
were softer than the main event. Also in this analysis, however,
the spectral characterization of the precursors were based on the
fluence HR. However, given the typically extreme low fluence of
most of the precursors found by L05, a better spectral
characterization (e.g. through model fits of a high resolution
BATSEspectrum) was almost impossible. A difference is how the
precursor-to-burst separation is measured: K95 consider the time
difference between the peak of the precursor and that of the main
event, while L05 measure the precursor-to-main event separation
from the end of the precursor to the start of the GRB.
20% showed precursor activity. These precursors were on
average extremely dimmer than the main GRB event, and their
durations are weakly correlated with that of the main event. In
contrast with the results of K95, the precursors studied by L05
were softer than the main event. Also in this analysis, however,
the spectral characterization of the precursors were based on the
fluence HR. However, given the typically extreme low fluence of
most of the precursors found by L05, a better spectral
characterization (e.g. through model fits of a high resolution
BATSEspectrum) was almost impossible. A difference is how the
precursor-to-burst separation is measured: K95 consider the time
difference between the peak of the precursor and that of the main
event, while L05 measure the precursor-to-main event separation
from the end of the precursor to the start of the GRB.
B08 searched for precursors in the sample of 105 Swift GRBs with
measured redshifts. In ![]() 15% of the sample a precursor was
found. The definition of precursors adopted in B08 is similar to
that used by K95. The main difference, however, is that B08 did
not require that the precursor precedes the main event by an
amount of time comparable to the duration of the main event.
The novelty of B08 was to search and study precursors found in a
sample of bursts with known redshifts. This allowed, for the first
time, to characterize the precursor energetics and to study how
they compare with the main event energetics, also as a function of
the rest-frame time separation between the precursors and the main
events. The results of B08 suggest that precursors' spectra are
consistent with those of the main event. Moreover,
regardless of the rest-frame duration of the quiescence (i.e. the
time interval separating the precursor and the burst), precursors
carry a significant fraction of the total energy (
15% of the sample a precursor was
found. The definition of precursors adopted in B08 is similar to
that used by K95. The main difference, however, is that B08 did
not require that the precursor precedes the main event by an
amount of time comparable to the duration of the main event.
The novelty of B08 was to search and study precursors found in a
sample of bursts with known redshifts. This allowed, for the first
time, to characterize the precursor energetics and to study how
they compare with the main event energetics, also as a function of
the rest-frame time separation between the precursors and the main
events. The results of B08 suggest that precursors' spectra are
consistent with those of the main event. Moreover,
regardless of the rest-frame duration of the quiescence (i.e. the
time interval separating the precursor and the burst), precursors
carry a significant fraction of the total energy (![]() 30%)
of the main event (see Fig. 1 therein). The conclusions
of B08 point to a common origin for both precursor and main event.
Namely, they are nothing but two episodes of the same emission
process.
30%)
of the main event (see Fig. 1 therein). The conclusions
of B08 point to a common origin for both precursor and main event.
Namely, they are nothing but two episodes of the same emission
process.
Theoretical models for precursors can be separated into three classes: the ``fireball precursor'' models (Mészáros & Rees 2000; Daigne & Mochkovitch 2002; Li 2007; Lyutikov & Blandford 2003; Ruffini et al. 2001); the ``progenitor precursor'' models (Ramirez-Ruiz et al. 2002; Lazzati & Begelman 2005) and the ``two step engine'' model (Wang & Mészáros 2007 [W07]; Lipunova et al. 2009 [L09]). In the first class the precursor is associated to the initially trapped fireball radiation being released when transparency is reached. In the second class, based on the collapsar scenario, the precursor is identified with the interaction of a weakly relativistic jet with the stellar envelope. A strong terminal shock breaking out of the envelope is expected to produce transient emission. In both classes of models the precursors emission is predicted to be thermal, characterized by a black-body spectrum. As for the third class in W07 the progenitor collapse leads to the formation of a neutron star whose emission would be responsible for the precursor, while the star shrinks; subsequent accretion onto the neutron star causes its collapse onto a black hole, originating the GRB prompt. Conversely, in L09 the precursor is produced when a collapsing ``spinar'' halts at the centrifugal barrier, whereas the main emission is due to a spin-down mechanism. Thus, in L09 accretion is not invoked in either steps.
One of the main limitations of K95 and L05 analyses is the poor
spectral characterization of precursors. They used the HR,
i.e. the ratio of the counts (or fluences reported in the BATSE catalog) measured over broad energy channels. However, it is well
established that the broad band spectra of GRBs can be fitted by
empirical models (e.g. Band et al. 1993) composed by low and high
spectral power-laws with different slopes. The HR is only a proxy
of the real spectral properties of GRB spectra
(e.g. Ghirlanda et al. 2009), in particular for GRBs with vastly
different
![]() .
The other main limitation of these studies, based
on the BATSE GRB catalog, is the lack of redshifts. Indeed, this
motivated the study of B08 of Swift GRBs with precursors of known
redshifts. Nonetheless, the spectral analysis of B08 of Swift-BAT
spectra was limited by the narrow spectral range (15-150 keV):
most Swift spectra of precursors could be fitted by a single
power-law (i.e. the peak energy of the
.
The other main limitation of these studies, based
on the BATSE GRB catalog, is the lack of redshifts. Indeed, this
motivated the study of B08 of Swift GRBs with precursors of known
redshifts. Nonetheless, the spectral analysis of B08 of Swift-BAT
spectra was limited by the narrow spectral range (15-150 keV):
most Swift spectra of precursors could be fitted by a single
power-law (i.e. the peak energy of the
![]() spectrum is
unknown) and in all cases no time resolved spectral analysis of
the precursor could be performed.
spectrum is
unknown) and in all cases no time resolved spectral analysis of
the precursor could be performed.
The latter point is particularly important: the information
carried by the strong spectral evolution of GRB spectra
(e.g. Ghirlanda et al. 2002; Ryde et al. 2005; Kaneko et al. 2006
[K06]) is completely averaged out when time integrated spectra are
considered (integrated over the duration of the burst or over the
duration of single emission episodes, like the precursor and the
main event in B08).
An interesting feature found by time resolved analysis of GRB
spectra is that there could be a positive trend between the
spectral peak energy
![]() and the flux P within single emission
episodes of GRBs (Liang et al. 2004) [L04]. Interestingly, this trend
appears similar (Firmani et al. 2009) [F09] to that found between the
rest-frame GRB peak energies and their isotropic equivalent
luminosities, when considering different GRBs with measured z(i.e. so-called ``Yonetoku'' correlation; Yonetoku et al. 2004).
and the flux P within single emission
episodes of GRBs (Liang et al. 2004) [L04]. Interestingly, this trend
appears similar (Firmani et al. 2009) [F09] to that found between the
rest-frame GRB peak energies and their isotropic equivalent
luminosities, when considering different GRBs with measured z(i.e. so-called ``Yonetoku'' correlation; Yonetoku et al. 2004).
For these reasons we consider, in this paper, a still unanswered
question: how does the spectrum of the precursor evolve and how
does it compare with the evolution of the associated main event?
In order to answer this question we compare the time evolution of
the spectral parameters of precursors and main events. We also
want to test if a possible correlation between the peak energy and
the flux, i.e.
![]() -P within the precursors exists. If this
correlation is due to the physics of the emission process or to
that of the central engine is still to be understood, but if the
precursors and the main event do follow a similar correlation,
this would be another piece of the puzzle (in addition to the
results of B08) suggesting that precursors are nothing else than
the first emission episodes of the GRB. To this aims spectral data
with high time and spectral resolution are necessary. BATSE provides the best data for this purpose.
-P within the precursors exists. If this
correlation is due to the physics of the emission process or to
that of the central engine is still to be understood, but if the
precursors and the main event do follow a similar correlation,
this would be another piece of the puzzle (in addition to the
results of B08) suggesting that precursors are nothing else than
the first emission episodes of the GRB. To this aims spectral data
with high time and spectral resolution are necessary. BATSE provides the best data for this purpose.
The paper is organized as follows: in Sect. 2, we describe the sample selection and global properties; in Sect. 3, we present the spectral comparison between the precursor and the main event within single GRBs and we draw our conclusions in Sect. 4.
2 The sample
The Compton Gamma Ray Observatory satellite (CGRO) had on board the BATSE (Fishman et al. 1989), which provided the largest sample of GRBs, detected during the 9 yr lifetime. By applying different precursor definitions, K95 and L05 searched for BATSE bursts showing a precursor activity. A common feature of these studies is that a precursor is a peak separated (i.e. preceding) by a time interval and with a lower count rate with respect to the main GRB event.
The definition of a precursor is somewhat subjective and can easily bias the sample. L05, by excluding precursors that triggered BATSE selected the faintest precursors. K95 instead is missing precursors which can be closer than the duration of the rest of the burst. For these reasons, consistently with the definition adopted in B08, we adopted a definition of ``precursor'' as any peak with a peak flux smaller than the main prompt that follows it and that is separated from the main event by a quiescent period (namely, a time interval during which the background subtracted light curve is consistent with zero). We did not assume a priori that precursors can occur only in long GRBs (i.e. duration of the main emission episode be >2 s in the observer's frame), albeit in B08 we found no short burst with a precursor. We adopted this ``loose'' definition in order to check, a posteriori, if distinguishing characteristics emerge in the analysis. This definition is subject to find more easily precursors events of the type of K95 in the BATSE sample. Since K95 limited the search to half of the BATSE sample (considering events between 910405 and 940529) and due to the slightly different precursor definition, we searched for precursors in the complete BATSE sample.
The final BATSE GRB
sample![]() contains 2704 GRBs. We found 2121 GRBs out of 2704 total triggers
for which there was a 64 ms binned light
curve
contains 2704 GRBs. We found 2121 GRBs out of 2704 total triggers
for which there was a 64 ms binned light
curve![]() available. We inspected the background subtracted light curve of
each GRB and found 264 GRBs (12.5%) with a precursor. The
majority (191) of GRBs showed one precursor, 48 showed double
precursors, 19 showed three precursors, 5 showed four precursors
and in only one case we found five precursors, according to our
definition.
available. We inspected the background subtracted light curve of
each GRB and found 264 GRBs (12.5%) with a precursor. The
majority (191) of GRBs showed one precursor, 48 showed double
precursors, 19 showed three precursors, 5 showed four precursors
and in only one case we found five precursors, according to our
definition.
2.1 Sample properties
From the 64 ms BATSE light curves we calculated the duration of the precursor and main emission event for each of the 264 GRBs with precursors. The duration was defined as in the BATSE GRB catalog, i.e. T90. This corresponds to an integral measure, being the time interval containing the 90% (from 5% to 95%) of the counts inside each peak considered, either precursor or main event.
We define the time delay between the precursor and the main event as
the difference between the beginning of the main event and the end
time of the precursor. The mean durations of
precursors and main emission episodes are ![]() 15 s and
15 s and
![]() 24 s, respectively. The mean duration of the delays is
24 s, respectively. The mean duration of the delays is ![]() 50 s.
50 s.
In Fig. 1, we show the delays of the precursors versus
the duration T90 of the main GRB for the 264 GRB with precursors.
The probability of a chance correlation among the duration of the
GRBs with a single precursor (open circles and filled star symbols
in Fig. 1) and the corresponding delay is
![]() .
An even lower chance probability is found including
also GRBs with multiple precursors.
.
An even lower chance probability is found including
also GRBs with multiple precursors.
 |
Figure 1: Delay (precursors to main event) versus T90 of the main prompt emission for the 264 GRBs with precursors found in the BATSE sample. Black empty circles are GRBs with single precursors (191 cases), while filled dots show GRBs with multiple precursors (color code as in the legend). Black filled stars represent the 18 precursors with at least two spectra in K06. The solid line represents equality. |
| Open with DEXTER | |
Since we do not know the redshift of these GRBs, we cannot exclude
that the correlation is at least in part the result of the common
redshift dependence of both the delay and the T90. Moreover,
Fig. 1 shows no apparent difference between GRBs with
single or multiple precursors. This result is somewhat different
from that reported by Ramirez-Ruiz & Merloni (2001). By investigating the
temporal properties of multi-peaked GRBs (but note that they put
no particular emphasis on precursors) they found a strong
one-to-one correlation (4![]() consistency)
between the duration of a peak and the duration of the quiescence time
interval before it.
consistency)
between the duration of a peak and the duration of the quiescence time
interval before it.
-2 In Fig. 2, we show the ratio of the total counts (integrated over T90) of each precursor with respect to the counts in the corresponding main GRB plotted as a function of the delay time. In most cases the precursor total counts are a fraction (of the order 10-20%) of the counts of the main GRB. Also in this case we do not find any difference between single precursors and multiple ones. Not surprisingly, a handful of GRBs show a precursor stronger than the main emission. In these cases, typically the precursor has a duration much larger than that of the main which over-compensates its lower peak flux, thus giving a higher integral count number for the precursor with respect to the main event.
 |
Figure 2: Ratio of precursor to main event counts versus delay times. Symbols and color codes are as in Fig. 1. |
| Open with DEXTER | |
Figure 3 shows the total counts of the precursors with respect to the total counts in the main GRBs. In this plane different selection cuts are evident. The selection criterion for defining precursors in this work is evident as the lack of precursors to the left of the equality line (solid).
 |
Figure 3: Total counts of the precursor versus the total counts of main event. Symbols and color codes are as in Fig. 1. The solid line represents equality, while the dashed line corresponds to precursors dimmer than main events by a factor 10. |
| Open with DEXTER | |
It is apparent from Figs. 2 and 3 that neither the delay times of the precursors with respect to the onset of the main event, nor the integrated counts of the peaks seem to show a specific clustering. Therefore, we can rule out the existence of a subclass of ``real'' precursors among the complete sample, given the selection method.
3 Spectral evolution
In order to study the spectral evolution of the precursors and
compare it with that of the main event, we rely on the time
resolved spectral catalog of Kaneko et al. (2006). K06 analyzed the
spectra of selected bright BATSE GRBs. These were selected to have
a peak photon flux (on the 256 ms timescale and integrated in the
50-300 keV) greater than 10 photons cm-2 s-1 or a total
energy fluence greater than
![]() erg cm-2 in
the energy range
erg cm-2 in
the energy range ![]() 20-2000 keV. This mixed criterion ensured
K06 to have a minimum number of time resolved spectra distributed
within the duration of each GRB so to study the features of its
spectral evolution with sufficient details.
This led to a sample of 350 GRB.
20-2000 keV. This mixed criterion ensured
K06 to have a minimum number of time resolved spectra distributed
within the duration of each GRB so to study the features of its
spectral evolution with sufficient details.
This led to a sample of 350 GRB.
-2 For most GRBs the high energy resolution data of the LAD detectors
were analyzed. These data consists of ![]() 128 energy channels
distributed between
128 energy channels
distributed between ![]() 30 keV and 2 MeV accumulated during the
burst with a minimum time resolution of 128 ms. In some cases also
lower energy resolution data (MER) were analyzed. K06 fitted both
the time integrated spectra and the time resolved spectra with
five different spectral models: a simple power-law (PWR), the Band
model (Band et al. 1993) (BAND), a Band model with fixed high energy
power-law component
30 keV and 2 MeV accumulated during the
burst with a minimum time resolution of 128 ms. In some cases also
lower energy resolution data (MER) were analyzed. K06 fitted both
the time integrated spectra and the time resolved spectra with
five different spectral models: a simple power-law (PWR), the Band
model (Band et al. 1993) (BAND), a Band model with fixed high energy
power-law component ![]() (BETA), a power-law with an
exponential cutoff at high energies (COMP), or a smoothly broken
power-law (SBPL). The spectra within a single GRB were accumulated
in time according to a minimum S/N ratio (required to be larger
than 45 in each time resolved spectrum, integrated over the energy
range 30 and 2000 keV). In the final catalog of K06 the best fit
parameters for all the fitted models are given for all the time
resolved spectra within a single burst. Through this large data
set, it is possible to construct the time evolution of the
spectral parameters of the bursts.
(BETA), a power-law with an
exponential cutoff at high energies (COMP), or a smoothly broken
power-law (SBPL). The spectra within a single GRB were accumulated
in time according to a minimum S/N ratio (required to be larger
than 45 in each time resolved spectrum, integrated over the energy
range 30 and 2000 keV). In the final catalog of K06 the best fit
parameters for all the fitted models are given for all the time
resolved spectra within a single burst. Through this large data
set, it is possible to construct the time evolution of the
spectral parameters of the bursts.
We cross-checked the sample of K06 with the 264 GRB with precursors that we have found in the BATSE catalog. We found 51 GRBs with precursors with time resolved analysis reported in the K06 sample. However, since our aim is to characterize how the spectrum of the precursor evolves in time, we restricted this sample to those GRBs with at least two time resolved spectra analyzed by K06 in the time interval of the precursor. This condition reduces the sample to 18 GRBs. All these have a single precursor in their light curve (except for trigger #6472, that has two precursors). In Figs. 1-3, these 18 events are shown (star symbols): they correspond to the bright end of the distribution of count fluence of the precursors.
![\begin{figure}\par\subfigure[\hspace*{-2mm}{\bf a)} The top panel shows the comp...
...y circles.]
{\includegraphics[width=9cm,height=9.4cm]{12662f5.ps} }
\end{figure}](/articles/aa/full_html/2009/38/aa12662-09/img15.png) |
Figure 4: GRB 930201 (trigger #2156). |
| Open with DEXTER | |
For these 18 GRBs with time resolved spectral analysis reported in
K06 we show (panel (a) of Fig. 4, Fig. 8 and
following even figures) the light curve in counts (and in physical
units as obtained by the spectral analysis) and the time evolution of
the best fit parameters. It has been shown that when analyzing time
resolved BATSE spectra, especially for
![]() (e.g. K06), the
best fit model is often a cutoff power-law. This might be due to
the difficulty of constraining the best fit parameter of the BAND
model (i.e. the high energy spectral index of the power-law) when
the fluence of the spectrum is low (as systematically expected in
time resolved spectra with respect to time integrated ones). For
this reason we decided to plot for all the 18 GRBs the spectral
results given by K06 of the fit with the COMP model. In some cases
this is not the best fit model of the time resolved spectra but for the
aims of the present analysis, i.e. the relative comparison of the
spectral evolution of precursors with respect to that of main bursts,
any systematic effect due to the fit of the spectra with the COMP
model is not affecting our conclusions. We show in Fig. 4
that both the photon spectral index and
(e.g. K06), the
best fit model is often a cutoff power-law. This might be due to
the difficulty of constraining the best fit parameter of the BAND
model (i.e. the high energy spectral index of the power-law) when
the fluence of the spectrum is low (as systematically expected in
time resolved spectra with respect to time integrated ones). For
this reason we decided to plot for all the 18 GRBs the spectral
results given by K06 of the fit with the COMP model. In some cases
this is not the best fit model of the time resolved spectra but for the
aims of the present analysis, i.e. the relative comparison of the
spectral evolution of precursors with respect to that of main bursts,
any systematic effect due to the fit of the spectra with the COMP
model is not affecting our conclusions. We show in Fig. 4
that both the photon spectral index and
![]() follow a strong
soft-to-hard evolution in the rising part of the precursor, and
vice versa in the descending part. In the main emission event both
spectral parameters show a general hard-to-soft trend, but inside
each peak they both follow the same trend shown inside the
single peak of the precursor and moreover they track the
flux.
follow a strong
soft-to-hard evolution in the rising part of the precursor, and
vice versa in the descending part. In the main emission event both
spectral parameters show a general hard-to-soft trend, but inside
each peak they both follow the same trend shown inside the
single peak of the precursor and moreover they track the
flux.
The latter consideration is shown in panel (b) of Fig. 4
(see for comparison the lower panel of Fig. 9 and
following odd figures) where a correlation between the peak energy
![]() and the flux P is apparent. Note however that GRB
930201 is the case with best statistics and hence does not
necessarily stand for a general behavior. We connected (dashed
line) the evolution of the spectral parameters only inside the
precursor. The color code is as in panel (a): namely, the first
(last) spectrum is the black (red) one.
It has been recently pointed out (e.g. Liang et al. 2004; Borgonovo & Ryde 2001, and more recently by Firmani et al. 2009 for Swift GRBs),
that when considering the spectral evolution of long GRBs there is
a trend between the evolution of the flux P and the peak energy
and the flux P is apparent. Note however that GRB
930201 is the case with best statistics and hence does not
necessarily stand for a general behavior. We connected (dashed
line) the evolution of the spectral parameters only inside the
precursor. The color code is as in panel (a): namely, the first
(last) spectrum is the black (red) one.
It has been recently pointed out (e.g. Liang et al. 2004; Borgonovo & Ryde 2001, and more recently by Firmani et al. 2009 for Swift GRBs),
that when considering the spectral evolution of long GRBs there is
a trend between the evolution of the flux P and the peak energy
![]() i.e. approximately
i.e. approximately
![]() .
In particular Firmani et al. (2009) show that 84% of
the K06 sample have
.
In particular Firmani et al. (2009) show that 84% of
the K06 sample have
![]() at the 3
at the 3![]() level. In
addition, the correlation is not biased systematically by the
value of P, though its uncertainty increases with decreasing
flux. We can fiducially extrapolate this evidence to precursors,
keeping open the question of identifying the hidden physical
mechanism that determines the value of
level. In
addition, the correlation is not biased systematically by the
value of P, though its uncertainty increases with decreasing
flux. We can fiducially extrapolate this evidence to precursors,
keeping open the question of identifying the hidden physical
mechanism that determines the value of ![]() .
.
Intriguingly, this is similar to the correlation between the peak luminosity and the peak energy (time integrated over the duration of the burst) in GRBs with measured redshifts (so-called ``Yonetoku'' correlation). A similar result was reached by Liang et al. (2004) based on the spectral evolution of the brightest BATSE GRBs but for which no redshift was measured. Again, when studying the correlation between the luminosity and the peak energy within the few GRBs detected by BATSE and with known z, Firmani et al. (2009) finds that the correlation is present. The existence of a correlation within a single GRB similar to the Yonetoku correlation could be indicative of a physical origin for the quadratic link between the flux and the peak energy.
We can test if and how such a correlation holds in the GRBs with precursors
that we have considered and/or if the
![]() and P of the precursor are consistent
with the correlation defined by the prompt.
and P of the precursor are consistent
with the correlation defined by the prompt.
If this correlation is due to the physics of the emission process or to that of the central engine is still to be understood, but if the precursors and the main event do follow a similar correlation, this would be another piece of the puzzle suggesting that precursors are nothing else than the first emission episodes of the GRB.
4 Discussion
Figure 5 shows the photon spectral indices ![]() versus the peak energy
versus the peak energy
![]() for all 51 GRBs with precursor
present in K06, while Fig. 6 shows for the same
bursts how
for all 51 GRBs with precursor
present in K06, while Fig. 6 shows for the same
bursts how ![]() and
and
![]() behave with the flux P. Different
symbols (and colors, in the electronic edition) marks the
precursor and the main event points. Filled symbols correspond to
the 18 GRBs with at least two spectra for the precursors. Red
triangles mark the remaining precursors in K06 with just one
spectrum. Empty black dots correspond to the spectral parameters
of the main events.
behave with the flux P. Different
symbols (and colors, in the electronic edition) marks the
precursor and the main event points. Filled symbols correspond to
the 18 GRBs with at least two spectra for the precursors. Red
triangles mark the remaining precursors in K06 with just one
spectrum. Empty black dots correspond to the spectral parameters
of the main events.
![\begin{figure}{\resizebox{8.8cm}{!}{\includegraphics[]{12662f6.ps} } } \end{figure}](/articles/aa/full_html/2009/38/aa12662-09/img20.png) |
Figure 5:
Photon spectral indices |
| Open with DEXTER | |
![\begin{figure}{\resizebox{8.8cm}{!}{\includegraphics[]{12662f7.ps} } }\vskip -0.5
cm \end{figure}](/articles/aa/full_html/2009/38/aa12662-09/img21.png) |
Figure 6:
The photon spectral index |
| Open with DEXTER | |
Figure 5 shows that on average precursors and main GRB emission episodes span the same parameter space, while Fig. 6 shows that they follow similar correlations with the flux.
The distributions of the low energy photon indices ![]() of the precursors and the main events are roughly consistent
(the Kolmogorov-Smirnov KS null hypothesis probability is
of the precursors and the main events are roughly consistent
(the Kolmogorov-Smirnov KS null hypothesis probability is
![]() ).
Fitting the two distributions (see Fig. 7, upper
panel) with Gaussian profiles we find
).
Fitting the two distributions (see Fig. 7, upper
panel) with Gaussian profiles we find
![]() and
and
![]() .
.
Three (#5486, #6472, #7343) of the 18 GRBs studied here present
extremely hard spectra. One of them, i.e. GRB 960605
(#5486, see Fig. 11), could even be consistent with a
black-body spectrum at the very beginning of the precursor. These
few cases populate the upper part of Figs. 5 and
6 (upper panel). We have re-extracted the LAD data
for this burst and reanalyzed them. We confirm the findings of
K06. The finding of a precursor with a spectrum consistent with a
black-body should not be taken as a proof of a radical difference
with the main event, since it has been already pointed out
(e.g. Ghirlanda et al. 2003) that a non-negligible fraction of GRB
(![]() 5%) start their emission with a black-body spectrum.
5%) start their emission with a black-body spectrum.
Comparing the distributions of ![]() (
(
![]() )
we find that they are
somewhat different (K-S null hypothesis probability
)
we find that they are
somewhat different (K-S null hypothesis probability
![]() ).
Fitting again with Gaussian profiles the two distributions in
Fig. 7 (lower panel) we find the mean value and
1
).
Fitting again with Gaussian profiles the two distributions in
Fig. 7 (lower panel) we find the mean value and
1![]() scatter for precursors:
scatter for precursors: ![]() (
(
![]() ) =
) =
![]() to
be compared to
to
be compared to ![]() (
(
![]() ) =
) =
![]() for the main emission
events. The distribution of
for the main emission
events. The distribution of
![]() for the precursors is slightly
softer than the one of the main prompt emission. This result is
not surprising when looking at the bottom panel of
Fig. 6: the peak energy of precursors seem to follow
the trend (when
for the precursors is slightly
softer than the one of the main prompt emission. This result is
not surprising when looking at the bottom panel of
Fig. 6: the peak energy of precursors seem to follow
the trend (when
![]() is plotted with respect to flux) drawn by
the GRB main emission, but at the lower left end of the track.
is plotted with respect to flux) drawn by
the GRB main emission, but at the lower left end of the track.
![\begin{figure}{\resizebox{8.8cm}{!}{\includegraphics[]{12662f8.ps} } } \end{figure}](/articles/aa/full_html/2009/38/aa12662-09/img29.png) |
Figure 7:
Normalized distribution of
|
| Open with DEXTER | |
In the 7 precursors with more time resolved spectra
(#2156, #7688, #5486, #6472, #3481, #3241, #1676),
![]() shows a strong evolution but nonetheless is always consistent with
the correlation drawn by the main event (as shown in
Fig. 4b and lower panels in Figs. 9,
11, 13, 15, 17,
19). Note that these similar trends in the evolution of
shows a strong evolution but nonetheless is always consistent with
the correlation drawn by the main event (as shown in
Fig. 4b and lower panels in Figs. 9,
11, 13, 15, 17,
19). Note that these similar trends in the evolution of
![]() do not depend upon the delay, as these vary among
do not depend upon the delay, as these vary among ![]() 9 s
(for #1676) and
9 s
(for #1676) and ![]() 75 s (for #7688).
Note that at odds with B08, this consideration is based only on observed
time intervals, because the redshift z is unknown for all GRBs in this work.
Two of them, namely #2156 and #1676, also show consistent
evolution in
75 s (for #7688).
Note that at odds with B08, this consideration is based only on observed
time intervals, because the redshift z is unknown for all GRBs in this work.
Two of them, namely #2156 and #1676, also show consistent
evolution in ![]() between the precursor and the main event
(see upper panels of Figs. 4b and 19). The
other 5 GRBs (of this group of 7) show an evolution in
between the precursor and the main event
(see upper panels of Figs. 4b and 19). The
other 5 GRBs (of this group of 7) show an evolution in ![]() which is different in the precursor and in the main event: in two
cases (#5486 and #6472)
which is different in the precursor and in the main event: in two
cases (#5486 and #6472) ![]() starts extremely hard and
evolves to softer values (see upper panel of Figs. 11
and 13). In the last three cases (#3481, #3241 and
#7688) either the photon spectral index evolves in a different
way with respect to the one of the main emission episode (as in
Figs. 17 and 9, upper panels), or it lies
in a different region of the parameter space (see upper panel of
Fig. 15).
starts extremely hard and
evolves to softer values (see upper panel of Figs. 11
and 13). In the last three cases (#3481, #3241 and
#7688) either the photon spectral index evolves in a different
way with respect to the one of the main emission episode (as in
Figs. 17 and 9, upper panels), or it lies
in a different region of the parameter space (see upper panel of
Fig. 15).
The remaining 11 GRBs of our sample have more coarsely sampled
precursor spectra. The trend of
![]() of the precursor is
consistent with that of the main event in eight cases. In #3253,
#6454, #3057, #4368, #1157, #6629, #3301, #7343 (see upper
panels of Figs. 23, 25, 27,
29, 33, 35, 39 and
41) the peak energy in the spectra of precursors follow
the same correlation with the flux drawn by the main emission.
Notwithstanding, the number of spectra extracted by K06 in the
precursor varies between five and two, thus preventing any more
confident claim. Among these 8 GRBs, in the latter 3 the photon
spectral indices
of the precursor is
consistent with that of the main event in eight cases. In #3253,
#6454, #3057, #4368, #1157, #6629, #3301, #7343 (see upper
panels of Figs. 23, 25, 27,
29, 33, 35, 39 and
41) the peak energy in the spectra of precursors follow
the same correlation with the flux drawn by the main emission.
Notwithstanding, the number of spectra extracted by K06 in the
precursor varies between five and two, thus preventing any more
confident claim. Among these 8 GRBs, in the latter 3 the photon
spectral indices ![]() of the precursors do not track the trend
drawn by the main emission event (see upper panels of
Figs. 35, 39, and 41), being
always softer (with the exception of the onset of the precursor in
#7343, which has
of the precursors do not track the trend
drawn by the main emission event (see upper panels of
Figs. 35, 39, and 41), being
always softer (with the exception of the onset of the precursor in
#7343, which has
![]() ). In the former badly sampled
5 GRBs, also
). In the former badly sampled
5 GRBs, also ![]() is consistent with the trend described by
the spectra of the main impulse. Note that also in these eight
cases the delay does not represent a distinguishing feature, as it
can vary from 7 s (e.g. #3253) up to >100 s (#3663).
is consistent with the trend described by
the spectra of the main impulse. Note that also in these eight
cases the delay does not represent a distinguishing feature, as it
can vary from 7 s (e.g. #3253) up to >100 s (#3663).
The last three GRBs, namely #3663, #2700, and #3448 present
hardly distinguishable spectral characteristics (i.e. both
![]() and
and
![]() ). This is due either to the extremely low number
of spectra extracted in the precursor, or in the main impulse, or
both at the same time (see Figs. 21, 31, and
37). In our opinion this prevents any further claim.
). This is due either to the extremely low number
of spectra extracted in the precursor, or in the main impulse, or
both at the same time (see Figs. 21, 31, and
37). In our opinion this prevents any further claim.
5 Conclusion
In this work we presented, for the first time, a time resolved
spectral analysis of bright precursors based on spectral
parameters, namely the photon spectral indices ![]() and the
observed peak energy
and the
observed peak energy
![]() .
This was done by using high energy
resolution spectra extracted by K06 in a sample of 350 bright GRBs
out of the complete sample of 2704 confirmed GRBs observed by the
BATSE instrument. Of the 51 bursts with precursor present in K06,
we selected a sample of 18 GRBs having at least two time resolved
spectra of the precursor.
.
This was done by using high energy
resolution spectra extracted by K06 in a sample of 350 bright GRBs
out of the complete sample of 2704 confirmed GRBs observed by the
BATSE instrument. Of the 51 bursts with precursor present in K06,
we selected a sample of 18 GRBs having at least two time resolved
spectra of the precursor.
The comparison with the main emission episode has three outcomes.
The first is that the photon spectral indices of precursors and
main events are consistent, while the peak energies of the
precursors are mildly softer (see Fig. 7). Secondly,
both ![]() and
and
![]() do show an evolution (extreme in a handful
of cases) that defines a relation between the flux P and the
spectral parameters (note that the
do show an evolution (extreme in a handful
of cases) that defines a relation between the flux P and the
spectral parameters (note that the
![]() correlation was recently
reported (e.g. F09) regardless the presence of precursors).
Finally, we showed that delays do not represent a distinguishing
feature in the trend of
correlation was recently
reported (e.g. F09) regardless the presence of precursors).
Finally, we showed that delays do not represent a distinguishing
feature in the trend of ![]() or
or
![]() .
.
We found one GRB (out of 18) in which the onset of the emission of the precursor is consistent with black-body emission (i.e. #5486 - see Fig. 11). This was expected, since Ghirlanda et al. (2003) showed that 5% of BATSE GRBs show extremely hard emission at the onset of the first impulse.
Moreover, comparing the integrated counts in the peaks of precursors with respect to the ones of the main impulses, we confirmed the results of B08 (see Fig. 3). Indeed precursors carry a significant fraction of the energy of the main emission episode, regardless the duration of the time interval of quiescence.
These results, in addition to B08, point strongly to the conclusion that the onset of emission of GRBs (called precursor), even if separated from the main emission episode by hundreds of seconds (in the observers frame), is indistinguishable from that of the main event. Moreover, the delay remains a puzzling issue. This suggests that we should reconsider the idea of what a precursor is. Since our result is partially in contrast with L05 we cannot rule out the possibility that ``real precursors'' belong to another class of very dim pulses of different origin. Nonetheless, both kind of precursors can show very long delays, thus tackling any theoretical model for GRB prompt emission.
Acknowledgements
We acknowledge Marco Nardini and Lara Nava for stimulating discussion. D. B. is supported through DLR 50 OR 0405. This research was partially supported by ASI-INAF I/088/06/0 and MIUR. We acknowledge the use of public data from the BATSE data archive. D. B. thanks the OAB for the kind hospitality during the completion of this work.
References
- Band, D., Matteson, J., Ford, L., et al. 1993, ApJ, 413, 281 [NASA ADS] [CrossRef] (In the text)
- Borgonovo, L., & Ryde, F. 2001, ApJ, 548, 770 [NASA ADS] [CrossRef]
- Burlon, D., Ghirlanda, G., Ghisellini, G., et al. 2008, ApJ, 685, L19 [NASA ADS] [CrossRef] (In the text)
- Daigne, F., & Mochkovitch, R. 2002, MNRAS, 336, 1271 [NASA ADS] [CrossRef]
- Firmani, C., Cabrera, J. I., Avila-Reese, V., et al. 2009, MNRAS, 393, 1209 [NASA ADS] [CrossRef] (In the text)
- Fishman, G. J., Meegan, C. A., Wilson, R. B., et al. 1989, in Developments in Observations and Theory for Solar Cycle, Vol. 22, ed. R. M. Winglee, & B. R. Dennis, 96 (In the text)
- Ghirlanda, G., Celotti, A., & Ghisellini, G. 2002, A&A, 393, 409 [NASA ADS] [CrossRef] [EDP Sciences] (In the text)
- Ghirlanda, G., Celotti, A., & Ghisellini, G. 2003, A&A, 406, 879 [NASA ADS] [CrossRef] [EDP Sciences] (In the text)
- Ghirlanda, G., Nava, L., Ghisellini, G., Celotti, A., & Firmani, C. 2009, A&A, 496, 585 [NASA ADS] [CrossRef] [EDP Sciences] (In the text)
- Kaneko, Y., Preece, R. D., Briggs, M. S., et al. 2006, ApJS, 166, 298 [NASA ADS] [CrossRef] (In the text)
- Koshut, T. M., Kouveliotou, C., Paciesas, W. S., et al. 1995, ApJ, 452, 145 [NASA ADS] [CrossRef] (In the text)
- Lazzati, D. 2005, MNRAS, 357, 722 [NASA ADS] [CrossRef] (In the text)
- Lazzati, D., & Begelman, M. C. 2005, ApJ, 629, 903 [NASA ADS] [CrossRef]
- Li, L.-X. 2007, MNRAS, 380, 621 [NASA ADS] [CrossRef]
- Liang, E. W., Dai, Z. G., & Wu, X. F. 2004, ApJ, 606, L29 [NASA ADS] [CrossRef] (In the text)
- Lipunova, G. V., Gorbovskoy, E. S., Bogomazov, A. I., & Lipunov, V. M. 2009 [arXiv:0903.3169] (In the text)
- Lyutikov, M., & Blandford, R. 2003 [arXiv:astro-ph/0312347]
- Mészáros, P., & Rees, M. J. 2000, ApJ, 530, 292 [NASA ADS] [CrossRef]
- Ramirez-Ruiz, E., & Merloni, A. 2001, MNRAS, 320, L25 [NASA ADS] [CrossRef] (In the text)
- Ramirez-Ruiz, E., MacFadyen, A. I., & Lazzati, D. 2002, MNRAS, 331, 197 [NASA ADS] [CrossRef]
- Ruffini, R., Bianco, C. L., Fraschetti, F., Xue, S.-S., & Chardonnet, P. 2001, ApJ, 555, L113 [NASA ADS] [CrossRef]
- Ryde, F., Kocevski, D., Bagoly, Z., Ryde, N., & Mészáros, A. 2005, A&A, 432, 105 [NASA ADS] [CrossRef] [EDP Sciences] (In the text)
- Wang, X.-Y., & Mészáros, P. 2007, ApJ, 670, 1247 [NASA ADS] [CrossRef] (In the text)
- Yonetoku, D., Murakami, T., Nakamura, T., et al. 2004, ApJ, 609, 935 [NASA ADS] [CrossRef] (In the text)
Online Material
 |
Figure 8: Trigger #7688. Color code and description as in Fig. 4a. |
| Open with DEXTER | |
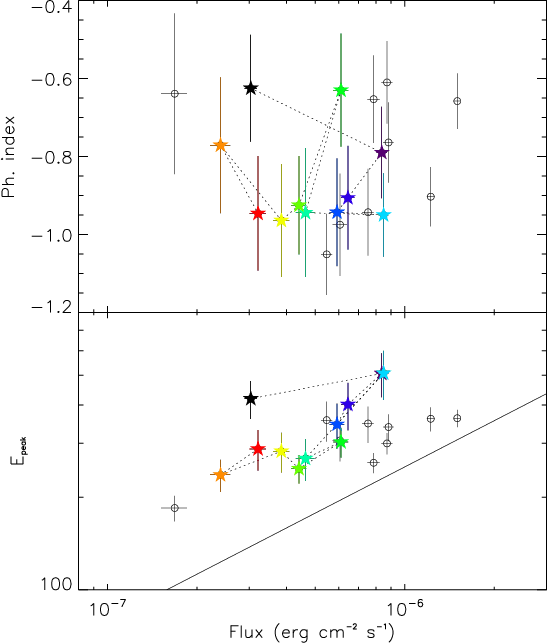 |
Figure 9: Trigger #7688. Color code and description as in Fig. 4b. |
| Open with DEXTER | |
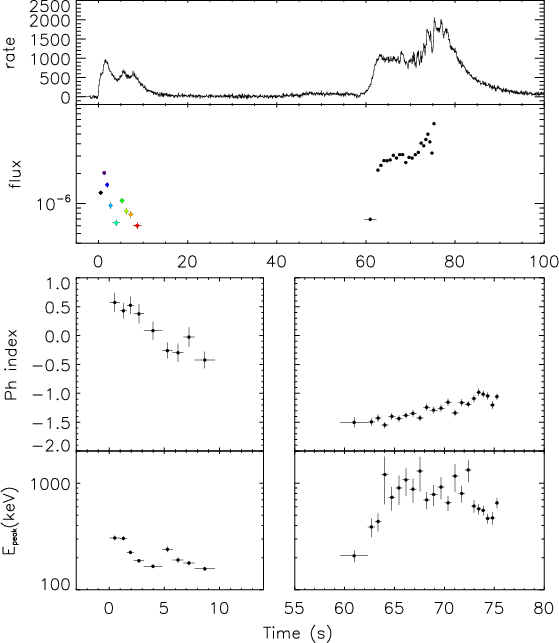 |
Figure 10: Trigger #5486. Color code and description as in Fig. 4a. |
| Open with DEXTER | |
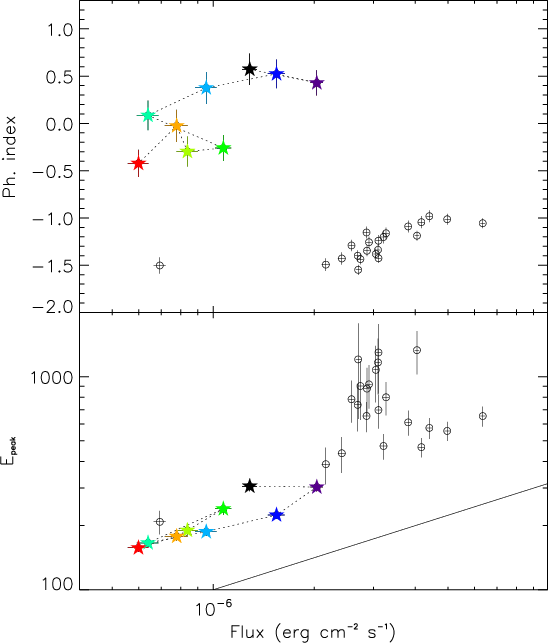 |
Figure 11: Trigger #5486. Color code and description as in Fig. 4b. |
| Open with DEXTER | |
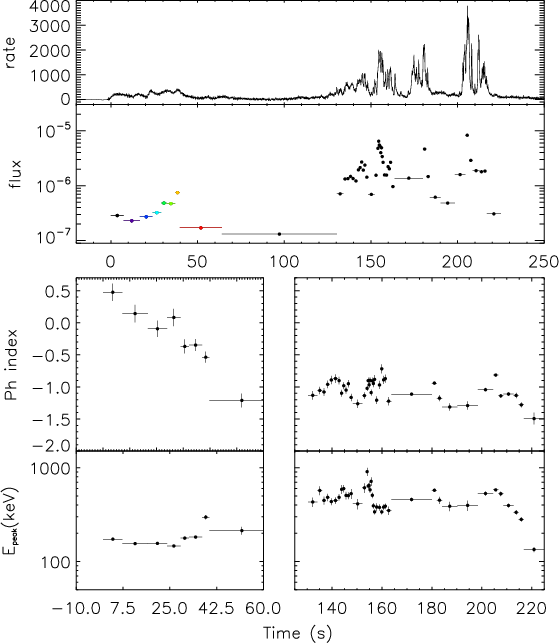 |
Figure 12: Trigger #6472. Color code and description as in Fig. 4a. |
| Open with DEXTER | |
 |
Figure 13: Trigger #6472. Color code and description as in Fig. 4b. |
| Open with DEXTER | |
 |
Figure 14: Trigger #3481. Color code and description as in Fig. 4a. |
| Open with DEXTER | |
 |
Figure 15: Trigger #3481. Color code and description as in Fig. 4b. |
| Open with DEXTER | |
 |
Figure 16: Trigger #3241. Color code and description as in Fig. 4a. |
| Open with DEXTER | |
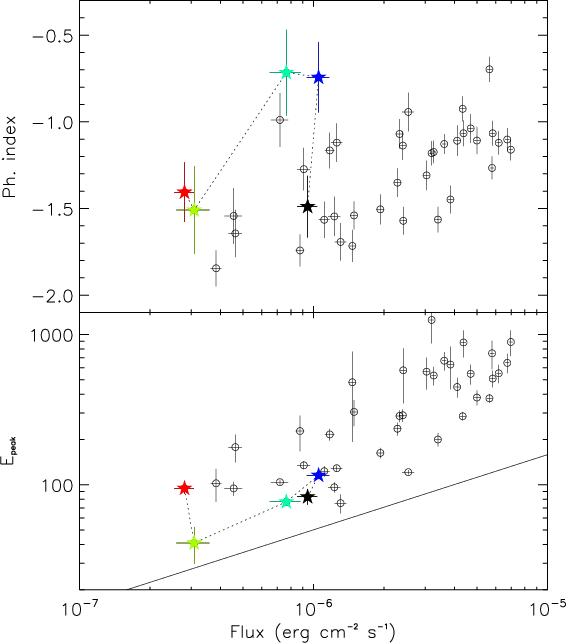 |
Figure 17: Trigger #3241. Color code and description as in Fig. 4b. |
| Open with DEXTER | |
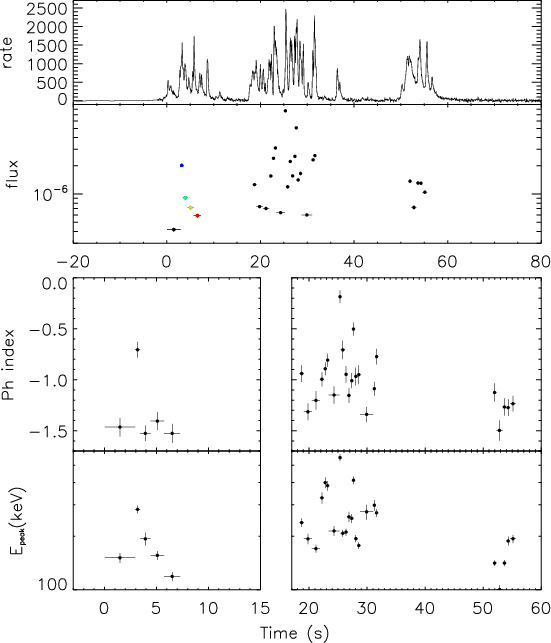 |
Figure 18: Trigger #1676. Color code and description as in Fig. 4a. |
| Open with DEXTER | |
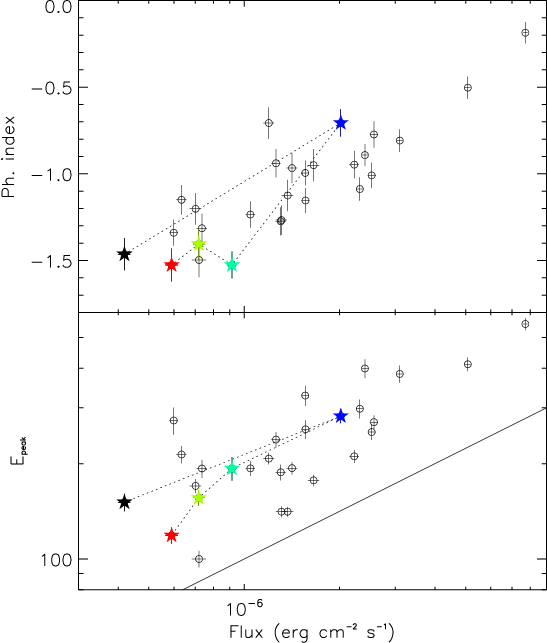 |
Figure 19: Trigger #1676. Color code and description as in Fig. 4b. |
| Open with DEXTER | |
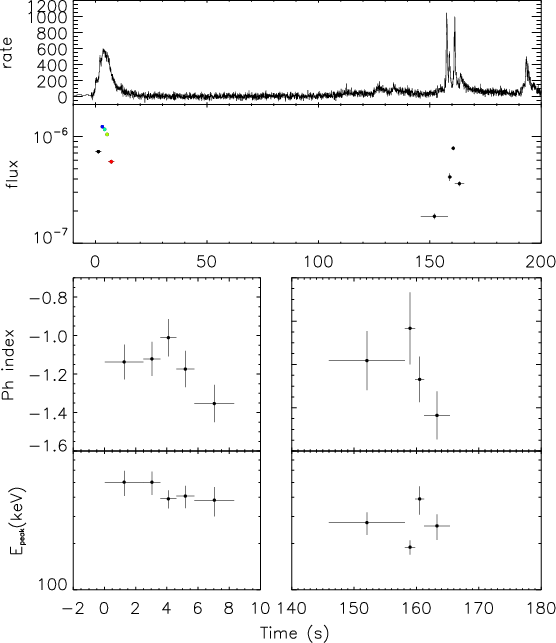 |
Figure 20: Trigger #3663. Color code and description as in Fig. 4a. |
| Open with DEXTER | |
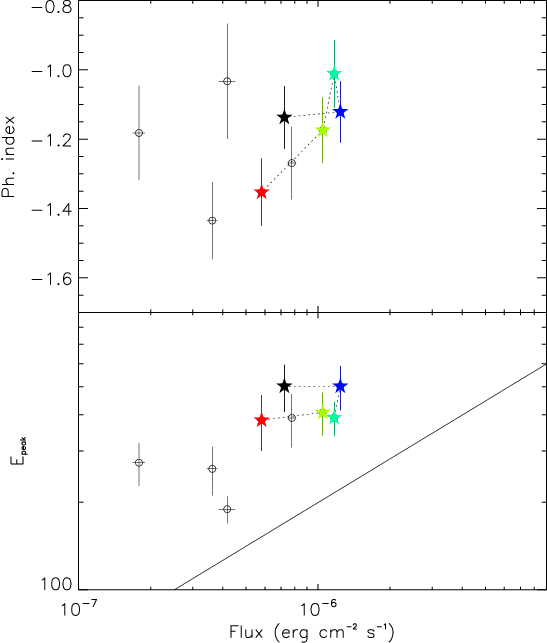 |
Figure 21: Trigger #3663. Color code and description as in Fig. 4b. |
| Open with DEXTER | |
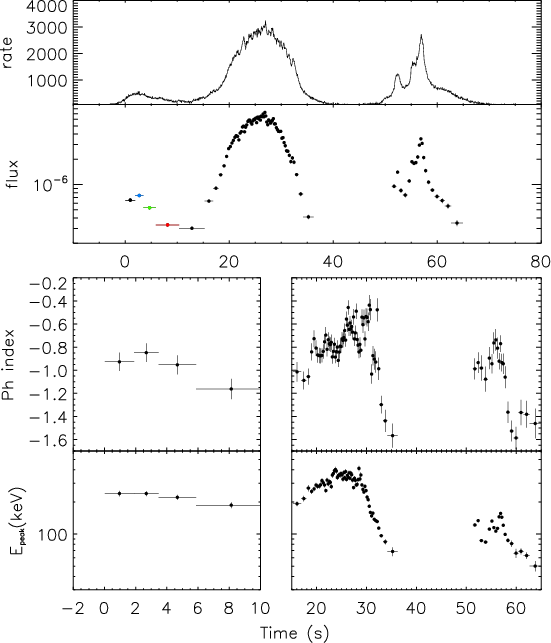 |
Figure 22: Trigger #3253. Color code and description as in Fig. 4a. |
| Open with DEXTER | |
 |
Figure 23: Trigger #3253. Color code and description as in Fig. 4b. |
| Open with DEXTER | |
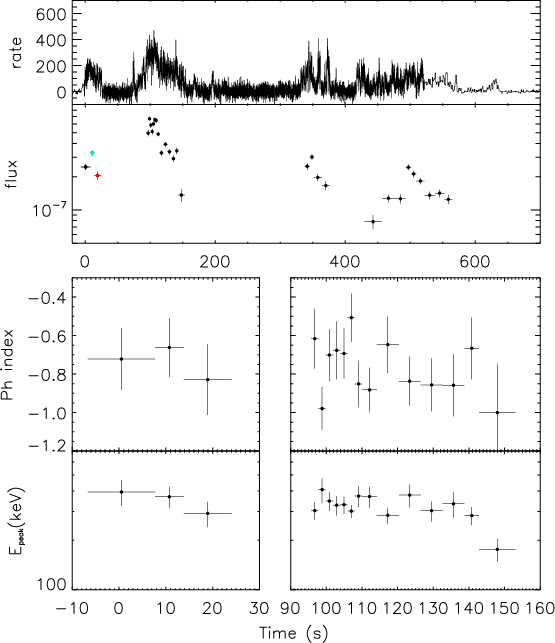 |
Figure 24: Trigger #6454. Color code and description as in Fig. 4a. |
| Open with DEXTER | |
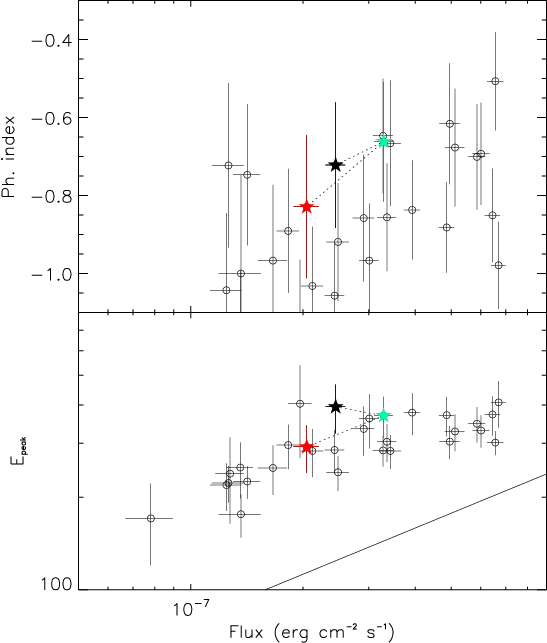 |
Figure 25: Trigger #6454. Color code and description as in Fig. 4b. |
| Open with DEXTER | |
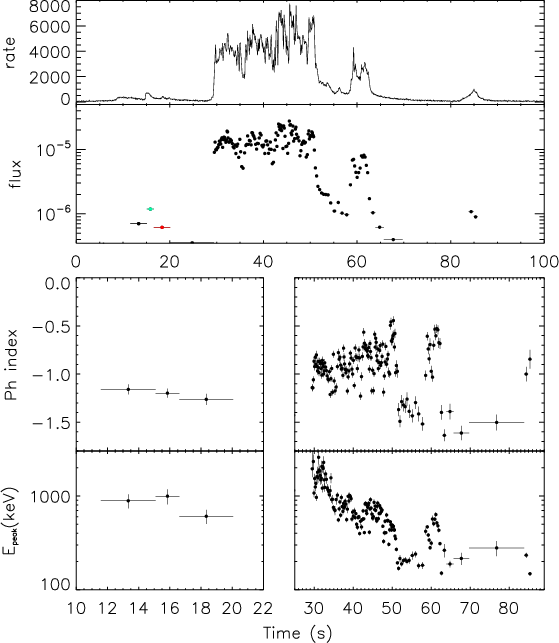 |
Figure 26: Trigger #3057. Color code and description as in Fig. 4a. |
| Open with DEXTER | |
 |
Figure 27: Trigger #3057. Color code and description as in Fig. 4b. |
| Open with DEXTER | |
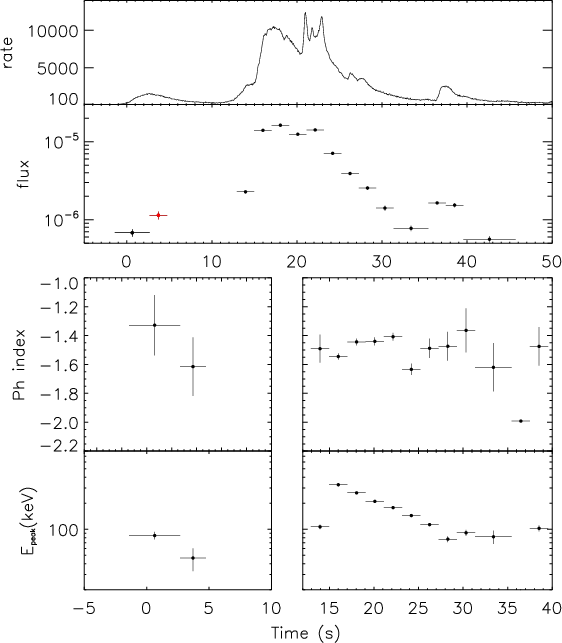 |
Figure 28: Trigger #4368. Color code and description as in Fig. 4a. |
| Open with DEXTER | |
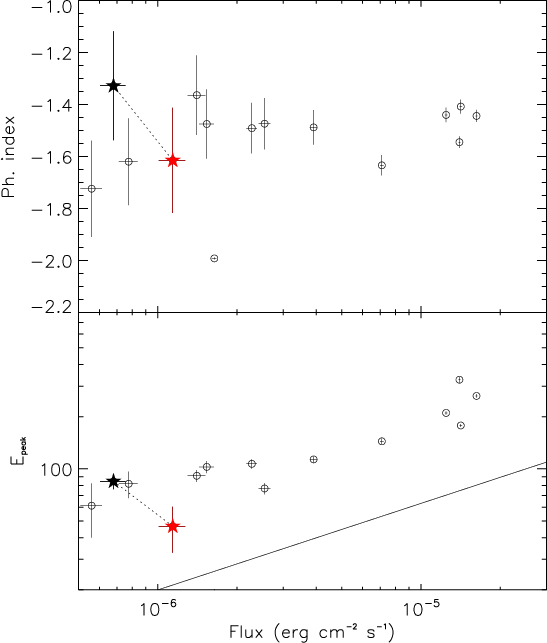 |
Figure 29: Trigger #4368. Color code and description as in Fig. 4b. |
| Open with DEXTER | |
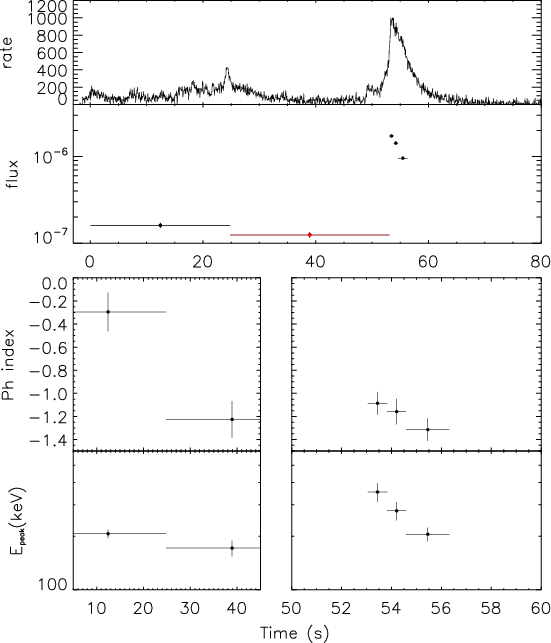 |
Figure 30: Trigger #2700. Color code and description as in Fig. 4a. |
| Open with DEXTER | |
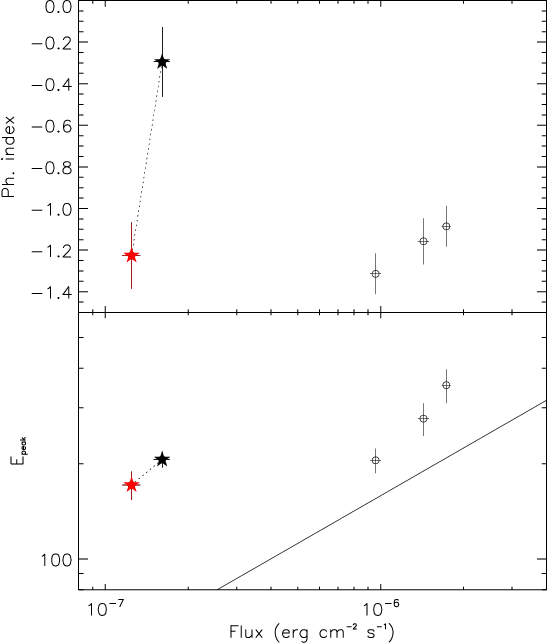 |
Figure 31: Trigger #2700. Color code and description as in Fig. 4b. |
| Open with DEXTER | |
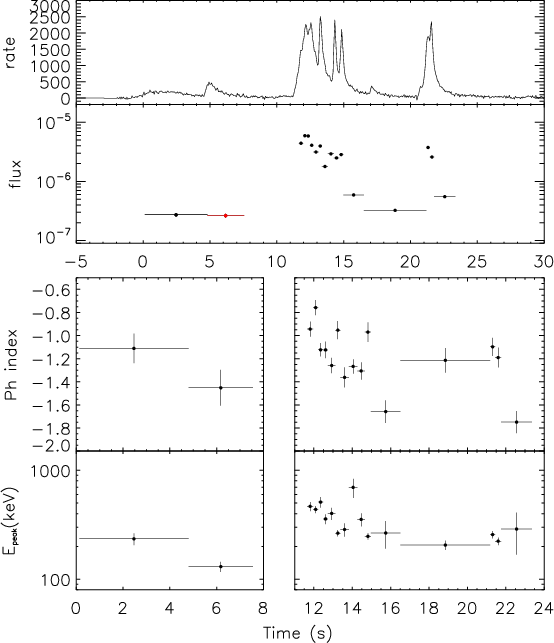 |
Figure 32: Trigger #1157. Color code and description as in Fig. 4a. |
| Open with DEXTER | |
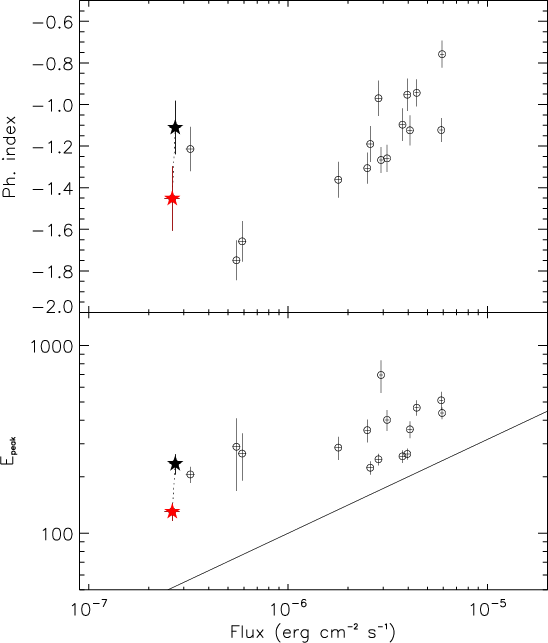 |
Figure 33: Trigger #1157. Color code and description as in Fig. 4b. |
| Open with DEXTER | |
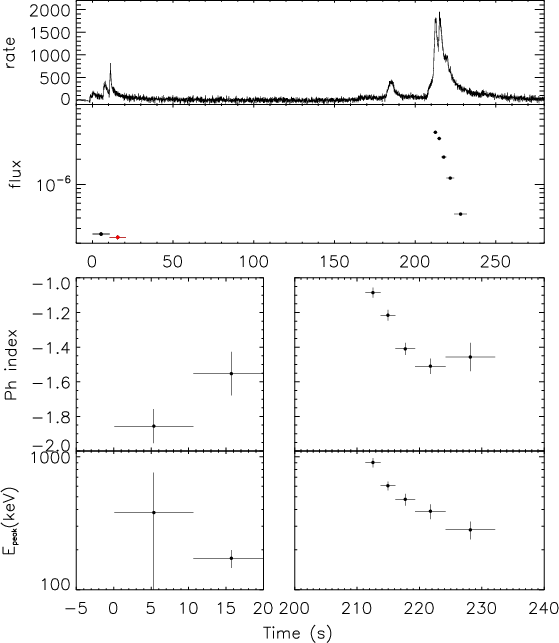 |
Figure 34: Trigger #6629. Color code and description as in Fig. 4a. |
| Open with DEXTER | |
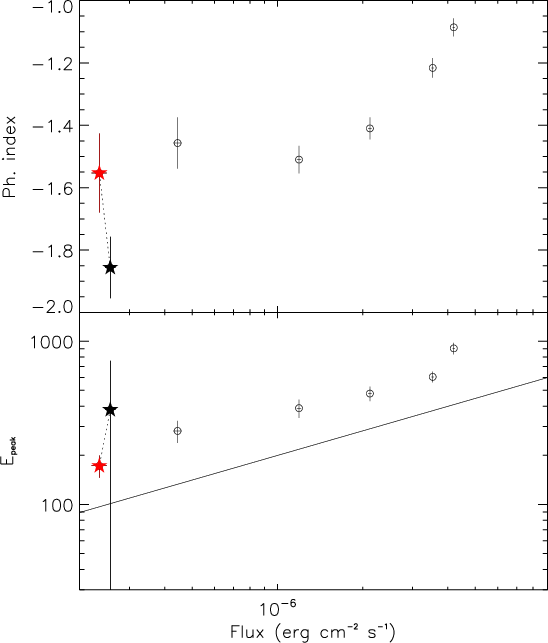 |
Figure 35: Trigger #6629. Color code and description as in Fig. 4b. |
| Open with DEXTER | |
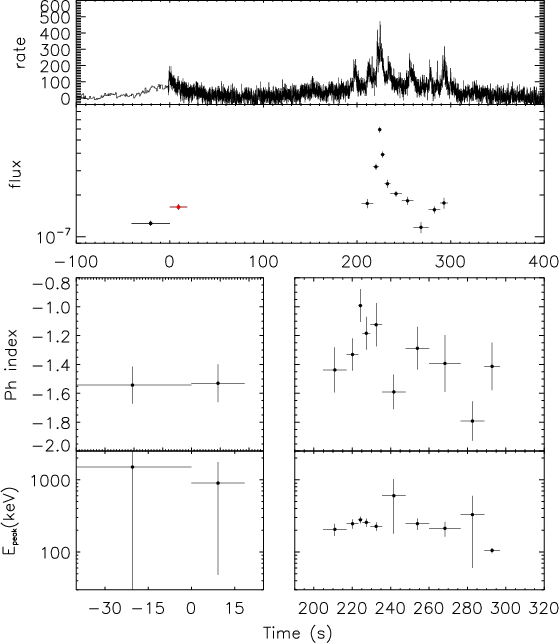 |
Figure 36: Trigger #3448. Color code and description as in Fig. 4a. |
| Open with DEXTER | |
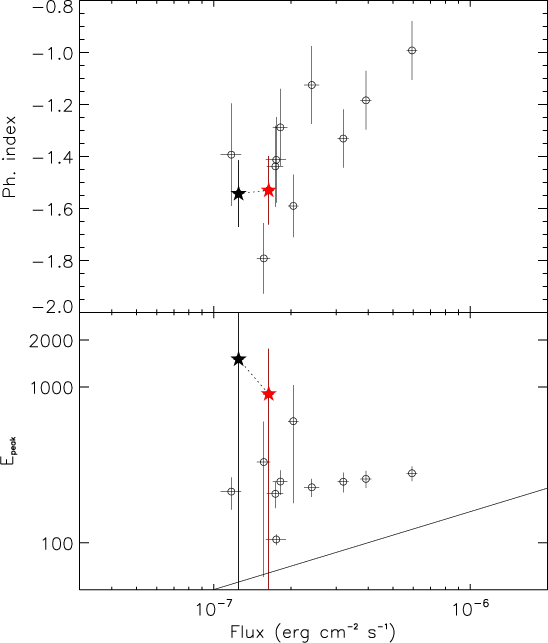 |
Figure 37: Trigger #3448. Color code and description as in Fig. 4b. |
| Open with DEXTER | |
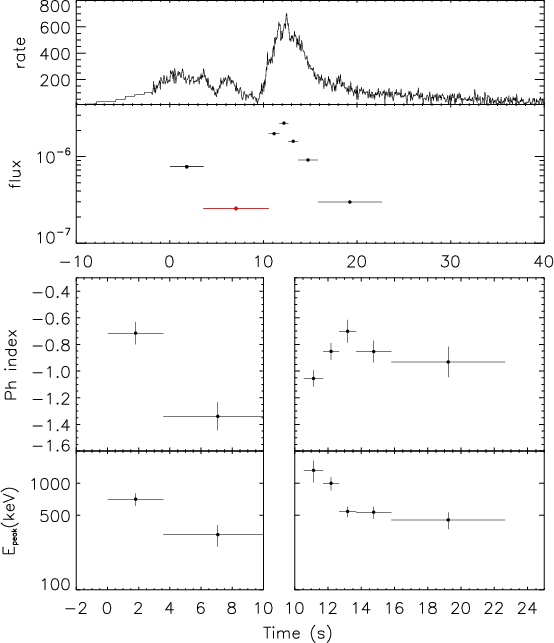 |
Figure 38: Trigger #3301. Color code and description as in Fig. 4a. |
| Open with DEXTER | |
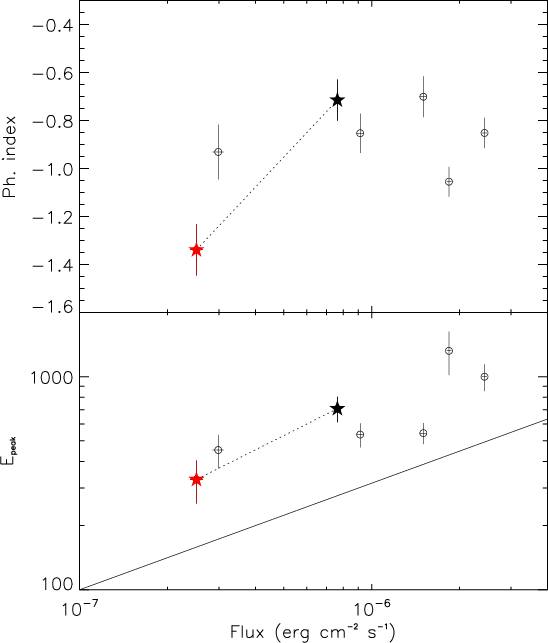 |
Figure 39: Trigger #3301. Color code and description as in Fig. 4b. |
| Open with DEXTER | |
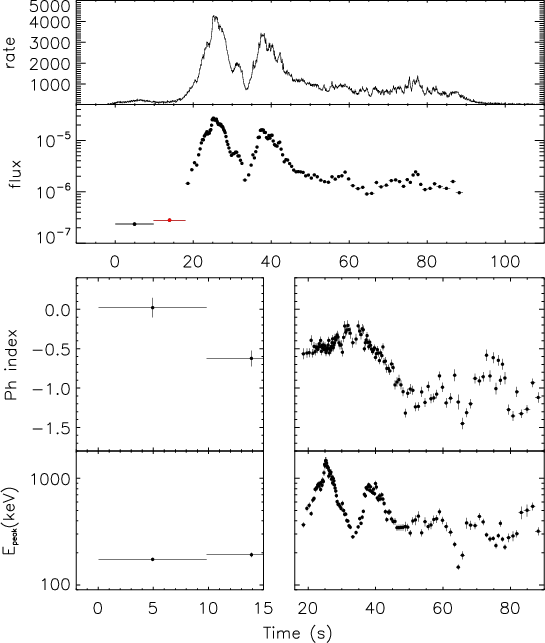 |
Figure 40: Trigger #7343. Color code and description as in Fig. 4a. |
| Open with DEXTER | |
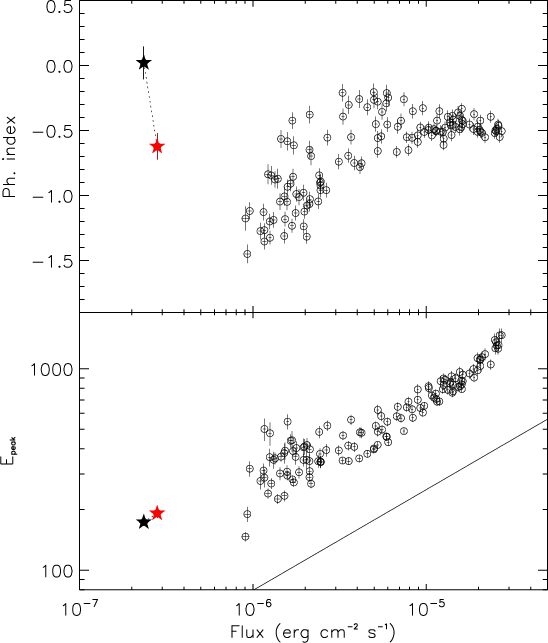 |
Figure 41: Trigger #7343. Color code and description as in Fig. 4b. |
| Open with DEXTER | |
Footnotes
- ... precursors
- Figures 8 to 41 are only available in electronic form at http://www.aanda.org
- ...
sample
- http://heasarc.gsfc.nasa.gov/docs/cgro/batse/BATSE_Ctlg/basic.html
- ...
curve
- http://heasarc.gsfc.nasa.gov/docs/cgro/batse/batseburst/sixtyfour_ms/index.html
All Figures
| |
Figure 1: Delay (precursors to main event) versus T90 of the main prompt emission for the 264 GRBs with precursors found in the BATSE sample. Black empty circles are GRBs with single precursors (191 cases), while filled dots show GRBs with multiple precursors (color code as in the legend). Black filled stars represent the 18 precursors with at least two spectra in K06. The solid line represents equality. |
| Open with DEXTER | |
| In the text | |
| |
Figure 2: Ratio of precursor to main event counts versus delay times. Symbols and color codes are as in Fig. 1. |
| Open with DEXTER | |
| In the text | |
| |
Figure 3: Total counts of the precursor versus the total counts of main event. Symbols and color codes are as in Fig. 1. The solid line represents equality, while the dashed line corresponds to precursors dimmer than main events by a factor 10. |
| Open with DEXTER | |
| In the text | |
| |
Figure 4: GRB 930201 (trigger #2156). |
| Open with DEXTER | |
| In the text | |
| |
Figure 5:
Photon spectral indices |
| Open with DEXTER | |
| In the text | |
| |
Figure 6:
The photon spectral index |
| Open with DEXTER | |
| In the text | |
| |
Figure 7:
Normalized distribution of
|
| Open with DEXTER | |
| In the text | |
| |
Figure 8: Trigger #7688. Color code and description as in Fig. 4a. |
| Open with DEXTER | |
| In the text | |
| |
Figure 9: Trigger #7688. Color code and description as in Fig. 4b. |
| Open with DEXTER | |
| In the text | |
| |
Figure 10: Trigger #5486. Color code and description as in Fig. 4a. |
| Open with DEXTER | |
| In the text | |
| |
Figure 11: Trigger #5486. Color code and description as in Fig. 4b. |
| Open with DEXTER | |
| In the text | |
| |
Figure 12: Trigger #6472. Color code and description as in Fig. 4a. |
| Open with DEXTER | |
| In the text | |
| |
Figure 13: Trigger #6472. Color code and description as in Fig. 4b. |
| Open with DEXTER | |
| In the text | |
| |
Figure 14: Trigger #3481. Color code and description as in Fig. 4a. |
| Open with DEXTER | |
| In the text | |
| |
Figure 15: Trigger #3481. Color code and description as in Fig. 4b. |
| Open with DEXTER | |
| In the text | |
| |
Figure 16: Trigger #3241. Color code and description as in Fig. 4a. |
| Open with DEXTER | |
| In the text | |
| |
Figure 17: Trigger #3241. Color code and description as in Fig. 4b. |
| Open with DEXTER | |
| In the text | |
| |
Figure 18: Trigger #1676. Color code and description as in Fig. 4a. |
| Open with DEXTER | |
| In the text | |
| |
Figure 19: Trigger #1676. Color code and description as in Fig. 4b. |
| Open with DEXTER | |
| In the text | |
| |
Figure 20: Trigger #3663. Color code and description as in Fig. 4a. |
| Open with DEXTER | |
| In the text | |
| |
Figure 21: Trigger #3663. Color code and description as in Fig. 4b. |
| Open with DEXTER | |
| In the text | |
| |
Figure 22: Trigger #3253. Color code and description as in Fig. 4a. |
| Open with DEXTER | |
| In the text | |
| |
Figure 23: Trigger #3253. Color code and description as in Fig. 4b. |
| Open with DEXTER | |
| In the text | |
| |
Figure 24: Trigger #6454. Color code and description as in Fig. 4a. |
| Open with DEXTER | |
| In the text | |
| |
Figure 25: Trigger #6454. Color code and description as in Fig. 4b. |
| Open with DEXTER | |
| In the text | |
| |
Figure 26: Trigger #3057. Color code and description as in Fig. 4a. |
| Open with DEXTER | |
| In the text | |
| |
Figure 27: Trigger #3057. Color code and description as in Fig. 4b. |
| Open with DEXTER | |
| In the text | |
| |
Figure 28: Trigger #4368. Color code and description as in Fig. 4a. |
| Open with DEXTER | |
| In the text | |
| |
Figure 29: Trigger #4368. Color code and description as in Fig. 4b. |
| Open with DEXTER | |
| In the text | |
| |
Figure 30: Trigger #2700. Color code and description as in Fig. 4a. |
| Open with DEXTER | |
| In the text | |
| |
Figure 31: Trigger #2700. Color code and description as in Fig. 4b. |
| Open with DEXTER | |
| In the text | |
| |
Figure 32: Trigger #1157. Color code and description as in Fig. 4a. |
| Open with DEXTER | |
| In the text | |
| |
Figure 33: Trigger #1157. Color code and description as in Fig. 4b. |
| Open with DEXTER | |
| In the text | |
| |
Figure 34: Trigger #6629. Color code and description as in Fig. 4a. |
| Open with DEXTER | |
| In the text | |
| |
Figure 35: Trigger #6629. Color code and description as in Fig. 4b. |
| Open with DEXTER | |
| In the text | |
| |
Figure 36: Trigger #3448. Color code and description as in Fig. 4a. |
| Open with DEXTER | |
| In the text | |
| |
Figure 37: Trigger #3448. Color code and description as in Fig. 4b. |
| Open with DEXTER | |
| In the text | |
| |
Figure 38: Trigger #3301. Color code and description as in Fig. 4a. |
| Open with DEXTER | |
| In the text | |
| |
Figure 39: Trigger #3301. Color code and description as in Fig. 4b. |
| Open with DEXTER | |
| In the text | |
| |
Figure 40: Trigger #7343. Color code and description as in Fig. 4a. |
| Open with DEXTER | |
| In the text | |
| |
Figure 41: Trigger #7343. Color code and description as in Fig. 4b. |
| Open with DEXTER | |
| In the text | |
Copyright ESO 2009
Current usage metrics show cumulative count of Article Views (full-text article views including HTML views, PDF and ePub downloads, according to the available data) and Abstracts Views on Vision4Press platform.
Data correspond to usage on the plateform after 2015. The current usage metrics is available 48-96 hours after online publication and is updated daily on week days.
Initial download of the metrics may take a while.