| Issue |
A&A
Volume 503, Number 2, August IV 2009
|
|
|---|---|---|
| Page(s) | 469 - 476 | |
| Section | Galactic structure, stellar clusters, and populations | |
| DOI | https://doi.org/10.1051/0004-6361/200912322 | |
| Published online | 02 July 2009 | |
The low-mass stellar-mass functions of rich, compact clusters in the Large Magellanic Cloud![[*]](/icons/foot_motif.png)
Q. Liu1,2 - R. de Grijs3,1 - L. C. Deng1 - Y. Hu1,2 - S. F. Beaulieu4
1 - National Astronomical Observatories, Chinese Academy of Sciences,
Beijing 100012, PR China
2 -
Graduate University of the Chinese Academy of Sciences, Beijing
100049, PR China
3 -
Department of Physics & Astronomy, The University of Sheffield,
Sheffield S3 7RH, UK
4 -
Département de Physique, de Génie Physique et d'Optique
and Centre de Recherche en Astrophysique du Québec, Université
Laval, Québec, QC G1V 0A6, Canada
Received 14 April 2009 / Accepted 22 May 2009
Abstract
Context. The LMC is an ideal environment for studying stellar MFs, because it contains a large population of compact clusters at different evolutionary stages. We aim to obtain constraints on the initial MFs (IMFs) of our sample clusters on the basis of their present-day MFs, combined with our understanding of their dynamical and photometric evolution.
Aims. We use Hubble Space Telescope photometry for six rich, compact star clusters in the Large Magellanic Cloud (LMC), with ages ranging from 0.01 to 1.0 Gyr, to derive the clusters' stellar mass functions (MFs) at their half-mass radii.
Methods. We derived the clusters' present-day MFs below
![]() using deep observations with the Space Telescope Imaging Spectrograph and updated stellar population synthesis models.
using deep observations with the Space Telescope Imaging Spectrograph and updated stellar population synthesis models.
Results. Since the relaxation timescales of low-mass stars are very long, dynamical evolution will not have affected the MFs below
![]() significantly, so that - within the uncertainties - the derived MFs are consistent with the solar-neighbourhood IMF, at least for the younger clusters. The IMF in the low-density, low-metallicity environment of the LMC disk is not significantly different from the IMF in the solar neighbourhood.
significantly, so that - within the uncertainties - the derived MFs are consistent with the solar-neighbourhood IMF, at least for the younger clusters. The IMF in the low-density, low-metallicity environment of the LMC disk is not significantly different from the IMF in the solar neighbourhood.
Key words: stars: low-mass, brown dwarfs - stars: luminosity function, mass function - stars: pre-main sequence - Magellanic Clouds - galaxies: star clusters
1 Introduction
The shape of the stellar initial mass function (IMF) is a very
important unresolved issue in modern astrophysics, because it plays
a crucial role in many of the remaining ``big questions''. The IMF is
usually assumed to be universal, and best approximated by either a
power law (e.g., Kroupa 2001) or a lognormal distribution (Chabrier
2003; Andersen et al. 2008). Kroupa (2001) studied the
Galactic-field IMF down to
![]() and derived a three-part
power-law function. Chiosi et al. (2007) obtained a similar mass
function down to
and derived a three-part
power-law function. Chiosi et al. (2007) obtained a similar mass
function down to
![]() based on their analysis of three
clusters in the Small Magellanic Cloud (SMC), and concluded that the
IMF in SMC clusters agrees with the ``standard'' Kroupa (2001)
solar-neighbourhood IMF. Da Rio et al. (2009) has recently studied
the stellar association LH 95 in the Large Magellanic Cloud (LMC),
focusing on its pre-main-sequence (PMS) stars. Their results show
that there are no significant differences between the IMFs of the
entire LH 95 region and those of three individual subclusters,
because they all follow a multiple power-law distribution. Andersen
et al. (2008) studied the low-mass stellar mass distributions of
seven star-forming regions and concludes that the composite IMF is
consistent with a lognormal distribution. Paresce et al. (2000)
obtained a similar result after analysing the mass functions (MFs)
of a dozen Galactic globular clusters (GCs) for stellar masses below
based on their analysis of three
clusters in the Small Magellanic Cloud (SMC), and concluded that the
IMF in SMC clusters agrees with the ``standard'' Kroupa (2001)
solar-neighbourhood IMF. Da Rio et al. (2009) has recently studied
the stellar association LH 95 in the Large Magellanic Cloud (LMC),
focusing on its pre-main-sequence (PMS) stars. Their results show
that there are no significant differences between the IMFs of the
entire LH 95 region and those of three individual subclusters,
because they all follow a multiple power-law distribution. Andersen
et al. (2008) studied the low-mass stellar mass distributions of
seven star-forming regions and concludes that the composite IMF is
consistent with a lognormal distribution. Paresce et al. (2000)
obtained a similar result after analysing the mass functions (MFs)
of a dozen Galactic globular clusters (GCs) for stellar masses below
![]() .
Thus, the form of the universal IMF appears to be
best approximated by both Kroupa (2001) broken power-law and
lognormal distributions (Chabrier 2003; Andersen et al. 2008; Covey
et al. 2008; Liu et al. 2009; Oliveira et al. 2009). To distinguish
between either shape, one would need to probe down to the
stellar/brown-dwarf transition region, which still poses a
significant observational challenge, particularly in (even the
nearest) extragalactic environments.
.
Thus, the form of the universal IMF appears to be
best approximated by both Kroupa (2001) broken power-law and
lognormal distributions (Chabrier 2003; Andersen et al. 2008; Covey
et al. 2008; Liu et al. 2009; Oliveira et al. 2009). To distinguish
between either shape, one would need to probe down to the
stellar/brown-dwarf transition region, which still poses a
significant observational challenge, particularly in (even the
nearest) extragalactic environments.
Table 1: Fundamental parameters of our LMC cluster sample.
The evolution of the stellar MF is also more generally important
because the IMFs of many clusters and galaxies cannot be observed
directly. However, we can derive their IMFs based on the present-day
MF (PDMF) if - at least - we understand its evolution in detail.
Star clusters, both open clusters and GCs, provide ideal objects for
tackling many astronomical problems, because all of their member
stars have approximately the same age and metallicity, and are
located roughly at the same distance. Although the GCs in the Milky
Way are relatively nearby and their members can be observed easily,
they are not well suited for studying the evolution of the MF,
because Galactic GCs are all old (with ages ![]() Gyr). They
can therefore only provide evolutionary information on long
timescales. Galactic open clusters, on the other hand, are only
effective tracers of MF evolution on short timescales, while they
also tend to be affected quite significantly by low-number
statistics. Ideally, therefore, we need rich massive clusters
covering a wide age range to make significant progress on this
important problem. This makes the LMC an ideal laboratory, because
it contains a large population of rich star clusters with masses
similar to Galactic GCs and covering ages from 0.001 to 10 Gyr
(e.g., Beaulieu et al. 1999; Elson et al. 1999). This implies that
we can study the MF at almost all evolutionary stages using the
rich, compact clusters in the LMC. In the past, it proved impossible
to resolve individual stars in dense star clusters at the distance
of the LMC (
Gyr). They
can therefore only provide evolutionary information on long
timescales. Galactic open clusters, on the other hand, are only
effective tracers of MF evolution on short timescales, while they
also tend to be affected quite significantly by low-number
statistics. Ideally, therefore, we need rich massive clusters
covering a wide age range to make significant progress on this
important problem. This makes the LMC an ideal laboratory, because
it contains a large population of rich star clusters with masses
similar to Galactic GCs and covering ages from 0.001 to 10 Gyr
(e.g., Beaulieu et al. 1999; Elson et al. 1999). This implies that
we can study the MF at almost all evolutionary stages using the
rich, compact clusters in the LMC. In the past, it proved impossible
to resolve individual stars in dense star clusters at the distance
of the LMC (![]() 50 kpc), but the unprecedented, high spatial
resolution of the Hubble Space Telescope (HST) facilitates
such studies today.
50 kpc), but the unprecedented, high spatial
resolution of the Hubble Space Telescope (HST) facilitates
such studies today.
In Sect. 2, we briefly describe our HST observations and give a basic overview of the data-reduction procedures (see detailed steps in Liu et al. 2009). We present and discuss our main results in Sects. 3 and 4, respectively, and provide a summary in Sect. 5.
2 Observations and data reduction
2.1 Observations and previous work
As part of HST programme GO-7307, we observed a carefully selected cluster sample in the LMC, including six compact clusters in three pairs (Pair I: NGC 1805 and NGC 1818, Pair II: NGC 1831 and NGC 1868, and Pair III: NGC 2209 and Hodge 14): see Table 1 for their fundamental parameters. Our six sample clusters have ages of 107-109 yr, with the additional constraint that the two clusters in each pair have similar ages, metallicities, total mass, and distance from the LMC centre, yet different structural parameters (Beaulieu et al. 1999).
Much work has been done already, based on these high-quality imaging
observations (e.g., Elson et al. 1998, 1999; Johnson et al. 2001;
Santiago et al. 2001; de Grijs et al. 2002a-c; Kerber et al. 2006;
Liu et al. 2009). de Grijs et al. (2002a,b) obtained the MFs of the
two youngest clusters in our sample for stellar masses above
![]() ,
and concluded that they are largely similar to the
Salpeter (1955) IMF. Liu et al. (2009) analysed the MF of NGC 1818
below 1.0
,
and concluded that they are largely similar to the
Salpeter (1955) IMF. Liu et al. (2009) analysed the MF of NGC 1818
below 1.0 ![]() and combined their low-mass MF with the
higher-mass results of de Grijs et al. (2002b). They found that the
IMF of NGC 1818 could be well approximated by both a Kroupa
(2001)-type broken power-law function and a lognormal distribution.
and combined their low-mass MF with the
higher-mass results of de Grijs et al. (2002b). They found that the
IMF of NGC 1818 could be well approximated by both a Kroupa
(2001)-type broken power-law function and a lognormal distribution.
Our high-quality imaging observations were obtained with both the
Wide-Field and Planetary Camera-2 (WFPC2) and the Space Telescope
Imaging Spectrograph (STIS). WFPC2 is composed of four chips (each
containing
![]() pixels), one planetary camera (PC) and
three wide-field (WF) arrays (WF2, WF3, and WF4). The pixel size of
the PC chip is 0.0455 arcsec (with a field of view of
pixels), one planetary camera (PC) and
three wide-field (WF) arrays (WF2, WF3, and WF4). The pixel size of
the PC chip is 0.0455 arcsec (with a field of view of ![]()
![]() arcsec2) and that of each WF chip is 0.097 arcsec (with fields of view of
arcsec2) and that of each WF chip is 0.097 arcsec (with fields of view of ![]()
![]() arcsec2). The
STIS pixel size is 0.0507 arcsec and the corresponding field of view
is about
arcsec2). The
STIS pixel size is 0.0507 arcsec and the corresponding field of view
is about
![]() arcsec2.
arcsec2.
WFPC2 exposures through the F555W and F814W filters (roughly
corresponding to the Johnson-Cousins V and I bands,
respectively) were obtained with the PC chip centred on both the
clusters' half-mass radii (with a total exposure time of 2500 s in
both filters; see for more details Santiago et al. 2001; Grijs et al. 2002a). Deep STIS exposures in ACCUM imaging mode through the
F28 ![]() 50LP long-pass filter (central wavelength
50LP long-pass filter (central wavelength ![]() 7230 Å) were also obtained, centred on the clusters' half-mass
radii (with total exposure times of 2950 s for Pairs I and III, and 2890 s for Pair II; see Elson et al. 1999). To obtain ``clean'' MFs,
we had to subtract the background stellar contribution. We therefore
also obtained deep WFPC2 images from the HST Data Archive of
the general LMC background through the F555W and F814W filters, with
exposure times of 7800 and 5200 s, respectively (see Castro et al.
2001; Santiago et al. 2001; de Grijs et al. 2002a; Liu et al. 2009).
7230 Å) were also obtained, centred on the clusters' half-mass
radii (with total exposure times of 2950 s for Pairs I and III, and 2890 s for Pair II; see Elson et al. 1999). To obtain ``clean'' MFs,
we had to subtract the background stellar contribution. We therefore
also obtained deep WFPC2 images from the HST Data Archive of
the general LMC background through the F555W and F814W filters, with
exposure times of 7800 and 5200 s, respectively (see Castro et al.
2001; Santiago et al. 2001; de Grijs et al. 2002a; Liu et al. 2009).
2.2 Data reduction and photometry
We used the same method for data reduction and photometry as in Liu
et al. (2009). Aperture photometry![]() was performed on our WFPC2
and STIS images with the IRAF/APPHOT
was performed on our WFPC2
and STIS images with the IRAF/APPHOT![]() package, and 2-pixel apertures were adopted since this produced the
smallest photometric errors and the tightest cluster main sequences.
package, and 2-pixel apertures were adopted since this produced the
smallest photometric errors and the tightest cluster main sequences.
We used the relations of Whitmore et al. (1999) to correct the
resulting photometry for the time-dependent charge-transfer efficiency
effects and IRAF/STSDAS![]() to rectify the geometric
distortions of the WFPC2 chips. We subsequently applied aperture
corrections based on the model PSFs generated by TinyTim (Krist &
Hook 2001). Finally, we used the relations of Holtzman et al. (1995)
to convert the aperture-corrected F555W and F814W magnitudes to the
Johnson-Cousins V and I passbands. Figures 1 and 2 show, respectively, the resulting WFPC2-based
colour-magnitude diagrams (CMDs) of all sample clusters and the
spatial distributions of the stars in our LMC cluster fields as
observed with both WFPC2 and STIS (dots and rectangular outlines,
respectively).
to rectify the geometric
distortions of the WFPC2 chips. We subsequently applied aperture
corrections based on the model PSFs generated by TinyTim (Krist &
Hook 2001). Finally, we used the relations of Holtzman et al. (1995)
to convert the aperture-corrected F555W and F814W magnitudes to the
Johnson-Cousins V and I passbands. Figures 1 and 2 show, respectively, the resulting WFPC2-based
colour-magnitude diagrams (CMDs) of all sample clusters and the
spatial distributions of the stars in our LMC cluster fields as
observed with both WFPC2 and STIS (dots and rectangular outlines,
respectively).
![\begin{figure}
\par\includegraphics[width=7.8cm,clip]{12322fg1.ps}
\end{figure}](/articles/aa/full_html/2009/32/aa12322-09/img24.png) |
Figure 1: Colour-magnitude diagrams of our LMC clusters and the best-fitting Padova isochrones (Girardi et al. 2000). The horizontal dashed and solid lines in each panel represent the upper and lower magnitude limits, respectively, of the parameter space covered by our STIS observations. |
| Open with DEXTER | |
![\begin{figure}
\par\includegraphics[width=6.4cm,clip]{12322fg2.ps}
\end{figure}](/articles/aa/full_html/2009/32/aa12322-09/img25.png) |
Figure 2: Spatial distribution of the stars in our LMC clusters. The dots represent the stars detected in the WFPC2 observations, while the solid rectangular shapes indicate the areas covered by our STIS observations, which are used for further analysis in this paper. |
| Open with DEXTER | |
2.3 Completeness corrections and background subtraction
One of the most difficult problems we faced in deriving clean MFs
involved correcting for sampling incompleteness, which is usually a
function of position in a cluster. We used the same method as in Liu
et al. (2009), in essence a slightly modified version of the same
approach as in de Grijs et al. (2002a), who computed these
corrections in circular annuli around the cluster centres. We
computed the completeness corrections for the entire STIS chip,
because the STIS observations were centred on the low-density
half-mass radius and the effects of sampling incompleteness are
constant across our STIS field within the observational
uncertainties (e.g., de Grijs et al. 2002a; Liu et al. 2009). We
used the same method to compute the equivalent completeness
corrections for the background field. We added an area-dependent
number of artificial sources of Gaussian shape to each STIS exposure
with input magnitudes between 16.0 and 30.0 mag, in steps of 0.5 mag. We then adopted the same photometric analysis method for the
fields including both the ``real'' cluster (and background) stars and
the artificial stars, to assess how many artificial stars could be
detected after correction for blends and superpositions. For the
analysis in this paper, we only consider magnitude ranges that are
![]() 50% complete.
50% complete.
To obtain a clean MF, we must subtract the contamination by the
background field, because its stellar mass distribution is generally
different from that of the clusters (cf. Castro et al. 2001). We do
not have a background field in the STIS F28![]() 50LP passband.
Instead, we used a general WFPC2/F814W background-field observation.
However, because our STIS observations are much deeper than the
WFPC2 data, we could not directly subtract the full background
effects from the observations. Gouliermis et al. (2006a) suggest
that the stellar mass distribution in the LMC disk follows a broken
power-law distribution. We therefore adopted a power law (with slope
50LP passband.
Instead, we used a general WFPC2/F814W background-field observation.
However, because our STIS observations are much deeper than the
WFPC2 data, we could not directly subtract the full background
effects from the observations. Gouliermis et al. (2006a) suggest
that the stellar mass distribution in the LMC disk follows a broken
power-law distribution. We therefore adopted a power law (with slope
![]() ,
where the IMF,
,
where the IMF,
![]() )
to
approximate and extrapolate the stellar mass distribution in the
general LMC background down to 0.1
)
to
approximate and extrapolate the stellar mass distribution in the
general LMC background down to 0.1 ![]() (see Liu et al. 2009,
their Fig. 5).
(see Liu et al. 2009,
their Fig. 5).
In Figs. 3 and 4 we show the photometric completeness fractions and the resulting luminosity functions (LFs) for all of our sample clusters, respectively. The LFs have been fully completeness-corrected and background-subtracted. We only include magnitude bins for which the observational completeness fractions are greater than 50%.
![\begin{figure}
\par\includegraphics[width=6.4cm,clip]{12322fg3.ps}
\end{figure}](/articles/aa/full_html/2009/32/aa12322-09/img29.png) |
Figure 3: Completeness ratios of all sample clusters. The dashed lines represent the 50% completeness limits for the individual clusters. |
| Open with DEXTER | |
![\begin{figure}
\par\includegraphics[width=6.4cm,clip]{12322fg4.ps}
\end{figure}](/articles/aa/full_html/2009/32/aa12322-09/img30.png) |
Figure 4:
Completeness-corrected, background-subtracted LFs of all
sample clusters, for completeness fractions |
| Open with DEXTER | |
3 Analysis
3.1 Age, metallicity, and evolutionary models
Santiago et al. (2001), de Grijs et al. (2002b,c), and Kerber et al.
(2006) studied the MFs of our sample clusters above
![]() ,
based on WFPC2 data. Liu et al. (2009) studied the MF of NGC 1818
below 1.0
,
based on WFPC2 data. Liu et al. (2009) studied the MF of NGC 1818
below 1.0 ![]() based on STIS data. Because the STIS data are
much deeper than the WFPC2 measurements (e.g., de Grijs et al.
2002a), here we study the MFs of all six LMC clusters from HST
programme GO-7307 based on the STIS observations.
based on STIS data. Because the STIS data are
much deeper than the WFPC2 measurements (e.g., de Grijs et al.
2002a), here we study the MFs of all six LMC clusters from HST
programme GO-7307 based on the STIS observations.
The ages of our six sample clusters cover a wide range from
107-109 yr. Most of the stars below
![]() of the
clusters in the youngest of pair, NGC 1805 and NGC 1818, are still
on the PMS (Liu et al. 2009). The evolution of PMS stars is still
uncertain (Baraffe et al. 1997, 1998). White et al. (1999) concluded
that the models of Baraffe et al. (1997, 1998) resulted in the most
consistent ages and masses, on the basis of a comparison of six PMS
evolutionary model sets (Park et al. 2000). Because our STIS
observations were obtained only in a single passband, we cannot
derive the PMS ages and metallicities on the basis of CMD analysis.
However, the cluster stars from our WFPC2 and STIS observations
occupy a common locus on the CMD, so we can obtain the basic cluster
parameters by adopting Padova isochrones (Girardi et al. 2000) to
fit the faint end of the main sequence, and the Baraffe et al.
(1997, 1998) models for the sequence of low-mass stars, i.e., by
extrapolating the WFPC2 observations to fainter luminosities (see,
for details, Liu et al. 2009).
of the
clusters in the youngest of pair, NGC 1805 and NGC 1818, are still
on the PMS (Liu et al. 2009). The evolution of PMS stars is still
uncertain (Baraffe et al. 1997, 1998). White et al. (1999) concluded
that the models of Baraffe et al. (1997, 1998) resulted in the most
consistent ages and masses, on the basis of a comparison of six PMS
evolutionary model sets (Park et al. 2000). Because our STIS
observations were obtained only in a single passband, we cannot
derive the PMS ages and metallicities on the basis of CMD analysis.
However, the cluster stars from our WFPC2 and STIS observations
occupy a common locus on the CMD, so we can obtain the basic cluster
parameters by adopting Padova isochrones (Girardi et al. 2000) to
fit the faint end of the main sequence, and the Baraffe et al.
(1997, 1998) models for the sequence of low-mass stars, i.e., by
extrapolating the WFPC2 observations to fainter luminosities (see,
for details, Liu et al. 2009).
The other sample clusters are old enough for all low-mass stars to have evolved onto the main sequence, so that we can get their ages and metallicities using Padova isochrones for main-sequence fitting. The best fits and the resulting basic cluster parameters are shown in Fig. 1. We used the Padova isochrones to fit the main-sequence ridge line in the CMD with different metallicities and ages for each cluster. Next, we compared the quality of all fits and adopted the best-fitting metallicity and age for the cluster of interest. The narrow spread of the main-sequence data points will cause a small uncertainty in the age determination for each cluster, which we characterise by using the discreteness of the Padova isochrones (in steps of 0.05 dex in age) as a proxy for the age uncertainties. In fact, for each cluster the nearest isochrones to the best-fitting model provide markedly worse fits to the main-sequence turn-off location, so that we are confident that our fits are robust.
In Liu et al. (2009) we added the
![]() filter to the
Baraffe et al. (1998) model suite. These models cover a range of
metallicities, enabling us to choose the most relevant mass-luminosity
relation for conversion of the
filter to the
Baraffe et al. (1998) model suite. These models cover a range of
metallicities, enabling us to choose the most relevant mass-luminosity
relation for conversion of the
![]() magnitudes to
individual stellar masses.
magnitudes to
individual stellar masses.
A significant body of work exists in the literature to support our
choice of metallicity for the individual clusters. For NGC 1805,
Johnson et al. (2001) used HST CMDs to derive a mean [Fe/H![]() (solar metallicity), although Meliani et al. (1994) had
argued previously that the cluster's most appropriate metallicity was
Z = 0.008 (where
(solar metallicity), although Meliani et al. (1994) had
argued previously that the cluster's most appropriate metallicity was
Z = 0.008 (where
![]() ), i.e., the average metallicity
of the young LMC field population. On this basis, we adopted Z =
0.008 for this cluster, corresponding to [Fe/H
), i.e., the average metallicity
of the young LMC field population. On this basis, we adopted Z =
0.008 for this cluster, corresponding to [Fe/H
![]() (assuming a one-to-one correlation between metallicity and iron
abundance). Using solar metallicity instead, we derive an age for NGC
1805 of
(assuming a one-to-one correlation between metallicity and iron
abundance). Using solar metallicity instead, we derive an age for NGC
1805 of
![]() using Padova
isochrones. While the slopes of the resulting MFs based on either
metallicity are similar (see Fig. 5, top), the
calibration of the solar-metallicity MFs would shift to higher masses.
using Padova
isochrones. While the slopes of the resulting MFs based on either
metallicity are similar (see Fig. 5, top), the
calibration of the solar-metallicity MFs would shift to higher masses.
NGC 1818 has been the subject of several studies aimed at
determining its metallicity. Although Johnson et al. (2001) obtained
solar metallicity from HST CMD analysis, most other modern
(predominantly spectroscopic) determinations centre on either [Fe/H
![]() (e.g., Jasniewicz & Thévenin 1994; Bonatto et al. 1995) or [Fe/H
(e.g., Jasniewicz & Thévenin 1994; Bonatto et al. 1995) or [Fe/H
![]() ,
roughly corresponding to Z=0.003(e.g., Meliani et al. 1994; Will et al. 1995; Oliva & Origlia
1998). The MF slopes based on a metallicity of Z=0.008 are steeper
than for Z=0.004 (the lowest metallicity isochrone available for
the cluster's young age
,
roughly corresponding to Z=0.003(e.g., Meliani et al. 1994; Will et al. 1995; Oliva & Origlia
1998). The MF slopes based on a metallicity of Z=0.008 are steeper
than for Z=0.004 (the lowest metallicity isochrone available for
the cluster's young age![]() ) (see Fig. 5, bottom), although they are both in good agreement
with the Kroupa (2001) IMF slope
) (see Fig. 5, bottom), although they are both in good agreement
with the Kroupa (2001) IMF slope
![]() .
.
The most recent metallicity estimates for NGC 1831 converge to [Fe/H
![]() (Bonatto et al. 1995, based on UV spectroscopy), while
Vallenari et al. (1992) similarly suggested a best estimate of Z =
0.008 based on their analysis of the literature on this cluster at
the time of their publication, but see Mateo et al. (1987) and
Olszewski et al. (1988, 1991) for close-to-solar abundance
estimates. Given the current observational status for this cluster, we
adopted Z = 0.008 as a compromise.
(Bonatto et al. 1995, based on UV spectroscopy), while
Vallenari et al. (1992) similarly suggested a best estimate of Z =
0.008 based on their analysis of the literature on this cluster at
the time of their publication, but see Mateo et al. (1987) and
Olszewski et al. (1988, 1991) for close-to-solar abundance
estimates. Given the current observational status for this cluster, we
adopted Z = 0.008 as a compromise.
Both NGC 1868 and Hodge 14 are somewhat more metal-poor than the
younger clusters in our sample. For NGC 1868, Bica et al. (1986)
reported [Fe/H
![]() ,
consistent with Olszewski et al.'s
(1991) spectroscopic metallicity determination, [Fe/H]= -0.50.
Similarly, Jensen et al. (1988) and Olszewski et al. (1991) used
spectroscopy of Hodge 14 to obtain [Fe/H
,
consistent with Olszewski et al.'s
(1991) spectroscopic metallicity determination, [Fe/H]= -0.50.
Similarly, Jensen et al. (1988) and Olszewski et al. (1991) used
spectroscopy of Hodge 14 to obtain [Fe/H
![]() .
For both
clusters we adopted Z = 0.004, corresponding to [Fe/H]= -0.68.
.
For both
clusters we adopted Z = 0.004, corresponding to [Fe/H]= -0.68.
Finally, NGC 2209 is the lowest-metallicity cluster in our sample,
with [Fe/H
![]() (Bica et al. 1986; see also Chiosi et al. 1986; Dottori et al. 1987; Frogel et al. 1990). Based on a
careful analysis of the goodness-of-fit parameters for the range of
metallicities provides by the Padova isochrones, we adopted Z =
0.004 ([Fe/H]= -0.68) for NGC 2209, because its CMD is much more
poorly approximated for [Fe/H]=-0.9.
(Bica et al. 1986; see also Chiosi et al. 1986; Dottori et al. 1987; Frogel et al. 1990). Based on a
careful analysis of the goodness-of-fit parameters for the range of
metallicities provides by the Padova isochrones, we adopted Z =
0.004 ([Fe/H]= -0.68) for NGC 2209, because its CMD is much more
poorly approximated for [Fe/H]=-0.9.
Metallicity does not play an important role in our analysis of the MF slopes. The models of Baraffe et al. (1997, 1998) for different metallicities yield similar main sequences at low mass.
3.2 Mass functions
We adopted the same method as Liu et al. (2009) to derive the MFs of
the clusters of pair I. Although the age of NGC 1805 and NGC 1818 is
![]() ,
many low-mass stars are still on the
PMS. The ages of the PMS stars in both clusters are about
,
many low-mass stars are still on the
PMS. The ages of the PMS stars in both clusters are about
![]() (Liu et al. 2009). All stars in the
clusters of pairs II and III have already evolved onto the main
sequence.
(Liu et al. 2009). All stars in the
clusters of pairs II and III have already evolved onto the main
sequence.
![\begin{figure}
\par\includegraphics[width=7.5cm,clip]{12322fg5-1.ps}\vspace*{2mm}
\includegraphics[width=7.5cm,clip]{12322fg5-2.ps}
\end{figure}](/articles/aa/full_html/2009/32/aa12322-09/img48.png) |
Figure 5: Low-mass cluster MFs for Pair I, NGC 1805 and NGC 1818. |
| Open with DEXTER | |
![\begin{figure}
\par\includegraphics[width=7.5cm,clip]{12322fg6-1.ps}\par\vspace*{2mm}
\includegraphics[width=7.5cm,clip]{12322fg6-2.ps}
\end{figure}](/articles/aa/full_html/2009/32/aa12322-09/img49.png) |
Figure 6: Low-mass cluster MFs for Pair II, NGC 1831 and NGC 1868. |
| Open with DEXTER | |
Several studies explored the effects of mass segregation in these
clusters (based on the same WFPC2 observations used here) by
dividing the full field of view into a number of smaller areas at a
range of distances from the cluster centres (e.g., Santiago et al.
2001; de Grijs et al. 2002a-c; Kerber et al. 2006). However, our
STIS observations were taken at the half-mass radii of our sample
clusters and the STIS field is much smaller than that of the
combined set of WFPC2 observations, so we limited our analysis to
both the entire STIS region and areas at two different radii.
Figures 5-7 show
the cluster MFs of (and best fits to) different pairs for stellar
masses below
![]() ,
both for the full STIS field and for
areas limited by radial range. The results were corrected for sample
incompleteness and background contamination. In Liu et al. (2009) we
combined the NGC 1818 MFs from WFPC2 and STIS. Using WFPC2, we
detected more stars than on the basis of our STIS data for some mass
ranges, so the slope of the MF in Liu et al. (2009),
,
both for the full STIS field and for
areas limited by radial range. The results were corrected for sample
incompleteness and background contamination. In Liu et al. (2009) we
combined the NGC 1818 MFs from WFPC2 and STIS. Using WFPC2, we
detected more stars than on the basis of our STIS data for some mass
ranges, so the slope of the MF in Liu et al. (2009),
![]() ,
is steeper than the slope obtained here
(
,
is steeper than the slope obtained here
(
![]() ). However, they both agree with that of the
Kroupa (2001) IMF,
). However, they both agree with that of the
Kroupa (2001) IMF,
![]() ,
within the uncertainties.
,
within the uncertainties.
The MFs of NGC 1805, NGC 1818, and NGC 1868 show the same trend, as do the MFs of NGC 1831, NGC 2209, and Hodge 14. Figure 6 shows the change in trend most clearly for our intermediate-age cluster pair. Because NGC 1868 is much more compact than NGC 1831, its dynamical age is much older. This implies that it will be much more evolved dynamically than NGC 1831, resulting in a turnover at much lower masses (outside of our observational range). Similarly, NGC 2209 and Hodge 14 are an order of magnitude older (from both a stellar evolution and a dynamical point of view) than the Pair II clusters, exhibiting declining MFs in the mass range of interest here (see Fig. 7).
![\begin{figure}
\par\includegraphics[width=7.5cm,clip]{12322fg7-1.ps}\par\vspace*{2mm}
\includegraphics[width=7.5cm,clip]{12322fg7-2.ps}
\end{figure}](/articles/aa/full_html/2009/32/aa12322-09/img53.png) |
Figure 7: Low-mass cluster MFs for Pair III, NGC 2209 and Hodge 14. |
| Open with DEXTER | |
We obtained all cluster MFs based only on single stars, neglecting unresolved binary and other multiple stars. As discussed in Liu et al. (2009), Kerber et al. (2006) analysed the effect of binarity on cluster MFs. They found that MFs with binary fractions of unity and 0% are identical within the observational uncertainties (cf. Liu et al. 2009 for NGC 1818), so that we can justifiably ignore the effects of binarity in the context of the low-mass system MFs derived in this paper (and in Liu et al. 2009).
4 Discussion
Owing to both the large distances involved and observational
limitations, it is difficult to obtain deep stellar MFs in
extragalactic environments. Kroupa (2001) studied the
solar-neighbourhood IMF down to ![]()
![]() and reported his
often-quoted broken power-law distribution. Paresce et al. (2000)
analysed the MFs of a dozen Galactic GCs down to
and reported his
often-quoted broken power-law distribution. Paresce et al. (2000)
analysed the MFs of a dozen Galactic GCs down to
![]() and
derived a lognormal distribution below
and
derived a lognormal distribution below
![]() .
Much effort
has also focussed on studying stellar MFs in the LMC (e.g., Will et al. 1995; de Grijs et al. 2002b; Gouliermis et al. 2006a,b; Kerber et al. 2006; Da Rio et al. 2009). Recently, the LH 95 IMF obtained by Da Rio et al. (2009) reached down to
.
Much effort
has also focussed on studying stellar MFs in the LMC (e.g., Will et al. 1995; de Grijs et al. 2002b; Gouliermis et al. 2006a,b; Kerber et al. 2006; Da Rio et al. 2009). Recently, the LH 95 IMF obtained by Da Rio et al. (2009) reached down to
![]() ,
i.e., much deeper
than achieved previously beyond the Milky Way. Chiosi et al. (2007)
studied the MFs of young SMC clusters down to
,
i.e., much deeper
than achieved previously beyond the Milky Way. Chiosi et al. (2007)
studied the MFs of young SMC clusters down to
![]() .
In Liu
et al. (2009), we probed - for the first time - the stellar MF in an
extragalactic, low-metallicity environment down to
.
In Liu
et al. (2009), we probed - for the first time - the stellar MF in an
extragalactic, low-metallicity environment down to
![]() .
In this paper, we applied the method of Liu et al. (2009)
to all of our sample clusters, aimed at assessing the evolution (if
any) of the low-mass MF.
.
In this paper, we applied the method of Liu et al. (2009)
to all of our sample clusters, aimed at assessing the evolution (if
any) of the low-mass MF.
Santiago et al. (2001), de Grijs et al. (2002c), and Kerber et al.
(2006) studied the stellar MFs above
![]() at different
radii in these same clusters. They find that the slopes at different
radii were significantly different, because significant degrees of
mass segregation affect the PDMF shape. de Grijs et al. (2002b)
studied the NGC 1805 and NGC 1818 MFs above
at different
radii in these same clusters. They find that the slopes at different
radii were significantly different, because significant degrees of
mass segregation affect the PDMF shape. de Grijs et al. (2002b)
studied the NGC 1805 and NGC 1818 MFs above
![]() .
They
find that the cluster MFs followed the Salpeter (1955) IMF quite
closely. de Grijs et al. (2002c) studied the LFs of all sample
clusters and concluded that the PDMFs of the clusters in each pair
must be very similar.
.
They
find that the cluster MFs followed the Salpeter (1955) IMF quite
closely. de Grijs et al. (2002c) studied the LFs of all sample
clusters and concluded that the PDMFs of the clusters in each pair
must be very similar.
The relaxation time at the half-mass radius of compact star clusters
can be written as (Meylan 1987)
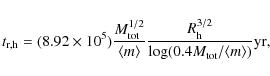
where
![\begin{figure}
\par\includegraphics[width=6.7cm,clip]{12322fg8-1.ps}\par\vspace*...
...par\vspace*{2mm}
\includegraphics[width=6.7cm,clip]{12322fg8-3.ps}
\end{figure}](/articles/aa/full_html/2009/32/aa12322-09/img61.png) |
Figure 8:
Full MFs of the sample clusters arranged by pair. All open
points are from this paper, based on STIS observations, while the
solid points are from de Grijs et al. (2002c), based on WFPC2
observations. The dashed line represents a broken power-law IMF,
adopting the Kroupa (2001) high- and low-mass slopes, and the solid
curve shows the original Chabrier (2003) lognormal distribution,
defined below
|
| Open with DEXTER | |
Table 2: Mass functions.
Based on the structural parameters of all clusters in Table 1 and their half-mass radii based on the WFPC2 and
STIS observations, we calculated the relaxation times of the other
clusters in pairs II and III for stellar masses below
![]() .
These timescales are >2.0, 0.4, 3.9, and 0.52 Gyr for
NGC 1831, NGC 1868, NGC 2209, and Hodge 14, respectively, although
dynamical evolution in the cluster core may proceed much faster.
Elson et al. (1987) calculated the relaxation time in the core and
at the half-mass radius of NGC 1818 as
.
These timescales are >2.0, 0.4, 3.9, and 0.52 Gyr for
NGC 1831, NGC 1868, NGC 2209, and Hodge 14, respectively, although
dynamical evolution in the cluster core may proceed much faster.
Elson et al. (1987) calculated the relaxation time in the core and
at the half-mass radius of NGC 1818 as
![]() and
and
![]() (where the age
range signifies the uncertainties due to the uncertain mass-to-light
ratio). For NGC 1831 the equivalent timescales were found to be
(where the age
range signifies the uncertainties due to the uncertain mass-to-light
ratio). For NGC 1831 the equivalent timescales were found to be
![]() and
and
![]() .
Compared to the clusters' ages (see Table 1), this
implies that both clusters have undergone little or no significant
dynamical evolution overall.
.
Compared to the clusters' ages (see Table 1), this
implies that both clusters have undergone little or no significant
dynamical evolution overall.
From Figs. 5-7 we
conclude that the MF slopes for the entire STIS field of view and
for smaller areas at different radii are identical within the
uncertainties for a given cluster. There may be two reasons for this
behaviour: (i) dynamical cluster evolution does not affect the MFs
severely below
![]() beyond the core region, although the
relaxation times are shorter than their ages, at least for some
clusters; or (ii) the STIS field is fairly small, which prevents us
from detecting any differences in the MFs below
beyond the core region, although the
relaxation times are shorter than their ages, at least for some
clusters; or (ii) the STIS field is fairly small, which prevents us
from detecting any differences in the MFs below
![]() beyond the crowded centres.
beyond the crowded centres.
Because of the uniformity of the MFs derived from the full STIS
field and from smaller areas at different radii, we compare the MFs
of the clusters in each pair in Fig. 8 using the full STIS
fields only![]() . In Liu et al. (2009), we adopted both broken
power-law and lognormal distributions to fit the NGC 1818 MFs.
Recent work supports this method (e.g., Covey et al. 2008; Oliveira
et al. 2009). In this paper, however, it has become clear that not
all cluster MFs below
. In Liu et al. (2009), we adopted both broken
power-law and lognormal distributions to fit the NGC 1818 MFs.
Recent work supports this method (e.g., Covey et al. 2008; Oliveira
et al. 2009). In this paper, however, it has become clear that not
all cluster MFs below
![]() show an obvious turnover.
Therefore, we adopted power laws to fit all cluster MFs below
show an obvious turnover.
Therefore, we adopted power laws to fit all cluster MFs below
![]() .
We include the relevant parameters, including those for
the standard Kroupa (2001) IMF, in Table 3. The MF of NGC 1805 shows the same result as for NGC 1818 in Liu et al. (2009);
i.e., their slopes are identical to the Kroupa (2001) IMF within the
uncertainties, although the applicable mass ranges extend to higher
masses than the relevant Kroupa (2001) slope (likely due to
statistical fluctuations; cf. Liu et al. 2009). NGC 1868 exhibits a
broken power-law distribution similar to the Kroupa (2001) IMF and
the complete IMFs of NGC 1805 and NGC 1818 (de Grijs et al. 2002b;
Liu et al. 2009). The MF of NGC 1831 does not show a turnover, but
its slope in the mass range from 0.54 to
.
We include the relevant parameters, including those for
the standard Kroupa (2001) IMF, in Table 3. The MF of NGC 1805 shows the same result as for NGC 1818 in Liu et al. (2009);
i.e., their slopes are identical to the Kroupa (2001) IMF within the
uncertainties, although the applicable mass ranges extend to higher
masses than the relevant Kroupa (2001) slope (likely due to
statistical fluctuations; cf. Liu et al. 2009). NGC 1868 exhibits a
broken power-law distribution similar to the Kroupa (2001) IMF and
the complete IMFs of NGC 1805 and NGC 1818 (de Grijs et al. 2002b;
Liu et al. 2009). The MF of NGC 1831 does not show a turnover, but
its slope in the mass range from 0.54 to
![]() is
identical to that of the Kroupa (2001) IMF for masses between 0.5 and
is
identical to that of the Kroupa (2001) IMF for masses between 0.5 and
![]() ,
again within the uncertainties. The MF slopes
of NGC 2209 and Hodge 14 are also identical to those of the Kroupa
(2001) IMF below
,
again within the uncertainties. The MF slopes
of NGC 2209 and Hodge 14 are also identical to those of the Kroupa
(2001) IMF below
![]() .
.
In this paper, we extended our previous work (Liu et al. 2009) to all
LMC sample clusters. The MFs of the clusters in each pair exhibit
identical slopes, and they are all also identical to the standard
Kroupa (2001) IMF below
![]() ,
independent of metallicity,
particularly for the clusters in pair I (de Grijs et al. 2002b; Liu et al. 2009) and NGC 1868 in pair II (this paper). de Grijs et al. (2002c) studied the LFs of all sample clusters above
,
independent of metallicity,
particularly for the clusters in pair I (de Grijs et al. 2002b; Liu et al. 2009) and NGC 1868 in pair II (this paper). de Grijs et al. (2002c) studied the LFs of all sample clusters above
![]() .
We converted the LFs to MFs based on the Padova isochrones
for the appropriate metallicities and combine both of our results to
obtain complete PDMFs for all sample clusters (see Fig. 8
and Table 2). All MFs are similar to the standard Kroupa
(2001) IMF, and the MFs of NGC 1831, NGC 2209, and Hodge 14 also match
the Chabrier (2003) lognormal distribution, at least qualitatively
although not in detail (as shown by the solid lines in the individual
panels).
.
We converted the LFs to MFs based on the Padova isochrones
for the appropriate metallicities and combine both of our results to
obtain complete PDMFs for all sample clusters (see Fig. 8
and Table 2). All MFs are similar to the standard Kroupa
(2001) IMF, and the MFs of NGC 1831, NGC 2209, and Hodge 14 also match
the Chabrier (2003) lognormal distribution, at least qualitatively
although not in detail (as shown by the solid lines in the individual
panels).
Table 3: Mass function slopes.
5 Summary and conclusions
We extended our pilot study in Liu et al. (2009) and used deep HST/STIS photometry of a carefully selected sample of rich, compact
clusters in the LMC to derive their stellar MFs for masses below
![]() ,
which we combined with the MFs of de Grijs et al.
(2002c) above
,
which we combined with the MFs of de Grijs et al.
(2002c) above
![]() to obtain complete MFs for all sample
clusters. To our knowledge, this is the first time, along with Liu
et al. (2009), that anyone has probed stellar (cluster) MFs to this
depth in an extragalactic, low-metallicity environment. Based on our
STIS observations, the MFs of our compact clusters are all identical
to the standard Kroupa (2001) IMF below
to obtain complete MFs for all sample
clusters. To our knowledge, this is the first time, along with Liu
et al. (2009), that anyone has probed stellar (cluster) MFs to this
depth in an extragalactic, low-metallicity environment. Based on our
STIS observations, the MFs of our compact clusters are all identical
to the standard Kroupa (2001) IMF below
![]() ,
within the
uncertainties.
,
within the
uncertainties.
The observations were taken beyond the crowded cluster cores and only
included stars at the half-mass radii. In addition, the relaxation
timescales of low-mass stars are much longer than the equivalent
periods for high-mass stars, so that dynamical evolution will not have
affected the younger clusters' stellar mass distributions below
![]() noticeably. We have therefore provided unprecedented
insights into the IMF in a low-density and low-metallicity
extragalactic environment.
noticeably. We have therefore provided unprecedented
insights into the IMF in a low-density and low-metallicity
extragalactic environment.
Acknowledgements
This work was supported by the National Natural Science Foundation of China under grant No. 10573022 and by the Ministry of Science and Technology of China under grant No. 2007CB815406. RdG acknowledges partial financial support from the Royal Society in the form of a UK-China International Joint Project. We thank Isabelle Baraffe for advice and discussions in earlier stages of this project. This paper is based on archival observationswith the NASA/ESA Hubble Space Telescope, obtained at the Space Telescope Science Institute, which is operated by the Association of Universities for Research in Astronomy, Inc., under NASA contract NAS 5-26555. This research has made use of NASA's Astrophysics Data System Abstract Service.
References
- Andersen, M., Meyer, M. R., Greissl, J., & Aversa, A. 2008, ApJ, 683, L183 [NASA ADS] [CrossRef] (In the text)
- Baraffe, I., Chabrier, G., Allard, F., & Hauschildt, P. H. 1997, A&A, 327, 1054 [NASA ADS] (In the text)
- Baraffe, I., Chabrier, G., Allard, F., & Hauschildt, P. H. 1998, A&A, 337, 403 [NASA ADS] (In the text)
- Beaulieu, S. F, Elson, R. A. W., Gilmore, G. F., et al. 1999, in: New Views of the Magellanic Clouds, ed. Y.-H. Chu, N. Suntzeff, J. Hesser, & D. Bohlender (ASP: San Francisco), IAU Symp., 190, 460 (In the text)
- Bica, E., Dottori, H., & Pastoriza, M. 1986, A&A, 156, 261 [NASA ADS] (In the text)
- Bica, E., Clariá, J. J., Dottori, H., Santos, J. F. C., & Piatti, A. E. 1996, ApJS, 102, 57 [NASA ADS] [CrossRef]
- Bonatto, C., Bica, E., & Alloin, D. 1995, A&AS, 112, 71 [NASA ADS] (In the text)
- Castro, R., Santiago, B. X., Gilmore, G. F., Beaulieu, S., & Johnson, R. A. 2001, MNRAS, 326, 333 [NASA ADS] [CrossRef] (In the text)
- Chabrier, G. 2003, PASP, 115, 763 [NASA ADS] [CrossRef] (In the text)
- Chiosi, E., & Vallenari, A. 2007, A&A, 466, 165 [NASA ADS] [CrossRef] [EDP Sciences] (In the text)
- Chiosi, C., Bertelli, G., Bressan, A., & Nasi, E. 1986, A&A, 165, 84 [NASA ADS] (In the text)
- Covey, K. R., Hawley, S. L., Bochanski, J. J., et al. 2008, AJ, 136, 1778 [NASA ADS] [CrossRef] (In the text)
- Da Rio, N., Gouliermis, D., & Henning, T. 2009, ApJ, 696, 528 [NASA ADS] [CrossRef] (In the text)
- de Grijs, R., Johnson, R. A., Gilmore, G. F., & Frayn, C. M. 2002a, MNRAS, 331, 228 [NASA ADS] [CrossRef] (In the text)
- de Grijs, R., Gilmore, G. F., Johnson, R. A., & Mackey, A. D. 2002b, MNRAS, 331, 245 [NASA ADS] [CrossRef] (In the text)
- de Grijs, R., Gilmore, G. F., Mackey, A. D., et al. 2002c, MNRAS, 337, 597 [NASA ADS] [CrossRef] (In the text)
- Gilmore, G. F., & Johnson, R. A. 2003, in: The Local Group as an Astrophysical Laboratory, STScI Symp., ed. M. Livio, & T. M. Brown, STScI: Baltimore, 20 [arXiv:astro-ph/0305262]
- Dottori, H., Melnick, J., & Bica, E. 1987, RMxAA, 14, 183 [NASA ADS] (In the text)
- Elson, R. A. W., Fall, S. M., & Freeman, K. C. 1987, ApJ, 323, 54 [NASA ADS] [CrossRef] (In the text)
- Elson, R., Sigurdsson, S., Davies, M., Hurley, J., & Gilmore, G. 1998, MNRAS, 300, 857 [NASA ADS] [CrossRef] (In the text)
- Elson, R., Tanvir, N., Gilmore, G., Johnson, R. A., & Beaulieu, S. 1999, in: New Views of the Magellanic Clouds, ed. Y.-H. Chu, N. Suntzeff, J. Hesser, & D. Bohlender (ASP: San Francisco), IAU Symp., 190, 417 (In the text)
- Frogel, J. A., Mould, J., & Blanco, V. M. 1990, ApJ, 352, 96 [NASA ADS] [CrossRef] (In the text)
- Girardi, L., Bressan, A., Bertelli, G., & Chiosi, C. 2000, A&AS, 141, 371 [NASA ADS] [CrossRef] [EDP Sciences] (In the text)
- Gouliermis, D., Brandner, W., & Henning, Th. 2006a, ApJ, 641, 838 [NASA ADS] [CrossRef] (In the text)
- Gouliermis, D., Brandner, W., & Henning, Th. 2006b, ApJ, 636, L133 [NASA ADS] [CrossRef]
- Holtzman, J. A., Burrows, C. J., Casertano, S., et al. 1995, PASP, 107, 1065 [NASA ADS] [CrossRef] (In the text)
- Jasniewicz, G., & Thévenin, F. 1994, A&A, 282, 717 [NASA ADS] (In the text)
- Jensen, J., Mould, J. R., & Reid, I. N. 1988, ApJS, 67, 77 [NASA ADS] [CrossRef] (In the text)
- Johnson, R. A., Beaulieu, S. F., Gilmore, G. F., et al. 2001, MNRAS, 324, 367 [NASA ADS] [CrossRef] (In the text)
- Kerber, L. O., & Santiago, B. X. 2006, A&A, 452,155 (In the text)
- Krist, J., & Hook, R. 2001, The Tiny Tim User's Guide, Version 6.0 (http://www.stsci.edu/software/tinytim/) (In the text)
- Kroupa, P. 2001, MNRAS, 322, 231 [NASA ADS] [CrossRef] (In the text)
- Liu, Q., de Grijs, R., Deng, L. C., et al. 2009, MNRAS, in press [arXiv:0903.4787] (In the text)
- Mackey, A. D., & Gilmore, G. F. 2003, MNRAS, 338, 85 [NASA ADS] [CrossRef]
- Mateo, M., & Hodge, P. 1987, ApJ, 320, 626 [NASA ADS] [CrossRef] (In the text)
- Meliani, M. T., Barbuy, B., & Richtler, T. 1994, A&A, 290, 753 [NASA ADS] (In the text)
- Meurer, G. R., Cacciari, C., & Freeman, K. C. 1990, AJ, 99, 1124 [NASA ADS] [CrossRef]
- Meylan, G. 1987, A&A, 184, 144 [NASA ADS] (In the text)
- Oliva, E., & Origlia, L. 1998, A&A, 332, 46 [NASA ADS] (In the text)
- Oliveira, J. M., Jeffries, R. D., & van Loon, J. T. 2009, MNRAS, 392, 1034 [NASA ADS] [CrossRef] (In the text)
- Olszewski, E. W., Harris, H. C., Schommer, R. A., & Canterna, R. W. 1988, AJ, 95, 84 [NASA ADS] [CrossRef] (In the text)
- Olszewski, E. W., Schommer, R. A., Suntzeff, N. B., & Harris, H. C. 1991, AJ, 101, 515 [NASA ADS] [CrossRef] (In the text)
- Paresce, F., & De Marchi, G. 2000, ApJ, 534, 870 [NASA ADS] [CrossRef] (In the text)
- Park, B., Sung, H., Bessell, M., & Kang, Y. 2000, AJ, 120, 894 [NASA ADS] [CrossRef] (In the text)
- Salpeter, E. E. 1955, AJ, 101, 1865 (In the text)
- Santiago, B. X., Beaulieu, S., Johnson, R., & Gilmore, G. F. 2001, A&A, 369, 74 [NASA ADS] [CrossRef] [EDP Sciences] (In the text)
- Vallenari, A., Chiosi, C., Bertelli, G., Meylan, G., & Ortolani, S. 1992, AJ, 104, 1100 [NASA ADS] [CrossRef] (In the text)
- Westerlund, B. E. 1990, A&AR, 2, 29 [NASA ADS]
- White, R. J., Ghez, A. M., Reid, I. N., & Schultz, G. 1999, ApJ, 520, 811 [NASA ADS] [CrossRef] (In the text)
- Whitmore, B., Heyer, I., & Casertano, S. 1999, PASP, 111, 1559 [NASA ADS] [CrossRef] (In the text)
- Will, J. M., Bomans, D. J., & de Boer, K. S. 1995, A&A, 295, 54 [NASA ADS] (In the text)
Footnotes
- ... Cloud
- Photometry Table is only available in electronic form at the CDS via anonymous ftp to cdsarc.u-strasbg.fr (130.79.128.5) or via http://cdsweb.u-strasbg.fr/cgi-bin/qcat?J/A+A/503/469
- ... photometry
- See Liu et al. (2009) for a discussion of the pros and cons of using aperture photometry versus point-spread function fitting.
- ... IRAF/APPHOT
- The Image Reduction and Analysis Facility (IRAF) is distributed by the National Optical Astronomy Observatories, which is operated by the Association of Universities for Research in Astronomy, Inc., under cooperative agreement with the US National Science Foundation.
- ... IRAF/STSDAS
- S TSDAS, the Space Telescope Science Data Analysis System, contains tasks complementary to the existing IRAF tasks. Version 3.1 was adopted for the data reduction performed in this paper.
- ... age
- Although the Padova models include
isochrones for Z=0.001, they are only provided for ages in excess
of
 .
Use of the Z=0.004 isochrone results
in a cluster age of
.
Use of the Z=0.004 isochrone results
in a cluster age of
 .
For the
low-mass PMS stars, we use Z = 0.003 and
.
For the
low-mass PMS stars, we use Z = 0.003 and
 based on the Baraffe et al. (1997, 1998) models.
- ... only
- Note that the gap in stellar masses for NGC 2209 between the STIS and WFPC2-based MFs is caused by incompleteness differences between both sets of observations, and does not necessarily reflect a true lack of intermediate-mass stars in the cluster.
All Tables
Table 1: Fundamental parameters of our LMC cluster sample.
Table 2: Mass functions.
Table 3: Mass function slopes.
All Figures
| |
Figure 1: Colour-magnitude diagrams of our LMC clusters and the best-fitting Padova isochrones (Girardi et al. 2000). The horizontal dashed and solid lines in each panel represent the upper and lower magnitude limits, respectively, of the parameter space covered by our STIS observations. |
| Open with DEXTER | |
| In the text | |
| |
Figure 2: Spatial distribution of the stars in our LMC clusters. The dots represent the stars detected in the WFPC2 observations, while the solid rectangular shapes indicate the areas covered by our STIS observations, which are used for further analysis in this paper. |
| Open with DEXTER | |
| In the text | |
| |
Figure 3: Completeness ratios of all sample clusters. The dashed lines represent the 50% completeness limits for the individual clusters. |
| Open with DEXTER | |
| In the text | |
| |
Figure 4:
Completeness-corrected, background-subtracted LFs of all
sample clusters, for completeness fractions |
| Open with DEXTER | |
| In the text | |
| |
Figure 5: Low-mass cluster MFs for Pair I, NGC 1805 and NGC 1818. |
| Open with DEXTER | |
| In the text | |
| |
Figure 6: Low-mass cluster MFs for Pair II, NGC 1831 and NGC 1868. |
| Open with DEXTER | |
| In the text | |
| |
Figure 7: Low-mass cluster MFs for Pair III, NGC 2209 and Hodge 14. |
| Open with DEXTER | |
| In the text | |
| |
Figure 8:
Full MFs of the sample clusters arranged by pair. All open
points are from this paper, based on STIS observations, while the
solid points are from de Grijs et al. (2002c), based on WFPC2
observations. The dashed line represents a broken power-law IMF,
adopting the Kroupa (2001) high- and low-mass slopes, and the solid
curve shows the original Chabrier (2003) lognormal distribution,
defined below
|
| Open with DEXTER | |
| In the text | |
Copyright ESO 2009
Current usage metrics show cumulative count of Article Views (full-text article views including HTML views, PDF and ePub downloads, according to the available data) and Abstracts Views on Vision4Press platform.
Data correspond to usage on the plateform after 2015. The current usage metrics is available 48-96 hours after online publication and is updated daily on week days.
Initial download of the metrics may take a while.