| Issue |
A&A
Volume 502, Number 2, August I 2009
|
|
|---|---|---|
| Page(s) | 505 - 514 | |
| Section | Extragalactic astronomy | |
| DOI | https://doi.org/10.1051/0004-6361/200811465 | |
| Published online | 15 June 2009 | |
Properties of RR Lyrae stars in the inner regions of the Large Magellanic Cloud![[*]](/icons/foot_motif.png)
III. Near-infrared study
J. Borissova1 - M. Rejkuba2 - D. Minniti3,7 - M. Catelan3,4,5 - V. D. Ivanov6
1 - Departamento de Física y Astronomía, Facultad de Ciencias, Universidad de Valparaíso, Ave. Gran Bretaña 1111, Playa Ancha, Casilla 53, Valparaíso, Chile
2 -
European Southern Observatory, Karl-Schwarzschild-Str. 2, 85748 Garching b. München, Germany
3 -
Department of Astronomy, Pontificia Universidad Católica de Chile, Av. Vicuña Mackenna 4860, 782-0436 Macul, Santiago, Chile
4 -
John Simon Guggenheim Memorial Foundation Fellow
5 -
On sabbatical leave at Catholic University of America, Department of Physics, 200 Hannan Hall, Washington, DC 20064, USA
6 -
European Southern Observatory, Av. Alonso de Córdoba 3107, Casilla 19, Santiago 19001, Chile
7 -
Vatican Observatory, V00120 Vatican City State, Italy
Received 3 December 2008 / Accepted 21 April 2009
Abstract
Context. RR Lyrae variable stars are the primary Population II distance indicator. Likewise, the Large Magellanic Cloud (LMC) constitutes a key step in the extragalactic distance scale.
Aims. By combining near-IR photometry and spectroscopically measured metallicities for a homogeneous sample of 50 RR Lyr stars in the LMC, we investigate the metallicity dependence of the period-luminosity relation in the near-infrared (IR), use the newly derived relations to re-derive the distance to the LMC, and compare the distance moduli obtained from RR Lyr and red clump stars.
Methods. This paper presents new (single-epoch) J-band and (multi-epoch) ![]() -band photometry of RR Lyr stars in 7 different LMC fields, observed with the near-IR camera SOFI at ESO's New Technology Telescope. Additional
-band photometry of RR Lyr stars in 7 different LMC fields, observed with the near-IR camera SOFI at ESO's New Technology Telescope. Additional ![]() -band data for another two LMC fields were taken with the ISPI infrared array at CTIO's Blanco 4m telescope. The near-IR photometry was cross-correlated with the MACHO and OGLE databases, resulting in a catalog of 62 RR Lyr stars with
-band data for another two LMC fields were taken with the ISPI infrared array at CTIO's Blanco 4m telescope. The near-IR photometry was cross-correlated with the MACHO and OGLE databases, resulting in a catalog of 62 RR Lyr stars with
![]() photometry. A subsample of 50 stars also has spectroscopically measured metallicities.
photometry. A subsample of 50 stars also has spectroscopically measured metallicities.
Results. In the deep JK color-magnitude diagrams of 7 fields, red giant branch, red clump and RR Lyr stars are detected. The majority of RR Lyr stars are located within the instability strip with near-IR colors between
![]() .
The period-luminosity relation only has a very mild dependence on metallicity in the K band, consistent with no dependence:
.
The period-luminosity relation only has a very mild dependence on metallicity in the K band, consistent with no dependence:
![]() In the J band the currently available data do not allow firm conclusions regarding the metallicity dependence of the period-luminosity relation.
In the J band the currently available data do not allow firm conclusions regarding the metallicity dependence of the period-luminosity relation.
Conclusions. The distance modulus of the LMC, derived using our near-IR period-luminosity-metallicity relation for RR Lyr stars, is
![]() ,
in very good agreement with the distance modulus from the red clump stars,
,
in very good agreement with the distance modulus from the red clump stars,
![]() .
However, LMC modulus derived from the RR Lyrae stars depends on the parallax of the star RR Lyrae.
.
However, LMC modulus derived from the RR Lyrae stars depends on the parallax of the star RR Lyrae.
Key words: Galaxies: Magellanic Clouds - stars: variables: RR Lyr - galaxies: distances and redshifts - stars: oscillations
1 Introduction
The RR Lyrae star period-near infrared K-band luminosity (PLK) relation is a promising tool for deriving distances in the Milky Way and Local Group of galaxies. Accordingly, considerable attention has been devoted to this subject over the past several years, with several papers recently published on its accurate determination, by both empirical and theoretical approaches (e.g., Del Principe et al. 2006; Solima et al. 2006, 2008; Feast et al. 2008; Pietrzynski et al. 2008; Szewczyk et al. 2008). From the theoretical point of view, its properties have been investigated by Bono et al. (2001, 2003), Cassisi et al. (2004), and Catelan et al. (2004).
Several authors (e.g., Jones et al. 1992; Carney et al. 1992;
Skillen et al. 1993; Nemec et al. 1994; Frolov & Samus 1998)
have previously calibrated the PLK relation on the basis of observations
of Galactic globular clusters and field RR Lyrae stars in our Galaxy.
Such studies are summarized in
Table 2 of Sollima et al. (2006b), who also
analyzed 538 RR Lyrae variables in 16 globular clusters using infrared
(K-band) photometry and derived a PLK relation based on purely observational
constraints. Very recently, Szewczyk et al. (2008) have
reported J, ![]() magnitudes of 65 RR Lyrae stars and,
using different theoretical and empirical calibrations of the
period-luminosity-metallicity relation, computed a distance modulus
for the LMC.
magnitudes of 65 RR Lyrae stars and,
using different theoretical and empirical calibrations of the
period-luminosity-metallicity relation, computed a distance modulus
for the LMC.
However, a large sample of accurate near-IR J- and K-band magnitudes for RR Lyr stars that have spectroscopically determined individual metallicities is still needed. Dall'Ora et al. (2004) obtained mean K-band magnitudes for 21 fundamental (RRab) and 9 first-overtone (RRc) RR Lyrae stars in the LMC star cluster Reticulum, but this remains far from what is needed for a comprehensive study of the RR Lyr period-luminosity-metallicity relation in that galaxy.
We present new J- and ![]() -band measurements of
62 field RR Lyrae stars in the inner regions of the LMC. In this sample, 50 stars
have spectroscopically determined metallicities.
This is the last paper in our series devoted to RR Lyrae stars in
the LMC. In Minniti et al. (2003)
and Borissova et al. (2006, hereafter Paper II), we analyzed the
kinematic properties of 137 RR Lyrae stars.
In Borissova et al. (2004, hereafter Paper I) we presented the
metallicities and
-band measurements of
62 field RR Lyrae stars in the inner regions of the LMC. In this sample, 50 stars
have spectroscopically determined metallicities.
This is the last paper in our series devoted to RR Lyrae stars in
the LMC. In Minniti et al. (2003)
and Borissova et al. (2006, hereafter Paper II), we analyzed the
kinematic properties of 137 RR Lyrae stars.
In Borissova et al. (2004, hereafter Paper I) we presented the
metallicities and ![]() -band magnitudes for only 9 RR Lyrae stars.
Here we present a much larger sample, with both near-IR photometry and spectroscopically
determined metallicities, which allows us to verify the
relationships and to re-derive the distance to the LMC. Furthermore, we present
single-epoch, J-band photometry, and discuss near-IR color-magnitude diagrams for
7 fields in the LMC. Our deep photometry permits accurate measurement of the red clump
magnitudes, as well as a comparison between RR Lyr and red clump distance determinations
in the near-IR.
-band magnitudes for only 9 RR Lyrae stars.
Here we present a much larger sample, with both near-IR photometry and spectroscopically
determined metallicities, which allows us to verify the
relationships and to re-derive the distance to the LMC. Furthermore, we present
single-epoch, J-band photometry, and discuss near-IR color-magnitude diagrams for
7 fields in the LMC. Our deep photometry permits accurate measurement of the red clump
magnitudes, as well as a comparison between RR Lyr and red clump distance determinations
in the near-IR.
Our paper is structured as follows. Section 2 describes our observations and data reduction procedure. In Sect. 3 we derive and analyze the period-luminosity-metallicity relation. Finally, in the last section a summary of our results is given.
2 Observations and reductions
The J and ![]() -band imaging of 7 fields in the LMC was obtained with the SOFI infrared imager at the European Southern Observatory's New Technology Telescope, whereas only
-band imaging of 7 fields in the LMC was obtained with the SOFI infrared imager at the European Southern Observatory's New Technology Telescope, whereas only ![]() -band images were taken with the ISPI infrared array on the Blanco 4.0m telescope at CTIO for another two fields. SOFI has a
-band images were taken with the ISPI infrared array on the Blanco 4.0m telescope at CTIO for another two fields. SOFI has a
![]() array with a pixel size of 0.292 arcsec, with
a total field of view
array with a pixel size of 0.292 arcsec, with
a total field of view ![]() arcmin2, while ISPI has a
arcmin2, while ISPI has a
![]() array with a pixel size of 0.3 arcsec, with a total field of view
array with a pixel size of 0.3 arcsec, with a total field of view
![]() arcmin2.
arcmin2.
The ![]() images were taken on several different epochs, while J-band images are
single-epoch observations. For the ISPI observations the observing strategy included alternating between the object and a nearby sky. At both the ``object'' and the ``sky'' pointings, we jittered within
images were taken on several different epochs, while J-band images are
single-epoch observations. For the ISPI observations the observing strategy included alternating between the object and a nearby sky. At both the ``object'' and the ``sky'' pointings, we jittered within ![]() 20 arcsec to minimize the effect of cosmetic defects and cosmic rays. SOFI observations were taken with the so-called autojitter mode, where the sky is determined from the offset positions of the same field. The log of the observations is provided in Table 1.
The RA and Dec of the centers of the observed fields are listed in Cols. 2 and 3, total exposure times on source (in minutes) are in column 5, and the Modified Julian Date (2 400 000-MJD) of the observations is in the last column.
20 arcsec to minimize the effect of cosmetic defects and cosmic rays. SOFI observations were taken with the so-called autojitter mode, where the sky is determined from the offset positions of the same field. The log of the observations is provided in Table 1.
The RA and Dec of the centers of the observed fields are listed in Cols. 2 and 3, total exposure times on source (in minutes) are in column 5, and the Modified Julian Date (2 400 000-MJD) of the observations is in the last column.
Table 1: Log of the observations.
Data reduction followed the usual steps for near-IR data: dark subtraction, flat-fielding, sky subtraction, and averaging of sky-subtracted frames for each epoch separately. To get a good sky subtraction in the relatively crowded fields in the LMC, where the sky frames are constructed from the adjacent jittered exposures, double-pass sky subtraction was performed with the IRAF dimsum package, as described in Rejkuba (2001).
PSF-fitting stellar photometry of these sky-subtracted and combined images was carried out using ALLSTAR and ALLFRAME within DAOPHOT II (Stetson 1994). The calibration of the photometry to the standard system was done by comparing our instrumental magnitudes of 30-50 stars per image with the 2 MASS magnitudes. The standard error values for the coefficients of the calibrations are 0.03-0.04 for the zero point and less than 0.02 for the color term. Then the mean value of all observations taken in different epochs is calculated and the sigma (0.03-0.05 mag) of the nonvariable stars for the magnitude interval of RR Lyrae star can be taken as a final error of RR Lyrae star photometry.
2.1 Mean J and K magnitudes and error analysis
We identify 62 RR Lyrae stars from the MACHO and OGLE databases (Soszynski et al. 2003)
with J and/or at least one ![]() magnitudes. Everywhere in this paper we use V, B,
I, and R magnitudes of the variable stars, taken from these databases. A
systematic error of up to
magnitudes. Everywhere in this paper we use V, B,
I, and R magnitudes of the variable stars, taken from these databases. A
systematic error of up to ![]() 0.10 mag may be present in the V band (Alves
et al. 2002), because of the differences between the MACHO and OGLE photometry.
0.10 mag may be present in the V band (Alves
et al. 2002), because of the differences between the MACHO and OGLE photometry.
The metallicities are taken from Paper II. They are measured from good quality low-resolution spectra obtained with FORS1, FORS2, and GEMINI-GMOS, using Gratton et al. (2004) calibration on the Harris (1996) metallicity scale (see Paper II for more details).
As Clement et al. (2008) have recently pointed out, the main difficult in determining relations involving the physical parameters of RR Lyrae stars, such as period of pulsation vs. luminosity and metallicity is to select a homogeneous group of stars. From an observational point of view, in addition to that, the spread around the derived relations can come from a variety of effects, including photometric errors, errors from calibration to the 2 MASS system, errors from the phase corrections, crowding (which also affects the amplitudes of the observed stars), and variable reddening.
As in Szewczyk et al. (2008), to check the zero point of our calibrations we
calculated the red clump (RC) brightness for each one field. We adopted the method described in Pietrzynski et al. (2003), by selecting the stars with ![]() -band magnitudes and
-band magnitudes and
![]() colors in the range around the red clump stars (see Fig. 1) and fitting the derived
colors in the range around the red clump stars (see Fig. 1) and fitting the derived ![]() -band magnitude histogram with a combination involving a Gaussian function (representing the distrubution of red clump stars) superimposed on a second-order polynomial component (for the stellar background;
see, e.g., Stanek & Garnavich 1998; Alves et al. 2002; Pietrzynski & Gieren 2002).
-band magnitude histogram with a combination involving a Gaussian function (representing the distrubution of red clump stars) superimposed on a second-order polynomial component (for the stellar background;
see, e.g., Stanek & Garnavich 1998; Alves et al. 2002; Pietrzynski & Gieren 2002).
The average red clump star's brightness value in each of our fields is given in Table 2. Before comparing our results with Pietrzynski at al. (2002, 2003), Alves et al. (2002), and
Szewczyk et al. (2008), several corrections have to be applied. The data of Alves et al. (2002) are given in the Koornneef system, while Pietrzynski at al. (2002) calibrate their photometry in the UKIRT system. These results are
transfomed to the 2 MASS photometric system using Carpenter's (2001) equations. The red clump star brightnesses also need to be corrected for the geometry of the LMC, because it is well known that the disk of the LMC is inclined with respect to the plane of the sky. To do this we chose the center of the LMC as derived in van der Marel et al. (2002),
whereas the inclination angle i = 34.7 degrees and the position angle of the line of nodes
![]() degrees were taken from van der Marel et al. (2009). To convert the coordinates of the centers of the fields from right ascension and declination to Cartesian coordinates, we used Eqs. (1)-(4) from van der Marel et al. (2002).
A schematic diagram showing their positions on the sky is shown in Fig. 2.
degrees were taken from van der Marel et al. (2009). To convert the coordinates of the centers of the fields from right ascension and declination to Cartesian coordinates, we used Eqs. (1)-(4) from van der Marel et al. (2002).
A schematic diagram showing their positions on the sky is shown in Fig. 2.
We next compared the RC magnitudes thus derived, corrected for the LMC geometry, with the RC mean
magnitudes (corrected in the same way) from Pietrzynski et al. (2002, 2003) and Alves et al. (2002). We have very good agreement:
our mean ![]() RC magnitude is 0.04 mag brighter, than derived in these studies, while the mean J RC magnitude is 0.01 mag fainter.
RC magnitude is 0.04 mag brighter, than derived in these studies, while the mean J RC magnitude is 0.01 mag fainter.
We also retrieved the LMC RC stars from the OGLE II catalog (Udalski et al. 2000) in the B, V, and I filters. For comparison, we chose the RC box in the CMD as defined by Subramaniam & Subramanian (2009), with boundaries 0.65-1.35 mag in (V-I) and 17.5-19.5 mag in I. The best-fit magnitudes for each field and filter, based on 20 000-50 000 stars, are given in the last three columns of Table 2. We did not apply any correction for incompleteness due to crowding effects.
From the composite luminosity function (LF) (Fig. 3) we can derive the red giant branch (RGB) tip magnitude for J and ![]() by fitting the upper part of the luminosity function.
We find
by fitting the upper part of the luminosity function.
We find
![]() mag and
mag and
![]() mag.
We did not use the RGB tip magnitudes as distance indicators, because of their metallicity and age
dependence (Salaris et al. 2005). However, their values were derived for completeness, since we had a homogeneous dataset.
mag.
We did not use the RGB tip magnitudes as distance indicators, because of their metallicity and age
dependence (Salaris et al. 2005). However, their values were derived for completeness, since we had a homogeneous dataset.
| |
Figure 2: Schematic diagram showing the X and Y (in degrees) positions of the centers of our fields on the sky. The center of the LMC is at RA = 05:27:36 and Dec = -69:52:12, as calculated in van der Marel et al. (2002). |
| |
Figure 3:
Composite luminosity functions (solid line for the |
Table 2: Red clump magnitudes.
It is commonly accepted that the light curves of
RR Lyrae stars are more symmetrical in the ![]() band and their pulsation amplitudes
are smaller. In most cases we have five
band and their pulsation amplitudes
are smaller. In most cases we have five ![]() measurements per star.
To improve the intrinsic precision of the RR Lyrae mean magnitudes, we
performed a fit of the individual phase points with template curves
taken from Jones et al. (1996). These authors have determined different
template shapes depending on the type of variability (RRab or RRc type,
standing for fundamental and first overtone pulsators, respectively)
and on the B-amplitude of the variable, and described each of these templates
in terms of a Fourier series. The method requires an accurately known ephemeris,
as well as the amplitudes in the optical V or B bands. We adopted their
method, and for each star we computed the corresponding Fourier template based
on the ephemeris and the B-amplitudes (AB) for OGLE variables and the
V amplitudes (AV) for MACHO variables.
measurements per star.
To improve the intrinsic precision of the RR Lyrae mean magnitudes, we
performed a fit of the individual phase points with template curves
taken from Jones et al. (1996). These authors have determined different
template shapes depending on the type of variability (RRab or RRc type,
standing for fundamental and first overtone pulsators, respectively)
and on the B-amplitude of the variable, and described each of these templates
in terms of a Fourier series. The method requires an accurately known ephemeris,
as well as the amplitudes in the optical V or B bands. We adopted their
method, and for each star we computed the corresponding Fourier template based
on the ephemeris and the B-amplitudes (AB) for OGLE variables and the
V amplitudes (AV) for MACHO variables.
A typical example of an RRab star template fit is shown in Fig. 4.
The RRe (i.e., candidate second-overtone) stars (OGLE database) were
treated as RRc variables, due to their
small amplitudes and short periods. Then we computed the average magnitude value
for each variable star, which are listed in Table 4. According
to Jones et al. (1996), the use of templates to determine mean ![]() values is
precise to within 0.03 mag.
values is
precise to within 0.03 mag.
![\begin{figure}
\par\includegraphics[width=9cm,clip]{11465fg4.ps}
\end{figure}](/articles/aa/full_html/2009/29/aa11465-08/img31.png) |
Figure 4:
|
Our J magnitudes are single-point observations. To obtain the mean J magnitude therefrom, we added the corrections derived in Feast et al. (2008) to the observed magnitude. They used V, J, H, K light curves of well-studied RRab stars to determine the relation between J, H, K and their V amplitudes. As they point out, such a magnitude determination is precise to within about 0.1 mag.
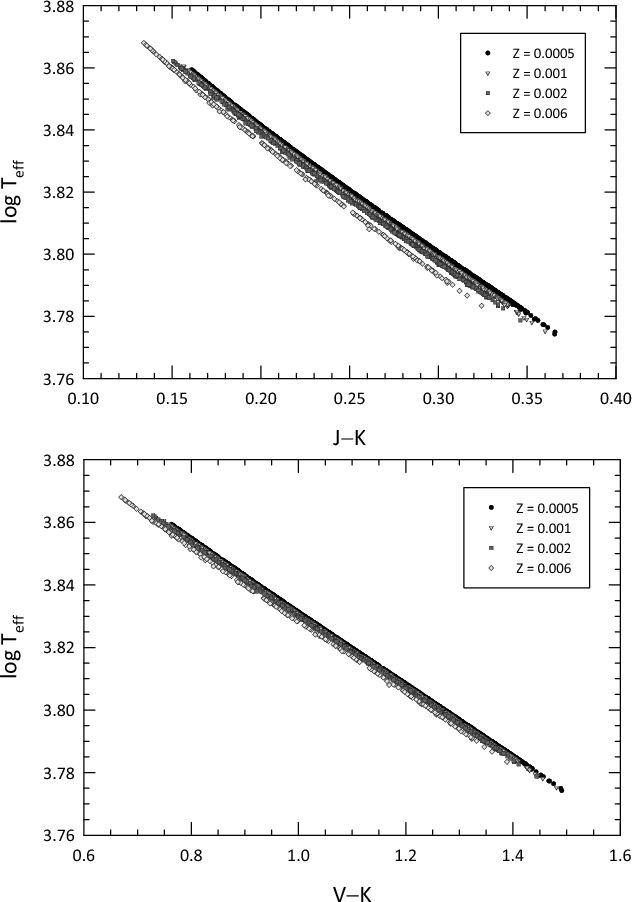 |
Figure 5: Predicted relationship between temperature and J-K ( top) and V-K ( bottom) colors for RR Lyr stars of different metallicities (see insets), according to the synthetic horizontal branch models computed by Catelan et al. (2004). |
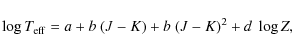
To check for possible photometric errors, we plotted the RR Lyrae stars in the
![]() ,
,
![]() color-magnitude diagrams (Fig. 1). In general,
most of the RR Lyrae stars are located where we expect to see them, i.e., within
the boundaries of the instability strip. To evaluate the latter, we
proceeded as follows:
The theoretical value of the blue edge of the RR Lyrae instability strip
is located near
color-magnitude diagrams (Fig. 1). In general,
most of the RR Lyrae stars are located where we expect to see them, i.e., within
the boundaries of the instability strip. To evaluate the latter, we
proceeded as follows:
The theoretical value of the blue edge of the RR Lyrae instability strip
is located near
![]() K, whereas the red edge is near 6100 K
(e.g., Smith 1995; Catelan 2004, and references therein).
To transform these temperature values into near-IR colors, we can use the
model calculations from Catelan et al. (2004), where the RR Lyrae
period-luminosity relation was studied using synthetic horizontal branch
models. The corresponding relationship between near-IR temperatures and
colors, as implied by those models, is given in Fig. 5. The
K, whereas the red edge is near 6100 K
(e.g., Smith 1995; Catelan 2004, and references therein).
To transform these temperature values into near-IR colors, we can use the
model calculations from Catelan et al. (2004), where the RR Lyrae
period-luminosity relation was studied using synthetic horizontal branch
models. The corresponding relationship between near-IR temperatures and
colors, as implied by those models, is given in Fig. 5. The
![]() curves are very well described by fits of the following form:
curves are very well described by fits of the following form:
where
where
Transforming these temperatures of the instability
strip boundaries to the 2 MASS photometric system using Eq. (1),
we find for the blue and red edges values of
![]() and
and
![]() ,
respectively, which
reasonably agree with the values that can be inferred from
Fig. 5.
If we assume a
reddening value
,
respectively, which
reasonably agree with the values that can be inferred from
Fig. 5.
If we assume a
reddening value
![]() ,
calculated as a mean value of the
individual reddenings for our stars (see below) and the relation
E(J - K)=0.58 E(B-V) (Bessell et al. 1998), we can calculate the reddened boundaries of the
RR Lyrae instability strip. They are schematically plotted as vertical dashed lines in
Fig. 1.
As can be seen, several stars seem to be placed outside the instability strip.
Some of of them are within
,
calculated as a mean value of the
individual reddenings for our stars (see below) and the relation
E(J - K)=0.58 E(B-V) (Bessell et al. 1998), we can calculate the reddened boundaries of the
RR Lyrae instability strip. They are schematically plotted as vertical dashed lines in
Fig. 1.
As can be seen, several stars seem to be placed outside the instability strip.
Some of of them are within ![]()
![]() of the edges of the
strip, and can perhaps be
explained in terms of variations in the reddening and/or photometric errors.
The remainder of the stars should be classified as outliers and need
further careful inspection.
of the edges of the
strip, and can perhaps be
explained in terms of variations in the reddening and/or photometric errors.
The remainder of the stars should be classified as outliers and need
further careful inspection.
Dutra et al. (2001) find the Milky Way mean reddening in the direction of the LMC
to be around 0.06 mag, and the internal LMC reddening to be
![]() .
A similar result was obtained by Clementini et al. (2003). In like vein,
for six out of our 9 observed fields, Alves et al. (2002) derived a mean reddening
value from a multi-wavelength red clump fit to be
.
A similar result was obtained by Clementini et al. (2003). In like vein,
for six out of our 9 observed fields, Alves et al. (2002) derived a mean reddening
value from a multi-wavelength red clump fit to be
![]() .
.
Investigations of the LMC extinction, however, show that it is
non-uniform and clumpy (see, for example, Udalski et al. 2000;
Dutra et al. 2001; Zaritsky et al. 2004).
Therefore, it is necessary to calculate individual reddenings for each of
the stars in our sample. As a first approach, we used the minimum light
color of RRab stars in the I optical band from the OGLE database. The method
is based on a concept originally developed by Sturch (1966), expanded on
by Mateo et al. (1995), and most recently refined by Guldenschuh et al. (2005).
The later work derives an intrinsic minimum light color for RRab variables
of
![]() ,
with very little dependence on period or
metallicity. The photometry of OGLE RRab stars was then retrieved and the
,
with very little dependence on period or
metallicity. The photometry of OGLE RRab stars was then retrieved and the
![]() color determined for 26 OGLE RRab stars, from which
we derived the corresponding E(V - I) values. In three cases we have
negative reddening values (-0.004, -0.007, -0.01) and for these stars we adopted
color determined for 26 OGLE RRab stars, from which
we derived the corresponding E(V - I) values. In three cases we have
negative reddening values (-0.004, -0.007, -0.01) and for these stars we adopted
![]() .
The calculated
mean
.
The calculated
mean
![]() reddening is in very good agreement with the
literature values. The individual E(B-V) values range between
0.03 and 0.35 mag. For MACHO, RRc, and RRe stars, we used the reddening map of the OGLE-II
fields in the LMC derived by Udalski et al. (1999). They determined the mean
reddening values toward the LMC in 84 lines of sight.
And finally, the reddening was also derived using the Zaritsky et al. (2004)
web-based tool for cool stars. For comparison, the star OGLE051755.55-692716.3
has
E(B-V)=0.03 calculated from the
reddening is in very good agreement with the
literature values. The individual E(B-V) values range between
0.03 and 0.35 mag. For MACHO, RRc, and RRe stars, we used the reddening map of the OGLE-II
fields in the LMC derived by Udalski et al. (1999). They determined the mean
reddening values toward the LMC in 84 lines of sight.
And finally, the reddening was also derived using the Zaritsky et al. (2004)
web-based tool for cool stars. For comparison, the star OGLE051755.55-692716.3
has
E(B-V)=0.03 calculated from the
![]() color calibration,
while the Zaritsky et al. (2004) map gives
E(B-V)=0.04. The adopted averaged E(B-V) values are given in Col. 11 of Table 4.
color calibration,
while the Zaritsky et al. (2004) map gives
E(B-V)=0.04. The adopted averaged E(B-V) values are given in Col. 11 of Table 4.
![\begin{figure}
\par\includegraphics[width=9cm,clip]{11465fg7.eps}
\end{figure}](/articles/aa/full_html/2009/29/aa11465-08/img56.png) |
Figure 6:
Left panel: |
In Fig. 6 we show the period-AB amplitude and period-AV amplitude
relations. As Clement et al. (2008)
point out, many of the RR Lyrae stars in the LMC have similar characteristics
to those in M 3. The dashed lines represent the corresponding period-amplitude
relations shifted to longer periods by
![]() .
According to Cacciari et al. (2005), these lines represent the long-period,
candidate well-evolved RRab stars. As can be seen in Fig. 6, most
of the RRab stars lie within
.
According to Cacciari et al. (2005), these lines represent the long-period,
candidate well-evolved RRab stars. As can be seen in Fig. 6, most
of the RRab stars lie within ![]() of these lines (
of these lines (
![]() ,
as
calculated in Cacciari et al. 2005).
We have five candidate well-evolved RRab stars:
OGLE 052834.72-693326.4, MACHO 13.5961.511, MACHO 79.5507.1580,
OGLE 052005.99-691313.3, and OGLE 051752.63-692856.4. Another three
stars, namely MACHO 2.5507.6046, MACHO 11.8750.1827, and MACHO 13.5961.435,
lie below the M 3 sequence. According to Clement et al. (2008) they can
be blended stars due to crowding. These stars are excluded from further analysis.
The same analysis was performed for RRc stars, and another four stars were
rejected: OGLE 052044.57-691726.3, OGLE 051756.59-692803.2,
OGLE 052827.10-693347.7, and OGLE 052039.40-691709.0. The RRe stars
(squares) lie below the lines, which is consistent with theoretical expectations
for low-period, first-overtone pulsators (e.g., Bono et al. 1997).
,
as
calculated in Cacciari et al. 2005).
We have five candidate well-evolved RRab stars:
OGLE 052834.72-693326.4, MACHO 13.5961.511, MACHO 79.5507.1580,
OGLE 052005.99-691313.3, and OGLE 051752.63-692856.4. Another three
stars, namely MACHO 2.5507.6046, MACHO 11.8750.1827, and MACHO 13.5961.435,
lie below the M 3 sequence. According to Clement et al. (2008) they can
be blended stars due to crowding. These stars are excluded from further analysis.
The same analysis was performed for RRc stars, and another four stars were
rejected: OGLE 052044.57-691726.3, OGLE 051756.59-692803.2,
OGLE 052827.10-693347.7, and OGLE 052039.40-691709.0. The RRe stars
(squares) lie below the lines, which is consistent with theoretical expectations
for low-period, first-overtone pulsators (e.g., Bono et al. 1997).
3 Results
3.1 Near-infrared period-luminosity relations
To derive the near-infrared period-luminosity relations, we used the
method described in Sollima et al. (2006b).
The relationship between infrared luminosity, metallicity, and period takes the form:
| (3) |
Here,
In Fig. 7 we show the resulting ![]() vs. J0 and
vs. J0 and ![]() vs.
vs.
![]() relations. All magnitudes are corrected for reddening using individual E(B-V) values (see Table 4, and discussion above), and the extinction law of Bessell et al. (1998).
relations. All magnitudes are corrected for reddening using individual E(B-V) values (see Table 4, and discussion above), and the extinction law of Bessell et al. (1998).
![\begin{figure}
\par\includegraphics[width=8.8cm,clip]{11465fg8.eps}
\end{figure}](/articles/aa/full_html/2009/29/aa11465-08/img61.png) |
Figure 7:
|
The best fit to our data yields the following relations:
| (4) |
| (5) |
The values in parenthesis indicate the errors of the coefficients.
To improve the statistics, we added the data from Szewczyk et al. (2008) to
Fig. 7.
We performed the same period-amplitude analysis as in Sect. 3, and the stars that
lie far from 3![]() of the mean M 3 lines were rejected. The best fit to the combined sample gives
of the mean M 3 lines were rejected. The best fit to the combined sample gives
3.2 Period-[Fe/H] relations
In Fig. 8 we show our derived period-[Fe/H] relation.
Two stars, MACHO 2.5628.6276 and MACHO 13.5961.720, which
represent the metal-rich extreme in our sample, lie much farther than three sigma
away from the mean period-[Fe/H] trend. The remainder of the stars present a
wide range in periods but only a narrow range in [Fe/H].
Thus, this plot confirms the results of Clementini et al. (2003),
Gratton et al. (2004), and Borissova et al. (2004, 2006), who previously
found that the field RR Lyrae stars in LMC represent a homogeneous metal-poor population,
and most of the RR Lyr stars are in the range
![]() ,
with
only a small metallicity spread, and little dependence of period on metallicity.
,
with
only a small metallicity spread, and little dependence of period on metallicity.
![\begin{figure}
\par\includegraphics[width=8.8cm,clip]{11465fg9.eps}
\end{figure}](/articles/aa/full_html/2009/29/aa11465-08/img68.png) |
Figure 8: Period-[Fe/H] relation. The derived best-fit relations are shown with a solid line. Filled circles stand for RRab stars, whereas asterisks represent the RRc stars. |
![\begin{figure}
\par\includegraphics[width=8.8cm,clip]{11465fg10.eps}
\end{figure}](/articles/aa/full_html/2009/29/aa11465-08/img69.png) |
Figure 9: The period-luminosity-[Fe/H] relations. The derived best-fitrelations are shown with solid lines. |
![\begin{figure}
\par\includegraphics[width=8.8cm,clip]{11465fg11.eps}
\end{figure}](/articles/aa/full_html/2009/29/aa11465-08/img70.png) |
Figure 10:
Period- |
Table 3: Calculated distance modulus to the centers of our fields.
Confirming the small metallicity trend, we obtained the following relation,
using stars in the metallicity range
![]() :
:
| (8) |
Using the period-J and period-
| (9) |
| (10) |
In practice, a positive correction to be applied to a universal, [Fe/H]-independent period-luminosity relation means that the actual luminosity is fainter than the one obtained with the standard PL relation. The errors of the fits, however, are very large, and both the metal-rich and metal-poor extremes are represented by only two stars. Although our results are very similar to those obtained by Bono et al. (2003), Catelan et al. (2004), and Sollima et al. (2008), we cannot reach firm conclusions concerning the metallicity dependence of the period-luminosity relation in the J band based solely on these data.
Therefore, to increase the sample size, we added the Sollima et al. (2006a) dataset for ![]() Cen (Fig. 10, upper panel) to our
Cen (Fig. 10, upper panel) to our ![]() band magnitudes and metallicities. The spectroscopic metal abundances for 74 RR Lyrae stars were obtained with FLAMES.
The metallicity spread of the RR Lyrae variables is within the range
band magnitudes and metallicities. The spectroscopic metal abundances for 74 RR Lyrae stars were obtained with FLAMES.
The metallicity spread of the RR Lyrae variables is within the range
![]() .
The
.
The ![]() Cen
Cen ![]() magnitudes given in Sollima et al. (2006a) are dereddened using
E(B-V)=0.11, and their residuals are calculated by applying a correction for the LMC
magnitudes given in Sollima et al. (2006a) are dereddened using
E(B-V)=0.11, and their residuals are calculated by applying a correction for the LMC ![]() Cen relative distance moduli and then the corresponding residuals are computed with respect to our own fits using Eq. (7).
Cen relative distance moduli and then the corresponding residuals are computed with respect to our own fits using Eq. (7).
Table 4: The parameters of the RR Lyrae stars.
To reduce the scatter, we divided the sample into bins in metallicity, choosing a bin width of 0.2 dex. These selected bins contain between 2-3 (at the metal-rich and metal-poor extremes)
and 62 stars for [Fe/H] between -1.8 and -1.6 dex (Fig. 10, lower panel).
The metal-rich and metal-poor extremes seem to differ from the zero reference line most probably because of poor statistics. To improve it and to check the possible dependence of our results on the bin size, we alternatively forced the number of stars to be identical for every bin (15), thus adopting a variable bin size. This case is shown as open circles in Fig. 10 and in this case the deviation is smaller. Clearly, more data are necessary to investigate the behavior of the metal-rich and metal-poor extremes. The best-fit to the combined sample gives.
| (11) |
The zero point of the relations was calculated as in Sollima et al. (2006b), using the latest values of mean K magnitude, reddening and distance of the star RR Lyrae given in Sollima et al. (2008). The distance to the star RR Lyrae is based on its trigonometric parallax. The current sources of parallax information for the star are as follows: ground-based:
This relation is close to the one derived by Sollima et al. (2006, 2008), although it shows an even smaller metallicity dependence.
With the above relation, we calculated the distance to every individual RR Lyrae star, using
their measured ![]() apparent magnitudes, reddenings, periods, and metallicities. After correcting for the LMC geometry as described in Sect. 2, the mean absolute magnitude is
apparent magnitudes, reddenings, periods, and metallicities. After correcting for the LMC geometry as described in Sect. 2, the mean absolute magnitude is
![]() ,
and the LMC distance modulus is
,
and the LMC distance modulus is
![]() .
This value, within the errors, agree very well with the LMC distance moduli of Sollima et al. (2006b),
.
This value, within the errors, agree very well with the LMC distance moduli of Sollima et al. (2006b),
![]() ;
Sollima et al. (2008),
;
Sollima et al. (2008),
![]() ;
Szewczyk et al. (2008),
;
Szewczyk et al. (2008),
![]() ;
Clement et al. (2008),
;
Clement et al. (2008),
![]() ;
and Catelan & Cortés (2008),
;
and Catelan & Cortés (2008),
![]() .
.
Table 3 shows the dereddened distance moduli to the centers of our fields, where N is the number of RR Lyr stars used for the computation of the distance. In the last column the dereddened distance modulus is also given, calculated from the mean RC ![]() brightness derived in Sect. 2. We used the absolute RC magnitude
MK = -1.644, calibrated in Alves et al. (2002). To calculate the distance a correction for population effects has
to be applied (Gullieuszik et al. 2007), because of the differences in the stellar content of LMC red clump stars and the Galactic red clumps on which the Alves (2000) calibration is based. Salaris & Girardi (2002) estimated the population effects on the RC absolute magnitude in the K band of
brightness derived in Sect. 2. We used the absolute RC magnitude
MK = -1.644, calibrated in Alves et al. (2002). To calculate the distance a correction for population effects has
to be applied (Gullieuszik et al. 2007), because of the differences in the stellar content of LMC red clump stars and the Galactic red clumps on which the Alves (2000) calibration is based. Salaris & Girardi (2002) estimated the population effects on the RC absolute magnitude in the K band of
![]() .
The mean distance value is
.
The mean distance value is
![]() .
There is excellent agreement between the two methods in the near-IR.
.
There is excellent agreement between the two methods in the near-IR.
4 Summary and conclusions
We have presented new J and ![]() -band photometry for 62 RR Lyr stars in inner LMC fields,
obtained with the near-IR cameras SOFI on the NTT and ISPI on the Blanco 4 m telescopes.
For 50 stars there are spectroscopic [Fe/H] measurements from VLT FORS1 and FORS2,
and Gemini GMOS observations presented in Borissova et al. (2004, 2006).
-band photometry for 62 RR Lyr stars in inner LMC fields,
obtained with the near-IR cameras SOFI on the NTT and ISPI on the Blanco 4 m telescopes.
For 50 stars there are spectroscopic [Fe/H] measurements from VLT FORS1 and FORS2,
and Gemini GMOS observations presented in Borissova et al. (2004, 2006).
For each RR Lyr star we derived individual reddening values, either using the minimum magnitude of the I-band light curve for RRab stars or the Zaritsky et al. (2004) reddening map of the LMC. By cross-correlating the observed fields with the MACHO and OGLE databases, we constructed a homogeneous catalog of 62 RR Lyr stars for which there are
![]() magnitudes, reddening, period, amplitude, and (for a sub-sample of 50 stars) spectroscopic [Fe/H] entries.
magnitudes, reddening, period, amplitude, and (for a sub-sample of 50 stars) spectroscopic [Fe/H] entries.
We used this catalog to investigate the near-IR period-luminosity and period-luminosity-metallicity relations. To increase the significance of the results, we combined our sample with the data from Szewczyk et al. (2008). With this combined sample, the best fitting period-luminosity relations are given by Eqs. (6) and (7).
Given that the majority of the field RR Lyr span only a narrow metallicity range,
![]() ,
it is difficult to draw firm conclusions concerning the metallicity dependence of the period-luminosity relations. In the case of the
,
it is difficult to draw firm conclusions concerning the metallicity dependence of the period-luminosity relations. In the case of the ![]() band, we add the RR Lyr stars from
band, we add the RR Lyr stars from ![]() Cen (Sollima et al. 2006a), which cover a much wider metallicity range. Based on this combined sample, only a very mild metallicity dependence is found, as shown in our Eq. (12).
Cen (Sollima et al. 2006a), which cover a much wider metallicity range. Based on this combined sample, only a very mild metallicity dependence is found, as shown in our Eq. (12).
In addition to the RR Lyr, our deep near-IR color-magnitude diagrams allow us to detect
both the tip of the red giant branch and the RGB stars in our 7 LMC fields. By combining
the photometry for all the fields to increase the statistics, we measured the RGB tip
location at
![]() ,
,
![]() .
The average magnitudes of the red clump stars in the near-IR from our data, and from
optical BVI magnitudes (from the OGLE II database; Udalski et al.
2000), were derived for each of the 7 LMC fields. Based on the red clump absolute
magnitude calibration of
Alves et al. (2002), the average distance modulus to the LMC is
.
The average magnitudes of the red clump stars in the near-IR from our data, and from
optical BVI magnitudes (from the OGLE II database; Udalski et al.
2000), were derived for each of the 7 LMC fields. Based on the red clump absolute
magnitude calibration of
Alves et al. (2002), the average distance modulus to the LMC is
![]() .
Within the errors this value is in excellent agreement with the
derived distance modulus based on our analysis of the RR Lyrae, namely
.
Within the errors this value is in excellent agreement with the
derived distance modulus based on our analysis of the RR Lyrae, namely
![]() .
.
Acknowledgements
J.B. acknowledges support from Proyecto Fondecyt Regular #1080086. D.M. and M.C. are supported by Proyecto BasalPFB-06/2007 and Centro de Astrofísica FONDAP No. 15010003. D.M. acknowledges support by Proyecto FONDECYT Regular #1090213. M.C. acknowledges support by Proyecto FONDECYT Regular #1071002 and by a John Simon Guggenheim Memorial Foundation Fellowship. We thank our referee for very useful comments that helped to improve this manuscript.
References
- Alves, D., Rejkuba, M., Minniti, D., & Cook, K. H. 2002, ApJ, 573, L51 [NASA ADS] [CrossRef] (In the text)
- Bessell, M. S., Castelli, F., & Plez, B. 1998, A&A, 333, 231 [NASA ADS] (In the text)
- Benedict, G. F., McArthur, B., Fredrick, L., et al. 2002, AJ, 123, 473 [NASA ADS] [CrossRef] (In the text)
- Bono, G., Caputo, F., Castellani, V., & Marconi, M. 1997, A&AS, 121, 327 [NASA ADS] [CrossRef] [EDP Sciences] (In the text)
- Bono, G., Caputo, F., Castellani, V., Marconi, M., & Storm, J. 2001, MNRAS, 326, 1183 [NASA ADS] [CrossRef] (In the text)
- Bono, G., Caputo, F., Castellani, V., et al. 2003, MNRAS, 344, 1097 [NASA ADS] [CrossRef] (In the text)
- Borissova, J., Minniti, D., Rejkuba, M., et al. 2004, A&A, 423, 97 [NASA ADS] [CrossRef] [EDP Sciences] (Paper I) (In the text)
- Borissova, J., Minniti, D., Rejkuba, M., & Alves, D. 2006, A&A, 460, 459 [NASA ADS] [CrossRef] [EDP Sciences] (Paper II) (In the text)
- Cacciari, C., Corwin, T. M., & Carney, B. W. 2005, AJ, 129, 267 [NASA ADS] [CrossRef] (In the text)
- Carney B. W., Storm J., & Jones, R. V. 1992, ApJ, 386, 663 [NASA ADS] [CrossRef] (In the text)
- Carpenter, J. M. 2001, AJ, 121, 2851 [NASA ADS] [CrossRef] (In the text)
- Cassisi, S., Castellani, M., Caputo, F., & Castellani, V. 2004, A&A, 426, 641 [NASA ADS] [CrossRef] [EDP Sciences] (In the text)
- Catelan, M. 2004, ApJ, 600, 409 [NASA ADS] [CrossRef] (In the text)
- Catelan, M., & Cortés, C. 2008, ApJ, 676, L135 [NASA ADS] [CrossRef] (In the text)
- Catelan, M., Pritzl, B. J., & Smith, H. A. 2004, ApJS, 154, 633 [NASA ADS] [CrossRef] (In the text)
- Clement, C. M., Xu, X., & Muzzin, A. V. 2008, AJ, 135, 83 [NASA ADS] [CrossRef] (In the text)
- Clementini, G., Gratton, R., Bragaglia, A., et al. 2003, AJ, 125, 1309 [NASA ADS] [CrossRef] (In the text)
- Dall'Ora, M., Storm, J., Bono, G., et al. 2004, ApJ, 610, 269 [NASA ADS] [CrossRef]
- Del Principe, M., Piersimoni, A. M., Storm, J., et al. 2006, ApJ, 652, 362 [NASA ADS] [CrossRef] (In the text)
- Dutra, C. M., Bica, E., Claria, J. J., Piatti, A. E., & Ahumada, A. V. 2001, A&A, 371, 895 [NASA ADS] [CrossRef] [EDP Sciences] (In the text)
- Feast, M., Laney, C., Kinman, T., van Leeuwen, F., & Whitelock, P. 2008, MNRAS, 386, 2115 [NASA ADS] [CrossRef] (In the text)
- Frolov M. S., & Samus, N. N. 1998, AstL, 24, 171 [NASA ADS] (In the text)
- Gratton, R., Bragaglia, A., Clementini, G., et al. 2004, A&A, 421, 937 [NASA ADS] [CrossRef] [EDP Sciences] (In the text)
- Gullieuszik, M., Held, E., Rizzi, L., et al. 2007, A&A467, 1025, 2007 [NASA ADS] (In the text)
- Guldenschuh, K., Layden, A., Wan, Y., Whiting, A., & van der Bliek, N. 2005, PASP, 117, 721 [NASA ADS] [CrossRef] (In the text)
- Harris, W. E. 1996, AJ, 112, 1487 [NASA ADS] [CrossRef] (In the text)
- Jones, R. V., Carney, B. W., Storm, J., & Latham, D. W. 1992, ApJ, 386, 646 [NASA ADS] [CrossRef] (In the text)
- Jones, R. V., Carney, B. W., & Fulbright, J. P. 1996, PASP, 108, 877 [NASA ADS] [CrossRef] (In the text)
- Mateo, M., Udalski, A., Szymanski, M., et al. 1995, AJ, 109, 588 [NASA ADS] [CrossRef] (In the text)
- Minniti, D., Borissova, J., Rejkuba, M., et al. 2003, Science, 301, 1508 [NASA ADS] [CrossRef] (In the text)
- Nemec, J. M., Linnell Nemec A. F., & Lutz, T. E. 1994, AJ, 108, 222 [NASA ADS] [CrossRef] (In the text)
- Pietrzynski, G., & Gieren, W. 2002, AJ, 124, 2633 [NASA ADS] [CrossRef] (In the text)
- Pietrzynski, G., Gieren, W., & Udalski, A. 2003, AJ, 125, 2494 [NASA ADS] [CrossRef] (In the text)
- Pietrzynski, G., Gieren, W., Szewczyk, O., et al. 2008, AJ, 135, 1993 [NASA ADS] [CrossRef] (In the text)
- Rejkuba, M. 2001, A&A, 369, 812 [NASA ADS] [CrossRef] [EDP Sciences] (In the text)
- Skillen, I., Fernley, J. A., Stobie, R. S., & Jameson, R. F. 1993, MNRAS, 265, 301 [NASA ADS] (In the text)
- Salaris, M., & Girardi, L. 2002, MNRAS, 337, 332 [NASA ADS] [CrossRef] (In the text)
- Salaris, M., & Girardi, L. 2005, MNRAS, 357, 669 [NASA ADS] [CrossRef] (In the text)
- Smith, H. A. 1995, RR Lyrae Stars (Cambridge: Cambridge Univ. Press) (In the text)
- Sollima, A., Borissova, J., Catelan, M., Smith, H. A., & Minniti, D. 2006a, ApJ, 640, 43 [NASA ADS] [CrossRef] (In the text)
- Sollima, A., Cacciari, C., & Valenti, E. 2006b, MNRAS, 372, 1675 [NASA ADS] [CrossRef] (In the text)
- Sollima, A., Cacciari, C., Arkharov, A. A. H., et al. 2008, MNRAS, 384, 1583 [NASA ADS] [CrossRef] (In the text)
- Soszynski, I., Udalski, A., Szymanski, M., et al. 2003, AcA, 53, 93 [NASA ADS] (In the text)
- Stanek, K. Z., & Garnavich, P. M. 1998, ApJ, 503, 131 [NASA ADS] [CrossRef] (In the text)
- Stetson, P. B. 1994, PASP, 106, 250 [NASA ADS] [CrossRef] (In the text)
- Sturch, C. 1966, ApJ, 143, 774 [NASA ADS] [CrossRef] (In the text)
- Subramaniam, A., & Subramanian, S. 2009, IAUS, 256, 63 [NASA ADS] (In the text)
- Szewczyk, O., Pietrzynski, G., Gieren, W., et al. 2008, AJ, 136, 272 [NASA ADS] [CrossRef] (In the text)
- van Altena, W. F., Lee, J. T., & Hoffleit, E. D. 1995, Yale Parallax Catalog, 4th edn. (New Haven: Yale Univ. Obs.) (In the text)
- van der Marel, R. P., Alves, D. R., Hardy, E., & Suntzeff, N. B. 2002, AJ, 124, 2639 [NASA ADS] [CrossRef] (In the text)
- van der Marel, R. P., Kallivayalil, N., & Besla, G. 2009, IAUS, 256, 81 [NASA ADS] (In the text)
- van Leeuwen, F. 2007, Hipparcos, the New Reduction of the Raw Data (Dordrecht: Springer) (In the text)
- Udalski, A., Soszynski, I., Szymanski, M., et al. 1999, AcA, 49, 223 [NASA ADS] (In the text)
- Udalski, A., Szymanski, M., Kubiak, M., et al. 2000, AcA, 50, 307 [NASA ADS] (In the text)
- Zaritsky, D., Harris, J., Thompson, I., & Grebel, E. 2004, AJ, 128, 1606 [NASA ADS] [CrossRef] (In the text)
Footnotes
- ... Cloud
- Based on observations collected with European Southern Observatory's Very Large Telescope and New Technology Telescope, under programs 64.N-0176(B), 70.B-0547(A), and 072.D-0106(B) with the Blanco telescope at CTIO, under ISPI Prop. No. 0101; and at Gemini Observatory (observing program GS-2004A-Q-27), which is operated by the Association of Universities for Research in Astronomy, Inc., under a cooperative agreement with the NSF on behalf of the Gemini partnership: the National Science Foundation (United States), the Science and Technology Facilities Council (United Kingdom), the National Research Council (Canada), CONICYT (Chile), the Australian Research Council (Australia), Ministério da Ciência e Tecnologia (Brazil), and SECYT (Argentina).
- ... study
- Table of the individual KS measurements with dates is only available in electronic form at the CDS via anonymous ftp to cdsarc.u-strasbg.fr (130.79.128.5) or via http://cdsweb.u-strasbg.fr/cgi-bin/qcat?J/A+A/502/505
All Tables
Table 1: Log of the observations.
Table 2: Red clump magnitudes.
Table 3: Calculated distance modulus to the centers of our fields.
Table 4: The parameters of the RR Lyrae stars.
All Figures
 |
Figure 1:
|
| In the text | |
| |
Figure 2: Schematic diagram showing the X and Y (in degrees) positions of the centers of our fields on the sky. The center of the LMC is at RA = 05:27:36 and Dec = -69:52:12, as calculated in van der Marel et al. (2002). |
| In the text | |
| |
Figure 3:
Composite luminosity functions (solid line for the |
| In the text | |
| |
Figure 4:
|
| In the text | |
| |
Figure 5: Predicted relationship between temperature and J-K ( top) and V-K ( bottom) colors for RR Lyr stars of different metallicities (see insets), according to the synthetic horizontal branch models computed by Catelan et al. (2004). |
| In the text | |
| |
Figure 6:
Left panel: |
| In the text | |
| |
Figure 7:
|
| In the text | |
| |
Figure 8: Period-[Fe/H] relation. The derived best-fit relations are shown with a solid line. Filled circles stand for RRab stars, whereas asterisks represent the RRc stars. |
| In the text | |
| |
Figure 9: The period-luminosity-[Fe/H] relations. The derived best-fitrelations are shown with solid lines. |
| In the text | |
| |
Figure 10:
Period- |
| In the text | |
Copyright ESO 2009
Current usage metrics show cumulative count of Article Views (full-text article views including HTML views, PDF and ePub downloads, according to the available data) and Abstracts Views on Vision4Press platform.
Data correspond to usage on the plateform after 2015. The current usage metrics is available 48-96 hours after online publication and is updated daily on week days.
Initial download of the metrics may take a while.