| Issue |
A&A
Volume 501, Number 3, July III 2009
|
|
|---|---|---|
| Page(s) | 835 - 850 | |
| Section | Cosmology (including clusters of galaxies) | |
| DOI | https://doi.org/10.1051/0004-6361/200810836 | |
| Published online | 30 January 2009 | |
AGN heating and ICM cooling in the HIFLUGCS sample
of galaxy
clusters![[*]](/icons/foot_motif.png)
R. Mittal1,2 - D. S. Hudson1 - T. H. Reiprich1 - T. Clarke3,4
1 - Argelander-Institut für Astronomie, Auf dem Hügel 71, 53121 Bonn, Germany
2 - Max-Planck-Institute für Radioastronomie, Auf dem Hügel 69, 53121 Bonn, Germany
3 - Naval Research Laboratory, Code 7213, 4555 Overlook Ave. SW, Washington, D. C. 20375, USA
4 -
Interferometrics Inc., 13454 Sunrise Valley Drive, Suite 240, Herndon, VA 20171, USA
Received 20 August 2008 / Accepted 12 January 2009
Abstract
Active galactic nuclei (AGN) at the center of galaxy
clusters with gas cooling times that are much shorter than the
Hubble time have emerged as heating agents powerful enough to
prevent further cooling of the intracluster medium (ICM). We carried
out an intensive study of the AGN heating-ICM cooling network by
comparing various cluster parameters to the integrated radio
luminosity of the central AGN,
![]() ,
defined as the total
synchrotron power between 10 MHz and 15 GHz. This study is based on
the
,
defined as the total
synchrotron power between 10 MHz and 15 GHz. This study is based on
the
![]() sample comprising the 64 X-ray brightest galaxy
clusters. We adopted the central cooling time,
sample comprising the 64 X-ray brightest galaxy
clusters. We adopted the central cooling time,
![]() ,
as the
diagnostic to ascertain cooling properties of the
,
as the
diagnostic to ascertain cooling properties of the
![]() sample
and classify clusters with
sample
and classify clusters with
![]() Gyr as strong cool-core (SCC)
clusters, with 1 Gyr
Gyr as strong cool-core (SCC)
clusters, with 1 Gyr
![]() Gyr as weak cool-core (WCC)
clusters and with
Gyr as weak cool-core (WCC)
clusters and with
![]() Gyr as non-cool-core (NCC) clusters.
We find 48 out of 64 clusters (75%) contain cluster center radio
sources (CCRS) cospatial with or within 50
h71-1 kpc of the
X-ray peak emission. Furthermore, we find that the probability of
finding a CCRS increases from 45% to 67% to 100% for NCC, WCC, and SCC clusters, respectively.
Gyr as non-cool-core (NCC) clusters.
We find 48 out of 64 clusters (75%) contain cluster center radio
sources (CCRS) cospatial with or within 50
h71-1 kpc of the
X-ray peak emission. Furthermore, we find that the probability of
finding a CCRS increases from 45% to 67% to 100% for NCC, WCC, and SCC clusters, respectively.
We use a total of ![]() 140 independent radio
flux-density measurements, with data at more than two frequencies
for more than 54% of the sources extending below 500 MHz, enabling
the determination of accurate estimates of
140 independent radio
flux-density measurements, with data at more than two frequencies
for more than 54% of the sources extending below 500 MHz, enabling
the determination of accurate estimates of
![]() .
We find that
.
We find that
![]() in SCC clusters depends strongly on the cluster scale such that more
massive clusters harbor more powerful radio AGN. The same trend is
observed between
in SCC clusters depends strongly on the cluster scale such that more
massive clusters harbor more powerful radio AGN. The same trend is
observed between
![]() and the classical mass deposition rate,
and the classical mass deposition rate,
![]() in SCC and partly also in WCC clusters, and can be quantified
as
in SCC and partly also in WCC clusters, and can be quantified
as
![]() .
We also perform correlations of
the luminosity for the brightest cluster galaxy,
.
We also perform correlations of
the luminosity for the brightest cluster galaxy,
![]() ,
close to
the X-ray peak in all 64 clusters with
,
close to
the X-ray peak in all 64 clusters with
![]() and cluster parameters,
such as the virial mass,
and cluster parameters,
such as the virial mass,
![]() ,
and the bolometric X-ray
luminosity,
,
and the bolometric X-ray
luminosity,
![]() .
To this end, we use the 2MASS K-band magnitudes
and invoke the near-infrared bulge luminosity-black hole mass
relation to convert
.
To this end, we use the 2MASS K-band magnitudes
and invoke the near-infrared bulge luminosity-black hole mass
relation to convert
![]() to supermassive black hole mass,
to supermassive black hole mass,
![]() .
We find a weak correlation between
.
We find a weak correlation between
![]() and
and
![]() for SCC
clusters,
for SCC
clusters,
![]() ,
although with a few
outliers. We find an excellent correlation of
,
although with a few
outliers. We find an excellent correlation of
![]() with
with
![]() and
and
![]() for the entire sample, the SCC clusters showing a tighter
trend in both the cases. We discuss the plausible reasons behind
these scaling relations in the context of cooling flows and AGN
feedback.
for the entire sample, the SCC clusters showing a tighter
trend in both the cases. We discuss the plausible reasons behind
these scaling relations in the context of cooling flows and AGN
feedback.
Our results strongly suggest an AGN-feedback
machinery in SCC clusters, which regulates the cooling in the
central regions. Since the dispersion in these correlations, such as
that between
![]() and
and
![]() or
or
![]() and
and
![]() ,
increases in
going from SCC to WCC clusters, we conclude there must be secondary
processes that work either in conjunction with the AGN heating or
independently to counteract the radiative losses in WCC clusters.
,
increases in
going from SCC to WCC clusters, we conclude there must be secondary
processes that work either in conjunction with the AGN heating or
independently to counteract the radiative losses in WCC clusters.
Key words: cooling flows - galaxies: active - X-rays: galaxies: clusters - radio continuum: galaxies - galaxies: clusters: general
1 Introduction
In recent years, heating by active galactic nuclei (AGN) through outflows has gained fundamental importance in the realm of large-scale structure and galaxy formation. Several studies (e.g. Scannapieco et al. 2005; Sijacki et al. 2007; Silk & Rees 1998; Bower et al. 2006; Croton et al. 2006) have contributed to this comprehensive picture, wherein AGN feedback is considered an attractive solution to several connected problems, such as the high-mass end truncation of galaxy distribution (e.g. Benson et al. 2003) and the absence of cooling-flows in centers of galaxy clusters (e.g. McNamara & Nulsen 2007). According to these studies, AGN heating at the centers of clusters may likely be responsible for quenching condensation of the hot intracluster medium onto the cluster galaxies, thereby giving rise to the cutoff at the bright-end of the galaxy luminosity function and also regulating the cooling flows.
Gas in the ICM cools via X-ray emission. In the centers of some
clusters, the high density leads to significant loss of energy, such
that the gas radiates away all its energy in a short (![]() 1/H0)
time. In the absence of any heating mechanisms, in order to support
the overlying gas and restore hydrostatic equilibrium, there is a
steady inflow of gas towards the cluster center, which is often
referred to as the classical cooling flow model
(Fabian 1994). These so-called cool-core clusters (CC) have
centrally peaked X-ray surface-brightness profiles implying gas
cooling times orders of magnitude shorter than the age of the
cluster. However, (1) the high resolution
1/H0)
time. In the absence of any heating mechanisms, in order to support
the overlying gas and restore hydrostatic equilibrium, there is a
steady inflow of gas towards the cluster center, which is often
referred to as the classical cooling flow model
(Fabian 1994). These so-called cool-core clusters (CC) have
centrally peaked X-ray surface-brightness profiles implying gas
cooling times orders of magnitude shorter than the age of the
cluster. However, (1) the high resolution
![]() RGS spectra of CC
clusters have not found the expected amounts of cool gas in their
cores
(e.g. Peterson et al. 2003; Tamura et al. 2001; Peterson et al. 2001; Sakelliou et al. 2002; Xu et al. 2002; Sanders et al. 2008; Kaastra et al. 2001),
and; (2) even though the cooling of the ICM is manifested in the form
of on-going star formation observed in the brightest cluster galaxy of
several clusters (e.g. Allen 1995; Mittaz et al. 2001), it is far below
the predicted amount of the star formation rates and CO
(e.g. Edge & Frayer 2003; McNamara & O'Connell 1989). Additionally, the gas
temperature in the central regions as determined from the X-ray
spectra of these clusters is much higher than that expected based on
the cooling flow model and has been found to drop not much below 40%
the ambient temperature (e.g. Hudson et al. 2008).
RGS spectra of CC
clusters have not found the expected amounts of cool gas in their
cores
(e.g. Peterson et al. 2003; Tamura et al. 2001; Peterson et al. 2001; Sakelliou et al. 2002; Xu et al. 2002; Sanders et al. 2008; Kaastra et al. 2001),
and; (2) even though the cooling of the ICM is manifested in the form
of on-going star formation observed in the brightest cluster galaxy of
several clusters (e.g. Allen 1995; Mittaz et al. 2001), it is far below
the predicted amount of the star formation rates and CO
(e.g. Edge & Frayer 2003; McNamara & O'Connell 1989). Additionally, the gas
temperature in the central regions as determined from the X-ray
spectra of these clusters is much higher than that expected based on
the cooling flow model and has been found to drop not much below 40%
the ambient temperature (e.g. Hudson et al. 2008).
Several heating strategies have been proposed to overcome the cooling flow problem. Feedback from supernovae is an important form of heating but has been shown to be sufficient to balance energy losses only in low-luminosity ellipticals with shallower gravitational potentials (Mathews & Brighenti 2003).
Another heating scenario is thermal conduction which leads to an
inward heat flow from the outskirts of the galaxy clusters.
Voigt & Fabian (2004) have shown that even though thermal conduction may
provide enough heating to offset cooling in the hotter (
![]() keV) part of the clusters, the central parts of the cooling region remain largely unaffected by this process. Similar
to supernovae heating, thermal conduction also has the effect of only slowing down the evolution of intracluster medium by causing the cooling time to increase by a factor of a few (Pope et al. 2005) but leaves the cooling catastrophe inevitable.
keV) part of the clusters, the central parts of the cooling region remain largely unaffected by this process. Similar
to supernovae heating, thermal conduction also has the effect of only slowing down the evolution of intracluster medium by causing the cooling time to increase by a factor of a few (Pope et al. 2005) but leaves the cooling catastrophe inevitable.
In this work, we focus on the self-regulated AGN feedback as the current favored mechanism to explain the dearth of cooling by-products in galaxy clusters
(e.g. Churazov et al. 2002; Roychowdhury et al. 2004; Voit & Donahue 2005; Binney & Tabor 1995). In
this framework, accretion of the cool collapsed intracluster
medium (ICM) ignites the central active galactic nucleus, which
returns a fraction of the accreted power back to the ICM. The bulk of
the energy transfer is believed to happen through mechanical
dissipation of the AGN power. The lead evidence comes from the
observations of numerous galaxy clusters featuring X-ray deficit low
density regions, known as cavities. Such cavities have been observed
to correlate spectacularly with radio jets and lobes indicating that
they are likely regions emptied of ICM by the expanding radio lobes
[e.g. Perseus, Boehringer et al. (1993); Hydra-A, McNamara et al. (2000);
A2052, Blanton et al. (2001); A2597, McNamara et al. (2001); A4059,
Heinz et al. (2002); A478, Sun et al. (2003); A2029, Clarke et al. (2004);
A2199 Gentile et al. (2007)]. The AGN-blown cavities transfer heat to
the ICM potentially by generating sound and weak shock waves
(Mathews et al. 2006; Jones et al. 2002; Fabian et al. 2003), by doing
![]() work
against the ambient medium and dissipation of cavity enthalpy in the
wake of buoyantly rising cavities (e.g. Bîrzan et al. 2004; Ruszkowski et al. 2004). In addition to direct AGN mechanical heating via
radio bubbles, there are also alternative proposed mechanisms such as
AGN cosmic-ray heating combined with convection
(e.g. Chandran & Rasera 2007) or conduction
(e.g. Voit et al. 2008; Guo & Oh 2008).
work
against the ambient medium and dissipation of cavity enthalpy in the
wake of buoyantly rising cavities (e.g. Bîrzan et al. 2004; Ruszkowski et al. 2004). In addition to direct AGN mechanical heating via
radio bubbles, there are also alternative proposed mechanisms such as
AGN cosmic-ray heating combined with convection
(e.g. Chandran & Rasera 2007) or conduction
(e.g. Voit et al. 2008; Guo & Oh 2008).
Numerous results over the last couple of decades have confirmed that
radio-loud AGN dwell preferentially in brightest group and cluster
galaxies (BCGs), as opposed to other galaxies of the same stellar mass
(von der Linden et al. 2007; Bagchi & Kapahi 1994; Best et al. 2007; Valentijn & Bijleveld 1983). It has also been
found in these and other studies that the CC clusters are particularly
conducive for cD galaxies which are radio-loud, even though the
fraction of radio-loud cD galaxies in CC clusters varies from study to
study ranging from 70% to 95%
(Dunn & Fabian 2006; Burns 1990; Edwards et al. 2007). The spread in the fraction
between different studies can be attributed to the varying selection
criteria used for constructing cluster samples and the use of not so
up-to-date X-ray and radio observations. The latter effect may result
in the same cluster being identified as a CC cluster in some works and
a non-cool-core (NCC) cluster in others. A few examples being A1650,
which based on
![]() observations has been quoted as a NCC
cluster by Burns (1990), but which our data, based on
high-resolution
observations has been quoted as a NCC
cluster by Burns (1990), but which our data, based on
high-resolution
![]() observations (Hudson et al. 2008), clearly
reveal it to have a cool core with a central cooling time of about a
gigayear and a predicted mass deposition rate of about
100
observations (Hudson et al. 2008), clearly
reveal it to have a cool core with a central cooling time of about a
gigayear and a predicted mass deposition rate of about
100 ![]() yr -1 (also see Donahue et al. 2005). Similarly, A3158
and A3195 have been identified based on low-sensitivity and
low-resolution
yr -1 (also see Donahue et al. 2005). Similarly, A3158
and A3195 have been identified based on low-sensitivity and
low-resolution
![]() data as CC clusters by Edwards et al. (2007). Our
results imply otherwise; both are merging systems each with a central
cooling time longer than 12 Gyr and the expected mass deposition rates
being consistent with zero. Despite these inconsistencies, most
studies are by and large in agreement with one another and set the
average abundance of radio-loud CC clusters in the local Universe to
around 80%.
data as CC clusters by Edwards et al. (2007). Our
results imply otherwise; both are merging systems each with a central
cooling time longer than 12 Gyr and the expected mass deposition rates
being consistent with zero. Despite these inconsistencies, most
studies are by and large in agreement with one another and set the
average abundance of radio-loud CC clusters in the local Universe to
around 80%.
Recent analyses of galaxy clusters have shown that of those CC clusters which require heating, at least 40% harbor cavities that contain sufficient energy to balance the radiative losses (Dunn & Fabian 2006; Rafferty et al. 2008,2006; Nulsen et al. 2006). However, the details of the various heating mechanisms set into motion by the central AGN are not clear and are issues currently under investigation. Also, the local conditions in the ICM that lead to a quasi-steady state of gas deposition onto the central regions, and presumably onto the supermassive black hole, and the concomitant AGN heating of the ICM either periodically or continuously remain largely unknown. A parallel model that is emerging to explain the deviation of the observed cluster properties, especially the entropy profiles, from the predictions of the pure cooling model is linked to preheating or entropy injection at incipient stages of cluster formation, even prior to cluster collapse (McCarthy et al. 2007, and references therein). Preheating is entailed by reduction of central densities, hence, central luminosities, which leads to flat cluster entropy profiles. This modification along with post cluster-formation processes, namely radiative cooling and gravitational heating, provides a better match to the observed entropy profiles of galaxy clusters. Yet, while preheating may alone account for the differences in entropy profiles in NCC clusters, catastrophic cooling at small radii in CC clusters can still not be bypassed. In order to maintain their entropy profiles at observed levels, one or more additional sources of on-going heating are required.
In this work, we aim to gain a more comprehensive understanding of the AGN-regulated cooling and heating. We scrutinize the ways in which AGN heating is connected to the cooling of the ICM based solely on the total radio (synchrotron) output of the AGN. To achieve this goal, we use a sample of galaxy clusters for which there exist complete radio and X-ray data. We take our analysis further by examining the scaling relations between the BCG near-infrared luminosity and cluster parameters (mass and luminosity). We derive the mass of the supermassive black hole using the near-infrared bulge luminosity-black hole mass relation and inspect whether there is a relation between the black hole mass and AGN radio luminosity. These correlations are made taking into account the possibility of obtaining different relations depending on the cool or non-cool type cluster environment. The improvement over previous analyses lies in the quality of the cluster sample and of the available X-ray and radio observations.
We describe the sample in Sect. 2, giving details about
radio and X-ray data and related quantities in Sect. 2.1
and Sect. 2.2, respectively. The results are presented
in Sect. 3, including fractions of CC and NCC clusters
with and without central radio sources in Sect. 3.1, cooling and AGN activity in Sect. 3.2 and correlations of the BCG luminosity with radio and X-ray parameters in Sect. 3.3. We discuss our results in Sect. 4 and end with conclusions in Sect. 5. Throughout this paper, we assume the ![]() CDM concordance Universe with
H0 = h7171 km s-1 Mpc-1,
CDM concordance Universe with
H0 = h7171 km s-1 Mpc-1,
![]() and
and
![]() .
.
2 Our sample
The goal of this study is to cross-correlate the cooling activity with
the presence of a radio galaxy![]() cospatial
with the peak of the cooling flow region or, synonymously, the peak of
the X-ray emission. Further, we want to investigate whether there is a
special coupling between the AGN activity and its surrounding hot
cluster medium in CC clusters as compared to NCC clusters. This calls
for an objectively selected sample. Samples selected based on what is
available in public archives are subject to unknown selection effects
(``archive bias''). For example, the fraction of CC clusters in the
cospatial
with the peak of the cooling flow region or, synonymously, the peak of
the X-ray emission. Further, we want to investigate whether there is a
special coupling between the AGN activity and its surrounding hot
cluster medium in CC clusters as compared to NCC clusters. This calls
for an objectively selected sample. Samples selected based on what is
available in public archives are subject to unknown selection effects
(``archive bias''). For example, the fraction of CC clusters in the
![]() archive may be biased higher (or lower) than the same
fraction of clusters in the
archive may be biased higher (or lower) than the same
fraction of clusters in the
![]() archive. To this end, we conduct
our study based on the largest X-ray flux-limited sample, the
archive. To this end, we conduct
our study based on the largest X-ray flux-limited sample, the
![]() (Reiprich & Böhringer 2002) sample, selected from the ROSAT
All-Sky Survey outside the Galactic plane using the flux limit,
fx (0.1-2.4) keV
(Reiprich & Böhringer 2002) sample, selected from the ROSAT
All-Sky Survey outside the Galactic plane using the flux limit,
fx (0.1-2.4) keV
![]() erg s-1 cm-2. This sample comprises the 64 X-ray
brightest clusters and spans a redshift range
erg s-1 cm-2. This sample comprises the 64 X-ray
brightest clusters and spans a redshift range
![]() with the mean
with the mean
![]() .
All 64 clusters have
been observed with
.
All 64 clusters have
been observed with
![]() and all but one (A2244) have been
observed with
and all but one (A2244) have been
observed with
![]() to acquire high quality X-ray data. In this paper
we make use only of the
to acquire high quality X-ray data. In this paper
we make use only of the
![]() analysis because we are interested
in the cluster cores and
analysis because we are interested
in the cluster cores and
![]() has currently the best spatial
resolution (
has currently the best spatial
resolution (
![]() )
of any X-ray telescope. We note that since
flux-limited samples are as such biased towards clusters with high or
boosted luminosities, this sample might seem to favor CC clusters
preferentially over NCC clusters. At any given redshift, CC clusters
are more likely to be picked up than the NCC clusters due to their
enhanced central luminosities. However, merging clusters present the
same bias as cluster merger events entail temporal enhancements in the
global luminosities and temperatures (Ricker & Sarazin 2001). Since merging
clusters are mostly NCC clusters (Hudson et al. 2008; O'Hara et al. 2006), this may
balance out the former selection bias towards, at least, the strong (to be defined in Sect. 3.1 ) CC clusters. We
note that even in the presence of a bias against transition clusters
(neither strong CC clusters nor NCC), objectively selected samples,
such as
)
of any X-ray telescope. We note that since
flux-limited samples are as such biased towards clusters with high or
boosted luminosities, this sample might seem to favor CC clusters
preferentially over NCC clusters. At any given redshift, CC clusters
are more likely to be picked up than the NCC clusters due to their
enhanced central luminosities. However, merging clusters present the
same bias as cluster merger events entail temporal enhancements in the
global luminosities and temperatures (Ricker & Sarazin 2001). Since merging
clusters are mostly NCC clusters (Hudson et al. 2008; O'Hara et al. 2006), this may
balance out the former selection bias towards, at least, the strong (to be defined in Sect. 3.1 ) CC clusters. We
note that even in the presence of a bias against transition clusters
(neither strong CC clusters nor NCC), objectively selected samples,
such as
![]() ,
can be directly compared to simulated flux-limited
samples, at both low-z and high-z, and the bias may be calculated.
,
can be directly compared to simulated flux-limited
samples, at both low-z and high-z, and the bias may be calculated.
2.1 Radio data
We compiled and in many cases reanalyzed radio observations of all 64 clusters from either literature or archives (
![]() ,
NVSS, VLSS and MOST) to study the radio properties of the centrally located AGN in the
,
NVSS, VLSS and MOST) to study the radio properties of the centrally located AGN in the
![]() clusters. The data from the archives were processed in
the Astronomical Image Processing Software (AIPS) package provided by NRAO.
clusters. The data from the archives were processed in
the Astronomical Image Processing Software (AIPS) package provided by NRAO.
High-frequency archival radio data (500 MHz) were analyzed using the standard data-reduction procedures within AIPS, wherein the resulting map usually constituted of a single hybrid image. Low-frequency data (330 MHz and 74 MHz), in addition, were carefully analyzed to remove bad data affected by radio frequency interference (RFI) using the AIPS tasks, SPFLG and TVFLG. In case of pseudo-continuum mode observations, the effects of bandwidth smearing were tackled by keeping the data separate over the spectral channels. And lastly, in order to correct for 3D effects and image degradation due to bright sources far away from the phase-center, we employed the 3D-imaging feature embedded in the AIPS task, IMAGR. This technique of 3D imaging results in a mosaic of ``facets'', each of which is independently and simultaneously ``cleaned'' to yield a final map of the entire primary beam.
2.1.1 Location of a cluster radio source
Before pursuing the cross-correlation of the global X-ray properties
of our sample with the radio properties of cluster central radio
sources (CCRSs), we need to establish a criterion based on which to
identify central radio sources. Several works have presented evidence
for a special relationship between the cooling activity in cluster
cores and BCGs located within a certain distance to the X-ray peak.
Recently, Edwards et al. (2007) found in their study based on two
samples, the NFPS data set, an X-ray selected sample and the C4
catalog, an optically selected sample built from the SDSS, that only
those BCGs that lie within 70
h71-1 kpc of the X-ray peak of a
cooling flow cluster have significant line emission. Even though the
optical line emission observed in these BCGs can be inferred either as
a signature of AGN activity or star formation, Edwards et al. (2007)
also show that 74% of the strongly emitting BCGs in the SDSS sample,
defined as having the
![]() equivalent width >2 Å, have the
diagnostic emitting-line ratios characteristic of AGN activity (with a
likely higher fraction for the BCG). Therefore, the formal basis of
marking a radio source as ``central'' in the study presented here was
to have the AGN within 50
h71-1 kpc of the X-ray peak, a more
conservative limit than that proposed by Edwards et al. (2007). It is
noteworthy that this cut (as opposed to a more stringent cut of
12
h71-1 kpc, see below) had actually to be invoked only for four
clusters. These four clusters are A3562, A2142, A4038 and A3376 with
the X-ray peak and BCG separation as 30.4
h71-1 kpc,
21.8
h71-1 kpc, 14.9
h71-1 kpc and 14.2
h71-1 kpc,
respectively. For the rest of the sample, the flagging was straight
forward in that the separation between the X-ray peak and the radio
active BCG was less than 12
h71-1 kpc. The 12
h71-1 kpc as the
yardstick comes from the fact that since the
equivalent width >2 Å, have the
diagnostic emitting-line ratios characteristic of AGN activity (with a
likely higher fraction for the BCG). Therefore, the formal basis of
marking a radio source as ``central'' in the study presented here was
to have the AGN within 50
h71-1 kpc of the X-ray peak, a more
conservative limit than that proposed by Edwards et al. (2007). It is
noteworthy that this cut (as opposed to a more stringent cut of
12
h71-1 kpc, see below) had actually to be invoked only for four
clusters. These four clusters are A3562, A2142, A4038 and A3376 with
the X-ray peak and BCG separation as 30.4
h71-1 kpc,
21.8
h71-1 kpc, 14.9
h71-1 kpc and 14.2
h71-1 kpc,
respectively. For the rest of the sample, the flagging was straight
forward in that the separation between the X-ray peak and the radio
active BCG was less than 12
h71-1 kpc. The 12
h71-1 kpc as the
yardstick comes from the fact that since the
![]() clusters span
two orders of magnitude in redshift, the
clusters span
two orders of magnitude in redshift, the
![]() resolution implies
varying accuracies with which the X-ray peak may be determined for
different clusters and 12
h71-1 kpc corresponds to the worst
1-
resolution implies
varying accuracies with which the X-ray peak may be determined for
different clusters and 12
h71-1 kpc corresponds to the worst
1-![]() uncertainty. The separation between the BCG and the X-ray
peak for all 64 clusters is shown is Fig. 1. Applying
this criterion, we find a total of 48 clusters with centrally located
radio sources.
uncertainty. The separation between the BCG and the X-ray
peak for all 64 clusters is shown is Fig. 1. Applying
this criterion, we find a total of 48 clusters with centrally located
radio sources.
![\begin{figure}
\par\includegraphics[angle=-90,width=8.8cm,clip]{0836f1.eps}
\end{figure}](/articles/aa/full_html/2009/27/aa10836-08/img40.png) |
Figure 1: The separation between the BCG and the X-ray Peak. Plotted on the X-axis are numbers assigned to each cluster arbitrarily. The filled circles (blue) represent BCGs which harbor a radio source and the crosses (red) correspond to BCGs without one. The black horizontal line at y = 50 h71-1 kpc corresponds to the criterion for determining whether or not a cluster has a CRS and the grey horizontal line at y = 12 h71-1 kpc corresponds to the worst uncertainty associated with the position of the X-ray peak in the sample. |
| Open with DEXTER | |
2.1.2 Integrated radio luminosity of a CCRS
One of the primary concerns in accumulating the radio data was to have
a good spectral coverage, particularly, at the low-end of the radio
spectrum. Of the 48 CCRSs, 65% have radio data below 500 MHz and 46%
have radio data below 80 MHz. Low-frequency radio observations are
important to perform a full spectral analysis for these clusters for
two reasons. First, since the main contribution to the synchrotron
radio luminosity comes from the low-end of the radio frequency
spectrum, this will result in precise determination of the synchrotron
power in these systems. In our subsequent study, the energy in the
radio emitting particles will be compared to the mechanical energy of
the cavities, and thereby the partitioning of energy between radiation
and mechanical (cavity) energy can be measured. Second, with dense
enough spectral sampling, spectral breaks may also be visible (as have
already been seen in a few CCRSs in the
![]() sample, see
below). A spectral break in a system with cavities is an extremely
useful observable since it is representative of the time since the
last injection event or particle production, and therefore, a good
indicator of the age of the cavity emission. The CCRSs, which we
already know to show spectral breaks are presently being cross-checked
with presence of cavities for a future study.
sample, see
below). A spectral break in a system with cavities is an extremely
useful observable since it is representative of the time since the
last injection event or particle production, and therefore, a good
indicator of the age of the cavity emission. The CCRSs, which we
already know to show spectral breaks are presently being cross-checked
with presence of cavities for a future study.
For sources with no observations or confirmed detection below 100 MHz,
the low-end of their spectra were constrained using the 74 MHz
![]() Low-frequency Sky Survey (VLSS) with an average point-source detection
limit of 0.5 Jy/beam and a resolution of 80''. Shown in the left
panel of Fig. 2 are the spectra of all CCRSs.
Shown in the right panel of Fig. 2 are the
spectra of only a subset of CCRSs that show interesting features such
as spectral breaks and turn-overs indicative of spectral aging and
synchrotron self-absorption, respectively. Amongst the CCRSs shown in
the right panel, we note there are also a few clusters which show
spectral steepening at low-frequencies, which we believe is due to the
superposition of different radio components with different spectral
properties (due to varying sizes and distances from the central
engine).
Low-frequency Sky Survey (VLSS) with an average point-source detection
limit of 0.5 Jy/beam and a resolution of 80''. Shown in the left
panel of Fig. 2 are the spectra of all CCRSs.
Shown in the right panel of Fig. 2 are the
spectra of only a subset of CCRSs that show interesting features such
as spectral breaks and turn-overs indicative of spectral aging and
synchrotron self-absorption, respectively. Amongst the CCRSs shown in
the right panel, we note there are also a few clusters which show
spectral steepening at low-frequencies, which we believe is due to the
superposition of different radio components with different spectral
properties (due to varying sizes and distances from the central
engine).
The details of the radio data used for this work, such as the various
frequencies and the corresponding flux-densities used to estimate the
radio luminosities of the cluster central radio sources, along with
the references can be found in Table 1. The
synchrotron radiation is assumed to have a powerlaw spectrum given by
![]() ,
where
,
where ![]() is the flux density at
frequency
is the flux density at
frequency ![]() .
Thus, the integrated rest-frame radio luminosities,
.
Thus, the integrated rest-frame radio luminosities,
![]() ,
of the CCRSs were calculated by step-wise integration:
,
of the CCRSs were calculated by step-wise integration:

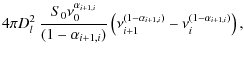
where S0 is the flux density of the radio source at either of the two rest-frame frequencies,
![\begin{figure}
\par\mbox{\includegraphics[angle=-90,width=9cm]{0836f2.eps}\includegraphics[angle=-90,width=9cm]{0836f3.eps} }\end{figure}](/articles/aa/full_html/2009/27/aa10836-08/img51.png) |
Figure 2: The radio spectra of the cluster central radio sources. Shown in the left panel are the spectra of all 48 CCRSs, where the symbols are the actual measurements. Most of the measurements at 74 MHz and 1.4 GHz are taken from VLSS and NVSS, respectively. Shown in the right panel are the spectra of only those CCRSs which show spectral curvature. The black horizontal solid line represents the VLSS point-source sensitivity constraint at the VLSS observing frequency of 74 MHz indicated by the black vertical line. |
| Open with DEXTER | |
Even though the formal errorbars for
![]() were derived using the
background root-mean-square in the maps, these do not take into
account the uncertainty arising due to the lack of knowledge of the
shape of the radio spectra down to the lowest frequencies, except for
a handful of radio sources well-studied at all radio-frequency
bands (such as, Hydra-A (A0780), Centaurus (A3526), A1795, A2029,
A2052, A2199, A2597 and A4059). Radio sources often show a spectral
turn-over at low-frequencies. This is attributed to synchrotron
self-absorption which kicks in with increasing optical depth and is
manifested by a rising spectrum with
were derived using the
background root-mean-square in the maps, these do not take into
account the uncertainty arising due to the lack of knowledge of the
shape of the radio spectra down to the lowest frequencies, except for
a handful of radio sources well-studied at all radio-frequency
bands (such as, Hydra-A (A0780), Centaurus (A3526), A1795, A2029,
A2052, A2199, A2597 and A4059). Radio sources often show a spectral
turn-over at low-frequencies. This is attributed to synchrotron
self-absorption which kicks in with increasing optical depth and is
manifested by a rising spectrum with
![]() .
Two examples of
spectral turn-overs can be easily seen in the right panel of
Fig. 2. Considering the possibility of other
CCRSs showing similar turn-overs, we calculated a lower-limit on
.
Two examples of
spectral turn-overs can be easily seen in the right panel of
Fig. 2. Considering the possibility of other
CCRSs showing similar turn-overs, we calculated a lower-limit on
![]() based on the assumption that the spectra of the CCRSs turn over right
below the lowest observed frequency. The difference between the lower
limit derived in this manner and the integrated radio luminosities
assuming the continual of the spectra beyond the lowest observed
frequency provides a more realistic, albeit conservative, uncertainty
on
based on the assumption that the spectra of the CCRSs turn over right
below the lowest observed frequency. The difference between the lower
limit derived in this manner and the integrated radio luminosities
assuming the continual of the spectra beyond the lowest observed
frequency provides a more realistic, albeit conservative, uncertainty
on
![]() .
This is the reason for having highly asymmetric errorbars
for
.
This is the reason for having highly asymmetric errorbars
for
![]() ,
as can also be seen in many of the plots.
,
as can also be seen in many of the plots.
In other works (e.g. Peres et al. 1998; Burns 1990), very often the
comparisons between the quantities representing the cooling flow
strength in clusters and the radio power of the BCGs are based solely
on the monochromatic radio luminosities, such as, the 1.4 GHz
luminosities derived from NVSS or FIRST or 5 GHz luminosities derived
from the Green Bank Survey. A useful exercise followed up with our
data was to compare the integrated radio luminosities to
![]() ,
where the latter is given by
,
where the latter is given by
where
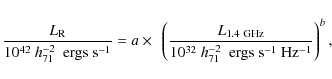
where
![\begin{figure}
\par\includegraphics[width=9cm]{0836f4.eps}
\end{figure}](/articles/aa/full_html/2009/27/aa10836-08/img59.png) |
Figure 3:
A comparison between the radio luminosity integrated between 10 MHz and 15 GHz and the monochromatic radio luminosity at 1.4 GHz (red solid line). The dotted grey lines correspond to 1- |
| Open with DEXTER | |
2.2 X-ray data
The complete
![]() sample has
sample has
![]() observations and the data have been homogeneously reprocessed using CIAO 3.2.2 and CALDB 3.0. For a detailed description of the X-ray data-reduction, and data- and error-analysis, the reader is referred to Hudson et al. (2008). In the following we briefly describe only those cluster X-ray parameters that are meaningful in the context of the present work.
observations and the data have been homogeneously reprocessed using CIAO 3.2.2 and CALDB 3.0. For a detailed description of the X-ray data-reduction, and data- and error-analysis, the reader is referred to Hudson et al. (2008). In the following we briefly describe only those cluster X-ray parameters that are meaningful in the context of the present work.
2.2.1 Cluster parameters
We extracted the central density profiles by fitting either a single
or double ![]() -model to the surface-brightness profile annuli.
Similarly, the central temperature profiles were derived by fitting
spectra to annuli to an absorbed thermal model. From the temperature
and density profiles, the central cooling time at
-model to the surface-brightness profile annuli.
Similarly, the central temperature profiles were derived by fitting
spectra to annuli to an absorbed thermal model. From the temperature
and density profiles, the central cooling time at
![]() (0.4%
(0.4%
![]() ),
),
![]() ,
entropy, K, and cuspiness,
,
entropy, K, and cuspiness, ![]() ,
were calculated as per the following expressions:
,
were calculated as per the following expressions:
where
To derive the cluster entropy profiles, the best fit density profiles were binned in steps of 2''. Then for each bin, the value of temperature corresponding to that radius was adopted to calculate the entropy for that bin using the expression in Eq. (4). Since the annuli created to derive the temperature profiles need not necessarily coincide with the 2''density bins, in the case where there was a jump in the temperature within a density bin, the average value of the two temperatures was used.
The virial temperature of the cluster, used as a scaling parameter in some of
the cross-correlations presented in the forthcoming sections, was determined
by fitting the temperature profiles to broken powerlaws. This was done so as
to prevent the cool-core gas from biasing the estimate for the global ``viral''
temperature,
![]() .
In those cases, where the inner powerlaw had a declining
slope towards the center, which is representative of the cool gas at the
centers of CC clusters, we excluded the core region as determined from the
break in the powerlaw from the fit. From the estimate of
.
In those cases, where the inner powerlaw had a declining
slope towards the center, which is representative of the cool gas at the
centers of CC clusters, we excluded the core region as determined from the
break in the powerlaw from the fit. From the estimate of
![]() ,
the virial
mass,
,
the virial
mass,
![]() ,
within
,
within
![]() was determined using the relation by Finoguenov et al. (2001),
was determined using the relation by Finoguenov et al. (2001),
![]() ,
where
,
where
![]() h
71-1 and
h
71-1 and
![]() .
.
The classical mass deposition rates,
![]() ,
were derived from the gas
temperature and density profiles.
,
were derived from the gas
temperature and density profiles.
![]() is the ratio of the total gas
mass within the cooling radius,
is the ratio of the total gas
mass within the cooling radius,
![]() ,
defined as the region at which
the
,
defined as the region at which
the
![]() Gyr, to the cooling time at this radius. Hence,
Gyr, to the cooling time at this radius. Hence,
![]() is a measure of the rate at
which the mass should be dropping out of the X-ray band provided there
is no source of heating. As the main focus for this work is on the
central parts of clusters where cooling is most dominant, the X-ray
analysis was performed only for the core regions.
is a measure of the rate at
which the mass should be dropping out of the X-ray band provided there
is no source of heating. As the main focus for this work is on the
central parts of clusters where cooling is most dominant, the X-ray
analysis was performed only for the core regions.
3 Results
3.1 CC and NCC cluster fractions: With and without a central radio source
A well-known problem related to cooling-flows has been that of
choosing an apt diagnostic for determining a cool-core cluster. To
separate out the cool-core clusters from the non-cool-core ones,
Hudson et al. (2008) searched for a bimodality in several of the X-ray
observed and derived quantities, such as, the central cooling time,
![]() ,
the cooling radius defined as the radius out to which
,
the cooling radius defined as the radius out to which
![]() Gyr, the central entropy, the central density, the central
luminosity, the mass deposition rate, the central temperature drop and
the slope in surface brightness profile, wherein ``central'' refers to
Gyr, the central entropy, the central density, the central
luminosity, the mass deposition rate, the central temperature drop and
the slope in surface brightness profile, wherein ``central'' refers to
![]() (0.4% of
(0.4% of
![]() ). Based on the K-Mean Method (KMM)
algorithm (Ashman et al. 1994) as a test for bimodality (or tri-modality) in the parameters, Hudson et al. (2008) found
). Based on the K-Mean Method (KMM)
algorithm (Ashman et al. 1994) as a test for bimodality (or tri-modality) in the parameters, Hudson et al. (2008) found
![]() as the best measure for cooling to divide the CC and NCC clusters.
as the best measure for cooling to divide the CC and NCC clusters.
![\begin{figure}
\par\includegraphics[angle=-90,width=9cm,clip]{0836f5.eps}
\end{figure}](/articles/aa/full_html/2009/27/aa10836-08/img79.png) |
Figure 4: The central cooling-time distribution clearly showing the steep rise in the fraction of clusters with cooling times shorter than 1 Gyr. For clarity, we show the distribution in both linear as well as log scale (inset panel) on the x-axis. |
| Open with DEXTER | |
The
![]() -distribution histogram shown in Fig. 4
shows a peculiarity in that the distribution is marked by a sharp
increase at
-distribution histogram shown in Fig. 4
shows a peculiarity in that the distribution is marked by a sharp
increase at
![]() Gyr; the fraction of clusters with
Gyr; the fraction of clusters with
![]() Gyr
being 44%. This oddity at
Gyr
being 44%. This oddity at
![]() Gyr is also visible in two other
properties, (1) the central temperature drop shown in the left panel
of Fig. 5, defined as the ratio of the temperature in
the innermost region to the virial temperature; and (2) the slope in
the surface brightness profile, the ``cuspiness'', shown in the right
panel of Fig. 5. Both the quantities show a break
around a central cooling time of
Gyr is also visible in two other
properties, (1) the central temperature drop shown in the left panel
of Fig. 5, defined as the ratio of the temperature in
the innermost region to the virial temperature; and (2) the slope in
the surface brightness profile, the ``cuspiness'', shown in the right
panel of Fig. 5. Both the quantities show a break
around a central cooling time of
![]() Gyr, even though the
decrease in the central temperature drop is much more pronounced than
the increase in the cuspiness. This result is also in concert with the
recent findings of Rafferty et al. (2008), who investigated the relation
between star formation, cooling activity in the ICM and AGN heating,
based on a sample of 47 cluster center dominant galaxies (CDGs).
According to their study, only the CDGs with cooling times below
0.8 Gyr exhibit positive color gradients, signifying an increase in
star formation with decreasing distance from the galaxy center. The
underlying reason for this behavior is not yet clear. It may be that
the cool gas at the centers of galaxy clusters is feeding the star
formation, in which case the short cooling times should be tied with
the time-scale over which the stars form and their light declines. It
may well also be that AGN activity at the center of mass flows
triggers star formation at the central regions. If the AGN feedback is
responsible for regulating the cooling flows in clusters, then the
cooling time-scale may possibly reflect an intimate link with the time
scale of the AGN outbursts (Sect. 4).
Gyr, even though the
decrease in the central temperature drop is much more pronounced than
the increase in the cuspiness. This result is also in concert with the
recent findings of Rafferty et al. (2008), who investigated the relation
between star formation, cooling activity in the ICM and AGN heating,
based on a sample of 47 cluster center dominant galaxies (CDGs).
According to their study, only the CDGs with cooling times below
0.8 Gyr exhibit positive color gradients, signifying an increase in
star formation with decreasing distance from the galaxy center. The
underlying reason for this behavior is not yet clear. It may be that
the cool gas at the centers of galaxy clusters is feeding the star
formation, in which case the short cooling times should be tied with
the time-scale over which the stars form and their light declines. It
may well also be that AGN activity at the center of mass flows
triggers star formation at the central regions. If the AGN feedback is
responsible for regulating the cooling flows in clusters, then the
cooling time-scale may possibly reflect an intimate link with the time
scale of the AGN outbursts (Sect. 4).
![\begin{figure}
\par\mbox{\includegraphics[angle=-90,width=9cm]{0836f6.eps} \includegraphics[angle=-90,width=9cm]{0836f7.eps} }
\end{figure}](/articles/aa/full_html/2009/27/aa10836-08/img80.png) |
Figure 5:
Cooling time as an indicator of cool core. Left: the central temperature drop. Right: the slope in the surface brightness profile, cuspiness, at |
| Open with DEXTER | |
Based on the above results, we divided our sample into three
categories, (1) strong cool-core (SCC) clusters with
![]() Gyr,
(2) weak cool-core (WCC) clusters with 1 Gyr
Gyr,
(2) weak cool-core (WCC) clusters with 1 Gyr
![]() Gyr (the
upper limit of 7.7 Gyr is the usually assumed value for the cooling
time corresponding to z=1, signifying the lookback time since the
last major heating event, see McNamara & Nulsen 2007)
and (3) non-cool-core (NCC) clusters with
Gyr (the
upper limit of 7.7 Gyr is the usually assumed value for the cooling
time corresponding to z=1, signifying the lookback time since the
last major heating event, see McNamara & Nulsen 2007)
and (3) non-cool-core (NCC) clusters with
![]() Gyr. These cuts result in 44% SCC clusters, 28% WCC clusters and 28% NCC clusters. The need to divide the distribution into three subgroups is bolstered by the fact that the KMM test showed adding a third sub-group improved the likelihood ratio, giving rise to a tri-modal distribution.
Gyr. These cuts result in 44% SCC clusters, 28% WCC clusters and 28% NCC clusters. The need to divide the distribution into three subgroups is bolstered by the fact that the KMM test showed adding a third sub-group improved the likelihood ratio, giving rise to a tri-modal distribution.
On cross-correlating the clusters with the presence of a CCRS, we find
that all SCC clusters show cluster-center radio sources
(Fig. 6). The resulting fraction of CCRSs amongst
WCC clusters is 67% and that in NCC clusters is 45%. A
non-negligible fraction of CCRSs in the WCC and NCC cluster population
makes it uncertain whether there is a fundamental one-to-one
correspondence between AGN heating and the lack of the expected
cluster cooling. On the other hand, the probability of a BCG
manifesting AGN activity clearly increases with decreasing cooling
time. The next question that then arises is whether the radio
luminosity of the central cluster radio source itself is correlated
with
![]() .
This is shown in Fig. 7 for SCC
clusters and WCC clusters. From hereon, we refer to the combined set
of SCC and WCC clusters as the cool-core (CC) clusters. This plot does
not present a straight-forward interpretation of the interdependence
between the AGN synchrotron power and the cooling time-scale. As a
whole, there seems to be an anti-correlation between the two
quantities but this seems to break down for clusters with
.
This is shown in Fig. 7 for SCC
clusters and WCC clusters. From hereon, we refer to the combined set
of SCC and WCC clusters as the cool-core (CC) clusters. This plot does
not present a straight-forward interpretation of the interdependence
between the AGN synchrotron power and the cooling time-scale. As a
whole, there seems to be an anti-correlation between the two
quantities but this seems to break down for clusters with
![]() Gyr. This apparent anti-correlation could be indicative
of a need for more powerful AGN as heating agents in clusters with
short
Gyr. This apparent anti-correlation could be indicative
of a need for more powerful AGN as heating agents in clusters with
short
![]() .
Yet the absence of any correlation between the
.
Yet the absence of any correlation between the
![]() and
and
![]() at short cooling times (<Gyr) implies that the AGN luminosity
is more sensitive to a physical quantity other than the gas cooling
time, such as possibly the mass deposition rate,
at short cooling times (<Gyr) implies that the AGN luminosity
is more sensitive to a physical quantity other than the gas cooling
time, such as possibly the mass deposition rate,
![]() (see
Sect. 3.2).
(see
Sect. 3.2).
Shown as crosses in Fig. 7 are four systems,
NGC4646, NGC1550, NGC5044 and MKW4, which clearly depart from this
trend and all of which are groups. A general property that the groups
in our sample seem to share is that apart from having low temperatures
(both virial and central), they also all have high central densities
and subsequently short
![]() (see Eq. (4)). On the other hand,
the groups tend to have very steep density gradients resulting in
small classical mass deposition rates,
(see Eq. (4)). On the other hand,
the groups tend to have very steep density gradients resulting in
small classical mass deposition rates,
![]() .
In other words,
.
In other words,
![]() is more sensitive to the mass encompassed within the integration
radius (see Sect. 2.2.1) than the cooling time at
that radius [also see Fig. 6(G) of Hudson et al. 2008]. The
behavior of
is more sensitive to the mass encompassed within the integration
radius (see Sect. 2.2.1) than the cooling time at
that radius [also see Fig. 6(G) of Hudson et al. 2008]. The
behavior of
![]() versus
versus
![]() is investigated in
Sect. 3.2. The fourth outlier, MKW4, is an
interesting cluster under intensive study at radio wavelengths (see
Sect. 3.3.1). Assuming the anti-correlation interpretation is
correct, the best fit powerlaw excluding the four outliers derived
using the bisector linear regression routine, BCES from
Akritas & Bershady (1996) is
is investigated in
Sect. 3.2. The fourth outlier, MKW4, is an
interesting cluster under intensive study at radio wavelengths (see
Sect. 3.3.1). Assuming the anti-correlation interpretation is
correct, the best fit powerlaw excluding the four outliers derived
using the bisector linear regression routine, BCES from
Akritas & Bershady (1996) is
This routine, like FITEXY, includes uncertainties in both the quantities but also additionally performs the minimization in both the dimensions. The Spearman rank correlation coefficient is -0.63 and the probability for the null-hypothesis is
For comparison with other works, we also determined the fraction of
CCRSs in CC clusters, the fraction being 87%. This is consistent with
the result of Dunn & Fabian (2006), who analyzed a low-redshift sample of
clusters (B55) selected from pre-
![]() data. Even though they find
a slightly higher fraction (95%) of CC clusters with CCRSs, they used
a lower cut in
data. Even though they find
a slightly higher fraction (95%) of CC clusters with CCRSs, they used
a lower cut in
![]() to determine CC clusters and, additionally, selected only those clusters which showed a central temperature drop >2. Using these criteria reduces the fraction of CC clusters in our sample to 25% but increases the fraction of CCRSs in CC clusters to 100%. Similarly, Burns (1990) finds a somewhat lower fraction of 70% but the classification into CC and NCC clusters therein is based on the Hubble time. Using the Hubble time as the cut in
to determine CC clusters and, additionally, selected only those clusters which showed a central temperature drop >2. Using these criteria reduces the fraction of CC clusters in our sample to 25% but increases the fraction of CCRSs in CC clusters to 100%. Similarly, Burns (1990) finds a somewhat lower fraction of 70% but the classification into CC and NCC clusters therein is based on the Hubble time. Using the Hubble time as the cut in
![]() increases the fraction of CC clusters in our sample to 89% and reduces the fraction of CCRSs in CC clusters to 78%. We also bear in mind that the result by Burns (1990) is based on an incomplete sample and old X-ray
increases the fraction of CC clusters in our sample to 89% and reduces the fraction of CCRSs in CC clusters to 78%. We also bear in mind that the result by Burns (1990) is based on an incomplete sample and old X-ray
![]() data. Furthermore, the radio data used by Burns (1990) are based on monochromatic 5 GHz VLA observations sensitive to largest structures of only about an arcminute, which in some cases might lead to over-resolved structures
and, hence, an under-estimation of the radio luminosity.
data. Furthermore, the radio data used by Burns (1990) are based on monochromatic 5 GHz VLA observations sensitive to largest structures of only about an arcminute, which in some cases might lead to over-resolved structures
and, hence, an under-estimation of the radio luminosity.
3.2 Cooling and AGN activity
We looked for correlations between the radio luminosity of the CCRSs and the X-ray-derived quantities to allow us to identify the underlying mechanisms that link the AGN activity and the cooling properties in clusters.
Shown in the left panel of Fig. 8 is the
bolometric X-ray cluster luminosity in the energy range 0.01-40 keV
as inferred from
![]() and
and
![]() measurements
(Reiprich & Böhringer 2002),
measurements
(Reiprich & Böhringer 2002),
![]() ,
versus the integrated radio luminosity
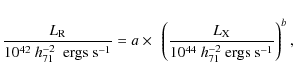
(see Sect. 2.1.2) for the 48 clusters with CCRSs. For the SCC clusters, shown as filled (blue) circles, there is a clear positive trend visible, although with a considerable spread. Since the X-ray luminosity is related through scaling relations to other global parameters of a cluster, such as the
,
versus the integrated radio luminosity
(see Sect. 2.1.2) for the 48 clusters with CCRSs. For the SCC clusters, shown as filled (blue) circles, there is a clear positive trend visible, although with a considerable spread. Since the X-ray luminosity is related through scaling relations to other global parameters of a cluster, such as the
![]() and cluster mass, similar correlations may be obtained between the radio power of a CCRS and these quantities. This is the first time that the radio power of a centrally located AGN, the prime candidate for counteracting the cooling of the X-ray radiating ICM gas, has been shown to be correlated with the large-scale cluster properties. This result implies that there is a link between two regions, vastly differing in scales; the region over which AGN accretion takes place, which is no more than a few hundredth of a parsec, and the ICM, which extends out to 1-2 megaparsecs. Using the two-dimensional bisector linear regression routine BCES, the trend between the
and cluster mass, similar correlations may be obtained between the radio power of a CCRS and these quantities. This is the first time that the radio power of a centrally located AGN, the prime candidate for counteracting the cooling of the X-ray radiating ICM gas, has been shown to be correlated with the large-scale cluster properties. This result implies that there is a link between two regions, vastly differing in scales; the region over which AGN accretion takes place, which is no more than a few hundredth of a parsec, and the ICM, which extends out to 1-2 megaparsecs. Using the two-dimensional bisector linear regression routine BCES, the trend between the
![]() and
and
![]() for SCC clusters may be quantified as below:
for SCC clusters may be quantified as below:
where
Note that luminosity-luminosity plots should be considered with
caution due to the common redshift-dependence in both the quantities
(Akritas & Siebert 1996; Merloni et al. 2006; Kembhavi et al. 1986). Even though there are
no censored data points (upper limits) for the category of SCC
clusters, in that every SCC has radio source at the center, spurious
correlation may still be introduced due to the common dependence on
the distance. In order to check for such an occurrence, we simulated
randomized radio and X-ray luminosities confined to the observed
ranges following the distributions,
![]() (Böhringer et al. 2002) and
(Böhringer et al. 2002) and
![]() (Nagar et al. 2005), where n is the source number
density. We assigned randomly distributed redshifts to the randomized
luminosity data sets, according to the law
(Nagar et al. 2005), where n is the source number
density. We assigned randomly distributed redshifts to the randomized
luminosity data sets, according to the law
![]() .
These
luminosities were re-observed after applying the X-ray flux limit,
fx (0.1-2.4) keV
.
These
luminosities were re-observed after applying the X-ray flux limit,
fx (0.1-2.4) keV
![]() erg s-1 cm-2, the same as that for the
erg s-1 cm-2, the same as that for the
![]() sample, and the radio flux limit, 1.5 mJy the average point-source
detection limit for NVSS. The resulting Pearson correlation
coefficients,
sample, and the radio flux limit, 1.5 mJy the average point-source
detection limit for NVSS. The resulting Pearson correlation
coefficients,
![]() ,
were compared to the observed one.
Based on these simulations, we compute the probability of having
,
were compared to the observed one.
Based on these simulations, we compute the probability of having
![]() and the correlation slope equal to or greater
than that observed for a completely randomized set of X-ray and radio
luminosities as less than 1% (a spuriously induced correlation
should produce a slope of around unity). This fraction increases to
and the correlation slope equal to or greater
than that observed for a completely randomized set of X-ray and radio
luminosities as less than 1% (a spuriously induced correlation
should produce a slope of around unity). This fraction increases to
![]() 2.5% if instead the Spearman correlation coefficient is used
and, if in addition, the observed probability of null hypothesis is
used as a further constraint, i.e., the probability of null
hypothesis for the simulated data sets should be lower than
2.5% if instead the Spearman correlation coefficient is used
and, if in addition, the observed probability of null hypothesis is
used as a further constraint, i.e., the probability of null
hypothesis for the simulated data sets should be lower than
![]() ,
then this fraction decreases to
,
then this fraction decreases to ![]() 1.5%. Thus,
we conclude that the probability of the observed correlation between
the cluster X-ray luminosity and the radio luminosity of a CCRS to be
spurious is very unlikely. However, that such an induced correlation
is possible at a level of
1.5%. Thus,
we conclude that the probability of the observed correlation between
the cluster X-ray luminosity and the radio luminosity of a CCRS to be
spurious is very unlikely. However, that such an induced correlation
is possible at a level of ![]() 3% in the worst case scenario, is
worth keeping in mind for past and future studies on similar topics.
3% in the worst case scenario, is
worth keeping in mind for past and future studies on similar topics.
![\begin{figure}
\par\includegraphics[angle=-90,width=7cm,clip]{0836f8.eps}
\end{figure}](/articles/aa/full_html/2009/27/aa10836-08/img94.png) |
Figure 6:
The fraction of strong cool-core (SCC) clusters,
weak cool-core (WCC) clusters and non-cool-core (NCC)
clusters in the
|
| Open with DEXTER | |
![\begin{figure}
\par\includegraphics[width=9cm,clip]{0836f9.eps} %\end{figure}](/articles/aa/full_html/2009/27/aa10836-08/img95.png) |
Figure 7:
The central cooling-time versus the integrated radio
luminosity for the CCRSs in CC clusters (SCC + WCC). The black
solid line represents the anti-correlation trend which breaks down
for clusters with
|
| Open with DEXTER | |
Shown in the right panel of Fig. 8 is the radio
luminosity versus
![]() .
This plot shows an even stronger trend than
that seen with
.
This plot shows an even stronger trend than
that seen with
![]() .
This further strengthens the likelihood of a
coupling between gas cooling and the magnitude of the AGN activity.
The NCC clusters do not appear on this plot since these by definition
have no cooling radius, that is the central cooling time for these
clusters is greater than 7.7 Gyr, implying zero mass deposition rates.
.
This further strengthens the likelihood of a
coupling between gas cooling and the magnitude of the AGN activity.
The NCC clusters do not appear on this plot since these by definition
have no cooling radius, that is the central cooling time for these
clusters is greater than 7.7 Gyr, implying zero mass deposition rates.
There are two interesting subsets of clusters pertaining to the right
panel of Fig. 8, which deserve attention. The
first subset comprises clusters which lack a CCRS but have
![]() ,
and the second subset, not shown in
Fig. 8, comprises clusters which have a CCRS but
for which
,
and the second subset, not shown in
Fig. 8, comprises clusters which have a CCRS but
for which
![]() .
The former subset (denoted by black triangles in
Fig. 8) consists of: A1650, A2589, A2657 and
A1060, with mass deposition rates (
.
The former subset (denoted by black triangles in
Fig. 8) consists of: A1650, A2589, A2657 and
A1060, with mass deposition rates (
![]() ,
(
,
(
![]() ,
(
,
(
![]() and
(
and
(
![]() respectively. In order to understand the behavior
of the above four clusters, which are all WCC clusters, and to find
out whether there exists a quantity that separates them from the other
WCC clusters with a central radio source, we examined the
entropy profiles of these clusters. Entropy is a powerful tool which
provides information about two cluster parameters simultaneously - the
temperature and the density;
K(r) = kT(r)n(r)-2/3, where r is
the radius from the cluster center. Shown in
Fig. 9 are the entropy files of all but two WCC
clusters. The two exceptions are A3266 and A3667, which have no CCRS
but also have classical mass deposition rates consistent with zero. In
other words, these are cases at the border line between WCC and NCC clusters and have, therefore, been excluded from Fig. 9. As can be seen, the entropy profiles of these four clusters (shown as color curves with symbols other than ``+'' symbols) are in no sense different from the rest. If anything, the profiles of A1650, A2589 and A1060 seem to continue to fall with decreasing clustercentric distance. This implies a steady increase in the gas density with decreasing radius in these clusters and, hence, relatively strong cooling. What is the source of heating in these clusters?
respectively. In order to understand the behavior
of the above four clusters, which are all WCC clusters, and to find
out whether there exists a quantity that separates them from the other
WCC clusters with a central radio source, we examined the
entropy profiles of these clusters. Entropy is a powerful tool which
provides information about two cluster parameters simultaneously - the
temperature and the density;
K(r) = kT(r)n(r)-2/3, where r is
the radius from the cluster center. Shown in
Fig. 9 are the entropy files of all but two WCC
clusters. The two exceptions are A3266 and A3667, which have no CCRS
but also have classical mass deposition rates consistent with zero. In
other words, these are cases at the border line between WCC and NCC clusters and have, therefore, been excluded from Fig. 9. As can be seen, the entropy profiles of these four clusters (shown as color curves with symbols other than ``+'' symbols) are in no sense different from the rest. If anything, the profiles of A1650, A2589 and A1060 seem to continue to fall with decreasing clustercentric distance. This implies a steady increase in the gas density with decreasing radius in these clusters and, hence, relatively strong cooling. What is the source of heating in these clusters?
![\begin{figure}
\par\mbox{\includegraphics[angle=-90,width=9cm]{0836f10.eps}\includegraphics[angle=-90,width=9cm]{0836f11.eps} }\end{figure}](/articles/aa/full_html/2009/27/aa10836-08/img103.png) |
Figure 8:
Radio and X-ray correlation plots. Left:
total radio luminosity vs.
|
| Open with DEXTER | |
![\begin{figure}
\par\includegraphics[angle=-90, width=8.8cm,clip]{0836f12.eps}
\end{figure}](/articles/aa/full_html/2009/27/aa10836-08/img104.png) |
Figure 9: The entropy profiles of the WCC clusters. All with a central radio source are shown in black (plus) symbols and four without are shown in colored (non-plus) symbols. The errorbars on those with a central radio source are omitted for clarity. The strong jumps apparent in some of the entropy profiles are insignificant relative to the errorbars. |
| Open with DEXTER | |
Donahue et al. (2005) investigated one of the above radio-quiet CC clusters, A1650, using
![]() observations and proffered one of the following two explanations for the absence of a radio AGN at the cluster center; (1) either the cluster has not reached the point where
heating is necessary; or (2) the cluster experienced a major heating
event about 1 Gyr ago such that it has not required feedback since
then. Their conclusions are based on a lack of central temperature
gradient in A1650 and a markedly raised central entropy as compared to
other CC clusters with radio emission. Although the
observations and proffered one of the following two explanations for the absence of a radio AGN at the cluster center; (1) either the cluster has not reached the point where
heating is necessary; or (2) the cluster experienced a major heating
event about 1 Gyr ago such that it has not required feedback since
then. Their conclusions are based on a lack of central temperature
gradient in A1650 and a markedly raised central entropy as compared to
other CC clusters with radio emission. Although the
![]() observations used by us (including
observations used by us (including ![]() 200 ks that became publicly available in 2008) also imply an insignificant central temperature drop (
200 ks that became publicly available in 2008) also imply an insignificant central temperature drop (
![]() ), the estimated central entropy is not any higher than the average central entropy of the rest of the WCC clusters (Fig. 9).
), the estimated central entropy is not any higher than the average central entropy of the rest of the WCC clusters (Fig. 9).
Although, all of the above four clusters pose a serious threat to the
AGN-regulated feedback fabric in cool-core clusters, A1650 is most
intriguing due to a high value of discrepancy between the expected and
measured mass deposition rates [
![]() and
and
![]() ,
where
,
where
![]()
![]() is the
spectral mass deposition rate]. Interestingly, that there has been a
mention of a weak detection of a radio source at the center of A1650
by Dunn & Fabian (2006), which in turn is based on the
is the
spectral mass deposition rate]. Interestingly, that there has been a
mention of a weak detection of a radio source at the center of A1650
by Dunn & Fabian (2006), which in turn is based on the
![]() detection at
327 MHz by Markovic et al. (2004), who give the total flux-density of the
radio source at this frequency as 59 mJy. But we have been unable to
re-confirm this claim using the same observations as used by
Markovic et al. (2004) down to 3 mJy, three times the background noise.
As also pointed out by Donahue et al. (2005), there is neither an
indication of a past AGN outburst, either in the form of
low-brightness diffuse lobe emission or cavities in the X-ray
emission, nor are there any signatures of a recent merger. This
cluster, along with its three companions, deserves further study in
order to analyze other possible sources of heating such as conduction,
intracluster supernovae or preheating.
detection at
327 MHz by Markovic et al. (2004), who give the total flux-density of the
radio source at this frequency as 59 mJy. But we have been unable to
re-confirm this claim using the same observations as used by
Markovic et al. (2004) down to 3 mJy, three times the background noise.
As also pointed out by Donahue et al. (2005), there is neither an
indication of a past AGN outburst, either in the form of
low-brightness diffuse lobe emission or cavities in the X-ray
emission, nor are there any signatures of a recent merger. This
cluster, along with its three companions, deserves further study in
order to analyze other possible sources of heating such as conduction,
intracluster supernovae or preheating.
The second subset corresponding to clusters with zero classical mass
deposition rates but which contain a CCRS consists of: A3391, A3395s,
A3376, A0400, A1656, A3158, A2147, MKW8 (in decreasing order of
![]() ). These are NCC by definition and show signs of cluster mergers
at different stages, as do most of the other NCC clusters in our
sample (Hudson et al. 2008), based either on their X-ray
properties (presence of subclumps or non-negligible separation between
the X-ray emission peak and emission weighted centroid) or radio
properties (presence of radio halos or relics or both). But contrary
to the clusters in this subset, the remaining NCC clusters are devoid
of a central radio source, supporting the idea that the presence of
AGN is tightly correlated to gas cooling in clusters. The obvious
question that then surfaces is, how does this subset fit into the
AGN-heating and gas-cooling machinery? There are several solutions to
this apparent contradiction. Firstly, a well-known fact - AGN are
found at all locations in clusters and not only at the cluster centers
(although with an increasing probability with decreasing clustercentric distance, see Morrison & Owen 2003; Best et al. 2007). There also
exist field-AGN with no apparent reservoir of bulk cool gas, such as
is available in clusters. Hence, there evidently are mechanisms other
than those related to cluster cooling that can trigger radio nuclear
activity in galaxies. Secondly, there is evidence that mergers may
play a role in activating the central engines of AGN by transferring
gas to the cluster galaxies and providing material for both, AGN
accretion and also star formation (Owen et al. 1999). But alongside
there also are contradictory findings according to which mergers may
as well strip away gas from galaxies and result in inhibition of both
the processes (e.g. see Giacintucci et al. 2004). Thirdly, a configuration
containing a NCC cluster with zero mass deposition rate and a central
radio source may be obtained through a merger between a NCC cluster
and a CC cluster, latter harboring a central AGN, in such a way that
it results in disruption of the cool core and leaves behind only
traces of the past cooling activity. The simulations of
Burns et al. (2008) indeed show that NCC clusters are formed as a result
of major mergers right at the beginning of their evolution, whereby
they grow in time at the expense of CC clusters. As an example, A2634
is a WCC cluster based on the central cooling time but in most other
respects is closer to being a NCC cluster than a WCC
cluster. According to Hudson et al. (2008), the X-ray morphology of this
cluster is consistent with that of a merging cluster. Yet it has a
cool core (short
). These are NCC by definition and show signs of cluster mergers
at different stages, as do most of the other NCC clusters in our
sample (Hudson et al. 2008), based either on their X-ray
properties (presence of subclumps or non-negligible separation between
the X-ray emission peak and emission weighted centroid) or radio
properties (presence of radio halos or relics or both). But contrary
to the clusters in this subset, the remaining NCC clusters are devoid
of a central radio source, supporting the idea that the presence of
AGN is tightly correlated to gas cooling in clusters. The obvious
question that then surfaces is, how does this subset fit into the
AGN-heating and gas-cooling machinery? There are several solutions to
this apparent contradiction. Firstly, a well-known fact - AGN are
found at all locations in clusters and not only at the cluster centers
(although with an increasing probability with decreasing clustercentric distance, see Morrison & Owen 2003; Best et al. 2007). There also
exist field-AGN with no apparent reservoir of bulk cool gas, such as
is available in clusters. Hence, there evidently are mechanisms other
than those related to cluster cooling that can trigger radio nuclear
activity in galaxies. Secondly, there is evidence that mergers may
play a role in activating the central engines of AGN by transferring
gas to the cluster galaxies and providing material for both, AGN
accretion and also star formation (Owen et al. 1999). But alongside
there also are contradictory findings according to which mergers may
as well strip away gas from galaxies and result in inhibition of both
the processes (e.g. see Giacintucci et al. 2004). Thirdly, a configuration
containing a NCC cluster with zero mass deposition rate and a central
radio source may be obtained through a merger between a NCC cluster
and a CC cluster, latter harboring a central AGN, in such a way that
it results in disruption of the cool core and leaves behind only
traces of the past cooling activity. The simulations of
Burns et al. (2008) indeed show that NCC clusters are formed as a result
of major mergers right at the beginning of their evolution, whereby
they grow in time at the expense of CC clusters. As an example, A2634
is a WCC cluster based on the central cooling time but in most other
respects is closer to being a NCC cluster than a WCC
cluster. According to Hudson et al. (2008), the X-ray morphology of this
cluster is consistent with that of a merging cluster. Yet it has a
cool core (short
![]() ), and so A2634 might be a strong candidate for
such a case where the cool core is being destroyed by a major merger.
), and so A2634 might be a strong candidate for
such a case where the cool core is being destroyed by a major merger.
Excluding the cluster on the upper-left corner (A2634) of Fig. 8 and the aforementioned subsets of outliers, the powerlaw fit for SCC and WCC clusters using the BCES routine gives,
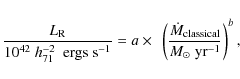
where
Finally, we interpret the strong correlation seen between
![]() and
and
![]() as supporting evidence for a feedback system in which the AGN
activity is more enhanced in clusters with higher mass deposition
rates, and the AGN in turn quenches the cooling of gas by heating the
ambient medium. We note that a similar result was obtained by Peres et al. (1998) between 5 GHz spectral radio luminosity and the mass deposition rate determined with
as supporting evidence for a feedback system in which the AGN
activity is more enhanced in clusters with higher mass deposition
rates, and the AGN in turn quenches the cooling of gas by heating the
ambient medium. We note that a similar result was obtained by Peres et al. (1998) between 5 GHz spectral radio luminosity and the mass deposition rate determined with
![]() ,
although for a much smaller subset constituting only 15 galaxy clusters of the B55 sample (Edge et al. 1990).
,
although for a much smaller subset constituting only 15 galaxy clusters of the B55 sample (Edge et al. 1990).
3.3 Brightest cluster galaxies (BCGs)
The brightest cluster galaxies are unique in terms of their
high-luminosity and proximity to the centers of their host clusters.
The BCGs are extremely interesting objects and have long been subjects
of a wide range of studies. At one extreme, their formation and
evolution is closely tied with the Mpc scale cluster environment in
which they reside. At the other extreme in the hierarchy of structure
formation, BCGs are just one level above the ![]() 10-4 pc scale
supermassive black holes (SMBH). The BCG bulge properties, such as the
optical bulge luminosity and stellar velocity dispersion, obey certain
scaling relations that permit indirect estimation of the mass of SMBHs
(e.g. Kormendy & Richstone 1995; Ferrarese & Merritt 2000).
10-4 pc scale
supermassive black holes (SMBH). The BCG bulge properties, such as the
optical bulge luminosity and stellar velocity dispersion, obey certain
scaling relations that permit indirect estimation of the mass of SMBHs
(e.g. Kormendy & Richstone 1995; Ferrarese & Merritt 2000).
In this section, we correlate the BCG magnitudes or, equivalently, the
mass of the SMBHs with the AGN radio luminosity and the large-scale
X-ray properties of galaxy clusters. The mass of the SMBH,
![]() ,
is
derived using the scaling relation between the near-infrared (NIR)
bulge magnitude and the inferred
,
is
derived using the scaling relation between the near-infrared (NIR)
bulge magnitude and the inferred
![]() ,
as deduced by Marconi & Hunt (2003). Further, we test whether there are any distinctions in the BCGs properties amongst the three different types
of clusters (SCC, WCC and NCC clusters).
,
as deduced by Marconi & Hunt (2003). Further, we test whether there are any distinctions in the BCGs properties amongst the three different types
of clusters (SCC, WCC and NCC clusters).
The BCG apparent magnitudes were taken from the Two Micron All-Sky
Survey (2MASS Skrutskie et al. 2006) Extended Source Catalog (XSC![]() ). We
used the 2MASS total magnitudes in K-band (2.16
). We
used the 2MASS total magnitudes in K-band (2.16 ![]() m),
km
m),
km
![]() ,
estimated from extrapolation of the surface
brightness profiles (SBP). The extended source detection limit for
K-band at 10
,
estimated from extrapolation of the surface
brightness profiles (SBP). The extended source detection limit for
K-band at 10![]() is 13.5 mag and the uncertainties range from
0.02-0.23 mag with a mean of 0.06 mag. In short, the 2MASS SBPs have
been derived from fitting a modified Sersic function to the elliptical
radial light distribution of the BCGs. The total magnitudes are
estimated from summing two terms. The first term corresponds to the
isophotal magnitude estimated from fitting an ellipse to the standard
isophote of mean surface brightness of
K20 =
20 mag arcsec-2. The second term is derived by integrating the
best-fitting Sersic law starting from the standard isophote, r20,
out to a delimiting isophote, which is typically about four scale
lengths. This 2MASS strategy insures that the total flux of a galaxy
is recovered.
is 13.5 mag and the uncertainties range from
0.02-0.23 mag with a mean of 0.06 mag. In short, the 2MASS SBPs have
been derived from fitting a modified Sersic function to the elliptical
radial light distribution of the BCGs. The total magnitudes are
estimated from summing two terms. The first term corresponds to the
isophotal magnitude estimated from fitting an ellipse to the standard
isophote of mean surface brightness of
K20 =
20 mag arcsec-2. The second term is derived by integrating the
best-fitting Sersic law starting from the standard isophote, r20,
out to a delimiting isophote, which is typically about four scale
lengths. This 2MASS strategy insures that the total flux of a galaxy
is recovered.
The BCGs in 2MASS were located by searching around the brightest
cluster galaxy in each cluster using an initial compilation, kindly
provided by Heinz Andernach, based on the available data at NASA/IPAC
Extragalactic Database (NED![]() )
and Hyperleda
)
and Hyperleda![]() . All the BCGs were
found within 5'' of the given search position except in the case
of three clusters, A2204 (SCC), A2065 (WCC) and A2163 (NCC), where,
based on visual inspection, 2MASS did not manage to locate the right galaxies (i.e. even though within 5'' of the given
search position, the putative BCGs were not found in the 2MASS-XSC
catalog). For these three clusters, we retrieved the 2MASS K-band
Atlas images which have a plate scale of 1''/pix, and fitted the
BCG surface brightness distributions using the two-dimensional
galaxy-fitting program, GALFIT (Peng et al. 2002). In order to be
consistent with the 2MASS fitting routines, we restricted the
functional form to Sersic models. While the SBPs of the BCGS of A2065
and A2163 were well-reproduced with a single-component Sersic models,
the BCG in A2204 required a double-component Sersic model. For
comparisons of the K-band magnitudes between the 2MASS-XSC and
GALFIT estimates, we carried out tests by applying GALFIT to a few of
the BCGs present in the XSC catalog and, hence, with known 2MASS
magnitudes. We found that whereas GALFIT systematically underestimates
the magnitude for bright BCGs (km
. All the BCGs were
found within 5'' of the given search position except in the case
of three clusters, A2204 (SCC), A2065 (WCC) and A2163 (NCC), where,
based on visual inspection, 2MASS did not manage to locate the right galaxies (i.e. even though within 5'' of the given
search position, the putative BCGs were not found in the 2MASS-XSC
catalog). For these three clusters, we retrieved the 2MASS K-band
Atlas images which have a plate scale of 1''/pix, and fitted the
BCG surface brightness distributions using the two-dimensional
galaxy-fitting program, GALFIT (Peng et al. 2002). In order to be
consistent with the 2MASS fitting routines, we restricted the
functional form to Sersic models. While the SBPs of the BCGS of A2065
and A2163 were well-reproduced with a single-component Sersic models,
the BCG in A2204 required a double-component Sersic model. For
comparisons of the K-band magnitudes between the 2MASS-XSC and
GALFIT estimates, we carried out tests by applying GALFIT to a few of
the BCGs present in the XSC catalog and, hence, with known 2MASS
magnitudes. We found that whereas GALFIT systematically underestimates
the magnitude for bright BCGs (km
![]() mag) by about
10%, the GALFIT magnitudes are consistent with the 2MASS-XSC
magnitudes for faint BCGs (km
mag) by about
10%, the GALFIT magnitudes are consistent with the 2MASS-XSC
magnitudes for faint BCGs (km
![]() mag) to within
3%. Since the GALFIT magnitudes of the BCGs in A2204, A2065 and
A2163 are all fainter than 12 mag (but brighter than the detection
limit of 13.5 mag), we deem them to be trustworthy to within 5%.
mag) to within
3%. Since the GALFIT magnitudes of the BCGs in A2204, A2065 and
A2163 are all fainter than 12 mag (but brighter than the detection
limit of 13.5 mag), we deem them to be trustworthy to within 5%.
The apparent magnitudes from 2MASS were corrected for Galactic
extinction using values from Schlegel et al. (1998), the typical
correction values being small - on the order of ![]() 10-2, and
were then converted into absolute magnitudes using the redshifts
compiled from NED. We did not apply any k-correction since these
galaxies are all nearby.
10-2, and
were then converted into absolute magnitudes using the redshifts
compiled from NED. We did not apply any k-correction since these
galaxies are all nearby.
3.3.1 Supermassive black hole mass and radio luminosity of the BCG
There has been a lot of debate over the use of BCG scaling relations
for determinations of
![]() .
This is due to the fact that many BCGs
are often accompanied by low surface brightness envelopes extending
out to, as far as, several hundred kiloparsecs (Gonzalez et al. 2005).
These are the well-known ``cD galaxies''. The extended envelopes, also
known as intracluster light (ICL) (Lin & Mohr 2004), are thought to
either represent debris accumulated over the merger history of the BCG
or from tidal stripping of other cluster galaxies. The extended
emission may as well originate from stars forming out of the condensed
gas in cooling clusters. An important investigation we will follow-up
in a subsequent paper is to study how the luminosity of these
envelopes correlates with cooling parameters, such as the
.
This is due to the fact that many BCGs
are often accompanied by low surface brightness envelopes extending
out to, as far as, several hundred kiloparsecs (Gonzalez et al. 2005).
These are the well-known ``cD galaxies''. The extended envelopes, also
known as intracluster light (ICL) (Lin & Mohr 2004), are thought to
either represent debris accumulated over the merger history of the BCG
or from tidal stripping of other cluster galaxies. The extended
emission may as well originate from stars forming out of the condensed
gas in cooling clusters. An important investigation we will follow-up
in a subsequent paper is to study how the luminosity of these
envelopes correlates with cooling parameters, such as the
![]() ,
,
![]() ,
,
![]() etc. This requires careful decomposition of the BCG
light profile into an inner component, associated just with the
galaxy, and an outer flatter component representing the
ICL. Seigar et al. (2007) fitted analytical models with two Sersic
components to separately measure the profiles of the central and
extended parts of 5 cD galaxies and showed that the contribution of
the envelopes to the total light is around 60% to 80%.
etc. This requires careful decomposition of the BCG
light profile into an inner component, associated just with the
galaxy, and an outer flatter component representing the
ICL. Seigar et al. (2007) fitted analytical models with two Sersic
components to separately measure the profiles of the central and
extended parts of 5 cD galaxies and showed that the contribution of
the envelopes to the total light is around 60% to 80%.
![\begin{figure}
\par\includegraphics[width=9cm]{0836f13.eps} %\end{figure}](/articles/aa/full_html/2009/27/aa10836-08/img118.png) |
Figure 10:
The mass of the SMBH versus the total radio
luminosity of the BCG in SCC (blue filled circles), WCC (green open circles) and NCC (red open squares) clusters. Visible is a weak trend given by solid blue line for the SCC clusters such that
the
|
| Open with DEXTER | |
Despite the above factors, recent studies
(Batcheldor et al. 2007; Marconi & Hunt 2003) have shown that the SMBH masses
derived from the scaling relation using the NIR bulge magnitudes of
the BCGs are consistent with those derived from stellar velocity
dispersions (
![]() ), both the relations yielding similar
amount of scatter. This is not quite true for V- or B-band
magnitudes though, where the scatter is much higher compared to the
preferred
), both the relations yielding similar
amount of scatter. This is not quite true for V- or B-band
magnitudes though, where the scatter is much higher compared to the
preferred
![]() -
-
![]() relation. Batcheldor et al. (2007)
attribute the scatter to inclusion of luminosity from the
outer-envelopes of the cD galaxies, which may be more pronounced in
the V- or B-band, especially if the outer-envelope light
represents on-going star-formation, and which might not have anything
to do with the central galaxy dynamics (however, see Lauer et al. 2007, for a difference of opinion). Based on the studies on the NIR bulge magnitude-
relation. Batcheldor et al. (2007)
attribute the scatter to inclusion of luminosity from the
outer-envelopes of the cD galaxies, which may be more pronounced in
the V- or B-band, especially if the outer-envelope light
represents on-going star-formation, and which might not have anything
to do with the central galaxy dynamics (however, see Lauer et al. 2007, for a difference of opinion). Based on the studies on the NIR bulge magnitude-
![]() relation, we use the following scaling relation (Marconi & Hunt 2003) to derive the SMBH masses:
relation, we use the following scaling relation (Marconi & Hunt 2003) to derive the SMBH masses:
![\begin{displaymath}{\rm log}_{10}\left({\frac{M_{{\rm BH}}}{M_{\odot}}}\right) =...
...eft({\frac{L_{{\rm BCG}}}{L_{\odot}}} \right)
- 10.9 \right] ,
\end{displaymath}](/articles/aa/full_html/2009/27/aa10836-08/img120.png)
where
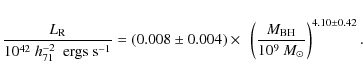
The Spearman rank correlation coefficient of the fit is 0.46 and the probability of their being no correlation is
Several studies have explored the correlation between the SMBH mass
and radio luminosity of the embedded AGN, leading to contradictory
results. Whereas it is clear that the radio loudness, the ratio of the
radio to the optical luminosity of an AGN, is a strong function of the
black hole mass (Laor 2000), whether or not there exists a tight
relation between
![]() and
and
![]() is still a matter of
debate. Franceschini et al. (1998) derived a tight relation between the
radio luminosity at 5 GHz,
is still a matter of
debate. Franceschini et al. (1998) derived a tight relation between the
radio luminosity at 5 GHz,
![]() ,
and
,
and
![]() using a sample
of 13 nearby early-type weakly active galaxies, such that
using a sample
of 13 nearby early-type weakly active galaxies, such that
![]() .
Lacy et al. (2001) also find a
similar correlation for a sample of steep-spectrum radio sources,
albeit leading to a flatter slope of 1.4. Although Laor (2000)
confirmed this trend of increasing radio luminosity with increasing
black hole mass using a much larger sample of 29 nearby galaxies and
89 PG (Palomar-Green) quasars, the trend they obtain is weak and
presents a lot of scatter. As an example of dissenting views,
Liu et al. (2006) find no relation of
.
Lacy et al. (2001) also find a
similar correlation for a sample of steep-spectrum radio sources,
albeit leading to a flatter slope of 1.4. Although Laor (2000)
confirmed this trend of increasing radio luminosity with increasing
black hole mass using a much larger sample of 29 nearby galaxies and
89 PG (Palomar-Green) quasars, the trend they obtain is weak and
presents a lot of scatter. As an example of dissenting views,
Liu et al. (2006) find no relation of
![]() against the black
hole mass. On the other hand, they find a strong correlation between
the jet power and the black hole mass, where they used the flux
density of the radio lobes at 151 MHz as a proxy to determine the jet
power. Based on the above results it is not yet clear how the radio
luminosity of an AGN scales with the black hole mass. It may be that
different black hole efficiencies, conversion rates from the total AGN
power to the radiative power of the jet and large-scale environmental
effects from source to source, cause the radio luminosity to display a
wide range of values for a given black hole mass.
against the black
hole mass. On the other hand, they find a strong correlation between
the jet power and the black hole mass, where they used the flux
density of the radio lobes at 151 MHz as a proxy to determine the jet
power. Based on the above results it is not yet clear how the radio
luminosity of an AGN scales with the black hole mass. It may be that
different black hole efficiencies, conversion rates from the total AGN
power to the radiative power of the jet and large-scale environmental
effects from source to source, cause the radio luminosity to display a
wide range of values for a given black hole mass.
In pursuit of determining whether or not there is an underlying
physical mechanism that ties the radio power to the mass of the SMBH,
Fig. 10 presents an interesting outlook. We
investigate for the first time the dependence of
![]() on
on
![]() taking into consideration the different environments (SCC, WCC and NCC
clusters) in which the centrally located radio sources reside.
According to the simulations of Burns et al. (2008), CC clusters grow an
enhanced cool-core gradually and steadily via small mergers, unlike
NCC clusters which experience major mergers early in their history.
Hence, repetitive small mergers in addition to providing material for
the growth of the cool core in CC clusters, may also result in a
quasi-steady mass accretion rate onto the SMBH in CC clusters. The
fact that only the CCRSs in SCC clusters show some level of
correlation between
taking into consideration the different environments (SCC, WCC and NCC
clusters) in which the centrally located radio sources reside.
According to the simulations of Burns et al. (2008), CC clusters grow an
enhanced cool-core gradually and steadily via small mergers, unlike
NCC clusters which experience major mergers early in their history.
Hence, repetitive small mergers in addition to providing material for
the growth of the cool core in CC clusters, may also result in a
quasi-steady mass accretion rate onto the SMBH in CC clusters. The
fact that only the CCRSs in SCC clusters show some level of
correlation between
![]() and
and
![]() implies that the AGN output in
these systems is proportional to the average mass-accretion rate onto
the black hole, thereby, balancing the radiative losses.
implies that the AGN output in
these systems is proportional to the average mass-accretion rate onto
the black hole, thereby, balancing the radiative losses.
At the time of writing this article, MKW4, an outlier below the
best-fit line in Fig. 10, had no low-frequency
(<1.4 GHz) radio data available. This inspired us to acquire 327 MHz
![]() data for this cluster, which is work-in-progress. MKW4 is an
interesting cluster in that high-frequency (1.4 GHz and 5 GHz)
data for this cluster, which is work-in-progress. MKW4 is an
interesting cluster in that high-frequency (1.4 GHz and 5 GHz)
![]() archival data showed a cluster of closely spaced point-sources
archival data showed a cluster of closely spaced point-sources
![]() 1 arcmin to the NE of the BCG radio emission. Furthermore,
radio emission from the BCG was only detected at 5 GHz and not at
1.4 GHz, the latter having had only 2-min on-source integration
time. The preliminary 327 MHz image of MKW4 revealed the same feature
NE of the BCG but due to insufficient resolution, it still remained
unclear whether this emission was associated with the nucleus of the
CCRS or corresponded to a high-redshift cluster system; the latter
conclusion being based on the proximity of these point sources to each
other. Assuming that the emission in the NE reflected the region of
intense interaction between the lobe and ICM and, hence, was a part of
the central radio source, would have caused the
1 arcmin to the NE of the BCG radio emission. Furthermore,
radio emission from the BCG was only detected at 5 GHz and not at
1.4 GHz, the latter having had only 2-min on-source integration
time. The preliminary 327 MHz image of MKW4 revealed the same feature
NE of the BCG but due to insufficient resolution, it still remained
unclear whether this emission was associated with the nucleus of the
CCRS or corresponded to a high-redshift cluster system; the latter
conclusion being based on the proximity of these point sources to each
other. Assuming that the emission in the NE reflected the region of
intense interaction between the lobe and ICM and, hence, was a part of
the central radio source, would have caused the
![]() to increase 30
fold and for it to no longer be an outlier. To confirm this
hypothesis, we acquired dynamic
to increase 30
fold and for it to no longer be an outlier. To confirm this
hypothesis, we acquired dynamic
![]() time at 1.4 GHz in CnD
configuration with 3 h integration time. Even though the new 1.4 GHz
data show no signature of a connection between the CCRS and the bunch
point-source emission in the NE, it clearly shows emission from the
CCRS, which went undetected with the old archival data. This itself
increased the total radio output by more than an order of magnitude
bringing this cluster closer towards the observed
time at 1.4 GHz in CnD
configuration with 3 h integration time. Even though the new 1.4 GHz
data show no signature of a connection between the CCRS and the bunch
point-source emission in the NE, it clearly shows emission from the
CCRS, which went undetected with the old archival data. This itself
increased the total radio output by more than an order of magnitude
bringing this cluster closer towards the observed
![]() -
-
![]() trend
for the SCC clusters (this change is incorporated in
Fig. 10). The follow-up study of the CCRS in MKW4
underlines the importance of obtaining reliable spectra of radio
sources.
trend
for the SCC clusters (this change is incorporated in
Fig. 10). The follow-up study of the CCRS in MKW4
underlines the importance of obtaining reliable spectra of radio
sources.
In addition to MKW4, there are four other outliers in Fig. 10 which lie above the best-fit relation: A0780, A2597, MKW3S and A3581. We believe these systems might be ones which have experienced powerful radio outbursts in recent past resulting in the present AGN heating rate to be greater than the average rate at which the mass has been accreting onto the SMBH since the formation of the cool core. Similarly, MKW4 may reflect a CCRS that has been caught just at the beginning of another heating cycle and has yet to reach its peak radio activity. These outliers, both below and above the best-fit line may be reflective of the episodic nature of CCRSs in some systems. Another plausible reason for these outliers may be the weakness in the underlying assumption of the integrated luminosity of the BCG as a robust indicator of the bulge luminosity in all the cases.
3.3.2 Large-scale cluster properties and BCGs
Inherent scalings between BCGs and clusters have been implied in numerous observational studies (e.g. Brough et al. 2008; Lin & Mohr 2004) as well as cosmological simulations (Zheng et al. 2007; Cooray & Milosavljevic 2005). In this context, formation and evolution of BCGs and its dependence on the host cluster is an important tool to understand these scalings observed between the BCG luminosity and the host halo mass and X-ray luminosity. There are several proposed BCG evolution scenarios to support these observations, such as (1) dynamical-friction governed galactic cannibalism; (2) rapid mergers between galaxies during the epoch of cluster formation; (3) co-evolution of BCGs with cluster growth due to mergers embracing the paradigm of hierarchical structure formation; and (4) cooling-flows. While the first two scenarios may contribute significantly during the early epoch of BCG formation, Lin & Mohr (2004) and Brough et al. (2008) argue that the BCGs co-evolve with the host clusters via mergers with the BCGs of the falling subclusters, which lead to subsequent growth of the BCG luminosity with increasing cluster mass.
We present in this section the BCG-host cluster correlations for the
![]() sample, with the aim to extend previous studies by analysing
a low-z flux-limited sample unique in its completeness and homogeneity
in the ways of obtaining the X-ray and NIR quantities. The following
study is unique in an additional aspect in that we bear in mind the
possibility of different growth histories for the BCGs corresponding
to CC and NCC clusters.
sample, with the aim to extend previous studies by analysing
a low-z flux-limited sample unique in its completeness and homogeneity
in the ways of obtaining the X-ray and NIR quantities. The following
study is unique in an additional aspect in that we bear in mind the
possibility of different growth histories for the BCGs corresponding
to CC and NCC clusters.
![\begin{figure}
\par\includegraphics[width=15cm,clip]{0836f14.eps}
\end{figure}](/articles/aa/full_html/2009/27/aa10836-08/img129.png) |
Figure 11:
The 2MASS K-band total magnitudes of the 64 BCGs in the
|
| Open with DEXTER | |
Shown in Fig. 11 is
![]() versus
versus
![]() in the left
panel and
in the left
panel and
![]() versus
versus
![]() in the right panel. Shown in different
symbols and colors are the three different types of clusters. Whereas
both the panels clearly indicate that the BCG grows with the cluster
size, the left panel additionally shows a segregation between the SCC
clusters (blue filled circles) and the non-SCC clusters. A possible
reason for such a separation may be related to the continuous growth
of BCGs, as already mentioned in Sect. 3.3.1, due to iterative
small-scale mergers through which the CC clusters grow. The BCGs in
NCCs, on the other hand, form constituents of non-relaxed cluster
environments with a history of one or more major mergers, and the
subsequent heating at the central regions may hinder further BCG
growth at the same rate as that of BCGs in CC clusters. This argument
is supported by the fact that on comparing the radial profiles of
numerically simulated CC and NCC clusters, Burns et al. (2008) observe
an excess of baryons in CC clusters relative to NCC clusters.
in the right panel. Shown in different
symbols and colors are the three different types of clusters. Whereas
both the panels clearly indicate that the BCG grows with the cluster
size, the left panel additionally shows a segregation between the SCC
clusters (blue filled circles) and the non-SCC clusters. A possible
reason for such a separation may be related to the continuous growth
of BCGs, as already mentioned in Sect. 3.3.1, due to iterative
small-scale mergers through which the CC clusters grow. The BCGs in
NCCs, on the other hand, form constituents of non-relaxed cluster
environments with a history of one or more major mergers, and the
subsequent heating at the central regions may hinder further BCG
growth at the same rate as that of BCGs in CC clusters. This argument
is supported by the fact that on comparing the radial profiles of
numerically simulated CC and NCC clusters, Burns et al. (2008) observe
an excess of baryons in CC clusters relative to NCC clusters.
An interesting note is that this segregation appears only between
![]() versus
versus
![]() and not between
and not between
![]() versus
versus
![]() .
However,
a similar intrinsic separation for CC and NCC clusters is seen between
.
However,
a similar intrinsic separation for CC and NCC clusters is seen between
![]() and
and
![]() .
This is attributed to the fact that at a given
temperature, SCC clusters have a higher luminosity as compared to
non-SCC clusters due to an increased gas density at the center. This
causes the SCC clusters to form an envelope towards the higher
luminosity end. Since
.
This is attributed to the fact that at a given
temperature, SCC clusters have a higher luminosity as compared to
non-SCC clusters due to an increased gas density at the center. This
causes the SCC clusters to form an envelope towards the higher
luminosity end. Since
![]() has been derived from
has been derived from
![]() ,
it may be
that the resulting magnitude of separation between
,
it may be
that the resulting magnitude of separation between
![]() and
and
![]() cancels with that between
cancels with that between
![]() and
and
![]() .
.
The estimated best-fit powerlaw for the
![]() -
-
![]() relation based
on the BCES algorithm is:
relation based
on the BCES algorithm is:
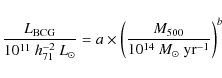
where
Going a step further, we may combine Eqs. (8) and (10) to derive a relation between the SMBH mass and the
cluster mass:
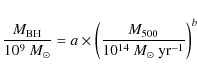
where
Similarly, the best-fit powerlaw for the
![]() -
-
![]() relation is
relation is
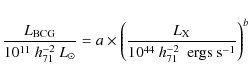
where
The above results, which highlight a strong dependence of the BCG NIR magnitudes on the scale of the host cluster, however, are at variance with those obtained by Brough et al. (2002). They claim that any division between BCGs in low-
![]() and high-
and high-
![]() clusters as seen in high-z
clusters, disappears for clusters with
clusters as seen in high-z
clusters, disappears for clusters with ![]() .
The input low-zsample (
.
The input low-zsample (
![]() )
studied by Brough et al. (2002) consisted of 150 Abell clusters with a flux limit of
fx (0.1-2.4) keV
)
studied by Brough et al. (2002) consisted of 150 Abell clusters with a flux limit of
fx (0.1-2.4) keV
![]() erg s-1 cm-2 in the
erg s-1 cm-2 in the
![]() hard
band (0.5-2.0 keV). After matching these with the 2MASS catalog
resulted in a final sample comprising 76 clusters with only those BCGs
which have robust 2MASS magnitude measurements in the K-band. We
argue that the contradiction in results might stem from differences in
the aperture radii used, within which the magnitudes are calculated.
The 2MASS database provides galaxy magnitudes based on a suite of
apertures. While Brough et al. (2002) employ integrated magnitudes
measured using circular apertures of a fixed metric radius of
12.5
h71-1 kpc, we use, as explained above, the total aperture
radii by extrapolating the SBPs, the mean of which for the BCGs in our
study is
hard
band (0.5-2.0 keV). After matching these with the 2MASS catalog
resulted in a final sample comprising 76 clusters with only those BCGs
which have robust 2MASS magnitude measurements in the K-band. We
argue that the contradiction in results might stem from differences in
the aperture radii used, within which the magnitudes are calculated.
The 2MASS database provides galaxy magnitudes based on a suite of
apertures. While Brough et al. (2002) employ integrated magnitudes
measured using circular apertures of a fixed metric radius of
12.5
h71-1 kpc, we use, as explained above, the total aperture
radii by extrapolating the SBPs, the mean of which for the BCGs in our
study is
![]() kpc. From this we conclude that the total
BCG magnitude is a better quantity to use, as opposed to the BCG core
magnitude, for detecting correlations with global cluster properties.
kpc. From this we conclude that the total
BCG magnitude is a better quantity to use, as opposed to the BCG core
magnitude, for detecting correlations with global cluster properties.
4 Discussion
The riddle of cooling-flows in clusters has continued to baffle us.
Recent high-resolution
![]() images revealed radio-loud AGN
embedded in the centers of cool-core (CC) clusters surrounded by
regions emptied of the X-ray emitting gas, suggesting a strong tie
between the cluster central radio source and the cooling of ICM. Since
the discovery of numerous AGN-blown bubbles in the atmospheres of CC
clusters, various modes of energy transfer from the AGN to the ICM
have been investigated. While the most successful mode has turned out
to be dissipation of energy stored in the radio bubbles as they rise
buoyantly through the ICM, previous studies have fallen short of a
thorough investigation of the relation between the radio luminosity of
the centrally located AGN and cooling properties of a CC cluster.
images revealed radio-loud AGN
embedded in the centers of cool-core (CC) clusters surrounded by
regions emptied of the X-ray emitting gas, suggesting a strong tie
between the cluster central radio source and the cooling of ICM. Since
the discovery of numerous AGN-blown bubbles in the atmospheres of CC
clusters, various modes of energy transfer from the AGN to the ICM
have been investigated. While the most successful mode has turned out
to be dissipation of energy stored in the radio bubbles as they rise
buoyantly through the ICM, previous studies have fallen short of a
thorough investigation of the relation between the radio luminosity of
the centrally located AGN and cooling properties of a CC cluster.
It is now a widely accepted fact that the AGN activity is triggered by
gas accretion onto the central black hole. Playing devil's advocate,
it may then be argued that the AGN output is only to be expected to
scale with the mass accretion rate. Under the assumption that the cool
gas flows from the outer cluster regions to the very centers of the
BCGs and serves as the fuel for the black hole, it is not surprising
that the radio luminosity of an AGN should scale with the cluster
mass, and also, even though to a lesser degree, the inverse of the
cooling time of the gas. This explains the underlying trend seen in
Fig. 8 between the
![]() and the radio output of
CCRSs in CC clusters. However, the picture thus developed so far does
not contain any ingredients reflecting on a self-regulated cycle
formed between gas cooling, star formation and AGN heating. In other
words, it may well be that even though AGN activity enhances with
cluster scale, the cooling of ICM is regulated by an altogether
different process, such as cluster mergers.
and the radio output of
CCRSs in CC clusters. However, the picture thus developed so far does
not contain any ingredients reflecting on a self-regulated cycle
formed between gas cooling, star formation and AGN heating. In other
words, it may well be that even though AGN activity enhances with
cluster scale, the cooling of ICM is regulated by an altogether
different process, such as cluster mergers.
The first strong argument in favor of AGN-regulated heating comes from
the observation that the AGN fraction increases with decreasing
central cooling time,
![]() being the best diagnostic to distinguish
CC from NCC clusters. The study by Rafferty et al. (2008) shows that the
central star-formation rate also is a strong function of
being the best diagnostic to distinguish
CC from NCC clusters. The study by Rafferty et al. (2008) shows that the
central star-formation rate also is a strong function of
![]() (see
Sect. 3.1). That only clusters with short
(see
Sect. 3.1). That only clusters with short
![]() Gyr
have increasing on-going star formation with decreasing clustercentric
distance, implies a chain of intricately linked processes which
maintain heating and cooling rates in cluster atmospheres. These
results together call for a feedback process in which AGN heating
becomes more of a requisite in clusters with shorter cooling times.
This may either be in form of huge AGN outbursts which heat the
surrounding cluster gas, the effect of which lasts for several cooling
cycles (such as Hydra-A, MKW3S, A2597 and A3581), or in form of
short-lived AGN outbursts which are repeated after short intervals. A
recent study by Shabala et al. (2008) has shown that the CCRSs in more
massive clusters undergo AGN outbursts more frequently than the AGN in
their less massive counterparts. Additionally, radio source models
employed by Shabala et al. (2008) show that the duration of the on-state
of an AGN has the same relation with the stellar mass as the mass
deposition rate has with the stellar mass (Best et al. 2005), suggesting
the switching on and off of an AGN resulting directly from either
availability or depletion of cool cluster gas.
Gyr
have increasing on-going star formation with decreasing clustercentric
distance, implies a chain of intricately linked processes which
maintain heating and cooling rates in cluster atmospheres. These
results together call for a feedback process in which AGN heating
becomes more of a requisite in clusters with shorter cooling times.
This may either be in form of huge AGN outbursts which heat the
surrounding cluster gas, the effect of which lasts for several cooling
cycles (such as Hydra-A, MKW3S, A2597 and A3581), or in form of
short-lived AGN outbursts which are repeated after short intervals. A
recent study by Shabala et al. (2008) has shown that the CCRSs in more
massive clusters undergo AGN outbursts more frequently than the AGN in
their less massive counterparts. Additionally, radio source models
employed by Shabala et al. (2008) show that the duration of the on-state
of an AGN has the same relation with the stellar mass as the mass
deposition rate has with the stellar mass (Best et al. 2005), suggesting
the switching on and off of an AGN resulting directly from either
availability or depletion of cool cluster gas.
More recently, Voit et al. (2008) have provided evidence that the AGN
activity, ICM cooling and star-formation might all be linked together
through the process of electron thermal conduction. According to their
study, the efficacy of thermal conduction depends on the size of the
temperature inhomogeneities relative to the critical length scale
associated with conduction,
![]() .
The state of
equilibrium between radiation losses and conduction gain can be
equivalently expressed in terms of
.
The state of
equilibrium between radiation losses and conduction gain can be
equivalently expressed in terms of
![]() and K. Based on
above arguments, conduction sets an entropy threshold such that only
those clusters whose central entropy is less than 30 keV cm-2show star formation, in the form of H
and K. Based on
above arguments, conduction sets an entropy threshold such that only
those clusters whose central entropy is less than 30 keV cm-2show star formation, in the form of H![]() ,
and enhanced AGN
activity. Above this threshold, conduction is a viable heating
mechanism. Further, since gas entropy is very closely linked to the
central cooling time through the relation,
,
and enhanced AGN
activity. Above this threshold, conduction is a viable heating
mechanism. Further, since gas entropy is very closely linked to the
central cooling time through the relation,
![]() ,
such that 0.6 Gyr (1 Gyr) corresponds approximately to
30 keV cm-2 (43 keV cm-2), these observations are also
in concordance with our results on the central temperature drop and
cuspiness displayed in Fig. 5. The central entropy (or
central cooling time) threshold may be an explanation for observing an
abrupt central temperature drop and an increase in cuspiness for
clusters with cooling times shorter than 1 Gyr. In the cluster regime
with
,
such that 0.6 Gyr (1 Gyr) corresponds approximately to
30 keV cm-2 (43 keV cm-2), these observations are also
in concordance with our results on the central temperature drop and
cuspiness displayed in Fig. 5. The central entropy (or
central cooling time) threshold may be an explanation for observing an
abrupt central temperature drop and an increase in cuspiness for
clusters with cooling times shorter than 1 Gyr. In the cluster regime
with
![]() Gyr, AGN heating is the dominant balancing mechanism to
cooling.
Gyr, AGN heating is the dominant balancing mechanism to
cooling.
We point out that there is non-negligible scatter in
Figs. 8 and 10, the origin of
which could be either extrinsic or intrinsic. In the presence of an
AGN-regulated feedback, an intrinsic scatter may imply that the
synchrotron luminosity, which is only a small fraction of the total
AGN output, is not a very reliable quantity to use to establish the
AGN-ICM interaction. It has been noted in previous studies, that the
ratio of kinetic to radiative AGN power indeed shows a broad range,
from a few to a several thousands
(e.g. Bîrzan et al. 2004; Birzan et al. 2008). Kinetic AGN luminosity may be a
more robust measure of the total AGN feedback. For this, one requires
the radio morphology of jets and lobes overlaid on X-ray images to
help find or confirm the X-ray cavities. The census of X-ray cavities
is highly incomplete since they are of very low contrast, yet they are
important contributions to the heating budget. An extrinsic scatter
in the plots would point at inaccurate measurements of observable
parameters at both the wavebands, radio (incomplete spectral
information) as well as X-ray (imprecise mass deposition rates due to
spectral resolution power of
![]() on
on
![]() ).
).
However, strong correlations found in this work between the total AGN
radio power and various cluster parameters lend confidence in
synchrotron luminosity as a fairly good measure of the cooling
activity in clusters. These correlations also provide us with
motivation to continue our work to acquire low-frequency radio
measurements for CCRSs which have no reliable data below 500 MHz
(constituting 35% of the
![]() sample, see Sect. 2.1.2).
To achieve this goal, we are awaiting proprietary data for all but two
of the remaining 35% clusters with
sample, see Sect. 2.1.2).
To achieve this goal, we are awaiting proprietary data for all but two
of the remaining 35% clusters with
![]() at 325 GHz and with
at 325 GHz and with
![]() at dual-frequency band 610 MHz/235 MHz.
at dual-frequency band 610 MHz/235 MHz.
5 Conclusions
We have presented a detailed joint analysis of the brightest complete
local sample of galaxy clusters,
![]() ,
using high-resolution
X-ray data acquired from
,
using high-resolution
X-ray data acquired from
![]() and radio data compiled from
various sources spanning a wide range of frequencies. This study was
conducted so as to explore the role of AGN in the centers of galaxy
clusters accompanied with the cooling flow problem. The main results
of this study are:
and radio data compiled from
various sources spanning a wide range of frequencies. This study was
conducted so as to explore the role of AGN in the centers of galaxy
clusters accompanied with the cooling flow problem. The main results
of this study are:
- 1.
- We find that the integrated radio luminosity (
 )
of a
cluster central radio source is tightly correlated to its 1.4 GHz
monochromatic luminosity (see Fig. 3) with the
exception of a few outliers. This correlation is quantified as
)
of a
cluster central radio source is tightly correlated to its 1.4 GHz
monochromatic luminosity (see Fig. 3) with the
exception of a few outliers. This correlation is quantified as
 (Eq. (2)). To estimate the integrated radio luminosity
of a CCRS, a special effort was made to compile low-frequency radio
measurements in order to get an accurate measure of the total
radiative output of the centrally located AGN.
(Eq. (2)). To estimate the integrated radio luminosity
of a CCRS, a special effort was made to compile low-frequency radio
measurements in order to get an accurate measure of the total
radiative output of the centrally located AGN.
- 2.
- The best property to diagnose a cool-core cluster with high
quality data is the central cooling time,
 .
Based on
,
there is an increasing probability for the brightest cluster
galaxy (BCG) closest to the X-ray peak emission to harbor an AGN
with decreasing cooling time (Fig. 6). The
percentage of AGN in three bins ordered in cooling time, strong cool
core (SCC,
.
Based on
,
there is an increasing probability for the brightest cluster
galaxy (BCG) closest to the X-ray peak emission to harbor an AGN
with decreasing cooling time (Fig. 6). The
percentage of AGN in three bins ordered in cooling time, strong cool
core (SCC,
 Gyr), weak cool-core (WCC, 1 Gyr
 Gyr) and non-cool-core (NCC,
 Gyr) clusters,
is
Gyr) clusters,
is  ,
,
 and
and  respectively.
- 3.
- There is a trend between the
and
such that the
former increases with decreasing cooling time. This is shown in
Fig. 7, although with a large scatter
especially towards short
where the trend appears to break down.
- 4.
- The total radio output of a CCRS scales with the cluster
size (e.g. X-ray luminosity). This correlation is particularly
noticeable in SCC clusters (see Fig. 8, left
panel). The best-fit powerlaw for the SCC clusters is
 (Eq. (6)).
- 5.
- The total radio output of cool-core clusters (SCC and WCC
clusters) shows a tight correlation with the classical mass
deposition rate,
 (Fig. 8, right
panel). The correlation is given by
(Fig. 8, right
panel). The correlation is given by
 (Eq. (7)).
- 6.
- The radio luminosity of the central radio source shows a weak
trend with the mass of the supermassive black hole, but this trend
is seen only for the SCC clusters (Fig. 10). This
trend is approximately given by
 .
.
- 7.
- The NIR bulge luminosity of the BCG (closest to the X-ray peak emission) shows a correlation at an unprecedented level with the global cluster properties, such as X-ray mass shown in the left panel of Fig. 11, and luminosity shown in the right panel of Fig. 11 (Eqs. (10) and 12).
Acknowledgements
The authors want to thank Heinz Andernach for providing information on the initial BCG search positions for 2MASS and Paul Nulsen, Tod Lauer and Douglas Richstone for helpful discussions and the internal referee, Manuel Perucho, for a beneficial feedback. The authors thank the external referee for a very interesting report and for provoking us to think about certain important issues in detail. R.M. acknowledges support from the Deutsche Forschungsgemeinschaft (DFG) through the Schwerpunkt Program 1177 (RE 1462/4). T.H.R and D.S.H. acknowledge support from the DFG through the Emmy Noether research grant RE 1462/2. Basic research in radio astronomy at the NRL is supported by 6.1 Base funding. This publication makes use of data products from the Two Micron All Sky Survey, which is a joint project of the University of Massachusetts and the Infrared Processing and Analysis Center/California Institute of Technology, funded by the National Aeronautics and Space Administration and the National Science Foundation. This research has made use of the NASA/IPAC Extragalactic Database (NED) which is operated by the Jet Propulsion Laboratory, California Institute of Technology, under contract with the National Aeronautics and Space Administration. We acknowledge the usage of the HyperLeda database (http://leda.univ-lyon1.fr).
References
- Akritas, M. G., & Bershady, M. A. 1996, ApJ, 470, 706 [NASA ADS] [CrossRef] (In the text)
- Akritas, M. G., & Siebert, J. 1996, MNRAS, 278, 919 [NASA ADS]
- Allen, S. W. 1995, MNRAS, 276, 947 [NASA ADS]
- Ashman, K. M., Bird, C. M., & Zepf, S. E. 1994, AJ, 108, 2348 [NASA ADS] [CrossRef] (In the text)
- Bagchi, J., & Kapahi, V. K. 1994, J. A&A, 15, 275 [NASA ADS]
- Batcheldor, D., Marconi, A., Merritt, D., & Axon, D. J. 2007, ApJ, 663, L85 [NASA ADS] [CrossRef]
- Benson, A. J., Bower, R. G., Frenk, C. S., et al. 2003, ApJ, 599, 38 [NASA ADS] [CrossRef] (In the text)
- Best, P. N., Kauffmann, G., Heckman, T. M., et al. 2005, MNRAS, 362, 25 [NASA ADS] [CrossRef] (In the text)
- Best, P. N., von der Linden, A., Kauffmann, G., Heckman, T. M., & Kaiser, C. R. 2007, MNRAS, 379, 894 [NASA ADS] [CrossRef]
- Binney, J., & Tabor, G. 1995, MNRAS, 276, 663 [NASA ADS]
- Bîrzan, L., Rafferty, D. A., McNamara, B. R., Wise, M. W., & Nulsen, P. E. J. 2004, ApJ, 607, 800 [NASA ADS] [CrossRef]
- Birzan, L., McNamara, B. R., Nulsen, P. E. J., Carilli, C. L., & Wise, M. W. 2008, ArXiv e-prints, 806
- Blanton, E. L., Sarazin, C. L., McNamara, B. R., & Wise, M. W. 2001, ApJ, 558, L15 [NASA ADS] [CrossRef] (In the text)
- Blanton, E. L., Sarazin, C. L., McNamara, B. R., & Clarke, T. E. 2004, ApJ, 612, 817 [NASA ADS] [CrossRef]
- Bock, D. C.-J., Large, M. I., & Sadler, E. M. 1999, AJ, 117, 1578 [NASA ADS] [CrossRef]
- Boehringer, H., Voges, W., Fabian, A. C., Edge, A. C., & Neumann, D. M. 1993, MNRAS, 264, L25 [NASA ADS] (In the text)
- Böhringer, H., Collins, C. A., Guzzo, L., et al. 2002, ApJ, 566, 93 [NASA ADS] [CrossRef] (In the text)
- Bower, R. G., Benson, A. J., Malbon, R., et al. 2006, MNRAS, 370, 645 [NASA ADS]
- Brough, S., Collins, C. A., Burke, D. J., Mann, R. G., & Lynam, P. D. 2002, MNRAS, 329, L53 [NASA ADS] [CrossRef] (In the text)
- Brough, S., Couch, W. J., Collins, C. A., et al. 2008, MNRAS, 385, L103 [NASA ADS]
- Burns, J. O. 1990, AJ, 99, 14 [NASA ADS] [CrossRef]
- Burns, J. O., Hallman, E. J., Gantner, B., Motl, P. M., & Norman, M. L. 2008, ApJ, 675, 1125 [NASA ADS] [CrossRef] (In the text)
- Chandran, B. D. G., & Rasera, Y. 2007, ApJ, 671, 1413 [NASA ADS] [CrossRef] (In the text)
- Churazov, E., Sunyaev, R., Forman, W., & Böhringer, H. 2002, MNRAS, 332, 729 [NASA ADS] [CrossRef]
- Clarke, T. E., Blanton, E. L., & Sarazin, C. L. 2004, ApJ, 616, 178 [NASA ADS] [CrossRef] (In the text)
- Cohen, A. S., Lane, W. M., Cotton, W. D., et al. 2007, AJ, 134, 1245 [NASA ADS] [CrossRef]
- Colina, L., & Bohlin, R. 1997, AJ, 113, 1138 [NASA ADS] [CrossRef] (In the text)
- Condon, J. J., Cotton, W. D., Greisen, E. W., et al. 1998, AJ, 115, 1693 [NASA ADS] [CrossRef]
- Cooray, A., & Milosavljevic, M. 2005, ApJ, 627, L85 [NASA ADS] [CrossRef]
- Croton, D. J., Springel, V., White, S. D. M., et al. 2006, MNRAS, 365, 11 [NASA ADS] [CrossRef]
- Donahue, M., Voit, G. M., O'Dea, C. P., Baum, S. A., & Sparks, W. B. 2005, ApJ, 630, L13 [NASA ADS] [CrossRef] (In the text)
- Dunn, R. J. H., & Fabian, A. C. 2006, MNRAS, 373, 959 [NASA ADS] [CrossRef]
- Edge, A. C., & Frayer, D. T. 2003, ApJ, 594, L13 [NASA ADS] [CrossRef]
- Edge, A. C., Stewart, G. C., Fabian, A. C., & Arnaud, K. A. 1990, MNRAS, 245, 559 [NASA ADS] (In the text)
- Edwards, L. O. V., Hudson, M. J., Balogh, M. L., & Smith, R. J. 2007, MNRAS, 379, 100 [NASA ADS] [CrossRef]
- Fabian, A. C. 1994, ARA&A, 32, 277 [NASA ADS] [CrossRef] (In the text)
- Fabian, A. C., Sanders, J. S., Allen, S. W., et al. 2003, MNRAS, 344, L43 [NASA ADS] [CrossRef]
- Ferrarese, L., & Merritt, D. 2000, ApJ, 539, L9 [NASA ADS] [CrossRef]
- Finoguenov, A., Reiprich, T. H., & Böhringer, H. 2001, A&A, 368, 749 [NASA ADS] [CrossRef] [EDP Sciences] (In the text)
- Franceschini, A., Vercellone, S., & Fabian, A. C. 1998, MNRAS, 297, 817 [NASA ADS] [CrossRef] (In the text)
- Gentile, G., Rodríguez, C., Taylor, G. B., et al. 2007, ApJ, 659, 225 [NASA ADS] [CrossRef] (In the text)
- Giacintucci, S., Venturi, T., Bardelli, S., Dallacasa, D., & Zucca, E. 2004, A&A, 419, 71 [NASA ADS] [CrossRef] [EDP Sciences] (In the text)
- Giacintucci, S., Venturi, T., Murgia, M., et al. 2007, A&A, 476, 99 [NASA ADS] [CrossRef] [EDP Sciences]
- Gonzalez, A. H., Zabludoff, A. I., & Zaritsky, D. 2005, ApJ, 618, 195 [NASA ADS] [CrossRef] (In the text)
- Guo, F., & Oh, S. P. 2008, MNRAS, 384, 251 [NASA ADS] [CrossRef]
- Hansen, S. M., Sheldon, E. S., Wechsler, R. H., & Koester, B. P. 2007, ArXiv e-prints, 710
- Heinz, S., Choi, Y.-Y., Reynolds, C. S., & Begelman, M. C. 2002, ApJ, 569, L79 [NASA ADS] [CrossRef] (In the text)
- Hudson, D. S. et al. 2008, A&A, submitted (In the text)
- Jones, C. Forman, W., Vikhlinin, A., et al. 2002, ApJ, 567, L115 [NASA ADS] [CrossRef]
- Kaastra, J. S., den Boggende, A. J., Brinkman, A. C., et al. 2001, in X-ray Astronomy 2000, ed. R. Giacconi, S. Serio, & L. Stella, ASP Conf. Ser., 234, 351
- Katayama, H., Hayashida, K., Takahara, F., & Fujita, Y. 2003, ApJ, 585, 687 [NASA ADS] [CrossRef] (In the text)
- Kembhavi, A., Feigelson, E. D., & Singh, K. P. 1986, MNRAS, 220, 51 [NASA ADS]
- Kormendy, J., & Richstone, D. 1995, ARA&A, 33, 581 [NASA ADS]
- Lacy, M., Laurent-Muehleisen, S. A., Ridgway, S. E., Becker, R. H., & White, R. L. 2001, ApJ, 551, L17 [NASA ADS] [CrossRef] (In the text)
- Laor, A. 2000, ApJ, 543, L111 [NASA ADS] [CrossRef] (In the text)
- Lauer, T. R., Faber, S. M., Richstone, D., et al. 2007, ApJ, 662, 808 [NASA ADS] [CrossRef] (In the text)
- Lin, Y.-T., & Mohr, J. J. 2004, ApJ, 617, 879 [NASA ADS] [CrossRef] (In the text)
- Liu, Y., Jiang, D. R., & Gu, M. F. 2006, ApJ, 637, 669 [NASA ADS] [CrossRef] (In the text)
- Marconi, A., & Hunt, L. K. 2003, ApJ, 589, L21 [NASA ADS] [CrossRef] (In the text)
- Markovic, T. Owen, F. N., & Eilek, J. A. 2004, in The Riddle of Cooling Flows in Galaxies and Clusters of galaxies, 61 (In the text)
- Mathews, W. G., & Brighenti, F. 2003, ARA&A, 41, 191 [NASA ADS] [CrossRef] (In the text)
- Mathews, W. G., Faltenbacher, A., & Brighenti, F. 2006, ApJ, 638, 659 [NASA ADS] [CrossRef]
- McCarthy, I. G., Babul, A., Bower, R. G., & Balogh, M. L. 2007, ArXiv e-prints, 706 (In the text)
- McNamara, B. R., & Nulsen, P. E. J. 2007, ARA&A, 45, 117 [NASA ADS] [CrossRef] (In the text)
- McNamara, B. R., & O'Connell, R. W. 1989, AJ, 98, 2018 [NASA ADS] [CrossRef]
- McNamara, B. R., Wise, M., Nulsen, P. E. J., et al. 2000, ApJ, 534, L135 [NASA ADS] [CrossRef] (In the text)
- McNamara, B. R., Wise, M. W., Nulsen, P. E. J., et al. 2001, ApJ, 562, L149 [NASA ADS] [CrossRef] (In the text)
- Merloni, A., Körding, E., Heinz, S., et al. 2006, New Astron., 11, 567 [NASA ADS] [CrossRef]
- Miller, N. A. 2005, AJ, 130, 2541 [NASA ADS] [CrossRef]
- Mittaz, J. P. D., Kaastra, J. S., Tamura, T., et al. 2001, A&A, 365, L93 [NASA ADS] [CrossRef] [EDP Sciences]
- Morrison, G. E., & Owen, F. N. 2003, AJ, 125, 506 [NASA ADS] [CrossRef]
- Nagar, N. M., Falcke, H., & Wilson, A. S. 2005, A&A, 435, 521 [NASA ADS] [CrossRef] [EDP Sciences] (In the text)
- Nulsen, P. E. J., et al. 2006, ArXiv Astrophysics e-prints
- O'Hara, T. B., Mohr, J. J., Bialek, J. J., et al. 2006, ApJ, 639, 64 [NASA ADS] [CrossRef]
- Owen, F. N., Ledlow, M. J., Keel, W. C., & Morrison, G. E. 1999, AJ, 118, 633 [NASA ADS] [CrossRef] (In the text)
- Patnaik, A. R., & Singh, K. P. 1988, MNRAS, 234, 847 [NASA ADS]
- Peng, C. Y., Ho, L. C., Impey, C. D., & Rix, H.-W. 2002, AJ, 124, 266 [NASA ADS] [CrossRef] (In the text)
- Peres, C. B., Fabian, A. C., Edge, A. C., et al. 1998, MNRAS, 298, 416 [NASA ADS] [CrossRef]
- Peterson, J. R., Paerels, F. B. S., Kaastra, J. S., et al. 2001, A&A, 365, L104 [NASA ADS] [CrossRef] [EDP Sciences]
- Peterson, J. R., Kahn, S. M., Paerels, F. B. S., et al. 2003, ApJ, 590, 207 [NASA ADS] [CrossRef]
- Pope, E. C. D., Pavlovski, G., Kaiser, C. R., & Fangohr, H. 2005, MNRAS, 364, 13 [NASA ADS] [CrossRef] (In the text)
- Popesso, P., Biviano, A., Böhringer, H., & Romaniello, M. 2007, A&A, 464, 451 [NASA ADS] [CrossRef] [EDP Sciences]
- Press, W. H., Teukolsky, S. A., Vetterling, W. T., & Flannery, B. P. 1992, Numerical recipes in FORTRAN. The art of scientific computing (Cambridge: University Press), 2nd ed (In the text)
- Rafferty, D., McNamara, B., & Nulsen, P. 2008, ArXiv e-prints, 802
- Rafferty, D. A., McNamara, B. R., Nulsen, P. E. J., & Wise, M. W. 2006, ApJ, 652, 216 [NASA ADS] [CrossRef]
- Reiprich, T. H., & Böhringer, H. 2002, ApJ, 567, 716 [NASA ADS] [CrossRef] (In the text)
- Ricker, P. M., & Sarazin, C. L. 2001, ApJ, 561, 621 [NASA ADS] [CrossRef] (In the text)
- Roychowdhury, S., Ruszkowski, M., Nath, B. B., & Begelman, M. C. 2004, ApJ, 615, 681 [NASA ADS] [CrossRef]
- Ruszkowski, M., Brüggen, M., & Begelman, M. C. 2004, ApJ, 615, 675 [NASA ADS] [CrossRef]
- Sakelliou, I., Peterson, J. R., Tamura, T., et al. 2002, A&A, 391, 903 [NASA ADS] [CrossRef] [EDP Sciences]
- Sanders, J. S., Fabian, A. C., Allen, S. W., et al. 2008, MNRAS, 385, 1186 [NASA ADS] [CrossRef]
- Scannapieco, E., Silk, J., & Bouwens, R. 2005, ApJ, 635, L13 [NASA ADS] [CrossRef]
- Schlegel, D. J., Finkbeiner, D. P., & Davis, M. 1998, ApJ, 500, 525 [NASA ADS] [CrossRef] (In the text)
- Seigar, M. S., Graham, A. W., & Jerjen, H. 2007, MNRAS, 378, 1575 [NASA ADS] [CrossRef] (In the text)
- Shabala, S. S., Ash, S. A., Alexander, P., & Riley, J. M. 2008, ArXiv e-prints (In the text)
- Sijacki, D., Springel, V., di Matteo, T., & Hernquist, L. 2007, MNRAS, 380, 877 [NASA ADS] [CrossRef]
- Silk, J., & Rees, M. J. 1998, A&A, 331, L1 [NASA ADS]
- Skrutskie, M. F., Cutri, R. M., Stiening, R., et al. 2006, AJ, 131, 1163 [NASA ADS] [CrossRef] (In the text)
- Slee, O. B., Roy, A. L., Murgia, M., Andernach, H., & Ehle, M. 2001, AJ, 122, 1172 [NASA ADS] [CrossRef]
- Sun, M., Jones, C., Murray, S. S., et al. 2003, ApJ, 587, 619 [NASA ADS] [CrossRef] (In the text)
- Tamura, T., Kaastra, J. S., Peterson, J. R., et al. 2001, A&A, 365, L87 [NASA ADS] [CrossRef] [EDP Sciences]
- Valentijn, E. A., & Bijleveld, W. 1983, A&A, 125, 223 [NASA ADS]
- Venturi, T., Bardelli, S., Zagaria, M., Prandoni, I., & Morganti, R. 2002, A&A, 385, 39 [NASA ADS] [CrossRef] [EDP Sciences]
- Voigt, L. M., & Fabian, A. C. 2004, MNRAS, 347, 1130 [NASA ADS] [CrossRef] (In the text)
- Voit, G. M., & Donahue, M. 2005, ApJ, 634, 955 [NASA ADS] [CrossRef]
- Voit, G. M., Cavagnolo, K. W., Donahue, M., et al. 2008, ArXiv e-prints, 806
- von der Linden, A., Best, P. N., Kauffmann, G., & White, S. D. M. 2007, MNRAS, 379, 867 [NASA ADS] [CrossRef]
- Xu, H., Kahn, S. M., Peterson, J. R., et al. 2002, ApJ, 579, 600 [NASA ADS] [CrossRef]
- Zheng, Z., Coil, A. L., & Zehavi, I. 2007, ApJ, 667, 760 [NASA ADS] [CrossRef]
Online Material
Table 1: Radio data details for the central radio sources in the HIFLUGS sample of galaxy clusters.
Footnotes
- ... clusters
- Table 1 is only available in electronic form at http://www.aanda.org
- ... galaxy
- We use the terms ``radio galaxy'' and ``AGN'' interchangeably throughout this paper.
- ...

- A detailed description of
how
is calculated can be found in Hudson et al. (2008).
- ... (XSC
- http://irsa.ipac.caltech.edu/Missions/2mass.html
- ... (NED
- http://nedwww.ipac.caltech.edu
- ... Hyperleda
- http://leda-univ-lyon1.fr
All Tables
Table 1: Radio data details for the central radio sources in the HIFLUGS sample of galaxy clusters.
All Figures
| |
Figure 1: The separation between the BCG and the X-ray Peak. Plotted on the X-axis are numbers assigned to each cluster arbitrarily. The filled circles (blue) represent BCGs which harbor a radio source and the crosses (red) correspond to BCGs without one. The black horizontal line at y = 50 h71-1 kpc corresponds to the criterion for determining whether or not a cluster has a CRS and the grey horizontal line at y = 12 h71-1 kpc corresponds to the worst uncertainty associated with the position of the X-ray peak in the sample. |
| Open with DEXTER | |
| In the text | |
| |
Figure 2: The radio spectra of the cluster central radio sources. Shown in the left panel are the spectra of all 48 CCRSs, where the symbols are the actual measurements. Most of the measurements at 74 MHz and 1.4 GHz are taken from VLSS and NVSS, respectively. Shown in the right panel are the spectra of only those CCRSs which show spectral curvature. The black horizontal solid line represents the VLSS point-source sensitivity constraint at the VLSS observing frequency of 74 MHz indicated by the black vertical line. |
| Open with DEXTER | |
| In the text | |
| |
Figure 3:
A comparison between the radio luminosity integrated between 10 MHz and 15 GHz and the monochromatic radio luminosity at 1.4 GHz (red solid line). The dotted grey lines correspond to 1- |
| Open with DEXTER | |
| In the text | |
| |
Figure 4: The central cooling-time distribution clearly showing the steep rise in the fraction of clusters with cooling times shorter than 1 Gyr. For clarity, we show the distribution in both linear as well as log scale (inset panel) on the x-axis. |
| Open with DEXTER | |
| In the text | |
| |
Figure 5:
Cooling time as an indicator of cool core. Left: the central temperature drop. Right: the slope in the surface brightness profile, cuspiness, at |
| Open with DEXTER | |
| In the text | |
| |
Figure 6:
The fraction of strong cool-core (SCC) clusters,
weak cool-core (WCC) clusters and non-cool-core (NCC)
clusters in the
|
| Open with DEXTER | |
| In the text | |
| |
Figure 7:
The central cooling-time versus the integrated radio
luminosity for the CCRSs in CC clusters (SCC + WCC). The black
solid line represents the anti-correlation trend which breaks down
for clusters with
|
| Open with DEXTER | |
| In the text | |
| |
Figure 8:
Radio and X-ray correlation plots. Left:
total radio luminosity vs.
|
| Open with DEXTER | |
| In the text | |
| |
Figure 9: The entropy profiles of the WCC clusters. All with a central radio source are shown in black (plus) symbols and four without are shown in colored (non-plus) symbols. The errorbars on those with a central radio source are omitted for clarity. The strong jumps apparent in some of the entropy profiles are insignificant relative to the errorbars. |
| Open with DEXTER | |
| In the text | |
| |
Figure 10:
The mass of the SMBH versus the total radio
luminosity of the BCG in SCC (blue filled circles), WCC (green open circles) and NCC (red open squares) clusters. Visible is a weak trend given by solid blue line for the SCC clusters such that
the
|
| Open with DEXTER | |
| In the text | |
| |
Figure 11:
The 2MASS K-band total magnitudes of the 64 BCGs in the
|
| Open with DEXTER | |
| In the text | |
Copyright ESO 2009
Current usage metrics show cumulative count of Article Views (full-text article views including HTML views, PDF and ePub downloads, according to the available data) and Abstracts Views on Vision4Press platform.
Data correspond to usage on the plateform after 2015. The current usage metrics is available 48-96 hours after online publication and is updated daily on week days.
Initial download of the metrics may take a while.