| Issue |
A&A
Volume 500, Number 3, June IV 2009
|
|
|---|---|---|
| Page(s) | 1281 - 1285 | |
| Section | Astronomical instrumentation | |
| DOI | https://doi.org/10.1051/0004-6361/200911824 | |
| Published online | 13 May 2009 | |
Design, analysis, and testing of a microdot apodizer for the apodized pupil Lyot coronagraph
(Research Note)
II. Impact of the dot size
P. Martinez1 - C. Dorrer2 - M. Kasper1 - A. Boccaletti3 - K. Dohlen4
1 - European Southern Observatory, Karl-Schwarzschild-Strasse 2, 85748 Garching, Germany
2 - Aktiwave, 241 Ashley drive, Rochester, NY 14620, USA
3 - LESIA, Observatoire de Paris Meudon, 5 pl. J. Janssen, 92195 Meudon, France
4 - LAM, Laboratoire d´Astrophysique de Marseille, 38 rue Frédéric Joliot Curie, 13388 Marseille Cedex 13, France
Received 11 February 2009 / Accepted 10 April 2009
Abstract
Context. The Apodized Pupil Lyot Coronagraph (APLC) is a promising coronagraphic device for direct exoplanet detection with the European Extremely Large Telescope. This concept features amplitude apodization in the entrance aperture, and a small opaque Lyot mask in the focal plane. We present new near-IR laboratory results using binary apodizers - the so-called microdot apodizer - which represent a very attractive and advantageous solution for the APLC.
Aims. Microdot apodizers introduce high-frequency noise whose characteristics depend on the pixel size. The aim of this work is to characterize the impact of the pixel size on the coronagraphic image. We aim to estimate both the noise intensity and its localization in the field of view.
Methods. The microdot apodizer, consisting of an array of pixels with spatially variable density that are either opaque or transparent, was manufactured by lithography of a light-blocking metal layer deposited on a transparent substrate. A set of 5 masks has been designed with different pixel sizes, tested in the near-IR, and their behavior compared to theoretical models.
Results. Stray light diffraction introduced by the finite pixel size was measured during experiments. The intensity decreases, and radial distance increases, when the pixel size gets smaller.
Conclusions. The physical properties of these microdot apodizers have been demonstrated in the laboratory. The microdot apodizer is a suitable solution for any coronagraph using pupil amplitude apodization, if properly designed.
Key words: techniques: high angular resolution - instrumentation: high angular resolution - telescopes
1 Introduction
Overcoming the high contrast between bright astrophysical sources and sub-stellar companions is required for direct detection and spectroscopy of extra-solar planets. In this context, a coronagraph used downstream of an eXtreme Adaptive Optics (XAO) system is a powerful tool to improve the sensitivity of an imaging system to faint structures surrounding a bright source. Efficient XAO systems are required to correct wavefront errors due to atmospheric turbulence, while coronagraphs are designed to suppress, or at least attenuate, the starlight diffracted by the telescope.
![\begin{figure}
\par\includegraphics[width=8.5cm,clip]{FIGURES2/1824figA.eps}\hspace*{5mm}
\includegraphics[width=8.5cm,clip]{FIGURES2/1824figB.eps}
\end{figure}](/articles/aa/full_html/2009/24/aa11824-09/img5.png) |
Figure 1:
Left: first order diffraction peak position (fg in |
| Open with DEXTER | |
The Apodized Pupil Lyot Coronagraph (Aime et al. 2002; Soummer et al. 2003, APLC) is a promising design for forthcoming planet-finder instruments on large ground-based telescopes (Soummer et al. 2009; Martinez et al. 2008a,2007; Soummer 2005). The main technical challenge in building an APLC is the apodizer. Prototypes are currently being developed using different approaches and tested to validate the concept in laboratory conditions (Boccaletti et al. 2008; Martinez et al. 2008b,2009; Thomas et al. 2008).
In this paper, we present near-IR laboratory results to characterize a new technological solution for apodizer manufacture. In a former study (Martinez et al. 2009, hereafter Paper I), we explored a halftone-dot process to generate an array of binary pixels, either transparent or opaque, where the density of opaque pixels is spatially varying. This technique aims to solve the drawbacks of a continuous deposit of a metal layer with spatially varying thickness. The main advantages of a microdot apodizer are: (1) accuracy of the transmission profile; (2) achromaticity; (3) no spatially-varying phase; (4) reproducibility.
In Paper I, we reported that microdot apodizers exhibit blue noise properties (i.e. high spatial frequency noise), when designed for coronagraphy. Although numerical simulations and theoretical predictions confirm noise in the coronagraphic image, its impact was found to be negligible during experiments. Our first prototype (mask 1, hereafter) was designed to push this noise out of our field of view of interest at a deep contrast level, as a result of a fine adjustment of the pixel size (4.5 ![]() m). Here, our purpose is to investigate the noise properties using 5 new masks with the same transmission profile as mask 1, but by successively increasing the pixel size. The interest is twofold: (1) to confirm the theoretical predictions of the physical properties of such devices with laboratory experiments; (2) derive general relevant information for the design of amplitude microdot apodization masks for coronagraphy (whatever the coronagraph). Section 2 briefly reviews microdot apodizer theoretical properties, while Sect. 3 describes the experiment as well as the manufacturing details of the new masks. In Sect. 4 we present and discuss results obtained in the experiment, and in Sect. 5 we draw conclusions.
m). Here, our purpose is to investigate the noise properties using 5 new masks with the same transmission profile as mask 1, but by successively increasing the pixel size. The interest is twofold: (1) to confirm the theoretical predictions of the physical properties of such devices with laboratory experiments; (2) derive general relevant information for the design of amplitude microdot apodization masks for coronagraphy (whatever the coronagraph). Section 2 briefly reviews microdot apodizer theoretical properties, while Sect. 3 describes the experiment as well as the manufacturing details of the new masks. In Sect. 4 we present and discuss results obtained in the experiment, and in Sect. 5 we draw conclusions.
2 Microdot apodizer theoretical properties
We briefly review the microdot apodizer theoretical properties (i.e. the signature of the dots in the coronagraphic image) using the same notation as defined in Paper I. A microdot apodizer is modeled as an aperiodic under-filled two-dimensional grating. Such a device exhibits blue noise properties owing to the error diffusion algorithm used to calculate the distribution of pixels (i.e. dots) that best approximates the required field transmission (Floyd & Steinberg 1976; Ulichney 1987; Dorrer & Zuegel 2007). The binary pattern produces an average gray level value (
![]() ,
i.e. average amplitude transmission) from an apodizer profile with intensity transmission T. The resulting noise spectrum of such a device is set by the minority type of pixels present on the device (i.e. by g, non-metal pixels when g < 0.5 and by metal pixels otherwise). The spectral energy therefore increases as the number of minority pixels increases, peaking at g=0.5 (Ulichney 1987). In the precise case of square pixels (Ulichney 1988), the noise spectrum of the pattern exhibits an energy concentration around a first order diffraction peak (fg) localized in the field of view in
,
i.e. average amplitude transmission) from an apodizer profile with intensity transmission T. The resulting noise spectrum of such a device is set by the minority type of pixels present on the device (i.e. by g, non-metal pixels when g < 0.5 and by metal pixels otherwise). The spectral energy therefore increases as the number of minority pixels increases, peaking at g=0.5 (Ulichney 1987). In the precise case of square pixels (Ulichney 1988), the noise spectrum of the pattern exhibits an energy concentration around a first order diffraction peak (fg) localized in the field of view in ![]() units as:
units as:
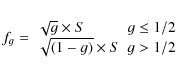
where S is the scaling (or sampling) ratio between the pupil diameter (
In Paper I we presented a simplified model for an order-of-magnitude estimation of the high-spatial frequency noise intensity in coronagraphic systems (Dohlen 2008). The speckle halo in the coronagraphic image resulting from the non-regular dot distribution broadens the first order diffraction peak fg with an intensity Ig defined as:
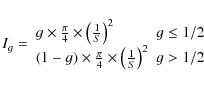
In Fig. 1 we plot the first order diffraction halo localization in the field, and its intensity (normalized by the stellar flux), as a function of the gray level for the set of scaling factors (S) we used for prototyping. Decreasing the scaling factor, i.e. increasing the pixel size, therefore moves the first order diffraction halo closer to the central core of the coronagraphic image, with an increase of intensity.
Table 1: Summary of theoretical values and laboratory measurements of the pixelation noise properties.
3 Experiment
3.1 Masks design and optical setup
The configuration of the apodizer profile is similar to that described in Paper I (4.5 ![]() APLC,
APLC, ![]() mm due to constraints on our optical bench). The 5 new apodizer masks were fabricated by Precision Optical Imaging in Rochester, New York. The amplitude pupil masks were fabricated using wet etch contact lithography of a regular Chrome layer (OD = 4) deposited on a BK7 glass substrate (
mm due to constraints on our optical bench). The 5 new apodizer masks were fabricated by Precision Optical Imaging in Rochester, New York. The amplitude pupil masks were fabricated using wet etch contact lithography of a regular Chrome layer (OD = 4) deposited on a BK7 glass substrate (
![]() peak-to-valley), with antireflection coating for the H-band (1.2 to 1.8
peak-to-valley), with antireflection coating for the H-band (1.2 to 1.8 ![]() m,
m, ![]() )
on their back faces.
)
on their back faces.
Mask 1 had a specified scaling factor of 500 corresponding to a 6 ![]() m pixels grid, but finally appeared smaller (4.5
m pixels grid, but finally appeared smaller (4.5 ![]() m), as a predictable result of the manufacturing process. Hereafter microdot masks 2-6 have scaling factors specified as 200, 100, 50, 25, and 12.5 corresponding to 15, 30, 60, 120, and 240
m), as a predictable result of the manufacturing process. Hereafter microdot masks 2-6 have scaling factors specified as 200, 100, 50, 25, and 12.5 corresponding to 15, 30, 60, 120, and 240 ![]() m pixels respectively. Therefore, pixels size, i.e. dot size, increases by a factor of 2 from mask to mask. Table 1 gathers all the microdot mask characteristics and noise properties predicted by theory (Eqs. (1) and (2)). The experimental configuration is similar to that described in Paper I. The optical setup is designed to simulate the 8-m VLT pupil and to operate in the near-infrared (the H-band). The Strehl ratio of the bench is
m pixels respectively. Therefore, pixels size, i.e. dot size, increases by a factor of 2 from mask to mask. Table 1 gathers all the microdot mask characteristics and noise properties predicted by theory (Eqs. (1) and (2)). The experimental configuration is similar to that described in Paper I. The optical setup is designed to simulate the 8-m VLT pupil and to operate in the near-infrared (the H-band). The Strehl ratio of the bench is
![]() .
The IR camera used (the Infrared Test Camera) uses a HAWAII 1k
.
The IR camera used (the Infrared Test Camera) uses a HAWAII 1k ![]() 1k detector. The experiment was carried out in H-band using either a narrow filter (
1k detector. The experiment was carried out in H-band using either a narrow filter (
![]() )
or a broadband filter (
)
or a broadband filter (
![]() ). The APLC pupil-stop is also similar to that of paper I and remains the same during the experiment.
). The APLC pupil-stop is also similar to that of paper I and remains the same during the experiment.
3.2 Inspection of the apodizers
A metrology inspection of these 5 masks has been made using a Shadowgraph (![]() ,
see left column of Fig. 2). The chrome dot size has been determined to be 15, 29, 57, 119, and 240
,
see left column of Fig. 2). The chrome dot size has been determined to be 15, 29, 57, 119, and 240 ![]() m
m ![]()
![]() m for mask 2 to 6 respectively, and are therefore close to the specifications. The slight pixel under-sizing of mask 3 to 5 with respect to the specifications has a negligible impact on their high-frequency noise properties. Unlike mask 1, mask 2 to 6 were not numerically pre-compensated to avoid an increase of transmission - as a result of a reduction of the metal dots during the wet-ech lithography process - since dot size was less critical than for mask 1. This pre-compensation in the digital design corrects for edge effects on the light-blocking metal dots resulting from the isotropic wet etching process (see Paper I for more details), by estimating the feature size that would be obtained after fabrication. Pre-compensation is mainly relevant when dots size are very small, since fabrication errors become more important.
m for mask 2 to 6 respectively, and are therefore close to the specifications. The slight pixel under-sizing of mask 3 to 5 with respect to the specifications has a negligible impact on their high-frequency noise properties. Unlike mask 1, mask 2 to 6 were not numerically pre-compensated to avoid an increase of transmission - as a result of a reduction of the metal dots during the wet-ech lithography process - since dot size was less critical than for mask 1. This pre-compensation in the digital design corrects for edge effects on the light-blocking metal dots resulting from the isotropic wet etching process (see Paper I for more details), by estimating the feature size that would be obtained after fabrication. Pre-compensation is mainly relevant when dots size are very small, since fabrication errors become more important.
The spatially-resolved transmission of each apodizer was measured. An iris in the far field has been used to obtain the low-frequency component of each mask to verify the global shape (i.e. the symmetry). Accuracy of the profile is about 3-5![]() in the near-IR (achromaticity was demonstrated with mask 1 in Paper I in J and H-bands). The evaluation of the impact of their high-frequency contents at the coronagraphic image level is the objective of this paper.
in the near-IR (achromaticity was demonstrated with mask 1 in Paper I in J and H-bands). The evaluation of the impact of their high-frequency contents at the coronagraphic image level is the objective of this paper.
![\begin{figure}
\par\includegraphics[width=5cm]{FIGURES2/1824figC.eps}\includegra...
.../1824figP.eps}\includegraphics[width=4.6cm]{FIGURES2/1824figQ.eps}
\end{figure}](/articles/aa/full_html/2009/24/aa11824-09/img29.png) |
Figure 2:
Left: shadowgraph inspection ( |
| Open with DEXTER | |
![\begin{figure}
\par\includegraphics[width=8.5cm,clip]{FIGURES2/1824figR.eps}\hspace*{0.5cm}
\includegraphics[width=8.5cm,clip]{FIGURES2/1824figS.eps}
\end{figure}](/articles/aa/full_html/2009/24/aa11824-09/img30.png) |
Figure 3:
Summary of coronagraphic radial profiles (
|
| Open with DEXTER | |
4 Results and discussion
Coronagraphic images recorded on the bench using masks 2 to 6 are presented in Fig. 2 (central column:
![]() ,
right column:
,
right column:
![]() ).
Speckles are clearly visible, as well as speckle elongation when a broadband filter is used (Fig. 2, right column). Qualitatively, the speckle halo behavior is a function of S: when reducing the pixel size (from mask 6 to mask 2), the first order diffraction halo moves further away. When the halo is far enough away from the central core of the PSF, a usable field of view cleaned of speckles appears and reveals the residual diffraction from the pupil (spider vane diffraction spikes).
).
Speckles are clearly visible, as well as speckle elongation when a broadband filter is used (Fig. 2, right column). Qualitatively, the speckle halo behavior is a function of S: when reducing the pixel size (from mask 6 to mask 2), the first order diffraction halo moves further away. When the halo is far enough away from the central core of the PSF, a usable field of view cleaned of speckles appears and reveals the residual diffraction from the pupil (spider vane diffraction spikes).
Coronagraphic profiles obtained with each mask are presented in Fig. 3 (left), along with simulations (Fig. 3, right). Simulations assumed perfect microdots apodizers and bench conditions (VLT-like pupil, same bandwidth and similar Strehl ratio). In Table 1 we compare the intensity and localization of the first order diffraction halo measured and predicted by Eqs. (1) and (2). The intensity has been measured on the halo peak.
All the tests performed with these 5 new masks confirmed Eqs. (1) and (2). Mask 6 and 5 (black and red curves) revealed several orders of diffraction peaks broadened by speckles, that are angularly separated by ![]() S (in
S (in ![]() unit), and localized at S/2, 3S/2, 5S/2 etc. In each case, each speckle halo has an extent of the order of S in
unit), and localized at S/2, 3S/2, 5S/2 etc. In each case, each speckle halo has an extent of the order of S in ![]() .
For Mask 2, the speckle halo was only partially imaged on the detector (limited by the detector field of view,
.
For Mask 2, the speckle halo was only partially imaged on the detector (limited by the detector field of view, ![]()
![]()
![]() )
and locally estimated at
)
and locally estimated at
![]() ,
its averaged position in the field was evaluated using a 633 nm laser and a visible mini-camera (see Fig. 4, allowing a 360
,
its averaged position in the field was evaluated using a 633 nm laser and a visible mini-camera (see Fig. 4, allowing a 360 ![]() 360
360![]() field of view). In such a case, the Lyot focal mask appears bigger (
field of view). In such a case, the Lyot focal mask appears bigger (![]()
![]() )
but does not impact the halo position estimated at 108
)
but does not impact the halo position estimated at 108![]() .
The relative intensity of the halo meets predictions (measured locally - in H-band -, while for previous masks, an azimuthal average was performed).
.
The relative intensity of the halo meets predictions (measured locally - in H-band -, while for previous masks, an azimuthal average was performed).
We carried out the same test with a broadband filter in H (
![]() ), and we did not observe any modification of the behavior (Fig. 2, right column). Comparison with simulated coronagraphic profiles (Fig. 3, right) presents a slight discrepancy, mainly for masks 2 and 3, at small angular distance, without impacting the halo intensity and position. This discrepancy is within the error loss of the profile, apodizer alignment, and bench quality, as discussed in Paper I.
), and we did not observe any modification of the behavior (Fig. 2, right column). Comparison with simulated coronagraphic profiles (Fig. 3, right) presents a slight discrepancy, mainly for masks 2 and 3, at small angular distance, without impacting the halo intensity and position. This discrepancy is within the error loss of the profile, apodizer alignment, and bench quality, as discussed in Paper I.
The directionally of the noise clearly seen in Fig. 2 (central and right columns) and Fig. 4 is a result of the diffusion error algorithm used to distribute the dots (left column of Fig. 2). Therefore, from the rise of the speckle halo, better performances are reachable in some directions.
We further probe the far field in the coronagraphic image when using mask 1 in visible and infrared wavelengths, but as in Paper I, no noise was detected during the experiment. Mask 1 was actually specified for coronagraphic applications (the scaling was specified to S = 500 and ended at S=666, see Paper I), while masks 2 to 6 were designed to reveal and analyze the signature of the dots in the coronagraphic image. As a result of its specification, the noise introduced by mask 1 was at such a high frequency, and low intensity, that it was not measurable on our bench.
The theoretical predictions are therefore confirmed. The simplified model used for an order-of-magnitude estimation of the pixelation noise intensity in coronagraphic image is representative of the APLC situation. Considering the validity of Eqs. (1) and (2), presented in Fig. 1, we can therefore properly design a microdot apodizer (i.e. select the pixel size) for any coronagraph concept featuring amplitude pupil apodization. The selection of the pixel size must be defined by pushing the first order diffraction halo out of the field of interest (Eq. (1)) and by reducing its intensity (Eq. (2)) to avoid any limitations imposed even by the rise to the speckle halo. The apodizer amplitude transmission (g) as well as the sampling factor (S) drive this choice.
Ideally, going to very small pixel size improves the accuracy of the profile transmission (i.e. the sampling problem). In practice, getting good accuracy becomes more difficult because fabrication errors become more important as the pixel size decreases, therefore an increase of the pre-compensation algorithm accuracy is required. When the pixel size is comparable to the wavelength of light, the transmission is affected by plasmons (Huang & Zhu 2007; Genet & Ebbesen 2007). Therefore, we note that in such a sub-wavelength regime, a RCWA (Rigorous Coupled Wave Analysis) would be mandatory for a more refined analysis of the dependence of optimal pixel size on wavelength.
![\begin{figure}
\par\includegraphics[width=6.5cm,clip]{FIGURES2/1824figT.eps}
\end{figure}](/articles/aa/full_html/2009/24/aa11824-09/img36.png) |
Figure 4: Coronagraphic image using mask 2, recorded with a visible mini-camera (using a 633 nm laser). |
| Open with DEXTER | |
5 Conclusion
We reported on additional development and laboratory experiments of microdot apodizers for the Apodized Pupil Lyot Coronagraph. Testing different pixel size configurations allowed us to confirm theoretical predictions of Paper I. We demonstrated agreement between laboratory measurements and theoretical models. The predicated coronagraphic PSF of APLC using a microdot apodizer is confirmed by experiments, and any coronagraph that features amplitude pupil apodization can be properly designed following the prediction of Eqs. (1) and (2). Furthermore, the microdot technique will be the baseline approach for the apodizer of the Apodized Pupil Lyot Coronagraph for EPICS (Kasper et al. 2008) as well as for GPI (Macintosh et al. 2006).
In addition, we are currently extending the technique to the manufacture of Band-Limited masks (Kuchner & Traub 2002). Results of this development will be presented in a forthcoming paper.
Acknowledgements
This activity is supported by the European Community under its Framework Programme 6, ELT Design Study, Contract No. 011863.
References
- Aime, C., Soummer, R., & Ferrari, A. 2002, A&A, 389, 334 [NASA ADS] [CrossRef] [EDP Sciences]
- Boccaletti, A., Abe, L., Baudrand, J., et al. 2008, in Proc. SPIE
- Dohlen, K. 2008, in Proc. SPIE (In the text)
- Dorrer, C., & Zuegel, J. D. 2007, J. Opt. Soc. Am. B, 24, 1268 [NASA ADS] [CrossRef]
- Floyd, R. W., & Steinberg, L. 1976, J. Soc. Inf. Disp. 17, 7577
- Genet, C., & Ebbesen, T. W. 2007, Nature, 445, 39 [NASA ADS] [CrossRef]
- Huang, C.-P., & Zhu, Y.-Y. 2007, Active and Passive Electronic Components (Hindawi Publishing Corporation)
- Kasper, M., Beuzit, J.-L., Verinaud, C., et al. 2008, in Proc. SPIE (In the text)
- Kuchner, M. J., & Traub, W. A. 2002, ApJ, 570, 900 [NASA ADS] [CrossRef] (In the text)
- Macintosh, B., Graham, J., Palmer, D., et al. 2006, in Advances in Adaptive Optics II, ed. B. L. Ellerbroek, & D. Bonaccini Calia, Proc. SPIE, 6272, 62720L (In the text)
- Martinez, P., Boccaletti, A., Kasper, M., Baudoz, P., & Cavarroc, C. 2007, A&A, 474, 671 [NASA ADS] [CrossRef] [EDP Sciences]
- Martinez, P., Boccaletti, A., Kasper, M., et al. 2008a, A&A, 492, 289 [NASA ADS] [CrossRef] [EDP Sciences]
- Martinez, P., Dorrer, C., Aller Carpentier, E., et al. 2009, A&A, 495, 363 [NASA ADS] [CrossRef] [EDP Sciences]
- Martinez, P., Vernet, E., Dorrer, C., et al. 2008b, in Proc. SPIE, 7015
- Soummer, R. 2005, ApJ, 618, L161 [NASA ADS] [CrossRef]
- Soummer, R., Aime, C., & Falloon, P. E. 2003, A&A, 397, 1161 [NASA ADS] [CrossRef] [EDP Sciences]
- Soummer, R., Pueyo, L., Ferrari, A., et al. 2009, ApJ, 695, 695 [NASA ADS] [CrossRef]
- Thomas, J. S., Soummer, R., Dillon, D., et al. 2008, in Proc. SPIE
- Ulichney, R. 1987 (The MIT Press)
- Ulichney, R. 1988, Proc. IEEE, 76, 56 [CrossRef] (In the text)
All Tables
Table 1: Summary of theoretical values and laboratory measurements of the pixelation noise properties.
All Figures
| |
Figure 1:
Left: first order diffraction peak position (fg in |
| Open with DEXTER | |
| In the text | |
| |
Figure 2:
Left: shadowgraph inspection ( |
| Open with DEXTER | |
| In the text | |
| |
Figure 3:
Summary of coronagraphic radial profiles (
|
| Open with DEXTER | |
| In the text | |
| |
Figure 4: Coronagraphic image using mask 2, recorded with a visible mini-camera (using a 633 nm laser). |
| Open with DEXTER | |
| In the text | |
Copyright ESO 2009
Current usage metrics show cumulative count of Article Views (full-text article views including HTML views, PDF and ePub downloads, according to the available data) and Abstracts Views on Vision4Press platform.
Data correspond to usage on the plateform after 2015. The current usage metrics is available 48-96 hours after online publication and is updated daily on week days.
Initial download of the metrics may take a while.