| Issue |
A&A
Volume 500, Number 3, June IV 2009
|
|
|---|---|---|
| Page(s) | 1077 - 1087 | |
| Section | Interstellar and circumstellar matter | |
| DOI | https://doi.org/10.1051/0004-6361/200811233 | |
| Published online | 16 April 2009 | |
The physical conditions in Gomez's Hamburger
(IRAS 18059-3211), a pre-MS rotating disk![[*]](/icons/foot_motif.png)
V. Bujarrabal1 - K. Young2 - A. Castro-Carrizo3
1 - Observatorio Astronómico Nacional (OAN-IGN),
Apartado 112, 28803 Alcalá de Henares, Spain
2 -
Harvard-Smithsonian Center for Astrophysics, 60 Garden Street,
Cambridge, MA 02138, USA
3 -
Institut de RadioAstronomie Millimétrique (IRAM), 300 rue de la
Piscine, 38406 St. Martin d'Hères, France
Received 27 October 2008 / Accepted 2 February 2009
Abstract
Aims. We aim to study the structure, dynamics, and physical conditions of Gomez's Hamburger (IRAS 18059-3211; GoHam), and in particular confirm that GoHam mainly consists of a flaring disk in Keplerian rotation around a young, probably pre-MS star.
Methods. We present high resolution SMA maps of 12CO J = 2-1, 13CO J = 2-1, 12CO J = 3-2, and C17O J = 3-2, as well as data on 12CO J=6-5 and the continuum flux at these wavelengths. Spatial resolutions as high as 1
![]() are attained. Except for the C17O data, the dynamical ranges are larger than 10. The maps are compared with a numerical model, which simulates the emission of a rotating disk with the expected general properties of such objects, and a very satisfactory fitting of our maps is obtained. The meaning and reliability of our results are thoroughly discussed.
are attained. Except for the C17O data, the dynamical ranges are larger than 10. The maps are compared with a numerical model, which simulates the emission of a rotating disk with the expected general properties of such objects, and a very satisfactory fitting of our maps is obtained. The meaning and reliability of our results are thoroughly discussed.
Results. Our observations allow measurement of the main properties of GoHam on scales of between ![]() 1
1
![]() (
(![]()
![]() cm, for the assumed distance, 300 pc) and the total extent of the nebula, 14
cm, for the assumed distance, 300 pc) and the total extent of the nebula, 14
![]() .
We are able to measure the global structure of the gas-rich disk, which is found to be flaring, and its dynamics, which is clearly dominated by Keplerian rotation, with a small degree of turbulence. The combination of different lines, in particular of different opacities, allows us to estimate reasonably the distributions of gas temperature and density. We clearly find a significant and sharp increase in temperature at large distances from the equator, accompanied by a decrease in density of the same order. Finally, we identify a condensation in the southern part of the disk that has no counterparts in the northern nebula. This condensation is quite extended (about
.
We are able to measure the global structure of the gas-rich disk, which is found to be flaring, and its dynamics, which is clearly dominated by Keplerian rotation, with a small degree of turbulence. The combination of different lines, in particular of different opacities, allows us to estimate reasonably the distributions of gas temperature and density. We clearly find a significant and sharp increase in temperature at large distances from the equator, accompanied by a decrease in density of the same order. Finally, we identify a condensation in the southern part of the disk that has no counterparts in the northern nebula. This condensation is quite extended (about
![]() cm), contains a significant amount of mass (roughly,
cm), contains a significant amount of mass (roughly, ![]()
![]()
![]() ), and seems to be associated with a detectable distortion of the global rotation kinematics. We discuss several possible interpretations of that feature.
), and seems to be associated with a detectable distortion of the global rotation kinematics. We discuss several possible interpretations of that feature.
Key words: stars: circumstellar matter - stars: planetary systems: protoplanetary disks - stars: formation - stars: individual: Gomez's Hamburger
1 Introduction
Originally identified on a plate by A. Gómez in 1985, Gomez's Hamburger (IRAS 18059-3211; hereafter GoHam) is a very interesting nebula that remains poorly studied. It has a spectacular optical image (see Ruiz et al. 1987; Bujarrabal et al. 2008, and HST images in press release number 2002-19), in which a dark lane of dust separates two flat, bright regions, presumably illuminated by a central star that remains hidden by the equatorial disk. From spectroscopic analysis of the scattered light (Ruiz et al. 1987), the central star was classified as an A0-type star. GoHam's spectral energy distribution (SED) exhibits two maxima, in the optical and FIR (Ruiz et al. 1987), which correspond respectively to the stellar emission scattered by the bright lobes and to radiation re-emitted by dust grains in the dark equatorial region.
GoHam was originally proposed to be a post-AGB nebula
(Ruiz et al. 1987). However, high-resolution CO maps
(Bujarrabal et al. 2008, hereafter, Paper I) were used to demonstrate that the
nebula is almost exactly in Keplerian rotation, around the symmetry
axis clearly identifiable in its image. No component other than the
rotating, flaring disk, at least on the large scale probed by the
arcsec resolution attainable with mm-wave interferometry, seems to be
present in the nebula. Bujarrabal et al. (2008) estimated the central (presumably
stellar) mass and concluded that, for any possible distance, its high
value in combination with the relatively low total luminosity of the
source is incompatible with the idea that GoHam is an
evolved object. These authors concluded that Gomez's Hamburger is very probably a
pre-main-sequence object at a much smaller distance than previously
believed, of 500 pc, although this value remains
uncertain. Wood et al. (2008) developed a model of dust emission and
scattering that can explain the optical and IR SED for a distance of
about 300 pc. The total disk mass determined by these authors, 0.3
![]() ,
is similar to that deduced in Paper I from a simple analysis of
the mm-wave dust emission (taking into account the different distances
assumed in these papers), and is probably dominated by the dense
inner regions. Berné et al. (2009) also suggested a
distance of about 200-300 pc, arguing that the spectral type could be
slightly less early than that obtained by Ruiz et al. (1987). The
determination of the distance is based on the comparison of several
observational parameters obtained in GoHam with theoretical
evolutionary tracks and previous data for other young stars. The
relevant parameters are: the total luminosity (obtained from
integration of the SED, but dependent on the anisotropy of the
dust-processed radiation, see below),
the central mass
(from the nebula rotation), and the stellar surface temperature
(see discussion on the stellar type accuracy by Berné et al. 2009).
If the stellar type is slightly less early than proposed by
Ruiz et al. (1987), a distance of about 300 pc is consistent with all
existing data. These smaller values of distance yield a slightly
smaller linear radius for the disk, in closer agreement with results
found for similar objects. We accordingly adopt a distance of
300 pc.
,
is similar to that deduced in Paper I from a simple analysis of
the mm-wave dust emission (taking into account the different distances
assumed in these papers), and is probably dominated by the dense
inner regions. Berné et al. (2009) also suggested a
distance of about 200-300 pc, arguing that the spectral type could be
slightly less early than that obtained by Ruiz et al. (1987). The
determination of the distance is based on the comparison of several
observational parameters obtained in GoHam with theoretical
evolutionary tracks and previous data for other young stars. The
relevant parameters are: the total luminosity (obtained from
integration of the SED, but dependent on the anisotropy of the
dust-processed radiation, see below),
the central mass
(from the nebula rotation), and the stellar surface temperature
(see discussion on the stellar type accuracy by Berné et al. 2009).
If the stellar type is slightly less early than proposed by
Ruiz et al. (1987), a distance of about 300 pc is consistent with all
existing data. These smaller values of distance yield a slightly
smaller linear radius for the disk, in closer agreement with results
found for similar objects. We accordingly adopt a distance of
300 pc.
The SED observations of GoHam are quite complete (Ruiz et al. 1987),
but the estimate of the luminosity requires us to introduce significant
corrections due to the extreme viewing angle of the source and the
strong disk opacity at short wavelengths (see Paper I). For the
distance assumed here, we can expect a luminosity of ![]() 15
15
![]() with
an uncertainty of about a factor 2. A comparison of this luminosity
with pre-MS evolutionary tracks (see van den Ancker et al. 1998, and Paper I)
infers a
stellar mass of about 2
with
an uncertainty of about a factor 2. A comparison of this luminosity
with pre-MS evolutionary tracks (see van den Ancker et al. 1998, and Paper I)
infers a
stellar mass of about 2
![]() .
This value is relatively low compared to
the mass derived from the disk rotation curve,
.
This value is relatively low compared to
the mass derived from the disk rotation curve, ![]() 3
3
![]() ,
suggesting
a significant contribution to the central mass of the innermost disk or
even of a low-mass stellar companion (see further discussion in Paper I). We will review in Sect. 4 the nature of the central star(s),
taking into account our new results.
,
suggesting
a significant contribution to the central mass of the innermost disk or
even of a low-mass stellar companion (see further discussion in Paper I). We will review in Sect. 4 the nature of the central star(s),
taking into account our new results.
Bujarrabal et al. (2008) presented only 12CO J = 2-1 maps obtained with the SMA, together with a preliminary modeling of the data. The development of these models was limited significantly by the small amount of available data. In particular, the high optical depth expected in this line prevented any accurate determination of the gas density distribution. A significant revision of some parameters tentatively discussed by Bujarrabal et al. (2008) was therefore necessary. In this paper, we also present maps of 13CO J = 2-1, 12CO J = 3-2, and C17O J = 3-2. The combination of the 12CO J = 2-1 line (reanalyzed for this work) with the 13CO and C17O lines, which are optically thin, and the J = 3-2 emissions, which require significantly more excitation, has allowed a detailed modeling of the source. We now propose realistic distributions on large scale of the gas density and temperature in Gomez's Hamburger, distributions that, as we will show, appear consistent with theoretical ideas about the properties of passive flaring disks in Keplerian rotation.
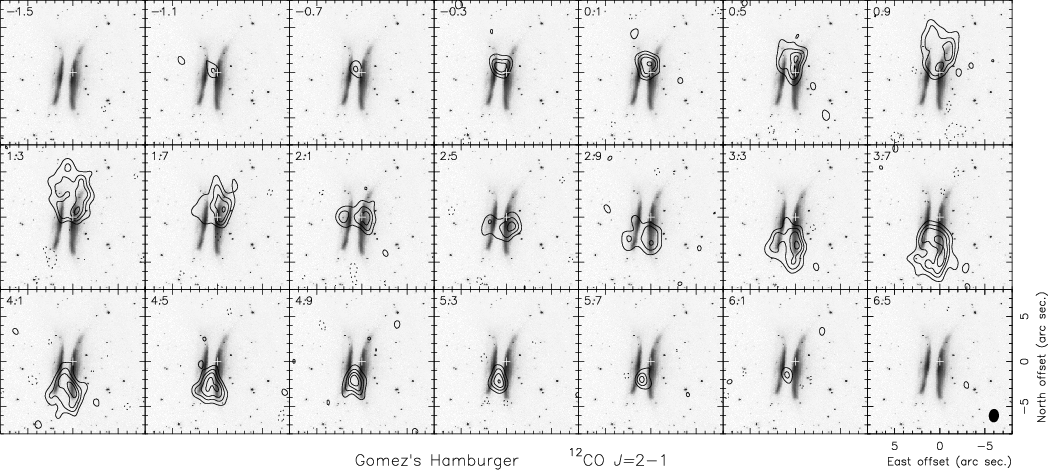 |
Figure 1:
Channel maps of the 12CO J = 2-1 line from Gomez's
Hamburger, continuum has been subtracted. First contour and contour
step are 0.28 Jy/beam, approximately equal to 3 |
| Open with DEXTER | |
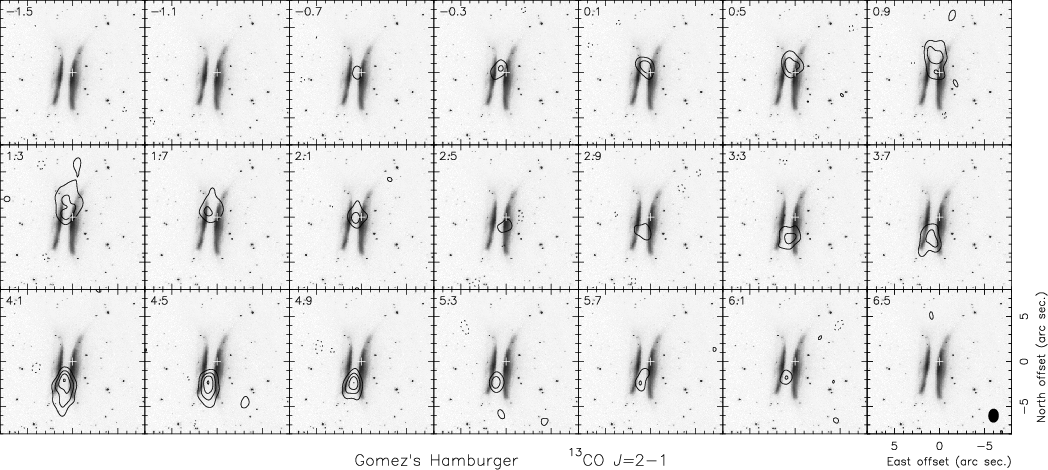 |
Figure 2: Same as Fig. 1, but for the channel maps of the 13CO J = 2-1 line observed from Gomez's Hamburger. First contour and contour step are also 0.28 Jy/beam. |
| Open with DEXTER | |
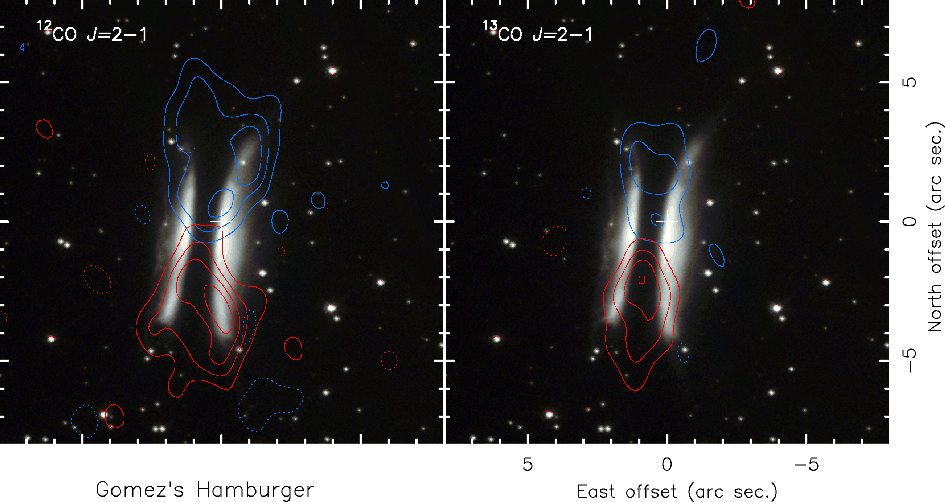 |
Figure 3: Zoomed 12CO and 13CO J = 2-1 emission for velocities 0.9 and 4.1 km s-1, respectively blue (north) and red (south) contours, superposed to the HST image of GoHam; from Figs. 1 and 2, see further details in Sect. 2. |
| Open with DEXTER | |
2 Observations
We present observations of the 12CO J = 2-1 (230.5 GHz), 13CO J = 2-1 (220.4 GHz), 12CO J = 3-2 (345.8 GHz), and C17O J = 3-2 (337.1 GHz)
lines in Gomez's Hamburger (IRAS 18059-3211, GoHam), obtained with the
Submillimeter Array (SMA). We also observed 12CO J=6-5 (691.5 GHz),
but did not detect the line emission.
Both 12CO and 13CO J = 2-1 were observed simultaneously in
2006. Details of the observations, calibration, and data reduction for
these lines may be found in Bujarrabal et al. (2008, Paper I). The reduction of
the 12CO J = 2-1 data set was repeated after the observations were
presented in Paper I. The continuum flux at
![]() mm was
measured to be 0.3 Jy.
mm was
measured to be 0.3 Jy.
The 345 GHz and 690 GHz data were acquired on the night of
2007 March 21 (UT), when the array was in the ``Compact North'' configuration, a
low resolution configuration with longer north-south baselines intended
to produce almost circular synthesized beams for low declination
sources. Seven of the SMA's eight antennas were usable in the 345 GHz
band, and six were usable in the 690 GHz band. The 345 GHz receivers
were tuned to position the 12CO J = 3-2 line at 345.796 GHz in the
receivers' upper sideband (USB) and the C17O J = 3-2 line at 337.061 GHz in the lower sideband (LSB). The 690 GHz receivers were tuned to
position 12CO J=6-5 at 691.473 GHz in the USB. The J2000 coordinates
used for GoHam were RA = 18:09:13.37, Dec = -32:10:49.5, and
correspond to the central cross in our images. Observations began at
11:00 UT and finished at 21:10 UT. During that period, the
precipitable water vapor above Mauna Kea varied between 0.6 and 1.0 mm.
As the source transited at an elevation of 38 degrees, the double
sideband (DSB) system temperature (
![]() )
of the seven 345 GHz
receivers ranged from 133 K to 235 K, while
)
of the seven 345 GHz
receivers ranged from 133 K to 235 K, while
![]() ranged from
1600 K to 2300 K for the 690 GHz receivers. The correlator was
configured to have a uniform resolution of 812.5 kHz per channel across
the full 2 GHz (DSB) bandpass of each receiver. This resolution is
equivalent to 0.70 km s-1 for the J = 3-2 lines, and 0.35 km s-1 for the
J=6-5 line. Observations of Ganymede (16.5 degrees from the source) and
the quasar 1924-292 (15.7 degrees from the source) were completed every
half hour for calibration of the instrument's complex gain. To provide
bandpass calibration, Saturn and 3C 273 were observed before the
source rose.
ranged from
1600 K to 2300 K for the 690 GHz receivers. The correlator was
configured to have a uniform resolution of 812.5 kHz per channel across
the full 2 GHz (DSB) bandpass of each receiver. This resolution is
equivalent to 0.70 km s-1 for the J = 3-2 lines, and 0.35 km s-1 for the
J=6-5 line. Observations of Ganymede (16.5 degrees from the source) and
the quasar 1924-292 (15.7 degrees from the source) were completed every
half hour for calibration of the instrument's complex gain. To provide
bandpass calibration, Saturn and 3C 273 were observed before the
source rose.
The data were calibrated with the MIR package. For the 345 GHz data, cross-correlation observations of Saturn, 3C 273 and Ganymede were used in deriving antenna-based bandpass data to correct for the instrument's spectral response. Ganymede was used for flux calibration, and the derived 850 micron flux for 1924-292 was 2.5 Jy. There were no phase jumps in the data, and complex gain calibration was completed by fitting a 5th order polynomial to the amplitude and phase of the quasar data. The source was tracked between hour angles of -3.5 and +3.5 h, and the total on-source integration time was 4 h. Projected baseline lengths ranged from 9.1 to 136 kilolambda. The 12CO and C17O J = 3-2 spectral lines were clearly detected, as was the 850 micron (345 GHz) continuum emission, with a total flux of 0.8 Jy. The astrometry was checked by using the Ganymede data to phase-calibrate the 1924-292 data, and mapping 1924-292. The map showed 1924-292 as a point source with a position error of 0.2 arcsec.
The 690 GHz band data were more difficult to process, in part
because of instrumental problems. Three of the correlator's
24 spectral bands were defective on some baselines. One receiver lost
phase lock for 45 min during the track, and relocking the receiver
produced a phase jump on the baselines to that antenna. All data taken
with
![]() K (on either antenna of any baseline) were
discarded. Finally, much of the data were taken after sunrise, when
the pointing of the array antennas is always degraded. The
cross-correlation amplitude of Ganymede was checked on all baselines,
and the source data were discarded whenever the nearest (in time)
Ganymede scans had low amplitudes. Altogether, roughly 1/3 of the
690 GHz data were discarded for these reasons. Saturn, 3C 273, and
Ganymede again were used to provide instrument bandpass calibration.
1924-292 was not detected on short timescales in the 690 GHz data, so
only Ganymede could be used in the gain calibration. Ganymede was
resolved by the array at 690 GHz, which caused the amplitude of this
calibrator to pass through zero as the phase jumped by 180 degrees
several times during the track. Projected baselines for the on-source
data ranged from 17.9 to 230 kilolambda. The 450 micron (690 GHz)
continuum emission from GoHam was detected with a total flux of
1.5 Jy, but CO J=6-5 line emission was not detected to a typical noise
level in the maps of
K (on either antenna of any baseline) were
discarded. Finally, much of the data were taken after sunrise, when
the pointing of the array antennas is always degraded. The
cross-correlation amplitude of Ganymede was checked on all baselines,
and the source data were discarded whenever the nearest (in time)
Ganymede scans had low amplitudes. Altogether, roughly 1/3 of the
690 GHz data were discarded for these reasons. Saturn, 3C 273, and
Ganymede again were used to provide instrument bandpass calibration.
1924-292 was not detected on short timescales in the 690 GHz data, so
only Ganymede could be used in the gain calibration. Ganymede was
resolved by the array at 690 GHz, which caused the amplitude of this
calibrator to pass through zero as the phase jumped by 180 degrees
several times during the track. Projected baselines for the on-source
data ranged from 17.9 to 230 kilolambda. The 450 micron (690 GHz)
continuum emission from GoHam was detected with a total flux of
1.5 Jy, but CO J=6-5 line emission was not detected to a typical noise
level in the maps of ![]() 1 Jy/beam.
1 Jy/beam.
Mapping was completed with the NRAO AIPS package. The synthesized
beam shapes were 3.''07 ![]() 1
1
![]() 35 with major axis position
angle of PA = 37.4
35 with major axis position
angle of PA = 37.4![]() for the C17O J = 3-2 maps,
2.''95
for the C17O J = 3-2 maps,
2.''95 ![]() 1.''31 with PA = 37.6
1.''31 with PA = 37.6![]() for the 12CO J = 3-2 maps,
and 3.''59
for the 12CO J = 3-2 maps,
and 3.''59 ![]() 0.''82 with
PA = -5.7
0.''82 with
PA = -5.7![]() for the 450 micron continuum map.
The resulting maps per velocity channel of the four detected lines are
shown in Figs. 1-5.
for the 450 micron continuum map.
The resulting maps per velocity channel of the four detected lines are
shown in Figs. 1-5.
In Figs. 1 and 2, we also show the HST image of GoHam, to allow a more robust comparison with the CO emission and between both 12CO and 13CO J = 2-1 lines. In Fig. 3, we show a zoom of the data from Figs. 1 and 2 for the emission at velocities 0.9 and 4.1 km s-1 LSR, expected to represent the emission from regions closer to the plane of the sky. In displaying the HST images, we chose the beautiful color image from press release 2002-19 provided by the HST newscenter (obtained from WFPC2 images, filters: F675W, F555W, F450W), see http://hubblesite.org/newscenter/. The coordinates were derived from the NICMOS images in the HST archive (taken on April 12, 2006, HST project 10 603, P.I.: Padgett; NICMOS images were more directly comparable to the press release image than the archive WFPC2 data). We used the Aladin viewer and database. We recall that these images have not yet been published in the specialized literature and that a deep analysis of the HST imaging of GoHam is beyond the scope of this paper.
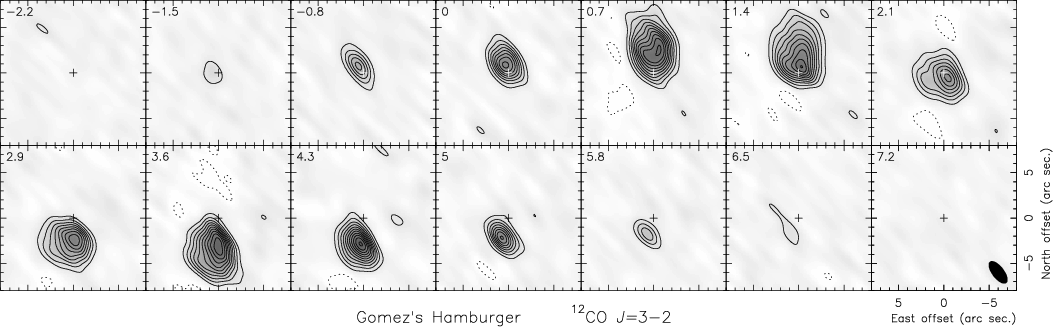 |
Figure 4: Same as Fig. 1, but for the channel maps of the 12CO J = 3-2 line observed from Gomez's Hamburger. First contour and contour step are 0.5 Jy/beam. Note that the spectral and spatial resolutions of these observations are somewhat poorer. |
| Open with DEXTER | |
3 CO emission model
To extract as much information as possible from our maps, we have used a code that simulates the emission from a rotating model disk. Our model provides brightness distributions for LSR velocity channels that are directly compared with the observations. We assume a shape of the CO cloud and a spatial distribution of the velocity, temperature, density, and CO relative abundance. Given these parameters, our code calculates the emissivity of the lines at each point in the disk, and then the brightness along a number of lines of sight by solving the full radiative transfer equation. Opacity effects and velocity shifts are accurately taken into account. This brightness distribution is then convolved with the synthetic beam, and images with the same units as those observed are produced.
The code itself is similar to that described by Bujarrabal et al. (2008), Paper I (see further details there, including discussions about the basic assumptions). The method used to find the best-fit solution and the uncertainties in the derived parameter values are presented in Sect. 3.4 and the Appendix.
However, the disk model used here is far more complex than that in Paper I, mainly because the large amount of empirical data presented now allows us to undertake an accurate description of the structure and physical conditions in the disk. We attempted to reproduce all our SMA maps from the model predictions and, at the same time, to keep our disk model as consistent as possible with theoretical ideas about the properties of rotating disks around young stars. As we will show in the next subsections, the model has become relatively complex, but the different disk components always correspond to features identifiable in our data.
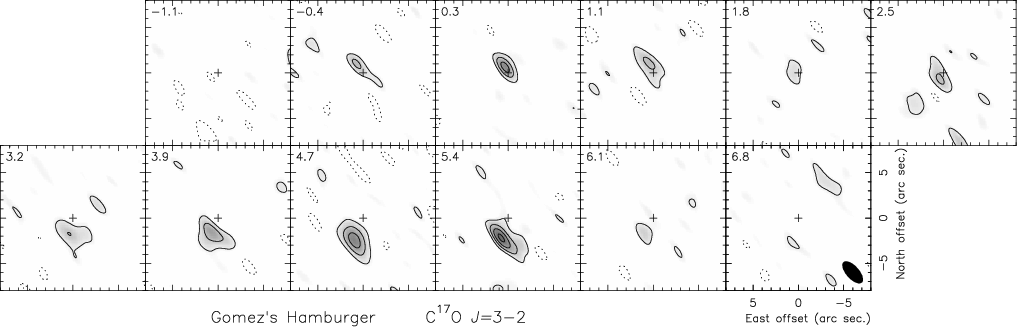 |
Figure 5: Same as Fig. 3, but for the channel maps of the C17O J = 3-2 line observed from Gomez's Hamburger. First contour and contour step are 0.3 Jy/beam. |
| Open with DEXTER | |
3.1 Disk shape and dynamics
From a first inspection of both our maps and the HST image
(Figs. 1-3), it is clear that the nebula is essentially a rotating disk seen
almost edge on, showing significant axial symmetry and Keplerian
dynamics. We can also see that the disk is roughly flaring, being
significantly wider at larger distances from the center. The disk
symmetry axis is almost in the plane of the sky, and slightly tilted
such that the western part of the disk points towards us. The
projection of the disk symmetry axis on the sky plane is almost in the
east-west direction with a position angle
![]() ,
i.e., the disk appears almost parallel to the declination axis.
,
i.e., the disk appears almost parallel to the declination axis.
We assume accordingly that the emission originates in a flaring disk in Keplerian rotation and showing axial symmetry. Our calculations confirm that the observations can be explained by these assumptions. Two dimensions are then sufficient, i.e., r, the distance to the disk axis, and z, the distance to the disk equator.
We assume the simplest flaring geometry with a disk width that is proportional to r. In our case, the disk boundaries represent the region where CO is still abundant, before it is significantly photodissociated (due to the UV radiation from the central star or from the galactic background). We note, however, that the comparison of the 12CO maps with the HST scattered light images (Figs. 1 to 3) suggests that the 12CO disk occupies the entire nebula. To keep the model as simple as possible, we assume constant CO abundance, X(CO), and isotopic ratios. We note that the CO abundances and density laws are not independent parameters in our model; therefore, the value of X(12CO) given here is an assumption chosen to be reasonably in agreement with expectations. We recall that the molecular abundances in the inner regions of the disk may be significantly smaller than the usual ones in the interstellar medium, mainly due to depletion onto grains (see discussion in, e.g., Panic et al. 2008; Thi et al. 2004, and references therein). As mentioned above, we expect significant dissociation of CO in the outer regions of the disk. We must therefore keep in mind that, although the CO abundance assumed here for 12CO, i.e., 10-4, is moderate, its value could be still lower in certain regions.
As we can see in our 12CO J = 2-1 maps, particularly at 1.3 km s-1 LSR,
the shape of the outer part of the disk seems to be rounded, instead of
flaring (at large distances,
![]() ,
from the rotation
axis). The model predictions differ clearly from the
observations if we assume that the flaring geometry continues to the
outer disk radius.
The shape of the disk is accordingly given by the following parameters:
the outer maximum and inner minimum disk radii,
,
from the rotation
axis). The model predictions differ clearly from the
observations if we assume that the flaring geometry continues to the
outer disk radius.
The shape of the disk is accordingly given by the following parameters:
the outer maximum and inner minimum disk radii,
![]() and
and
![]() ;
the intermediate radius out to which the disk is flaring,
;
the intermediate radius out to which the disk is flaring,
![]() ;
and the width at a given value of r, H(r0), such
that
;
and the width at a given value of r, H(r0), such
that
![]() .
Between
.
Between ![]() and
and
![]() ,
the disk width is assumed to vary according to an
elliptical function. These assumptions are consistent with calculations
of the CO abundance variations in rotating disks, see, e.g.,
Jonkheid et al. (2007,2006). See the resulting disk shape in Fig. 7.
,
the disk width is assumed to vary according to an
elliptical function. These assumptions are consistent with calculations
of the CO abundance variations in rotating disks, see, e.g.,
Jonkheid et al. (2007,2006). See the resulting disk shape in Fig. 7.
The kinematics is assumed to be given by the rotational velocity,
following a Keplerian law with r, i.e., varying proportionally
to 1/![]() .
As in Paper I, we find that some amount of local
turbulent dispersion helps to reproduce the data, but that its value
must be kept small. We then assume the existence of a constant
local dispersion
.
As in Paper I, we find that some amount of local
turbulent dispersion helps to reproduce the data, but that its value
must be kept small. We then assume the existence of a constant
local dispersion
![]() .
.
3.2 Density and temperature
Direct inspection of our data suggests that the density and temperature distribution must follow relatively complex laws, which we introduce in our model, trying to keep them consistent with general theoretical ideas.
First of all, we can see a remarkable difference between the 12CO and 13CO J = 2-1 maps (see Figs. 1 and 2 and a zoom of intermediate velocities in Fig. 3). The 13CO brightness distribution is significantly narrower (less extended in the direction of the disk axis, which is almost equivalent to the east-west direction) and shorter (less extended in the disk plane direction). Nevertheless, in regions in which both lines are intense (in the disk plane, slightly northwards and southwards from the star), the 12CO J = 2-1 brightness is only slightly higher. On the other hand, in the disk edges, where only 12CO emission appears, the brightness of this line is often significantly higher than in the central regions (where both J = 2-1 transitions are detected).
Since 13CO emission is certainly expected to be much less optically
thick than 12CO emission and both lines are easily thermalized, this
different behavior between them obviously means that there are wide
outer edges of the disk in which the density significantly decreases
and the temperature increases. These edges are both more or less
parallel to the disk equator (appearing from certain values of
![]() )
and perpendicular to it (appearing from certain values
of r). This behavior is particularly noticeable in the direction
perpendicular to the plane, i.e., sharp variations in density and
temperature occur from a certain distance to the disk equator, and are
particularly well identified in the maps. We can also see in our 12CO J = 2-1 maps that one of these edges parallel to the equator (so, almost
parallel to the north-south direction), the western one, is
significantly more intense than the other. This is due to a simple
radiative transfer effect: the emission from the eastern edge is
absorbed by the cooler and opaque inner regions, which does not occur
for the emission from the other side, which is closer to us. As we will
see, our model reproduces this phenomenon convincingly. Nothing
comparable, of course, is seen in the optically thinner 13CO emission, which, because of the low density of the hot edges, is only
intense in the dense central regions.
)
and perpendicular to it (appearing from certain values
of r). This behavior is particularly noticeable in the direction
perpendicular to the plane, i.e., sharp variations in density and
temperature occur from a certain distance to the disk equator, and are
particularly well identified in the maps. We can also see in our 12CO J = 2-1 maps that one of these edges parallel to the equator (so, almost
parallel to the north-south direction), the western one, is
significantly more intense than the other. This is due to a simple
radiative transfer effect: the emission from the eastern edge is
absorbed by the cooler and opaque inner regions, which does not occur
for the emission from the other side, which is closer to us. As we will
see, our model reproduces this phenomenon convincingly. Nothing
comparable, of course, is seen in the optically thinner 13CO emission, which, because of the low density of the hot edges, is only
intense in the dense central regions.
Therefore, to reproduce the observations of the different lines, we must introduce several components in our density and temperature laws. At a minimum, we need a cool, dense region close to the equator, plus two edges of significantly lower density and higher temperature (which are more or less parallel to the equator and separated quite distinctly from the previous equatorial region), plus an outer region far from the disk axis with similar but smaller variations in these parameters.
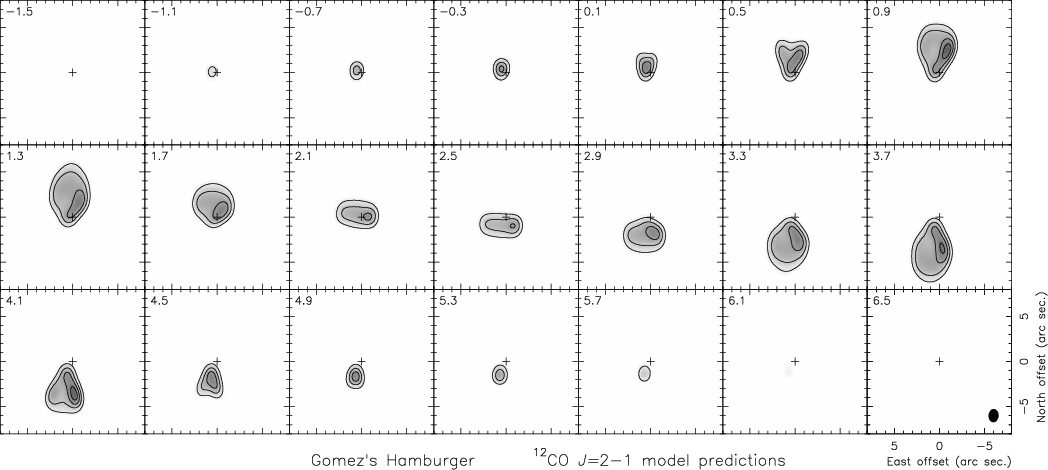 |
Figure 6: Predictions of the 12CO J = 2-1 line brightness from our best-fit model for the GoHam disk. The spatial scale and contours are the same as in the observations, Fig. 1. |
| Open with DEXTER | |
We finally introduce a new correction: to explain the relatively intense emission for regions close to the central star, in spite of their small volume in a flaring disk, the density and temperature must increase from the standard values at small enough distances from the star. As we discuss in Appendix A.2, the physical properties of these regions, unresolved in our observations, are not well determined.
The equatorial density and temperature (
![]() ,
,
![]() )
are
supposed to follow potential laws,
)
are
supposed to follow potential laws,
![]() and
and
![]() .
These laws
are often found to be compatible with studies of molecular gas in disks
around young stars (e.g., Dutrey et al. 2007), and we find that these
simple laws are sufficient for modeling the amount of information
contained in our data. In practice, we assume that
.
These laws
are often found to be compatible with studies of molecular gas in disks
around young stars (e.g., Dutrey et al. 2007), and we find that these
simple laws are sufficient for modeling the amount of information
contained in our data. In practice, we assume that ![]() is not a
free parameter but equal to 1, a value with which we can reproduce our
results. We note that the assumption of a constant accretion rate,
sometimes adopted when deriving the density law, can hardly be justified in
a relatively evolved object such as GoHam, whose central star is barely
accreting material.
is not a
free parameter but equal to 1, a value with which we can reproduce our
results. We note that the assumption of a constant accretion rate,
sometimes adopted when deriving the density law, can hardly be justified in
a relatively evolved object such as GoHam, whose central star is barely
accreting material.
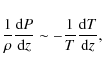
The variation in the density with z, the distance to the equator, is
assumed to be given by the vertical equation of hydrostatics (see
e.g. Dullemond et al. 2007):
 |
(1) |
where the pressure is given by
For a constant temperature with z,
![]() ,
n(r,z) is given by:
,
n(r,z) is given by:
 |
(2) |
where
To include the dramatic change in temperature and density
from a value of ![]() z
z![]() ,
we assume that, when n(r,z) reaches a
certain fraction of
,
we assume that, when n(r,z) reaches a
certain fraction of
![]() ,
the temperature changes by a
factor, FT. The value of FT is obtained by comparing the
observations with the model predictions (see Table 1 and Sect. 4),
as well as the fraction of the density at which the jump must appear
(1/10 was found to yield acceptable model results).
,
the temperature changes by a
factor, FT. The value of FT is obtained by comparing the
observations with the model predictions (see Table 1 and Sect. 4),
as well as the fraction of the density at which the jump must appear
(1/10 was found to yield acceptable model results).
We assume that there is also a jump in the density at this point, by a
factor Fn, where Fn can be calculated from the equation of
hydrostatics, written in the form:
 |
(3) |
For a very steep discontinuity in T:
 |
(4) |
whose solution, for a jump between T0 and T1, is:
 |
(5) |
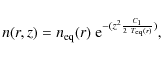
So, if the temperature varies at a given value of z, zj, by a factor FT, the density must vary at the same point by a factor Fn= 1/FT. Beyond this point, for z > zj, we assume that the temperature remains constant, and the density follows the law already inferred for constant temperature:
![\begin{displaymath}n(r,z) = n(r,z_j) ~ {\rm e}^{-[(z-z_j)^2 \frac{C_1}{2 ~ T(r,z_j)}]} ,
\end{displaymath}](/articles/aa/full_html/2009/24/aa11233-08/img55.png) |
(6) |
where z > zj and n(r,zj) and T(r,zj) denote the density and temperature just beyond the jump at zj.
For the law that we assume for
![]() (i.e.,
(i.e.,
![]() ), the condition for the discontinuity we are imposing,
i.e. that n(r,z)/
), the condition for the discontinuity we are imposing,
i.e. that n(r,z)/
![]() is smaller than a certain constant
factor, is roughly equivalent to assuming that the jump appears for a
fringe roughly parallel to the outer limit to the CO-rich disk
in z. This is reasonable, since both the photodissociation of CO and the
gas overheating are expected to be physically caused by the outer
radiation field.
is smaller than a certain constant
factor, is roughly equivalent to assuming that the jump appears for a
fringe roughly parallel to the outer limit to the CO-rich disk
in z. This is reasonable, since both the photodissociation of CO and the
gas overheating are expected to be physically caused by the outer
radiation field.
We have mentioned that T and n must also depart from our standard
law in the outer disk, for
![]() ;
again, n must show a decrease and T must increase to explain the
12CO and 13CO J = 2-1 emission from regions far from the symmetry
axis. In this case, the n and T variations are assumed to be
unrelated. See the finally adopted laws in Table 1 and Fig. 7. We note
that the required change in T is small, but n must strongly
decrease to explain the lack of 13CO emission (and the decrease in
the 12CO J = 2-1 intensity close to
;
again, n must show a decrease and T must increase to explain the
12CO and 13CO J = 2-1 emission from regions far from the symmetry
axis. In this case, the n and T variations are assumed to be
unrelated. See the finally adopted laws in Table 1 and Fig. 7. We note
that the required change in T is small, but n must strongly
decrease to explain the lack of 13CO emission (and the decrease in
the 12CO J = 2-1 intensity close to
![]() ). In any case, the
accuracy of the density value determined at the largest distances from
the axis is poor, since it depends mostly on the intensity of only one
line, which is (moderately) optically thick (see Appendixes). We note
that, for the adopted physical conditions, the density in regions
where r is slightly larger than
). In any case, the
accuracy of the density value determined at the largest distances from
the axis is poor, since it depends mostly on the intensity of only one
line, which is (moderately) optically thick (see Appendixes). We note
that, for the adopted physical conditions, the density in regions
where r is slightly larger than ![]() is high enough to allow
detectable emission of 13CO and 12CO J = 2-1 for some LSR
velocities. The central velocities of our 12CO J = 2-1 maps show
emission even from the outermost parts of the disk.
is high enough to allow
detectable emission of 13CO and 12CO J = 2-1 for some LSR
velocities. The central velocities of our 12CO J = 2-1 maps show
emission even from the outermost parts of the disk.
3.3 Other parameters
The inclination of the rotation axis with respect to the plane of the
sky must be low, as implied by the optical and CO images. The
projection of this axis on the plane of the sky is obviously at a
position angle, PA, that is slightly smaller than 90![]() .
We note
that both parameters may in fact vary with r, since this large disk
may be warped at some degree. This appears to be the case if we compare
the inclinations in the CO maps for
.
We note
that both parameters may in fact vary with r, since this large disk
may be warped at some degree. This appears to be the case if we compare
the inclinations in the CO maps for
![]() -1.7 km s-1 and
for 0.9 or 3.3 km s-1. It is probable that some regions of the disk
rotate around an axis (in projection) at
-1.7 km s-1 and
for 0.9 or 3.3 km s-1. It is probable that some regions of the disk
rotate around an axis (in projection) at
![]() ,
while
other regions rotate around
,
while
other regions rotate around
![]() .
.
The distance was discussed in Paper I and Sect. 1, where the uncertainties in its value were emphasized. We adopt a distance of 300 pc.
The systemic velocity is quite well determined from our maps of CO lines, to an accuracy higher than 10%. The given value in Table 1 is compatible with all observations presented here.
3.4 Fitting procedure and results
We chose the most suitable set of parameters by directly comparing the observed and synthetic images. We propose that the comparison in the sky plane, and not in the transformed uv plane, is possible in our case because of the relatively large extent of the source. On the other hand, the large number of parameters, required to describe the various components implied by the observational features, and the different significance of them, prevent any systematic, blind fitting. (See detailed discussion in Appendix A.1.) The 12CO and 13CO J = 2-1 images, which contain much information, provided the basic data for this comparison.
In Appendix A.1, we also present in detail the criteria followed to
choose the acceptable models. The residual images, i.e., the difference
between the observed and theoretical images, must have an rms noise
in regions where the emission appears smaller than ![]() 1.5 times
that found in nearby regions (that includes only the noise of the
observations). The residual images must also exhibit contours smaller
than
1.5 times
that found in nearby regions (that includes only the noise of the
observations). The residual images must also exhibit contours smaller
than ![]() 3 times the noise level or
3 times the noise level or ![]() 2 times systematically. For
instance, for a model to be acceptable, we must not find in the
resulting 12CO J = 2-1 residuals two positive or negative contours;
we note that the observed 12CO J = 2-1 image does show one contour
features that are due to the observational noise. For an acceptable model,
the regions in the residual images in which emission was present
appear, therefore, to differ only slightly from those in which there
was no emission.
2 times systematically. For
instance, for a model to be acceptable, we must not find in the
resulting 12CO J = 2-1 residuals two positive or negative contours;
we note that the observed 12CO J = 2-1 image does show one contour
features that are due to the observational noise. For an acceptable model,
the regions in the residual images in which emission was present
appear, therefore, to differ only slightly from those in which there
was no emission.
In Appendix A.2, we discuss the uncertainty in the main parameters of the model, given by the values of each parameter that, while the others remain unchanged, lead to results that clearly do not satisfy these conditions.
The conditions for the model predictions to be acceptable are relaxed for the relatively strong emission detected at about 4.5-5.5 km s-1, which has no counterpart in the equivalent blue-shifted emission. We propose that this emission excess is due to a condensation in the rotating gas (Sect. 4 and Appendix A.3). Our model assumes axial symmetry and cannot reproduce this emission excess; we preferred to fit mostly the emission in the other velocities and to discuss separately this intense clump (Sect. 4.1).
We present in Fig. 6 and in the Appendixes some examples of the resulting model maps and residuals. Table 1 and Fig. 7 present the values of the fitted parameters.
Table 1: Structure and physical conditions in the molecular disk of Gomez's Hamburger, derived from our model fitting of several CO rotational lines. Dependence on the assumed distance is given in the relevant cases. Other parameters of the modeling are also given.
4 Results and conclusions
Our SMA observations of 12CO J = 2-1, 13CO J = 2-1, 12CO J = 3-2, and C17O J = 3-2 in Gomez's Hamburger (Sect. 2, Figs. 1 to 5) yielded high-quality maps. The maps were satisfactorily reproduced by our model of disk in Keplerian rotation (see Sect. 3, Fig. 6, and Appendix). From these maps and our model fitting of the data (see Sect. 3), we derived the main structure, dynamics, and physical conditions of the nebula (see parameters of the model and best-fit results in Sect. 3, Fig. 7, and Table 1). We assume a distance of 300 pc, see discussion in Bujarrabal et al. (2008, Paper I) and Sect. 1; the dependence of the fitting on the distance is given in Table 1. Further discussion on the fitting procedures and accuracy are given in the Appendixes.
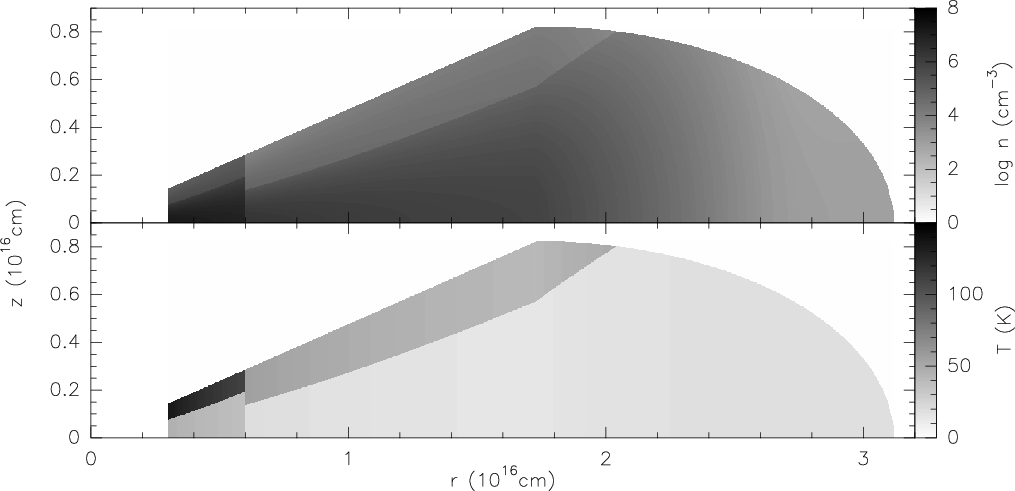 |
Figure 7: Density and temperature distributions in our best-fit model. r is the distance from the rotation axis, and z is the distance to the equator. |
| Open with DEXTER | |
The CO emitting gas in GoHam forms a rotating disk that is probably coincident with the entire nebula, since the CO extent is even larger than the HST image (showing scattered light and absorption by dust grains, see Figs. 1-3). We recall, however, that the disk shape given here is that of the region in which CO is rich. Other nebula components in which molecules are severely underabundant, due to photodissociation by the interstellar or stellar UV field or to depletion onto grains, are not probed by our maps.
Our data confirm the previous conclusion (Paper I) that the disk is almost exactly in Keplerian rotation and has a clear axial symmetry. However, we infer, mainly from the 13CO J = 2-1 maps (Figs. 2, 3) and their comparison with the model predictions, that there is a condensation in the southern disk that has no counterpart in other regions of the nebula (see discussion on its properties and meaning in Sect. 4.1).
The general dynamics and structure of the nebula are relatively well determined from the maps. We note that the shape of the model disk corresponds to the region in which, due to shielding from the external UV field, CO is still abundant. The shape that we deduce is compatible with the general structure expected for the CO-rich parts of disks around young stars, see, e.g., Jonkheid et al. (2007,2006).
The model distributions of the number density (n) and temperature (T) require deeper discussion. The difference between the distributions of 12CO and 13CO J = 2-1 emission is particularly useful for this purpose. The bright rims, more or less parallel to the equator, clearly seen in the optically thick 12CO emission are not present in 13CO. Since 13CO J = 2-1 is certainly much less opaque than 12CO J = 2-1, this indicates a significant increase in temperature and decrease in density in regions sufficiently separated from the equator. We note that this decrease in density with distance from the equator, z, appears in our model as a result of the jump in temperature, since the variation in density with z is assumed to be given by the equation of hydrostatics for a rotating disk. Our model reproduces the observations by assuming a characteristic (sharp) increase in temperature by a factor of 3. We note that the 13CO J = 2-1 emission originates only in the opaque equatorial disk seen in the HST images (Figs. 2 and 3), while the bright rims detected in 12CO J = 2-1 at large distances from the equator correspond to the flaring-disk edge that appears in the visible and NIR as a result of the scattering of stellar light by dust (Figs. 1 and 3).
Similar changes in the physical conditions within the disk were predicted from theoretical considerations (see e.g. Dullemond et al. 2007). Some previous maps of disks around young stars also exhibited an increase in temperature of this order (e.g., Dartois et al. 2003).
A comparison of the 12CO and 13CO maps also infers that ndecreases and T increases at large distances from the rotation axis (large values of r, even on the equator), because of the significantly less extended emission of 13CO J = 2-1 and the relative maxima found in 12CO J = 2-1 at such large distances. In this case, the variations in temperature and density are assumed to be independent, and we indeed find that the factor of density decrease must be higher. A general description of the spatial distribution of the physical conditions can be seen in Fig. 7. We recall that we assume that the molecular abundances are constant within the entire disk, because existing data do not allow us to consider independently variations in the abundances and variations in the density and temperature. Therefore, the decrease in density at large r could (at least partially) reflect a decrease in the 13CO abundance in those regions. (This does not affect the remaining conclusions: the temperature must increase at high values of both z and r, to explain the higher 12CO intensity, and the density for high z must decrease to satisfy the hydrostatics equations.)
A clear asymmetry is visible in the 12CO brightness distribution with respect to the disk equator, i.e., between the eastern and western parts of the nebula (Fig. 1). This effect is due to self absorption: the cold equator absorbs the emission originating in the hot, outer regions at high z that are placed behind it (corresponding to the east part of the CO image), which of course does not affect the emission of the hot layer that is closer to us. This asymmetry is reproduced well by our model calculations, which accurately take into account opacity effects and radiative interactions between the different parts of the nebula.
We note the low degree of local turbulence inferred from the
model fitting,
![]() 0.1 km s-1. Small values of the
microturbulence velocity are often found in rotating disks
(e.g., Panic et al. 2008), even in the rare cases of disks rotating
around evolved stars (Bujarrabal et al. 2005).
0.1 km s-1. Small values of the
microturbulence velocity are often found in rotating disks
(e.g., Panic et al. 2008), even in the rare cases of disks rotating
around evolved stars (Bujarrabal et al. 2005).
The total central mass responsible for the observed rotation is deduced
to be ![]() 3
3
![]() .
We have seen in Sect. 1 and Paper I that this mass
seems high compared to that derived by comparing the total luminosity
with evolutionary tracks,
.
We have seen in Sect. 1 and Paper I that this mass
seems high compared to that derived by comparing the total luminosity
with evolutionary tracks, ![]() 2
2
![]() (with high uncertainties). As
discussed in Paper I and Sect. 1, the mass value deduced from the
observed rotation may include as much as
(with high uncertainties). As
discussed in Paper I and Sect. 1, the mass value deduced from the
observed rotation may include as much as ![]() 0.5
0.5
![]() as a
contribution of the dense, very inner regions of the disk (which are
not well probed by our observations, because of their insufficient
resolution). Therefore, the comparison of the mass values derived from
evolutionary tracks and disk dynamics may still imply the presence of a
binary star in GoHam. The conclusion about the binary nature of the
central star depends, unfortunately, on the comparison between
theoretical evolutionary tracks and the uncertain values of the stellar
luminosity and surface temperature, which cannot at present be
determined with sufficiently high accuracy (see Paper I and Sect. 1).
as a
contribution of the dense, very inner regions of the disk (which are
not well probed by our observations, because of their insufficient
resolution). Therefore, the comparison of the mass values derived from
evolutionary tracks and disk dynamics may still imply the presence of a
binary star in GoHam. The conclusion about the binary nature of the
central star depends, unfortunately, on the comparison between
theoretical evolutionary tracks and the uncertain values of the stellar
luminosity and surface temperature, which cannot at present be
determined with sufficiently high accuracy (see Paper I and Sect. 1).
Our model also estimates the total mass of the (extended) disk. By
integrating the model density, we derive a value of ![]() 0.01
0.01
![]() .
As
in our previous work (Paper I), we determine a disk mass value that is
far smaller than the total mass derived from dust emission
(
.
As
in our previous work (Paper I), we determine a disk mass value that is
far smaller than the total mass derived from dust emission
(![]() 0.3
0.3
![]() ;
Sects. 1, 3). This may be due to a strong gas depletion onto
grains, mainly in the densest regions of the disk
(Dutrey et al. 1997; Thi et al. 2004; Panic et al. 2008), which could yield a higher dust
mass and lower molecular abundances than expected. We propose that this
effect could explain at least in part the discrepancy between the mass
derived from dust emission and from CO maps. Unfortunately, the dust
continuum emission was found to originate predominantly in the very
center of the disk, which is poorly mapped by our 1
;
Sects. 1, 3). This may be due to a strong gas depletion onto
grains, mainly in the densest regions of the disk
(Dutrey et al. 1997; Thi et al. 2004; Panic et al. 2008), which could yield a higher dust
mass and lower molecular abundances than expected. We propose that this
effect could explain at least in part the discrepancy between the mass
derived from dust emission and from CO maps. Unfortunately, the dust
continuum emission was found to originate predominantly in the very
center of the disk, which is poorly mapped by our 1
![]() -resolution CO
line maps, avoiding a proper comparison of both distributions. A future
study of the effects of depletion on the mass determinations in this
source will require significantly deeper maps of the continuum
emission, tracing dust to distances comparable to those observed in
CO emission, as well as higher resolution maps of CO lines, accurately
mapping the inner disk regions.
-resolution CO
line maps, avoiding a proper comparison of both distributions. A future
study of the effects of depletion on the mass determinations in this
source will require significantly deeper maps of the continuum
emission, tracing dust to distances comparable to those observed in
CO emission, as well as higher resolution maps of CO lines, accurately
mapping the inner disk regions.
4.1 The southern condensation
As discussed in Sect. 3, we detect an asymmetry in our data,
particularly in the 13CO J = 2-1 maps, that cannot be accounted for by
an axially symmetric model (Figs. 2, 3). We observe an emission excess
in the southern part of the nebula, at about 1
![]() 3 from the
nebula center (
3 from the
nebula center (
![]() cm for the assumed distance of GoHam) and
between about +4.5 and +5.5 km s-1 LSR, which has no counterpart in the
corresponding northern emission at more negative velocities. This
asymmetry cannot be due to opacity or excitation effects, because it is
clearly more conspicuous in the 13CO J = 2-1 and C17O J = 3-2 lines
than in the 12CO J = 2-1 one, which is more opaque, and the
12CO J = 3-2 line, which requires a higher excitation. Since
the intense maximum is more evident in 13CO J = 2-1, which is
mostly optically thin, we propose that this is caused by a
condensation, i.e., a significant increase of the
density in those regions. We discuss in this section the
properties and possible origin of this condensation, which could be
protoplanetary.
cm for the assumed distance of GoHam) and
between about +4.5 and +5.5 km s-1 LSR, which has no counterpart in the
corresponding northern emission at more negative velocities. This
asymmetry cannot be due to opacity or excitation effects, because it is
clearly more conspicuous in the 13CO J = 2-1 and C17O J = 3-2 lines
than in the 12CO J = 2-1 one, which is more opaque, and the
12CO J = 3-2 line, which requires a higher excitation. Since
the intense maximum is more evident in 13CO J = 2-1, which is
mostly optically thin, we propose that this is caused by a
condensation, i.e., a significant increase of the
density in those regions. We discuss in this section the
properties and possible origin of this condensation, which could be
protoplanetary.
It is remarkable that such strong asymmetries between regions with relatively positive and negative velocity are not frequent in CO-rich rotating disks (Simon et al. 2000; Piétu et al. 2005; Dutrey et al. 2003), even in observations of 13CO lines. An exception may be the C18O maps in DM Tau by Dartois et al. (2003, but not their <)1958#>13CO data#, which exhibit an emission excess at certain velocities comparable to that in our 13CO maps. More subtle departures from the Keplerian dynamics were also identified in AB Aur (as well as in our maps of GoHam; see discussion below).
We attempted to estimate the amount of mass represented by this excess
brightness, although this observational feature is difficult to model
because of the considerable lack of information about its nature. A
lower limit can be obtained if we assume that the excess mass is
proportional to the total additional intensity in 13CO J = 2-1. The
increase in line intensity at these velocities represents somewhat less
than 20% of the total (velocity integrated) line intensity. Since the
total mass inferred by our disk model is ![]() 0.01
0.01
![]() ,
we deduce
that the mass of the condensation is
,
we deduce
that the mass of the condensation is ![]()
![]()
![]() ,
almost identical to the mass of our planetary system or to the mass of
Jupiter.
,
almost identical to the mass of our planetary system or to the mass of
Jupiter.
We recall that this mass value must be considered as a lower limit. The excess mass is proportional to the total extra intensity in 13CO J = 2-1 if this line is completely optically thin and the excitation in the clump is the same as in the surrounding gas. We know that the first assumption is not completely true even for lines of sight that do not intersect the condensation. The second assumption is also improbable, since the density increase must be important; moreover, we note that the opaque 12CO J = 2-1 line also exhibits some intensity increase in these regions, suggesting that they are hotter than nearby regions. The presence of some opacity also in 13CO J = 2-1 will lead to a perhaps significant mass underestimate in our simple estimate. The effects of the different excitation should be less important. A higher excitation increases the partition function of the molecule and decreases the level population difference, which leads to lower emission in optically thin lines (although, of course, a higher temperature means a higher intensity when the optical depth is high). Therefore, both assumptions will in general lead to underestimates of the clump mass.
We performed a more robust estimate introducing a density increase in
some parts of our model disk (destroying the axial symmetry). We
estimate, first, that to model the asymmetry in the 12CO J = 2-1 maps
we need an excess temperature by a factor 1.5 in a southern disk region
closer than 1016 cm. We then attempted to reproduce the 13CO J = 2-1 data approximately by increasing the density by some factor, with
respect to standard law (derived from fitting our entire data set,
Sect. 3, Table 1). A significant factor (![]() 10) is found to be
necessary to account for the beam dilution and some incipient optical
depth in this line. The model predictions for the southern brightness
increase in C17O J = 3-2 are also consistent with the
observations. See a detailed discussion on our tentative modeling of
this clump in Sect. A.3. With these conditions, we find that the
condensation contains a total mass
10) is found to be
necessary to account for the beam dilution and some incipient optical
depth in this line. The model predictions for the southern brightness
increase in C17O J = 3-2 are also consistent with the
observations. See a detailed discussion on our tentative modeling of
this clump in Sect. A.3. With these conditions, we find that the
condensation contains a total mass ![]()
![]()
![]() ,
a
few times the mass of our planetary system.
,
a
few times the mass of our planetary system.
We note that these estimates do not exclude the presence of more compact components that are undetectable with our angular resolution. We also note that a proto-solar-system must contain a significantly higher mass than the final planetary system, since significant gas ejection is expected before planets form in these condensations. Finally, we recall our poor knowledge of the physical properties of this clumps and the poor observational information on it, which remains practically unresolved in our data, preventing any detailed modeling.
On the other hand, our fitting of the 13CO emission at these velocities is only accurate for the clump intensity. In the observations, the brightness maximum appears to be displaced outwards by 0.5 arcsecond, with respect to the position expected from our fitting (see Appendix A.3). This effect cannot be avoided if we assume that the condensation is farther from the star, since the velocity field we assume (the same Keplerian law deduced from the fitting of the overall dynamics, Sect. 3) would then imply that its emission occurs at too low relative velocities. This displacement can easily be seen in the observations: we note the anomalously large distance from the star of the maximum in 13CO J = 2-1 emission at about 5 km s-1, compared to the brightness distributions at about 3.5 km s-1. Therefore, the presence of a disturbance in the dynamics is necessary to explain the observed properties of the southern condensation, leading us to conclude that both the disturbance in the dynamics and the presence of a condensation are probably associated.
The standard conditions theoretically required to produce gravitational
instabilities in the disk (e.g., Durisen et al. 2007) are not satisfied
for this condensation. In GoHam, instabilities would only occur at a
less than ![]() 1015 cm from the star, the distances on which
detailed theoretical models tend indeed to predict the presence of
protoplanets. The size inferred from our data for the condensation is
also too large compared to the Hill sphere, which defines the
gravitational domain of a protoplanet (e.g., Lissauer & Stevenson 2007), if
we do not assume the presence of undetected compact components. In
fact, the mass of the central component required by the large extent of
the condensation would be
1015 cm from the star, the distances on which
detailed theoretical models tend indeed to predict the presence of
protoplanets. The size inferred from our data for the condensation is
also too large compared to the Hill sphere, which defines the
gravitational domain of a protoplanet (e.g., Lissauer & Stevenson 2007), if
we do not assume the presence of undetected compact components. In
fact, the mass of the central component required by the large extent of
the condensation would be ![]() 0.5-1
0.5-1
![]() ,
i.e., that of a low-mass
protostar.
,
i.e., that of a low-mass
protostar.
From the observational point of view, however, other evidence of
important condensations has been found at similar large distances from
the star, probably due to disk instabilities. For instance, the well
known spiral structure in AB Aur appears to be at a distance smaller
than about 100 AU or
![]() cm (Millan-Gabet et al. 2006; Oppenheimer et al. 2008), but spiral-like dust condensations are also detected at
several hundred AU (Fukagawa et al. 2004) and seem to have some
counterpart in CO emission (Lin et al. 2006; Piétu et al. 2005). Piétu et al. (2005) and
Lin et al. (2006) also detected departures from the general Keplerian
velocity field in the spiral arms of AB Aur, comparable in magnitude to
those found by us in GoHam. To compare our observations with previous
results more effectively, we represent in Fig. 8 the position-velocity
diagram along the disk direction in GoHam, obtained from our 13CO J = 2-1 data, in which the excess emission is clearly seen at positive
velocities. The p-v diagram in GoHam is found to be similar to that
obtained by Lin et al. (2006) in AB Aur, in spite of the different angular
and velocity scales. The deformation of the dynamics in AB Aur
associated with the spiral instability therefore produces a velocity
pattern similar to that found in Gomez's Hamburger. On the other hand,
Lafrenière et al. (2008) reported the detection, from direct imaging and
spectroscopy, of a planet with a mass about 8 times higher than that of
Jupiter at
cm (Millan-Gabet et al. 2006; Oppenheimer et al. 2008), but spiral-like dust condensations are also detected at
several hundred AU (Fukagawa et al. 2004) and seem to have some
counterpart in CO emission (Lin et al. 2006; Piétu et al. 2005). Piétu et al. (2005) and
Lin et al. (2006) also detected departures from the general Keplerian
velocity field in the spiral arms of AB Aur, comparable in magnitude to
those found by us in GoHam. To compare our observations with previous
results more effectively, we represent in Fig. 8 the position-velocity
diagram along the disk direction in GoHam, obtained from our 13CO J = 2-1 data, in which the excess emission is clearly seen at positive
velocities. The p-v diagram in GoHam is found to be similar to that
obtained by Lin et al. (2006) in AB Aur, in spite of the different angular
and velocity scales. The deformation of the dynamics in AB Aur
associated with the spiral instability therefore produces a velocity
pattern similar to that found in Gomez's Hamburger. On the other hand,
Lafrenière et al. (2008) reported the detection, from direct imaging and
spectroscopy, of a planet with a mass about 8 times higher than that of
Jupiter at
![]() cm from a young star, although systems
on such large scales appear to be rare (Lafrenière et al. 2007). Planets
with a few times the mass of Jupiter have been also found around the
A-type stars Fomalhaut and HR 8799 (Marois et al. 2008; Kalas et al. 2008), at quite
large distances from the star,
cm from a young star, although systems
on such large scales appear to be rare (Lafrenière et al. 2007). Planets
with a few times the mass of Jupiter have been also found around the
A-type stars Fomalhaut and HR 8799 (Marois et al. 2008; Kalas et al. 2008), at quite
large distances from the star, ![]() 100 AU, although smaller than
that of our condensation. Finally, we note the detection, from dust
emission mapping at
100 AU, although smaller than
that of our condensation. Finally, we note the detection, from dust
emission mapping at
![]() cm, of a condensation containing
14 times the mass of Jupiter at 65 AU from HL Tau, which was interpreted
to be protoplanetary (Greaves et al. 2008).
cm, of a condensation containing
14 times the mass of Jupiter at 65 AU from HL Tau, which was interpreted
to be protoplanetary (Greaves et al. 2008).
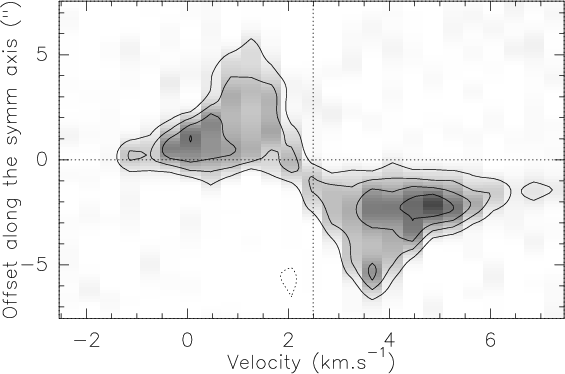 |
Figure 8:
Position-velocity diagram of the 13CO J = 2-1 emission
from GoHam, obtained along the disk direction
(PA = -5 |
| Open with DEXTER | |
The southern condensation could also be associated with the
presence of a low-mass stellar or quasi-stellar companion, which is
able to capture gravitationally a sizeable fraction of the overall disk
material and may explain the anomalous dynamics found in the
condensation. The contribution of the companion mass (![]() 1
1
![]() )
to the total central mass could be necessary to explain that the mass
value derived from the overall disk rotation (i.e., derived from data
of extended regions and regardless of the peculiar kinematics of
the condensation) is perhaps too high for the observed total
luminosity; see above for more details.
)
to the total central mass could be necessary to explain that the mass
value derived from the overall disk rotation (i.e., derived from data
of extended regions and regardless of the peculiar kinematics of
the condensation) is perhaps too high for the observed total
luminosity; see above for more details.
In summary, we have identified a condensation in the southern part of
the disk, about 1
![]() 3 from the disk center, that probably contains
a mass of a few times that of Jupiter. This condensation could be
protoplanetary, in a preliminary evolutionary stage. We have noted that
theory predicts in general that planets tend to form at much smaller distances
from the central star, although observational results support the
formation of condensations at such long distances. This clump could
also be due to material gravitationally captured by a stellar or
quasi-stellar companion, whose presence has been proposed independently
to explain the total central mass derived from the disk rotation
velocity. We recall that the condensation seems to be associated with a
significant local distortion of the general Keplerian velocity field of
the nebula; this distortion could be explained if both the clump
formation is due to the presence of a low-mass stellar companion or to
gravitational instabilities within the disk.
3 from the disk center, that probably contains
a mass of a few times that of Jupiter. This condensation could be
protoplanetary, in a preliminary evolutionary stage. We have noted that
theory predicts in general that planets tend to form at much smaller distances
from the central star, although observational results support the
formation of condensations at such long distances. This clump could
also be due to material gravitationally captured by a stellar or
quasi-stellar companion, whose presence has been proposed independently
to explain the total central mass derived from the disk rotation
velocity. We recall that the condensation seems to be associated with a
significant local distortion of the general Keplerian velocity field of
the nebula; this distortion could be explained if both the clump
formation is due to the presence of a low-mass stellar companion or to
gravitational instabilities within the disk.
Acknowledgements
We are grateful to Asunción Fuente and Mario Tafalla for very helpful comments on the manuscript.
Note added in proof. After this work was accepted, two papers appeared, predicting theoretically the formation of planets beyond 100 AU and discussing the conditions under which this may occur: Boley, A. C., 2009, ApJ, 695, L53; Veras, D., Crepp, J. R., & Ford, E. B., 2009, ApJ, 696, 1600.
References
- Berné, O., Joblin, C., Fuente, A., & Ménard, F. 2009, A&A, 495, 827 [NASA ADS] [CrossRef] [EDP Sciences] (In the text)
- Bujarrabal, V., Castro-Carrizo, A., Alcolea, J., & Neri, R. 2005, A&A, 441, 1031 [NASA ADS] [CrossRef] [EDP Sciences] (In the text)
- Bujarrabal, V., Young, K., & Fong, D. 2008, A&A, 483, 839 [NASA ADS] [CrossRef] [EDP Sciences] (Paper I) (In the text)
- Dartois, E., Dutrey, A., & Guilloteau, S. 2003, A&A, 399, 773 [NASA ADS] [CrossRef] [EDP Sciences] (In the text)
- Dullemond, C. P., Hollenbach, D., Kamp, I., & D'Alessio, P. 2007, in Protostars and Planets V, ed. B. Reipurth, D. Jewitt, & K. Keil, 555 (In the text)
- Durisen, R. H., Boss, A. P., Mayer, L., et al. 2007, in Protostars and Planets V, ed. B. Reipurth, D. Jewitt, & K. Keil, 607 (In the text)
- Dutrey, A., Guilloteau, S., & Guelin, M. 1997, A&A, 317, L55 [NASA ADS]
- Dutrey, A., Guilloteau, S., & Simon, M. 2003, A&A, 402, 1003 [NASA ADS] [CrossRef] [EDP Sciences]
- Dutrey, A., Guilloteau, S., & Ho, P. 2007, in Protostars and Planets V, ed. B. Reipurth, D. Jewitt, & K. Keil, 495 (In the text)
- Fuente, A., Alonso-Albi, T., Bachiller, R., et al. 2006, ApJ, 649, L119 [NASA ADS] [CrossRef]
- Fukagawa, M., Hayashi, M., Tamura, M., et al. 2004, ApJ, 605, L53 [NASA ADS] [CrossRef] (In the text)
- Greaves, J. S., Richards, A. M. S., Rice, W. K. M., & Muxlow, T. W. B. 2008, MNRAS, 391, L74 [NASA ADS] (In the text)
- Jonkheid, B., Kamp, I., Augereau, J.-C., & van Dishoeck, E. F. 2006, A&A, 453, 163 [NASA ADS] [CrossRef] [EDP Sciences]
- Jonkheid, B., Dullemond, C. P., Hogerheijde, M. R., & van Dishoeck, E. F. 2007, A&A, 463, 203 [NASA ADS] [CrossRef] [EDP Sciences]
- Kalas, P., Graham, J. R., Chiang, E., et al. 2008, Science, 322, 1345 [NASA ADS] [CrossRef]
- Lafrenière, D., Doyon, R., Marois, C., et al. 2007, ApJ, 670, 1367 [NASA ADS] [CrossRef] (In the text)
- Lafrenière, D., Jayawardhana, R., & van Kerkwijk, M. H. 2008, ApJ, 689, L153 [NASA ADS] [CrossRef] (In the text)
- Lin, S.-Y., Ohashi, N., Lim, J., et al. 2006, ApJ, 645, 1297 [NASA ADS] [CrossRef]
- Lissauer, J. J., & Stevenson, D. J. 2007, in Protostars and Planets V, ed. B. Reipurth, D. Jewitt, & K. Keil, 591 (In the text)
- Mannings, V., & Sargent, A. I. 1997, ApJ, 490, 792 [NASA ADS] [CrossRef]
- Mannings, V., & Sargent, A. I. 2000, ApJ, 529, 391 [NASA ADS] [CrossRef]
- Marois, C., Macintosh, B., Barman, T., et al. 2008, Science, 322, 1348 [NASA ADS] [CrossRef]
- Millan-Gabet, R., Monnier, J. D., Berger, J.-P., et al. 2006, ApJ, 645, L77 [NASA ADS] [CrossRef]
- Oppenheimer, B. R., Brenner, D., Hinkley, S., et al. 2008, ApJ, 679, 1574 [NASA ADS] [CrossRef]
- Panic, O., Hogerheijde, M. R., Wilner, D., & Qi, C. 2008, ArXiv e-prints, 806 (In the text)
- Piétu, V., Guilloteau, S., & Dutrey, A. 2005, A&A, 443, 945 [CrossRef] [EDP Sciences]
- Ruiz, M. T., Blanco, V., Maza, J., et al. 1987, ApJ, 316, L21 [NASA ADS] [CrossRef] (In the text)
- Simon, M., Dutrey, A., & Guilloteau, S. 2000, ApJ, 545, 1034 [NASA ADS] [CrossRef]
- Thi, W.-F., van Zadelhoff, G.-J., & van Dishoeck, E. F. 2004, A&A, 425, 955 [NASA ADS] [CrossRef] [EDP Sciences]
- van den Ancker, M. E., de Winter, D., & Tjin A Djie, H. R. E. 1998, A&A, 330, 145 [NASA ADS] (In the text)
- Wood, K., Whitney, B. A., Robitaille, T., & Draine, B. T. 2008, ApJ, 688, 1118 [NASA ADS] [CrossRef] (In the text)
Online Material
Appendix A: Selection of the best-fit and the accuracy of the parameter values
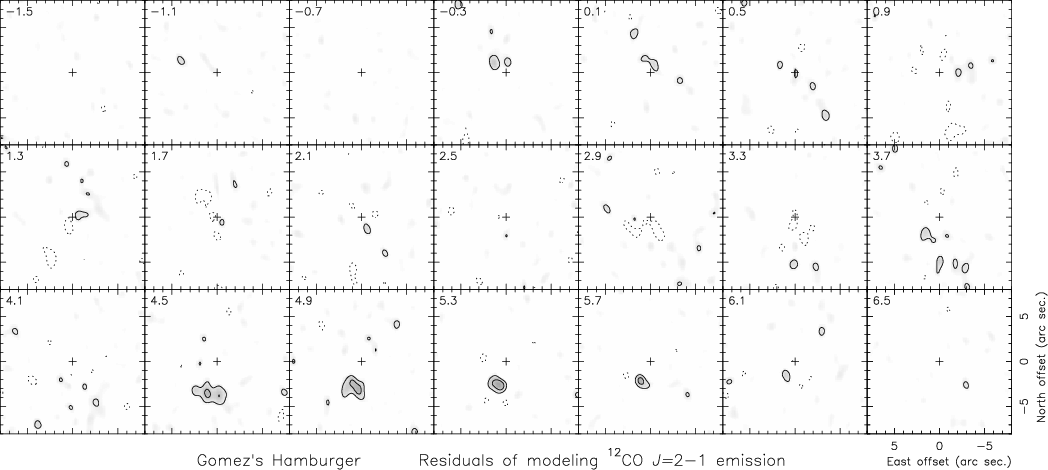 |
Figure A.1: Residuals (observations minus synthetic maps) of the 12CO J = 2-1 line brightness from our best model fitting for the GoHam disk. The spatial scale and contours are the same as in the observations and predictions, Figs. 1, 6. |
| Open with DEXTER | |
A.1 Criteria for acceptable models
The general criterion we chose to select acceptable models was the comparison of the predicted images with the observed ones. Some authors (e.g., Dutrey el al. 2007; Pety et al. 2006; Isella et al. 2007) perform such a comparison in the Fourier transformed plane of the visibilities. The selected model parameters are then those yielding the smallest residuals, after considering `blind' variations of the parameter values. Their method has the advantage of being objective and that uncertainties introduced by the cleaning process are avoided. Other authors (Fuente et al. 2006; Mannings & Sargent 2000,1997) follow, however, a more intuitive approach, comparing directly the images.
 |
Figure A.2: Predictions of the 13CO J = 2-1 line brightness from our best model fitting for the GoHam disk. The spatial scale and contours are the same as in the observations, Fig. 2. |
| Open with DEXTER | |
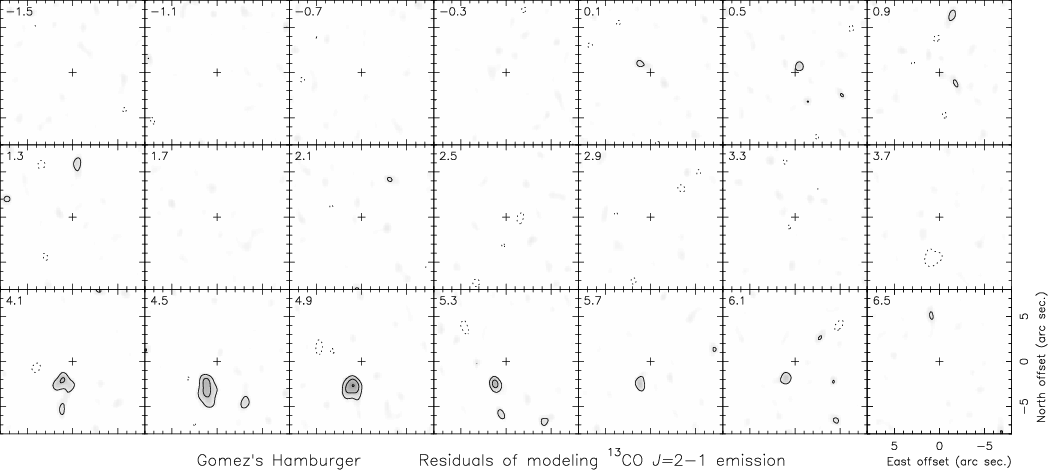 |
Figure A.3: Residuals (observations minus synthetic maps) of the 13CO J = 2-1 line brightness from our best model fitting for the GoHam disk. The spatial scale and contours are the same as in the observations and predictions, Figs. 2, A.2. |
| Open with DEXTER | |
In our case, the high number of free parameters prevents a blind analysis of the resulting residuals for any combination of parameter values, which would imply an exceedingly high amount of calculations. Even the definition of ``free parameter'' in this complex structure is difficult, and it is unclear at what extent we can vary all the disk properties. Even if theoretical constraints on our model parameters are taken into account (see Sect. 3), we continue to have more than 15 (more or less free) model parameters: 5 defining the geometry, 2 for the dynamics, 5 for the temperature, 3 for the density, and finally the 12CO/13CO/C17O abundance ratio. It is difficult to decrease such a high number of parameters because of the different components identified in the maps: the hotter and less dense fringes separated from the equator, an outer less dense region, the cold central part of the disk, and the central hotter region.
On the other hand, our procedure allows an intuitive analysis of the relevance of the different parameters. We can infer that some parameters are not so relevant in fitting some observational properties, and that certain observational features are related to only one or two model parameters. For instance, the total size of the disk is selected to match the total extent of the image, which depends weakly on, e.g., the rotational velocity.
It has been argued that in sources comparable in angular size to the telescope resolution, the comparison performed in the image plane is inaccurate. This is untrue in our case, since GoHam occupies an area about 30 square arcseconds, almost a factor of 20 larger than the beam of our 12CO J = 2-1 data. The cleaning process always introduces noise, but, besides numerical noise, it is mostly due to uncertainties in the calibration of the complex visibilities, i.e., the true beam shape not being exactly equal to the theoretical beam function (for the uv coverage of the observation). Subtraction of the convolved `clean components' and the subsequent convolution to obtain the final image introduces then spurious features, mainly when the uv sampling is poor. However, such unavoidable uncertainties in the amplitude and phase calibration also appear if the fitting is performed in the uv plane, and the limitation in the dynamic range of the observations due to them applies to both the sky plane and the Fourier transformed plane. On the other hand, we also note that Fourier transformation of the predicted brightness (which must be calculated for a finite grid of points in space coordinates from the standard radiative transfer equation) also introduces numerical noise.
As we see below in actual cases, it is practically impossible to define a single best-fit model in our case, because of the complex data set and model. Instead, we adopt criteria to consider whether a set of parameter values is acceptable and, when they are not satisfied, provide limits to these values. This process will only be detailed for the most representative parameters: radius and width of the disk, central mass (i.e., rotational velocity law), typical densities and temperatures. There is no significant differences among the acceptable models, both in their predictions and in values of the relevant disk properties; one of them was chosen as our best-fit model.
To select the acceptable models, we basically use the comparison of the predictions with the observations of the 12CO and 13CO J = 2-1 lines, in which S/N and the spatial and spectral resolutions are particularly high. We checked that the predictions for the J = 3-2 lines are also satisfactory. The criteria used to select acceptable models are:
c1) The differential image, i.e., the difference between observed
and synthetic
velocity channels, must have, in the regions of each channel where
emission is present, an rms noise not exceeding ![]() 1.5 times
that present in adjacent regions with no emission. Those regions, of
noise not higher than 1.5 times that found in adjacent ones, are only
slightly noticeable in the differential maps.
1.5 times
that present in adjacent regions with no emission. Those regions, of
noise not higher than 1.5 times that found in adjacent ones, are only
slightly noticeable in the differential maps.
c2) In the differential J = 2-1 image, the residuals must be
smaller than 2 times the spurious contours (due to noise) seen in
adjacent regions (![]() 0.6 Jy/beam, two contours, in our 12CO J = 2-1 images), and no residual
0.6 Jy/beam, two contours, in our 12CO J = 2-1 images), and no residual ![]() 0.3 Jy/beam must appear systematically,
i.e., in the same spatial offsets for several velocity channels. We
note that one can identify noise features more intense than 0.3 Jy/beam
in the observed 12CO J = 2-1 maps, so residuals not exceeding the above
limits are again not clearly different than the observation noise.
0.3 Jy/beam must appear systematically,
i.e., in the same spatial offsets for several velocity channels. We
note that one can identify noise features more intense than 0.3 Jy/beam
in the observed 12CO J = 2-1 maps, so residuals not exceeding the above
limits are again not clearly different than the observation noise.
These conditions are relaxed for velocities around 4.5-5.5 km s-1 LSR,
which present a strong emission clump with no counterpart in the
equivalent blue-shifted emission.
This excess cannot be due to opacity or excitation effects, since it is
more prominent in the 13CO J = 2-1 maps than in the 12CO J = 2-1 ones and much more than for 12CO J = 3-2. The excess is also clear in
the C17O J = 3-2 maps. The fact that this excess is so remarkable in
the less optically thick 13CO emission strongly suggests that it is
mainly due to the presence of a gas condensation, rotating at about
2.5 km s-1 at a distance of about
![]() cm from the star. Our
model shows axial symmetry and therefore cannot explain this excess; we
chose to fit mainly the emission from the rest of the nebula. A
tentative model fitting of this feature is presented in A.3, and the
consequences and possible origins of the presence of this condensation
are discussed in Sect. 4.1.
cm from the star. Our
model shows axial symmetry and therefore cannot explain this excess; we
chose to fit mainly the emission from the rest of the nebula. A
tentative model fitting of this feature is presented in A.3, and the
consequences and possible origins of the presence of this condensation
are discussed in Sect. 4.1.
In Fig. A.1, we present the residuals of our fitting of the 12CO J = 2-1 maps. Predictions and residuals for 13CO J = 2-1 are shown in Figs. A.2 and A.3. Except for the velocities around 5 km s-1, the typical rms noise outside the emitting regions is about 0.1-0.11 Jy/beam (slightly less for 13CO J = 2-1), and does not exceed 1.5-1.7 Jy/beam in the regions with emission. We see that the largest residuals in the differential images do not reach two contours (noise reaching one level is also seen out of the emitting regions).
Table A.1: Relative range of acceptable values, around those given in Table 1, of the main parameters defining the model disk in Gomez's Hamburger.
Of course, between 4.5 and 5.5 km s-1, the situation is worse, reflecting
the asymmetry in the disk density mentioned above. We can notice some
other minor features in the images that are not accounted for by our
model. For instance, the 13CO line emission at 3.7 km s-1 is less
extended than expected, which is not the case at 4.1 km s-1. We also note
in our 13CO maps a weak extent towards the north at about 1.3 km s-1,
but practically at the noise level. In 12CO J = 2-1, we see a similar
protrusion, but not exactly at the same position. We finally note in
some observed panels that the emission from regions close to the star
(see, e.g., the 13CO J = 2-1 emission at ![]() 0.5 km s-1 and the
12CO emission at 3.7 km s-1) is more extended than the predictions. The
width of our disk is given mainly by the equation of hydrostatics
(Sect. 3), under the standard theory of massive flaring disks; it is
possible that these usual theoretical requirements are not fully
satisfied in the innermost regions of the disks, although further
analysis of this phenomenon obviously requires higher-quality
observations.
0.5 km s-1 and the
12CO emission at 3.7 km s-1) is more extended than the predictions. The
width of our disk is given mainly by the equation of hydrostatics
(Sect. 3), under the standard theory of massive flaring disks; it is
possible that these usual theoretical requirements are not fully
satisfied in the innermost regions of the disks, although further
analysis of this phenomenon obviously requires higher-quality
observations.
A.2 Uncertainty in the fitted parameters
We estimated the uncertainties in derived values of the model
parameters by varying the values of each one (while the others remain
unchanged) and checking the values for which the above conditions, c1 and c2, were clearly not satisfied. This procedure was
completed for the main, most representative parameters, for instance,
the disk radius
![]() ,
the characteristic density, etc. The
results are summarized in Table 1. We also present below some cases in
which the uncertainty in the derived parameters requires some
discussion.
,
the characteristic density, etc. The
results are summarized in Table 1. We also present below some cases in
which the uncertainty in the derived parameters requires some
discussion.
We did not attempt to consider fully the parameter uncertainties when two or more parameters are allowed to vary. For example, the density range is slightly larger than that given in the table if we allow the temperature also to vary, since both variations are in some way compensated. In general, however, the ranges do not differ very much from our standard uncertainty brackets. The density is mostly fixed by the emission of 13CO and that of 12CO J = 2-1 from outer regions, while the temperature law is mainly given by the 12CO J = 2-1 and J = 3-2 maps.
We note the uncertain determination of the density in the outer disk
(
![]() ), which is only given by the 12CO emission,
since 13CO is not detected in this region (see Table A.1). We also
recall that the assumption of level population thermalization may
be invalid for these diffuse regions, which may imply that the density in
them is higher than the values given here, perhaps closer to
), which is only given by the 12CO emission,
since 13CO is not detected in this region (see Table A.1). We also
recall that the assumption of level population thermalization may
be invalid for these diffuse regions, which may imply that the density in
them is higher than the values given here, perhaps closer to
![]() cm-3.
cm-3.
Important problems with the thermalization assumption are unexpected
for the relatively high densities of the remaining nebula and the
analyzed transitions (Sect. 3). The J=6-5 transition is significantly
more sensitive to these effects, due to the relatively high Einstein
coefficients of high-J transitions. We also expect underpopulation of
the J=6 and J=5 levels in the high-z low-density regions, with
![]() cm-3, leading to 6-5 brightness temperatures
of under 10 K. This line would mainly come from this high temperature
surface, and we think that this phenomenon is responsible for the
non-detection of 12CO J=6-5 in our observations. Any further
discussion is impossible because of the lack of accurate information
about the J=6-5 emission. This relative underpopulation of high-Jlevels in the layers at high absolute values of z may lead to a
relative overpopulation of the J=2 level, and therefore to more
emission than expected in J = 2-1. This effect could lead to slightly
smaller jumps of the temperature, perhaps closer to factor 2.
cm-3, leading to 6-5 brightness temperatures
of under 10 K. This line would mainly come from this high temperature
surface, and we think that this phenomenon is responsible for the
non-detection of 12CO J=6-5 in our observations. Any further
discussion is impossible because of the lack of accurate information
about the J=6-5 emission. This relative underpopulation of high-Jlevels in the layers at high absolute values of z may lead to a
relative overpopulation of the J=2 level, and therefore to more
emission than expected in J = 2-1. This effect could lead to slightly
smaller jumps of the temperature, perhaps closer to factor 2.
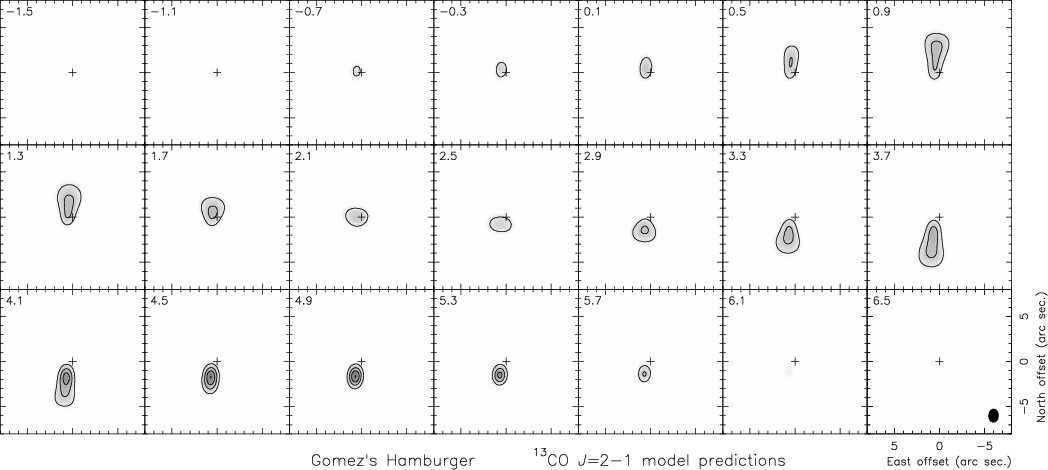 |
Figure A.4: Predictions of the 13CO J = 2-1 line brightness from our best model fitting for the GoHam disk, including the increase in temperature and density in a southern clump, as described in Appendix A.3. The spatial scale and contours are the same as in the observations, Fig. 2, and our standard model predictions, Fig. A.2. |
| Open with DEXTER | |
Some parameter pairs are quite dependent each on other. This is
particularly true for the density and CO total abundance,
since we assume LTE and then the line opacity depends on the product
of the density and the relative abundance. Both parameters can
therefore vary freely, provided that their product remains constant. The
indetermination is solved assuming a relative 12CO abundance of
10-4. This is also the case for parameters that we have not
considered separately in this uncertainty analysis, such as the
temperature at a given point, T(R0), and the slope of the
temperature law, ![]() ;
instead, as mentioned, we discuss
the uncertainty in the characteristic temperature. Finally, we note the
case of the rotation velocity and the conditions in the hot and dense
center of the disk. Strong emission from these regions could mimic the
emission of a faster rotating disk in the extreme velocity
channels. So, the rotation velocity is mainly determined from the
emission extent in the channels at moderate velocities, the emission at
the extreme channels depending on both the Keplerian velocity and the
emissivity of the central regions. In general, the uncertainty in the
parameters defining the inner, denser region (
;
instead, as mentioned, we discuss
the uncertainty in the characteristic temperature. Finally, we note the
case of the rotation velocity and the conditions in the hot and dense
center of the disk. Strong emission from these regions could mimic the
emission of a faster rotating disk in the extreme velocity
channels. So, the rotation velocity is mainly determined from the
emission extent in the channels at moderate velocities, the emission at
the extreme channels depending on both the Keplerian velocity and the
emissivity of the central regions. In general, the uncertainty in the
parameters defining the inner, denser region (
![]() )
is high, because this clump is not resolved and the
number of independent observational constraints is small (as also
concluded in Paper I). We can say that an inner region of higher
density and temperature is necessary to attain our strong requirements
on the fitting quality and that it must be smaller than about
1016 cm, but we cannot provide details of this region.
)
is high, because this clump is not resolved and the
number of independent observational constraints is small (as also
concluded in Paper I). We can say that an inner region of higher
density and temperature is necessary to attain our strong requirements
on the fitting quality and that it must be smaller than about
1016 cm, but we cannot provide details of this region.
The outer hot region, for high values of z, is hardly resolved in our 12CO maps. Therefore, we could also reproduce our data assuming that this region is significantly thinner and brighter (in general, hotter) than in our standard model. However, those disk models are less probable than our standard one, since the jump in temperature we found is already quite high (see Sect. 3). Moreover, for very high temperatures in the high-z rim, we should also increase the typical density significantly (to be able to reproduce 12CO J = 2-1 data, which, for the assumed dependence of density on z, is only moderately opaque in the high-z regions). This would then imply too low values of X(13CO), when attempting to reproduce the 13CO J = 2-1 data, leading to improbably high values of X(12CO)/X(13CO), of significantly over 100. In any case, we note that the properties of this high-z bright rim depend on the relative calibration of the J = 2-1 and J = 3-2 lines; allowing 15% variations in the relative calibrations, we can fit the data with temperature jumps ranging between 2 and 5 (and hot-layer widths that do not differ significantly from our standard value).
A.3 Model (tentative) fitting of the southern brightness maximum
We mentioned that there is a relative maximum in the southern part of the disk that has no counterpart in the north. This maximum is seen in all our maps, but is more prominent in the 13CO emission, which is mostly optically thin, as well as in the C17O line. Therefore, this brightness maximum must be due mainly to an increase in the density of some southern regions, although an increase in temperature is also necessary to explain the excess observed in 12CO J = 2-1.
In our standard model analysis, we mostly tried to fit the emission from the rest of the nebula (Sects. 3, A1, A2). Any attempt to fit the emission excess from this southern clump is very uncertain, because of the lack of previous experience in trying to study condensations of this kind, including the lack of theoretical modeling, and because of the poor information contained in our observations, which scarcely resolve its extent.
Nevertheless, we note that this emission excess can be detected over a
remarkable range of velocities, between about 4.1 and 5.7 km s-1 LSR. This means that the emitting condensation cannot be very small,
the projected velocity dispersion being caused by gas emission from
different distances from the star or from regions showing a significant
variation in the velocity projection along the line of sight. In both
cases, we expect typical sizes ![]()
![]() cm
(
cm
(![]() 1
1
![]() for the adopted distance). We can also assume that the
condensation occurs in the equatorial disk regions in which 13CO J = 2-1 emission originates, because the maximum is so prominent in this
line. We have assumed that the emission comes from a region defined by
for the adopted distance). We can also assume that the
condensation occurs in the equatorial disk regions in which 13CO J = 2-1 emission originates, because the maximum is so prominent in this
line. We have assumed that the emission comes from a region defined by
![]() cm, and zs/r < 0.6, where
zs is the distance between a given point and the plane containing
the star and perpendicular to the equator that gives the extreme
projections for the rotation velocity. We assume that the temperature
and density of this region vary with respect to the standard laws
assumed for the rest of the nebula.
cm, and zs/r < 0.6, where
zs is the distance between a given point and the plane containing
the star and perpendicular to the equator that gives the extreme
projections for the rotation velocity. We assume that the temperature
and density of this region vary with respect to the standard laws
assumed for the rest of the nebula.
To explain the (moderate) emission excess found in 12CO J = 2-1, we
estimate that we must assume an increase in temperature in the
southern condensation of a factor ![]() 1.5, with respect to our
standard laws for nearby regions. Finally, we estimate the
excess density in the condensation by comparing the model
results with the intensity of 13CO J = 2-1. Since the 13CO J = 2-1 emission from these inner regions is not fully optically thin and the
beam dilution is not negligible, a
significant density increase, of a factor 10, is necessary. A total
mass increase of about
1.5, with respect to our
standard laws for nearby regions. Finally, we estimate the
excess density in the condensation by comparing the model
results with the intensity of 13CO J = 2-1. Since the 13CO J = 2-1 emission from these inner regions is not fully optically thin and the
beam dilution is not negligible, a
significant density increase, of a factor 10, is necessary. A total
mass increase of about
![]()
![]() is deduced.
is deduced.
The resulting brightness distribution is shown in Fig. A.4. We can see that the brightness excess of 13CO J = 2-1 in this southern clump is reasonably well reproduced, but the location of the predicted maximum is slightly closer to the star than the observed one. This cannot be avoided assuming a larger distance from the star for the clump, because then the velocity of the feature would be less positive. The velocity field in this region must then also be disturbed. See discussion on the interpretation of this emission excess in Sect. 4.1.
Footnotes
- ... disk
- Appendix A is only available in electronic form at http://www.aanda.org
All Tables
Table 1: Structure and physical conditions in the molecular disk of Gomez's Hamburger, derived from our model fitting of several CO rotational lines. Dependence on the assumed distance is given in the relevant cases. Other parameters of the modeling are also given.
Table A.1: Relative range of acceptable values, around those given in Table 1, of the main parameters defining the model disk in Gomez's Hamburger.
All Figures
| |
Figure 1:
Channel maps of the 12CO J = 2-1 line from Gomez's
Hamburger, continuum has been subtracted. First contour and contour
step are 0.28 Jy/beam, approximately equal to 3 |
| Open with DEXTER | |
| In the text | |
| |
Figure 2: Same as Fig. 1, but for the channel maps of the 13CO J = 2-1 line observed from Gomez's Hamburger. First contour and contour step are also 0.28 Jy/beam. |
| Open with DEXTER | |
| In the text | |
| |
Figure 3: Zoomed 12CO and 13CO J = 2-1 emission for velocities 0.9 and 4.1 km s-1, respectively blue (north) and red (south) contours, superposed to the HST image of GoHam; from Figs. 1 and 2, see further details in Sect. 2. |
| Open with DEXTER | |
| In the text | |
| |
Figure 4: Same as Fig. 1, but for the channel maps of the 12CO J = 3-2 line observed from Gomez's Hamburger. First contour and contour step are 0.5 Jy/beam. Note that the spectral and spatial resolutions of these observations are somewhat poorer. |
| Open with DEXTER | |
| In the text | |
| |
Figure 5: Same as Fig. 3, but for the channel maps of the C17O J = 3-2 line observed from Gomez's Hamburger. First contour and contour step are 0.3 Jy/beam. |
| Open with DEXTER | |
| In the text | |
| |
Figure 6: Predictions of the 12CO J = 2-1 line brightness from our best-fit model for the GoHam disk. The spatial scale and contours are the same as in the observations, Fig. 1. |
| Open with DEXTER | |
| In the text | |
| |
Figure 7: Density and temperature distributions in our best-fit model. r is the distance from the rotation axis, and z is the distance to the equator. |
| Open with DEXTER | |
| In the text | |
| |
Figure 8:
Position-velocity diagram of the 13CO J = 2-1 emission
from GoHam, obtained along the disk direction
(PA = -5 |
| Open with DEXTER | |
| In the text | |
| |
Figure A.1: Residuals (observations minus synthetic maps) of the 12CO J = 2-1 line brightness from our best model fitting for the GoHam disk. The spatial scale and contours are the same as in the observations and predictions, Figs. 1, 6. |
| Open with DEXTER | |
| In the text | |
| |
Figure A.2: Predictions of the 13CO J = 2-1 line brightness from our best model fitting for the GoHam disk. The spatial scale and contours are the same as in the observations, Fig. 2. |
| Open with DEXTER | |
| In the text | |
| |
Figure A.3: Residuals (observations minus synthetic maps) of the 13CO J = 2-1 line brightness from our best model fitting for the GoHam disk. The spatial scale and contours are the same as in the observations and predictions, Figs. 2, A.2. |
| Open with DEXTER | |
| In the text | |
| |
Figure A.4: Predictions of the 13CO J = 2-1 line brightness from our best model fitting for the GoHam disk, including the increase in temperature and density in a southern clump, as described in Appendix A.3. The spatial scale and contours are the same as in the observations, Fig. 2, and our standard model predictions, Fig. A.2. |
| Open with DEXTER | |
| In the text | |
Copyright ESO 2009
Current usage metrics show cumulative count of Article Views (full-text article views including HTML views, PDF and ePub downloads, according to the available data) and Abstracts Views on Vision4Press platform.
Data correspond to usage on the plateform after 2015. The current usage metrics is available 48-96 hours after online publication and is updated daily on week days.
Initial download of the metrics may take a while.