| Issue |
A&A
Volume 499, Number 3, June I 2009
|
|
|---|---|---|
| Page(s) | 679 - 695 | |
| Section | Cosmology (including clusters of galaxies) | |
| DOI | https://doi.org/10.1051/0004-6361/200911659 | |
| Published online | 16 April 2009 | |
Comparative analysis of the diffuse radio emission in the galaxy clusters A1835, A2029, and Ophiuchus
M. Murgia1,2 -
F. Govoni1 -
M. Markevitch3 -
L. Feretti2 -
G. Giovannini2,4 -
G. B. Taylor5,![]() -
E. Carretti2
-
E. Carretti2
1 -
INAF - Osservatorio Astronomico di Cagliari,
Poggio dei Pini, Strada 54, 09012 Capoterra (CA), Italy
2 -
INAF - Istituto di Radioastronomia,
via Gobetti 101, 40129 Bologna, Italy
3 -
Harvard-Smithsonian Center for Astrophysics, 60 Garden Street,
Cambridge, MA 02138, USA
4 -
Dipartimento di Astronomia,
Univ. Bologna, via Ranzani 1, 40127 Bologna, Italy
5 -
University of New Mexico, MSC 07 4220, Albuquerque, NM 87131, USA
Received 13 January 2009/ Accepted 30 March 2009
Abstract
Aims. We recently performed a study of a sample of relaxed, cooling core galaxy clusters with deep Very Large Array observations at 1.4 GHz. We find that in the central regions of A1835, A2029, and Ophiuchus the dominant radio galaxy is surrounded by a diffuse low-brightness radio emission that takes the form of a mini-halo. Here we present the results of the analysis of the extended diffuse radio emission in these mini-halos.
Methods. In order to investigate the morphological properties of the diffuse radio emission in clusters of galaxies we propose to fit their azimuthally averaged brightness profile with an exponential, obtaining the central brightness and the e-folding radius from which the radio emissivity can be calculated. We investigate the radio properties of the mini-halos in A1835, A2029, and Ophiuchus in comparison with the radio properties of a representative sample of mini-halos and halos already known in the literature.
Results. We find that radio halos can have quite different length-scales but their emissivity is remarkably similar from one halo to the other. In contrast, mini-halos span a wide range of radio emissivity. Some of them, like the Perseus mini-halo, are characterized by a radio emissivity which is more than 100 times greater than that of radio halos. On the other hand, the new mini-halos in cooling core clusters analyzed in this work, namely A2029, Ophiuchus, and A1835, have a radio emissivity which is much more typical of halos in merging clusters rather than similar to that of the other mini-halos previously known.
Key words: galaxies: clusters: individual: A1835, A2029, Ophiuchus - radio continuum: galaxies
1 Introduction
Radio halos are diffuse, low surface brightness,
steep-spectrum![]() sources (
sources (
![]() ), permeating the central regions of galaxy clusters. These radio sources are extended on megaparsec scales and are produced by synchrotron radiation of relativistic electrons with energies of
), permeating the central regions of galaxy clusters. These radio sources are extended on megaparsec scales and are produced by synchrotron radiation of relativistic electrons with energies of ![]() 10 GeV in magnetic fields with
10 GeV in magnetic fields with
![]() G (see e.g. Feretti & Giovannini 2008; Ferrari et al. 2008, and references therein for recent reviews).
G (see e.g. Feretti & Giovannini 2008; Ferrari et al. 2008, and references therein for recent reviews).
Radio halos are typically found in clusters which show significant
evidence for an ongoing merger (e.g. Buote 2001; Govoni et al. 2004).
It has been proposed that recent cluster mergers may play an
important role in the re-acceleration of the radio-emitting relativistic particles,
thus providing the energy that powers these extended sources
(e.g. Brunetti et al. 2001; Petrosian 2001). A major merger event is
expected to disrupt cooling cores
and create disturbances readily visible in
an X-ray image of the cluster. Therefore,
the merger scenario predicts the absence of large-scale radio
halos in symmetric cooling core clusters.
However, a few cooling core clusters show the presence of
a diffuse synchrotron emission that extends quite far from the dominant radio
galaxy at the cluster center, forming what is called a mini-halo.
These diffuse radio sources are extended
on a moderate scale (typically ![]() 500 kpc) and,
in common with large-scale halos, have a steep spectrum and a very
low surface brightness.
500 kpc) and,
in common with large-scale halos, have a steep spectrum and a very
low surface brightness.
To date about 30 radio halos are known
(e.g., Giovannini & Feretti 2000; Bacchi et al. 2003;
Govoni et al. 2001a; Venturi et al. 2007, 2008;
Giovannini et al., in preparation).
Due to their extremely low surface brightness
and large angular extent (>10' at a redshift ![]() )
radio halos are best studied at low
spatial resolution. In fact, several radio halos were detected
by Giovannini et al. (1999) in
the NRAO VLA Sky Survey (NVSS, Condon et al. 1998) and by
Kempner & Sarazin (2001) in the Westerbork Northern Sky Survey
(WENSS; Rengelink et al. 1997),
where the relatively large beam of these
surveys provided the necessary sensitivity to large-scale
emission to spot these elusive sources.
)
radio halos are best studied at low
spatial resolution. In fact, several radio halos were detected
by Giovannini et al. (1999) in
the NRAO VLA Sky Survey (NVSS, Condon et al. 1998) and by
Kempner & Sarazin (2001) in the Westerbork Northern Sky Survey
(WENSS; Rengelink et al. 1997),
where the relatively large beam of these
surveys provided the necessary sensitivity to large-scale
emission to spot these elusive sources.
Due to the combination of their small angular size and the strong radio emission of the central radio galaxy, the detection of a mini-halo requires a much higher dynamic range and resolution than provided by available surveys, thus complicating their detection. As a consequence, our current observational knowledge on mini-halos is limited to only a handful of well-studied clusters (e.g., Perseus: Burns et al. 1992; A2390: Bacchi et al. 2003; RXJ1347.5-1145: Gitti et al. 2007), and their origin and physical properties are still poorly understood.
To search for new extended diffuse radio emission in relaxed and cooling core galaxy clusters, we recently performed a study of a small sample of clusters with deep Very Large Array observations at 1.4 GHz. We find that in the central regions of A1835, A2029, and Ophiuchus the dominant radio galaxy is surrounded by a diffuse low-brightness radio emission that takes the form of a mini-halo (Govoni et al. 2009, hereafter Paper I). Here we present the analysis of these three new mini-halos and we investigate their radio properties in comparison with those of a statistically significant sample of mini-halos and halos already known in the literature and for which good VLA radio images at 1.4 GHz are available. In Sect. 2 we present an analysis of the mini-halos found in A1835, A2029, and Ophiuchus. In particular we fit their azimuthally averaged brightness profile with an exponential. Through the study of their averaged brightness profiles, we analyze some of their morphological and physical radio properties (i.e., length-scale, central brightness, and emissivity). In Sect. 3 we compare the properties of the mini-halos in A1835, A2029, and Ophiuchus with those of other halos and mini-halos already available in the literature. In Sect. 4 we test the reliability of the fitting procedure. The discussion is presented in Sect. 5 and our conclusions are reported in Sect. 6.
Throughout this paper we assume a ![]() CDM cosmology with
H0 = 71 km s-1 Mpc-1,
CDM cosmology with
H0 = 71 km s-1 Mpc-1,
![]() ,
and
,
and
![]() .
.
2 Analysis of the mini-halos in A1835, A2029 and Ophiuchus
In order to investigate the presence of diffuse extended emission in relaxed systems, we recently examined a small sample of cooling core clusters with deep Very Large Array observations at 1.4 GHz. The combination of resolution and sensitivity of these observations allow us to increase the number of known large scale diffuse radio emissions in cooling core clusters. Indeed, we found that in the central regions of A1835, A2029, and Ophiuchus the dominant radio galaxy is surrounded by a diffuse low-brightness radio emission that takes the form of a mini-halo. The basic properties of these clusters are reported in Table 1, while the details of the observations are described in Paper I. Here we present a morphological analysis of these mini-halos. For this purpose, the radio images have been convolved with a circular Gaussian beam and corrected for the primary beam attenuation.Table 1: The mini-halos analyzed in this work and the basic properties of the radio images at 1.4 GHz.
Table 2: Radio properties of the mini halos derived from the fit procedure.
The brightness of halo-like diffuse radio sources in clusters of
galaxies decreases with increasing distance from the cluster
center, eventually falling below the noise level of the radio images. The
signal-to-noise ratio of the VLA images analyzed in Paper I allows us
to trace the mini-halo extension out to a distance from the cluster
center of ![]() 450 kpc,
450 kpc, ![]() 250 kpc, and
250 kpc, and ![]() 200 kpc for A1835,
A2029, and Ophiuchus, respectively (see left-panels of
Fig. 1). However, the size of the diffuse low-surface
brightness emissions as derived from the 3
200 kpc for A1835,
A2029, and Ophiuchus, respectively (see left-panels of
Fig. 1). However, the size of the diffuse low-surface
brightness emissions as derived from the 3![]() -isophotes seen in
the radio images may be strongly affected by the sensitivity of the
radio observations. It is desirable to define a quantity which
is independent of the signal-to-noise ratio of the radio images in
order to obtain an unbiased estimate of the size of mini-halos and
halos.
-isophotes seen in
the radio images may be strongly affected by the sensitivity of the
radio observations. It is desirable to define a quantity which
is independent of the signal-to-noise ratio of the radio images in
order to obtain an unbiased estimate of the size of mini-halos and
halos.
Although deviations of the diffuse emission from spherical
symmetry are often observed, the azimuthally averaged radial profiles are
indeed quite
stable. For this reason, following the same approach used
by Orrù et al. (2007), we fit the azimuthally averaged brightness
profiles with an exponential law of the form:
| (1) |
where the two independent parameters I0 and re are the central radio surface brightness and the e-folding radius i.e., the radius at which the brightness drops to I0/e. As we will show, the quantity re can be used to define a length-scale which is relatively independent on the sensitivity of the radio images. The exponential model is attractive in its simplicity and involves a minimal set of free parameters.
We note that in mini-halos the presence of a strong central radio galaxy, which appears as a point source at the low resolution of our observations, complicates the analysis. Therefore its emission must be known accurately in order to separate its contribution from that of the mini-halo.
![\begin{figure}
\par\includegraphics[width=14cm,clip]{1659fg1.eps}\end{figure}](/articles/aa/full_html/2009/21/aa11659-09/img55.png) |
Figure 1:
The azimuthally averaged brightness profiles of the radio emission
in A1835 ( top), A2029 ( middle), and Ophiuchus ( bottom).
The profiles have been calculated in concentric annuli,
as shown in the left panels.
All the discrete sources (except the central source)
have been masked.
For each cluster the horizontal dashed-dotted line indicates the 3 |
| Open with DEXTER | |
In Fig. 1 we present the resulting azimuthally averaged brightness profiles of A1835, A2029 and Ophiuchus, respectively. The profiles have been obtained by averaging the radio brightness in concentric annuli as shown in the left panels of Fig. 1. The annuli are as wide as the half FWHM beam. In the statistical analysis all the discrete sources (except the central source) have been excluded by masking them out. Moreover, we considered only data points above the 3-sigma radio noise level as indicated by the horizontal dashed-dotted line in the plots.
In order to carefully separate the contribution
of the mini-halo from that of the central radio galaxy,
we fitted the total brightness profiles with a central point source
plus the radio mini-halo diffuse emission
In particular the profile of the central point source has been characterized by a Gaussian of the form
while the brightness profile of the mini-halo has been characterized by an exponential law of the form
The resolution of the observations, the masked regions, and the sampling of the radial profile in annuli, are all factors that can affect the estimate of the best fit parameters and thus we decided to include their effects directly in the modelling.
In order to properly take into account the resolution, the exponential model in Eq. (4) is first calculated in a 2-dimensional image with the same pixel size and field of view as that observed, and then convolved with the same beam by means of a Fast Fourier Transform. The point-source model in Eq. (3) is added and the resulting image is masked exactly in the same regions as for the observations. Finally, the model is azimuthally averaged with the same set of annuli used to obtain the observed radial profile. All these functions are performed at each step during the fit procedure. As a result, the values of the central brightness, I0, and e-folding radius, re, provided by the fit are deconvolved quantities and their estimate includes all the uncertainties related to the masked regions and to the sampling of the radial profile in annuli of finite width. The fit procedure has been implemented in the software FARADAY (Murgia et al. 2004).
The best fit model is shown as a continuous black line in the right
panels of Fig. 1. The mini-halo contribution is indicated by
the green dashed line, while the contribution of the central point
source is indicated with the red dotted line. The best fit values for
both the mini-halos and the central components are reported in Table
2, together with their respectively errors and the
corresponding ![]() .
.
Overall, the observed profiles are well fit by the exponential
model. In A2029 and Ophiuchus the emission of the mini-halo extends
for several beams from the central point source. It is important to
note the fundamental difference between the method based on the
measurement of ![]() ,
the mini-halo maximum size from the
3
,
the mini-halo maximum size from the
3![]() -isophote above the noise
-isophote above the noise![]() , and the fit
of the e-folding radius, re. In fact, the mini-halo in A2029 has a
larger extension with respect to that in Ophiuchus: the two mini-halos
have
, and the fit
of the e-folding radius, re. In fact, the mini-halo in A2029 has a
larger extension with respect to that in Ophiuchus: the two mini-halos
have
![]() kpc and
kpc and
![]() kpc, respectively.
However, the mini-halo emission in A2029 falls off more rapidly and
the corresponding e-folding radius
re= 53+6-6 kpc is much
smaller than that in Ophiuchus,
re= 105+13-11 kpc. The fit
is critical for A1835 (see Sect. 4). This is the most distant cluster of
the three and the emission of the mini-halo is heavily blended with
that of the central point source. The maximum extent for A1835 is
as large as
kpc, respectively.
However, the mini-halo emission in A2029 falls off more rapidly and
the corresponding e-folding radius
re= 53+6-6 kpc is much
smaller than that in Ophiuchus,
re= 105+13-11 kpc. The fit
is critical for A1835 (see Sect. 4). This is the most distant cluster of
the three and the emission of the mini-halo is heavily blended with
that of the central point source. The maximum extent for A1835 is
as large as
![]() kpc, while the e-folding radius
obtained by the model fit results, with a large uncertainty, is
re= 105+70-21 kpc.
kpc, while the e-folding radius
obtained by the model fit results, with a large uncertainty, is
re= 105+70-21 kpc.
The central brightness ranges from I0 =2.75 ![]() Jy/arcsec2 for
A2029 to I0=0.58
Jy/arcsec2 for
A2029 to I0=0.58 ![]() Jy/arcsec2 for Ophiuchus, indicating a
slightly tendency for the smaller mini-halos to have a higher central
brightness (see Sect. 3).
In all three cases the best fit model results in a central Gaussian
with
Jy/arcsec2 for Ophiuchus, indicating a
slightly tendency for the smaller mini-halos to have a higher central
brightness (see Sect. 3).
In all three cases the best fit model results in a central Gaussian
with
![]() ,
as
expected for a point like or a slightly resolved source.
From I0 and re we then calculated the flux density
,
as
expected for a point like or a slightly resolved source.
From I0 and re we then calculated the flux density
![]() (see Table 2) of the mini-halos.
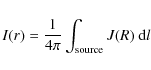
In particular, the flux density is derived by integrating the brightness profile I(r) up to a radius
(see Table 2) of the mini-halos.
In particular, the flux density is derived by integrating the brightness profile I(r) up to a radius
![]() from
the cluster center:
from
the cluster center:
![\begin{displaymath}S_{\rm MH}= 2\pi \int_{0}^{r^{\prime}} I(r) r {\rm d}r=2\pi [1+{\rm e}^{-r^{\prime}/r_e}(-r^{\prime}/r_e-1)] \cdot r_e^2 I_0 .
\end{displaymath}](/articles/aa/full_html/2009/21/aa11659-09/img66.png) |
(5) |
We calculated the flux density of the mini-halos by integrating the surface brightness of the best fit exponential model up to
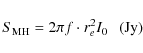
where re and I0 are in units of arcsec and Jy/arcsec2, respectively, while
Table 3: Radio information of halos and mini halos taken from the literature and reanalyzed in this work with the exponential model fit.
In Col. 9 of Table 2, we also provide the flux density of the
central point source derived from the fit. The flux density of the
central point source,
![]() ,
is calculated through:
,
is calculated through:
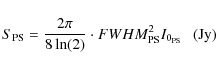
where
where
We calculated a volume-averaged radio emissivity by supposing that all the flux density in Eq. (6) comes from a
sphere of radius 3re:
where re and I0 are in units of kpc and
3 Mini-halos and halos comparison
Merging and cooling core clusters containing extended diffuse radio sources (halos and mini-halos respectively) show different X-ray properties, indicating a different evolutionary state. A systematic and homogeneous comparison between the properties of extended diffuse radio sources in merging systems with those in cooling core clusters, may help in understanding if the energy necessary to trigger their radio emission may be related to different physical processes. Therefore, we analyzed the azimuthally averaged brightness profiles in a sample of 12 clusters containing a central radio halo, previously imaged by us. Moreover, in order to investigate also a significant number of mini-halos, we reduced and analyzed the VLA data at 1.4 GHz of the mini-halos in RXJ1347.5-1145 (Gitti et al. 2007), A2390 (Bacchi et al. 2003), and Perseus (Pedlar et al. 1990), previously reported in the literature. The cluster list, together with their references is given in Table 3.
Indeed the analysis lacks some well known radio halos and mini-halos, however, the number of clusters analyzed here is representative of these classes of radio sources and contains both extended (e.g. A2163, A2744) and small halos (e.g. A401, A2218) in merging clusters and several mini-halos in cooling core clusters. In Figs. 2 and 3 we present the resulting azimuthally averaged brightness profiles of the radio halos, while in Fig. 4 we present those of the three mini-halos. The profiles have been obtained by averaging the radio brightness in concentric annuli as shown in the inset of each panel.
![\begin{figure}
\par\includegraphics[width=14.2cm,clip]{1659fg2.eps}\end{figure}](/articles/aa/full_html/2009/21/aa11659-09/img138.png) |
Figure 2:
Azimuthally averaged brightness profiles of the radio halos in A2744
(Govoni et al. 2001a), A665 (Giovannini & Feretti 2000), A2219
(Bacchi et al. 2003), A2255 (Govoni et al. 2005), A773 (Govoni et al. 2001a), A545 (Bacchi et al. 2003). The profiles have been
calculated in concentric annuli, as shown in the inset panels. All
the discrete sources have been masked. For each cluster the
horizontal dashed-dotted line indicates the 3 |
| Open with DEXTER | |
![\begin{figure}
\par\includegraphics[width=14.5cm,clip]{1659fg3.eps}\end{figure}](/articles/aa/full_html/2009/21/aa11659-09/img139.png) |
Figure 3:
Azimuthally averaged brightness profiles of the radio
halos in A2319 (Feretti et al. 1997), A2218 (Giovannini & Feretti 2000), A2163 (Feretti et al. 2001),
A401 (Bacchi et al. 2003), A2254 (Govoni et al. 2001a), RXCJ1314.4-2515 (Feretti et al. 2005).
The profiles have been calculated in concentric annuli,
as shown in the inset panels.
All the discrete sources have been masked.
For each cluster the horizontal dashed-dotted line indicates the 3 |
| Open with DEXTER | |
![\begin{figure}
\par\includegraphics[width=14.8cm,clip]{1659fg4.eps}\end{figure}](/articles/aa/full_html/2009/21/aa11659-09/img140.png) |
Figure 4:
Azimuthally averaged brightness profiles of the mini-halos
in RXJ1347.5-1145, A2390, and Perseus, previously
imaged in the literature (Gitti et al. 2007; Bacchi et al. 2003;
Pedlar et al. 1990).
The profiles have been calculated in concentric annuli,
as shown in the inset panels.
All the discrete sources (except the central one)
have been masked.
For each cluster the horizontal dashed-dotted line indicates the 3 |
| Open with DEXTER | |
![\begin{figure}
\par\includegraphics[width=10.5cm,clip]{1659fg5.eps}\end{figure}](/articles/aa/full_html/2009/21/aa11659-09/img142.png) |
Figure 5:
Top: best fit central brightness I0 ( |
| Open with DEXTER | |
The analysis of the three previously known mini-halos has been
performed with the same approach proposed for A1835, A2029, and
Ophiuchus - by fitting the brightness profiles with a central
Gaussian plus an exponential law, and by masking all the discrete
sources, except the central one. The analysis of the halos has been
performed by fitting the brightness profiles with only an exponential
law and by masking all the discrete sources.
As in the case of A1835, A2029, and Ophiuchus the diffuse synchrotron
emission both of the halos and mini-halos are quite well fit by an
exponential law characterized by a central surface brightness I0and an e-folding radius re. The best fit values of the fit
procedure, together with their respectively errors, and the corresponding ![]() ,
are reported in Table 3.
,
are reported in Table 3.
![\begin{figure}
\par\includegraphics[width=10cm,clip]{1659fg6.ps}\end{figure}](/articles/aa/full_html/2009/21/aa11659-09/img145.png) |
Figure 6:
Radio power at 1.4 GHz versus e-folding radius in kilosparsecs for mini-halos (red dots) and halos (blue triangles).
The dotted reference line represents
the expected radio power if we assume for the emissivity the average value we found for radio halos
|
| Open with DEXTER | |
In the top panel of Fig. 5 we show the best fit central
brightness I0 (![]() Jy/arcsec2) versus the length-scale re(kpc) both for halos (blue triangles) and mini-halos (red dots). The
length scale re in this sample of halos ranges between
Jy/arcsec2) versus the length-scale re(kpc) both for halos (blue triangles) and mini-halos (red dots). The
length scale re in this sample of halos ranges between
![]() 70-400 kpc. While the central brightness I0 ranges
between
70-400 kpc. While the central brightness I0 ranges
between ![]() 0.4-3
0.4-3 ![]() Jy/arcsec2. All the halo sources of
the sample populate a well defined region of the I0-re plane.
There is a tendency for halo sources with a higher central brightness
to have a greater length-scale. By comparing the location of the halo
sources in the I0-re plane with the dotted lines of constant
emissivity we found, for the first time, that all halos have a
markedly similar radio emissivity
Jy/arcsec2. All the halo sources of
the sample populate a well defined region of the I0-re plane.
There is a tendency for halo sources with a higher central brightness
to have a greater length-scale. By comparing the location of the halo
sources in the I0-re plane with the dotted lines of constant
emissivity we found, for the first time, that all halos have a
markedly similar radio emissivity![]() .
.
![\begin{figure}
\par\includegraphics[width=14cm,clip]{1659fg7.eps}\end{figure}](/articles/aa/full_html/2009/21/aa11659-09/img146.png) |
Figure 7:
Left: fit of the azimuthally averaged brightness profiles
calculated from the NVSS image of the cluster A2744.
Right: contours of the NVSS image in comparison with the
contours of the deeper VLA image for A2744 (Govoni et al. 2001a).
In both images the first contour is drawn at 3 |
| Open with DEXTER | |
In contrast, the mini-halo distribution in the I0-re plane appears
much more scattered. In our sample there are no mini-halos with a
re larger than ![]() 100 kpc. They have a tendency to populate
the low re, while the central emissivity can be two orders of
magnitude higher than in halos. By comparing the location of the
mini-halo sources in the I0-re plane with the lines of constant
emissivity we found that although some mini-halos (like Ophiuchus and
A1835) are quite comparable to the halo sources, in general mini-halos
appear clearly separated from the halo sources, showing a larger spread
in radio emissivity.
100 kpc. They have a tendency to populate
the low re, while the central emissivity can be two orders of
magnitude higher than in halos. By comparing the location of the
mini-halo sources in the I0-re plane with the lines of constant
emissivity we found that although some mini-halos (like Ophiuchus and
A1835) are quite comparable to the halo sources, in general mini-halos
appear clearly separated from the halo sources, showing a larger spread
in radio emissivity.
As previously noted, there is a tendency for the smaller mini-halos of
our sample to have a higher central brightness. But this trend must be
considered carefully, because a selection effect may be present. The
dashed line in top panel of Fig. 5 indicates the minimum
central brightness required for a mini-halo (or a halo) with a given
e-folding radius to be imaged with at least 4 resolution elements
(beams) in a deep image with a sensitivity of
![]()
![]() Jy/beam, and a 25 arcsec beam. These numbers are appropriate for the
deepest images taken with the VLA at this resolution and frequency
(see e.g. Govoni et al. 2005). The detection limit is calculated
assuming a putative redshift of z=0.18 (the average redshift of the
mini-halos and halos analyzed in this work). In practice, for a
mini-halo (or a halo) to be detected, it is required that
Jy/beam, and a 25 arcsec beam. These numbers are appropriate for the
deepest images taken with the VLA at this resolution and frequency
(see e.g. Govoni et al. 2005). The detection limit is calculated
assuming a putative redshift of z=0.18 (the average redshift of the
mini-halos and halos analyzed in this work). In practice, for a
mini-halo (or a halo) to be detected, it is required that
![]() ,
where
,
where ![]() is implicitly defined by the
equation:
is implicitly defined by the
equation:
![]() which implies
which implies
![]() .
The shaded region limited by
this detection threshold is hardly accessible by current radio
interferometers at 1.4 GHz. For instance, an object with
.
The shaded region limited by
this detection threshold is hardly accessible by current radio
interferometers at 1.4 GHz. For instance, an object with
![]() kpc would be detectable only if brighter than
kpc would be detectable only if brighter than
![]()
![]() Jy/arcsec2. As a result, the observed tendency for the
smaller mini-halos to be brighter must be considered prudently. In any
case, the possible selection effect mentioned above seems not to
influence the result that mini-halos have systematically lower values of
re than halos. Mini-halos appear effectively smaller than halos and
this could reflect the higher density of the intergalactic gas in
the central regions of cooling clusters.
Jy/arcsec2. As a result, the observed tendency for the
smaller mini-halos to be brighter must be considered prudently. In any
case, the possible selection effect mentioned above seems not to
influence the result that mini-halos have systematically lower values of
re than halos. Mini-halos appear effectively smaller than halos and
this could reflect the higher density of the intergalactic gas in
the central regions of cooling clusters.
For a better comparison between halos and mini-halos in terms of emissivity, in Fig. 5 (bottom panel) we show the distribution of the radio emissivity (calculated by using Eq. (9)) both for halos (in blue) and mini-halos (in red). We find that radio halos have a surprisingly narrow radio emissivity distribution around an average value of about 10-42 erg s-1 cm-3 Hz-1. In contrast, mini-halos span a wide range of radio emissivity. Some of them, like the Perseus mini-halo, would be characterized by a radio emissivity more than 100 times larger than that of a typical halo, quite in agreement with the recent finding by Cassano et al. (2008). We note, however, that the three new mini-halos analyzed in this work are all characterized by brightness and size very similar to that of the smaller halos and thus their radio emissivity is comparable to that of halos in general.
As a further check, we also examined the trend of the radio power
(calculated from the flux density in Eq. (6)) versus the
e-folding radius of mini-halo and halos, see Fig. 6. This
plot is similar to that presented in Cassano et al. (2008) except that
they calculated the radius as
![]() ,
,
![]() and
and ![]() being the minimum and the maximum radius
measured using the 3
being the minimum and the maximum radius
measured using the 3![]() radio isophotes. As pointed out by Cassano
et al. (2007), the powerful radio halos are the more extended sources
while the fainter ones are smaller in size. Figure 6 shows
indeed a tight correlation between the radio power and the e-folding
radius of radio halos. We find that the radio power increases as
radio isophotes. As pointed out by Cassano
et al. (2007), the powerful radio halos are the more extended sources
while the fainter ones are smaller in size. Figure 6 shows
indeed a tight correlation between the radio power and the e-folding
radius of radio halos. We find that the radio power increases as
![]() .
In our analysis, the slope of the
correlation is in agreement with the finding that the radio emissivity
has a very small scatter among radio halos. In fact, the radio power
scales as
.
In our analysis, the slope of the
correlation is in agreement with the finding that the radio emissivity
has a very small scatter among radio halos. In fact, the radio power
scales as
![]() ,
where V is the source volume and Jis the radio emissivity. If we assume that the emissivity does not
change from one halo to the other it follows that
,
where V is the source volume and Jis the radio emissivity. If we assume that the emissivity does not
change from one halo to the other it follows that
![]() .
The dotted reference line in Fig. 6 represents
the expected radio power if we assume for the emissivity the average
value we found for radio halos
.
The dotted reference line in Fig. 6 represents
the expected radio power if we assume for the emissivity the average
value we found for radio halos
![]() erg
s-1 cm-3 Hz-1 and for the volume V the volume of a
sphere a radius 3re:
erg
s-1 cm-3 Hz-1 and for the volume V the volume of a
sphere a radius 3re:
![]() .
.
We note that Cassano et al. (2008) found also a correlation between the power and the size of mini-halos. In fact, the three mini-halos we have in common (A2390, RXCJ1347, and Perseus) all seem to be aligned in a similar but offset correlation with respect to radio halos. However, with the addition of the new objects found in Paper I and analyzed here, we cannot define any clear correlation for the mini-halos, in agreement with the large spread in emissivity shown in Fig. 5. The mini-halos in A1835, Ophiuchus, and A2029 appear clearly separated from the other mini-halos although this separation into two distinct groups is likely just due to the small-number statistics.
![\begin{figure}
\par\includegraphics[width=16cm,clip]{1659fg8.eps}\end{figure}](/articles/aa/full_html/2009/21/aa11659-09/img157.png) |
Figure 8: Synthetic image ( left panel) and fit profile ( right panel) drawn from the Monte Carlo simulation of the Ophiuchus mini-halo. |
| Open with DEXTER | |
![\begin{figure}
\par\includegraphics[width=16cm,clip]{1659fg9.eps}\end{figure}](/articles/aa/full_html/2009/21/aa11659-09/img158.png) |
Figure 9: Monte Carlo simulations for the six mini-halos analyzed in this work, see text for further details. |
| Open with DEXTER | |
![\begin{figure}
\par\includegraphics[width=16cm,clip]{1659fg10.eps}\end{figure}](/articles/aa/full_html/2009/21/aa11659-09/img159.png) |
Figure 10:
Comparison of the exponential (solid line) and equipartition models (dashed lines) with
|
| Open with DEXTER | |
As a final remark, we stress once again that our analysis should be relatively independent of the noise level of the radio images. To ensure that our approach is not dependent on the sensitivity of the radio observation we retrieved for A2744 (one of the clusters analyzed here) the NVSS image. We derived the azimuthally averaged brightness profile as computed for the deeper observations (same rings and mask), and we then fit the NVSS profile with an exponential law. The resulting fit is shown in the left panel of Fig. 7. The contours of the NVSS image are shown on the top right panel of Fig. 7 in comparison with the contours of the deeper VLA images on the bottom right panel. As expected, the radius as derived from the contour levels yields very different values in images with different sensitivities. One should consider that the same effect may appear in images with comparable sensitivity of objects characterized by the same intrinsic size but different brightness. Fainter halos (or mini-halos) tend to ``sink'' into the noise appearing smaller than they really are. On the other hand, in comparing the fitting results of the NVSS profiles in Fig. 7 with the fitting results of the deeper images in Table 3, we find the results to be in good agreement. Therefore we are confident that the method discussed here, based on the determination of length-scale and central brightness in extended structures, is less subject to the S/N ratio of the radio images and thus better suited for comparative studies of the general properties of diffuse halo-like sources.
4 Monte Carlo statistical analysis of the fitting procedure
The fit of the exponential model described in Sect. 2 could be critical
in the case of those mini-halos in which the e-folding radius is
smaller than the FWHM of the central point source. The mini-halos in
A1835, A2029, RXCJ1347, and A2390 are all in this category. However,
it should be noted that not only the observing resolution but also the
brightness of the mini-halo is crucial for the determination of the
e-folding radius. If the mini-halo is bright enough, the exponential
profile will emerge from the central point source and it will be
observable out to a large distance from the cluster center, making the
fit of the e-folding radius re possible. The example of A2029 is
representative of this situation. The e-folding radius derived from
the fit,
![]() ,
is below the FWHM beam of the
observation which is 53
,
is below the FWHM beam of the
observation which is 53
![]() .
Nevertheless, the relative intensity
of the mini-halo with respect to the noise permits the fit of the
exponential model from the external part of the mini-halo profile that
does not overlap with the central point source. The limiting cases of
A1835 and RXC J1347 (the two more distant mini-halos in our sample) are
more critical and the behaviour of the fitting procedure must be
carefully checked.
.
Nevertheless, the relative intensity
of the mini-halo with respect to the noise permits the fit of the
exponential model from the external part of the mini-halo profile that
does not overlap with the central point source. The limiting cases of
A1835 and RXC J1347 (the two more distant mini-halos in our sample) are
more critical and the behaviour of the fitting procedure must be
carefully checked.
In order to assess the reliability of the best fit parameters, we
created a set of Monte Carlo simulations with the aid of the
Cybersar-OAC computer cluster. For each mini-halo we varied the values
of I0 and re in a regular grid that contained the best fit
parameters reported in Table 2 and 3. For each
pair of I0 and re values, we created a synthetic image with
the same field of view, pixel size, FWHM beam, noise level, and masked
regions as that observed. A central point source with the same
intensity as the observed one is added to the exponential model. An
example of such image, drawn from the Monte Carlo simulation of the
Ophiuchus mini-halo, is presented in left panel of
Fig. 8. We then feed the synthetic image into the fit
procedure and check for any systematic difference between the input
and the output values of I0 and re. In the right panel of
Fig. 8 we show the fit obtained from the synthetic
image on the left. We can see that in the case of the Ophiuchus
mini-halo, which is particularly extended, the difference between
input and the output values of I0 and re is fully consistent
with the uncertainties reported in Table 2. In Fig. 9
we present the result of the Monte Carlo simulations for all six
mini-halos analyzed in this work. For each mini-halo we plot the grid
of the input values of I0 and re (crosses) with the relative
arrows representing the displacement of the output parameters from the
fit procedure. The dashed line represents the detection limit for
each mini-halo and has been traced with the same criterion as in top
panel of Fig. 5. Here the exact values for the FWHM beam and
noise level of the specific observations have been used. In each
panel, the dot indicates the values of the actual best fit parameters
with their uncertainties. Clearly, for bright and extended
mini-halos, the fit procedure is able to recover the original
parameters with high precisions. Obviously, near the detection limit
the situation can be much worse and large systematic effects are
observed. However, we note that the fit procedure is able to recover
the input e-folding even if it is significantly smaller then the FWHM
beam, provided that the value of I0 is sufficiently high (see
e.g. the case of A2390 with
![]() and I0 >10
and I0 >10![]() Jy/beam).
Jy/beam).
In summary, the results of the Monte Carlo simulation tell us that the fit procedure is able to constraint the model parameters with accuracy and without systematic effects in the cases of Ophiuchus, Perseus, A2029, and A2390. The mini-halos in A1835 and RXCJ1347 are very close to the detection limit and the best fit parameters could be affected by a systematic bias. In particular, they could be smaller and brighter than what is inferred by the fit to the exponential model, although the bias appears to be comparable to the reported uncertainties.
![\begin{figure}
\par\includegraphics[width=9cm,clip]{1659fg11.ps}\end{figure}](/articles/aa/full_html/2009/21/aa11659-09/img162.png) |
Figure 11: Abell 2744. Comparison of the exponential (solid line) and re-acceleration model (dashed line). |
| Open with DEXTER | |
5 Discussion
The exponential model fitting method provides an estimate of the brightness and size of the diffuse, halo-like, radio emission in cluster of galaxies using a minimal set of free parameters. In this section we discuss the exponential profile in comparison with alternative models which may have a much clearer physical meaning, but require the introduction of a number of additional assumptions and/or free parameters.
One main difficulty in the study of the non-thermal radio halos and mini-halos in clusters of galaxies is that the synchrotron emissivity essentially traces the product of electron and magnetic field energy densities so disentangling the two contributions is not easy. Another source of uncertainty is related to the effective shape of the energy spectrum of the relativistic electrons across the cluster which is poorly known. Given their comparatively short radiative life-times, the synchrotron electrons cannot diffuse into the large volume of space involved but rather they must be either continuously injected and/or re-accelerated in situ throughout the intra-cluster medium (e.g., Dennison 1980; Jaffe 1977; Dolag & Ensslin 2000; Brunetti et. al 2001). The spectral energy distributions for the cosmic ray electrons predicted by these models can be quite different, however from the current data we are not able to discriminate between the two processes definitively. Our intent here, is to highlight the role of the magnetic field in determining the radial profile of the radio emission. For illustrative purposes, in the following we discuss simplified models for the distribution of particles and magnetic fields in clusters that are often discussed in literature and we compare them with the exponential profile.
5.1 Injection models
We can compare a continuous injection of cosmic ray electrons in the
intra-cluster medium with a power law distribution in the energy range from
![]() to
to
![]() (
(
![]() ). In the stationary case, and for an
emission spectrum with index
). In the stationary case, and for an
emission spectrum with index ![]() ,
from standard synchrotron formulas (Rybicki & Lightman 1979) we obtain for
the radio emissivity:
,
from standard synchrotron formulas (Rybicki & Lightman 1979) we obtain for
the radio emissivity:
where
The energy density of the cosmic ray electrons can be calculated as
In the case of a perfect equipartition between the energy densities of particles and fields (
The synchrotron emissivity is indeed very close to the observed value of
The equipartition magnetic field strength quoted above should be regarded as volume averages. However, there are observational and theoretical arguments to support the idea that inside a cluster the magnetic field strength scales as a function of the thermal gas density,
![]() ,
so:
,
so:
![\begin{displaymath}B(R)=B_0 \left[\frac{n_{\rm th}(R)}{n_{\rm th}(0)}\right ]^{\eta}
\end{displaymath}](/articles/aa/full_html/2009/21/aa11659-09/img176.png)
where the index
If the density profile of the thermal gas is described by the standard ![]() -model (Cavaliere & Fusco-Femiano 1976), from Eq. (12) we have
-model (Cavaliere & Fusco-Femiano 1976), from Eq. (12) we have
where

where r is the projected distance from the cluster center. It is worthwhile to note that the ratio between the radio and X-ray brightness is proportional to
where T is the gas temperature. Thus, if
We now reconsider the radio halos in A2744 and A665, for which an average spectral index
![]() has been determined from
VLA radio images at 327 MHz and 1.4 GHz by Orrù et al. (2007) and Feretti et al. (2004), respectively.
In the top panels of Fig. 10, we trace the equipartition model profiles by converting to our cosmology the
has been determined from
VLA radio images at 327 MHz and 1.4 GHz by Orrù et al. (2007) and Feretti et al. (2004), respectively.
In the top panels of Fig. 10, we trace the equipartition model profiles by converting to our cosmology the ![]() -model
parameters reported by Kempner & David (2004) and Birkinshaw et al. (1991) for A2744 (
-model
parameters reported by Kempner & David (2004) and Birkinshaw et al. (1991) for A2744 (
![]() kpc and
kpc and
![]() )
and
A665 (
)
and
A665 (
![]() kpc and
kpc and
![]() ), respectively. The equipartition model is very sensitive to the radial profile of the
magnetic field strength. In order to show this behaviour, we fix I0 in Eq. (15) and choose three particular values for
), respectively. The equipartition model is very sensitive to the radial profile of the
magnetic field strength. In order to show this behaviour, we fix I0 in Eq. (15) and choose three particular values for ![]() .
A
constant field,
.
A
constant field, ![]() ,
results in a profile which is too flat with respect to the data while
a magnetic field whose strength decreases with the distance as the gas density,
,
results in a profile which is too flat with respect to the data while
a magnetic field whose strength decreases with the distance as the gas density, ![]() ,
results in
a profile which is too steep. A very good agreement with the data is found for
,
results in
a profile which is too steep. A very good agreement with the data is found for
![]() for both radio halos,
implying a magnetic fields whose energy density is proportional to that of the thermal gas. Indeed, in A2744 a linear correlation
between the radio and X-ray surface brightness has been observed (Govoni et al. 2001b). Moreover, a comparison of the equipartition model with
for both radio halos,
implying a magnetic fields whose energy density is proportional to that of the thermal gas. Indeed, in A2744 a linear correlation
between the radio and X-ray surface brightness has been observed (Govoni et al. 2001b). Moreover, a comparison of the equipartition model with ![]() and the exponential fit shows that
the two profiles are strikingly similar within one megaparsec from the cluster center. The differences between the two profiles
become appreciable only at much larger distances, where the radio halo emission has fallen below the noise level.
and the exponential fit shows that
the two profiles are strikingly similar within one megaparsec from the cluster center. The differences between the two profiles
become appreciable only at much larger distances, where the radio halo emission has fallen below the noise level.
In the bottom panels of Fig. 10 we show the exponential and equipartition profiles for the mini-halos in the Ophiuchus and
Perseus clusters. We adopt a core radius of
![]() kpc and
kpc and
![]() for Ophiuchus, and
for Ophiuchus, and
![]() kpc and
kpc and
![]() for
Perseus (Chen et al. 2007). We note that the equipartition profile in
Eq. (15) should be considered only outside the cool core
where the
for
Perseus (Chen et al. 2007). We note that the equipartition profile in
Eq. (15) should be considered only outside the cool core
where the ![]() -model still provides a reasonable description of
the gas density. Moreover, Ophiuchus lacks any spectral index
information while the mini-halo in Perseus has an average spectral
index which is slightly steeper than what we have assumed here
(
-model still provides a reasonable description of
the gas density. Moreover, Ophiuchus lacks any spectral index
information while the mini-halo in Perseus has an average spectral
index which is slightly steeper than what we have assumed here
(
![]() ,
Gitti et al. 2004). Apart from these caveats,
however, the exponential and the equipartition profiles are
remarkably similar in both mini-halos. As found for the radio halos
in A2744 and A665, the mini-halo in Ophiuchus is well described by an
equipartition model with
,
Gitti et al. 2004). Apart from these caveats,
however, the exponential and the equipartition profiles are
remarkably similar in both mini-halos. As found for the radio halos
in A2744 and A665, the mini-halo in Ophiuchus is well described by an
equipartition model with
![]() .
In the case of the
Perseus mini-halo, however, we found
.
In the case of the
Perseus mini-halo, however, we found
![]() ,
which implies
a particularly steep magnetic field radial profile (this result does
not change significantly by assuming
,
which implies
a particularly steep magnetic field radial profile (this result does
not change significantly by assuming
![]() instead of
instead of
![]() ). Indeed, Burns et al. (1992) suggested that the absence
of a cluster-wide magnetic field inhibits a large scale halo in
Perseus.
). Indeed, Burns et al. (1992) suggested that the absence
of a cluster-wide magnetic field inhibits a large scale halo in
Perseus.
We conclude that the exponential profile is very close to the expectations of a simple equipartition model if the magnetic field energy density roughly scales as the thermal gas density. In the framework of the equipartition model, the physical meaning of the 3re length-scale obtained by the exponential fit is that it marks the point at which the magnetic field strength is decreased to about half the value at the cluster center (see bottom panel of Fig. 10). Hence, mini-halos would appear smaller because the magnetic field falls off more rapidly with radius.
It is worthwhile to note that if
![]() and
and
![]() (as for A2744, A665 and Ophiuchus), the equipartition condition
implies that the injection rate should scale roughly as the thermal
gas density
(as for A2744, A665 and Ophiuchus), the equipartition condition
implies that the injection rate should scale roughly as the thermal
gas density
![]() .
In models that consider a
continuous production of secondary electrons by hadronic collisions
in the intra-cluster medium (Dennison 1980), the injection rate of
cosmic ray electrons is proportional to the product of the densities
of the gas and cosmic ray protons,
.
In models that consider a
continuous production of secondary electrons by hadronic collisions
in the intra-cluster medium (Dennison 1980), the injection rate of
cosmic ray electrons is proportional to the product of the densities
of the gas and cosmic ray protons,
![]() .
Usually, it is assumed that
.
Usually, it is assumed that
![]() and as
a results
and as
a results
![]() .
As a consequence secondary
models predict brightness profiles that are generally too steep to
explain observed trends in radio halos. However, the radio brightness
profiles in the Perseus mini-halo is steeper and it can be described
by secondary models as well (Pfrommer & Ensslin 2004).
.
As a consequence secondary
models predict brightness profiles that are generally too steep to
explain observed trends in radio halos. However, the radio brightness
profiles in the Perseus mini-halo is steeper and it can be described
by secondary models as well (Pfrommer & Ensslin 2004).
5.2 Re-acceleration models
The observed radio profiles may be also described in the framework of the re-acceleration scenario (e.g. Gitti et al. 2004). An over-simplified re-acceleration model may be considered in which the relativistic electrons energy spectrum is essentially peaked at a characteristic energy,
where
The emission spectrum will extend up to a maximum frequency of
![]() GHz,
beyond which it cuts off exponentially. The synchrotron emissivity in cgs units is:
GHz,
beyond which it cuts off exponentially. The synchrotron emissivity in cgs units is:
where
In order to reproduce a spectral index
![]() between 325 MHz and 1.4 GHz,
it should be
between 325 MHz and 1.4 GHz,
it should be
![]() GHz. At a frequency of
GHz. At a frequency of ![]() GHz and at z=0.18, the average redshift of the
sources in our sample, we can calculate
GHz and at z=0.18, the average redshift of the
sources in our sample, we can calculate
![]() (a steeper spectrum with
(a steeper spectrum with
![]() would
imply
would
imply
![]() GHz and
GHz and
![]() )
.
)
.
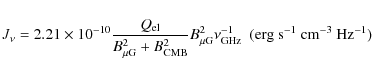
In the case of a perfect equipartition between the energy densities of particles and fields,
![]() ,
we find that the radio source is near the minimum energy condition
and the radio emissivity at 1.4 GHz is:
,
we find that the radio source is near the minimum energy condition
and the radio emissivity at 1.4 GHz is:

The observed synchrotron emissivity in the case of radio halos,
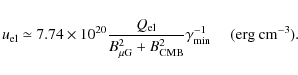
A general result from Eq. (17) is that there exists a critical value for the magnetic field strength that minimize the acceleration efficiency
![]() needed
to radiate at a given
needed
to radiate at a given
![]() ,
described by
,
described by
![]() .
In the particular case of the average redshift of halos in our sample, the field that minimizes the re-acceleration efficiency results in
.
In the particular case of the average redshift of halos in our sample, the field that minimizes the re-acceleration efficiency results in
![]()
![]() G. Given this value for the
magnetic field, from Eq. 18 it follows that the required energy supply to the re-acceleration process is
G. Given this value for the
magnetic field, from Eq. 18 it follows that the required energy supply to the re-acceleration process is
![]() erg s-1 cm-3, i.e. significantly less than in the equipartition case above. However, the energy density of cosmic ray electrons,
erg s-1 cm-3, i.e. significantly less than in the equipartition case above. However, the energy density of cosmic ray electrons,
![]() erg cm-3, is much lower than that of the field,
erg cm-3, is much lower than that of the field,
![]() erg cm-3, and thus the radio source cannot be in a condition of minimum energy.
erg cm-3, and thus the radio source cannot be in a condition of minimum energy.
In Fig. 11 we show the comparison of the re-acceleration model versus the exponential fit for the radio halo in A2744. The average spectral index of this radio halo
is fairly constant with
![]() (Orrù et al. 2007) which justifies the use of the same
(Orrù et al. 2007) which justifies the use of the same
![]() at different distances from the cluster centre.
By assuming that
at different distances from the cluster centre.
By assuming that
![]() ,
from Eq. (19) it follows that the radio brightness profiles is:
,
from Eq. (19) it follows that the radio brightness profiles is:
If the equipartition energy condition
6 Conclusions
Mini-halos in clusters are still poorly understood sources. They are a rare phenomenon, having been found so far only in few clusters. A larger number of mini-halos and better information on their physical properties will be necessary in order to discriminate between the different mechanisms suggested for transferring energy to the relativistic electrons that power the radio emission.
We recently found that at the center of the clusters A1835, A2029, and
Ophiuchus, the dominant radio galaxy is surrounded by a diffuse low
surface brightness mini-halo. We have studied the morphological and
physical properties (i.e. length-scale, central brightness,
emissivity) of these mini-halos by fitting their azimuthally averaged
radio brightness profile with an exponential. The method proposed
here to derive the length-scale of halos and mini-halos seems
promising because it is relatively independent of the sensitivity of
the radio observations. The exponential model is attractive in its
simplicity and involves a minimal set of free parameters. While it
cannot account for any local deviations from circular symmetry of the
diffuse emission, this empirical method does provide a rough estimate
of brightness and size of these sources. We compare the surface
brightness profiles of the new mini-halos discovered in Paper I with
data already available in the literature, both for mini-halos and
halos. We find that the radio halos can have quite different
length-scales but their emissivity is remarkably similar from one halo
to another. This result could have important implications for theories
of the origin of radio halos in clusters of galaxies but awaits
confirmation from future, more sensitive, observations. In fact, if
many faint halos have been missed by the current surveys, the average
radio emissivity we found at 1.4 GHz,
![]() erg s-1 cm-3 Hz-1, should be considered an
upper limit. In contrast, mini-halos span a wide range of radio
emissivity. Some of them, like the Perseus mini-halos, are
characterized by a radio emissivity which is more than 100 times
greater than that of radio halos. On the other hand, the new
mini-halos in cooling core clusters analyzed here, namely A2029,
Ophiuchus, and A1835, have a radio emissivity which is much more
typical of halos in merging clusters rather than to the mini-halos
previously known.
erg s-1 cm-3 Hz-1, should be considered an
upper limit. In contrast, mini-halos span a wide range of radio
emissivity. Some of them, like the Perseus mini-halos, are
characterized by a radio emissivity which is more than 100 times
greater than that of radio halos. On the other hand, the new
mini-halos in cooling core clusters analyzed here, namely A2029,
Ophiuchus, and A1835, have a radio emissivity which is much more
typical of halos in merging clusters rather than to the mini-halos
previously known.
We discussed the exponential fit in comparison with the current theoretical models for the distributions of synchrotron electrons and magnetic fields in cluster of galaxies. We find that the exponential profile is very close to the expectations of these models if the magnetic field energy density roughly scales as the thermal gas density. In the framework of the equipartition model, the physical meaning of the 3re length-scale obtained by the exponential fit is that it marks the point at which the magnetic field strength is decreased to about half the value at the cluster center. Mini-halos would appear smaller because the magnetic field falls off more rapidly with radius in cooling core clusters, in agreement with the suggestions of Burns et al. (1992).
Can we explain the larger dispersion in the emissivity of the mini-halos? We have very bright mini-halos, like Perseus, which host a particularly bright compact radio source at their center. For these, we cannot rule out that part of the mini-halo radio emission is related to properties of the local intergalactic medium and part is correlated with the AGN activity of the central brightest galaxy, as suggested by the faint correlation, discussed in Paper I, between the mini-halo and cD radio power. Indeed, the higher emissivity found in some mini-halos could be due to an extra-amount of energy supply from the strong AGN.
On the other hand, we also observe low-surface brightness mini-halos, like Ophiuchus, which host a faint AGN at their center. These mini-halos appear to be scaled down versions of the larger halos and they could be powered by similar merging processes. We note that, although cooling core clusters are generally considered relaxed system, when analyzed in detail they sometimes reveal peculiar X-ray features in the cluster center which may indicate a possible link between the mini-halo emission and some minor merger activity. Indeed, Burns et al. (2008) simulated the formation of both cool core and non-cool core clusters in the same numerical volume. These simulations confirmed that non-cool clusters are formed via major mergers early in their history which destroyed the cool cores and left significant residual kinetic energy in the gas which might be used to power the radio halos. In contrast, cool core clusters do not suffer any major mergers, thus preserving the central cool regions. However, the cool core clusters do experience regular smaller mergers which still inject energy in the intra-cluster medium, but more modestly than in the non-cool core clusters. These minor mergers might power the mini-halos.
Acknowledgements
We are grateful to an anonymous referee for very useful comments that improved the paper. This work is part of the ``Cybersar'' Project, which is managed by the COSMOLAB Regional Consortium with the financial support of the Italian Ministry of University and Research (MUR), in the context of the ``Piano Operativo Nazionale Ricerca Scientifica, Sviluppo Tecnologico, Alta Formazione (PON 2000-2006)''. F.G. and M.M. thank the hospitality of the Harvard-Smithsonian Center for Astrophysics where most of this research was done. Support was provided by Chandra grants GO5-6123X and GO6-7126X, NASA contract NAS8-39073, and the Smithsonian Institution. This research was partially supported by ASI-INAF I/088/06/0 - High Energy Astrophysics and PRIN-INAF2005. We wish to thank Pasquale Mazzotta for his valuable comments on the original draft. We are also grateful to Rossella Cassano and Chiara Ferrari for very useful discussions. The National Radio Astronomy Observatory (NRAO) is a facility of the National Science Foundation, operated under cooperative agreement by Associated Universities, Inc. This research has made use of the NASA/IPAC Extragalactic Data Base (NED) which is operated by the JPL, California Institute of Technology, under contract with the National Aeronautics and Space Administration.
References
- Bacchi, M., Feretti, L., Giovannini, G., & Govoni, F. 2003, A&A, 400, 465 [NASA ADS] [CrossRef] [EDP Sciences] (In the text)
- Birkinshaw, M., Hughes, J. P., & Arnaud, K. A. 1991, ApJ, 379, 466 [NASA ADS] [CrossRef] (In the text)
- Battaglia, N., Pfrommer, C., Sievers, J. L., Bond, J. R., & Enßlin, T. A. 2009, MNRAS, 393, 1073 [NASA ADS] [CrossRef] (In the text)
- Brunetti, G., Setti, G., Feretti, L., & Giovannini, G. 2001, MNRAS, 320, 365 [NASA ADS] [CrossRef] (In the text)
- Buote, D. A. 2001, ApJ, 553, L15 [NASA ADS] [CrossRef] (In the text)
- Burns, J. O., Sulkanen, M. E., Gisler, G. R., & Perley, R. A. 1992, ApJ, 388, L49 [NASA ADS] [CrossRef] (In the text)
- Burns, J. O., Hallman, E. J., Gantner, B., et al. 2008, ApJ, 675, 1125 [NASA ADS] [CrossRef] (In the text)
- Cassano, R., Brunetti, G., Setti, G., et al. 2007, MNRAS, 378, 1565 [NASA ADS] [CrossRef] (In the text)
- Cassano, R., Gitti, M., & Brunetti, G. 2008, A&A, 486, L31 [NASA ADS] [CrossRef] [EDP Sciences] (In the text)
- Cavaliere, A., & Fusco-Femiano, R. 1976, A&A, 49, 137 [NASA ADS] (In the text)
- Chen, Y., Reiprich, T. H., Böhringer, H., et al. 2007, A&A, 466, 805 [NASA ADS] [CrossRef] [EDP Sciences] (In the text)
- Condon, J. J., Cotton, W. D., Greisen, E. W., et al., 1998, AJ, 115, 1693 [NASA ADS] [CrossRef] (In the text)
- Dolag, K., & Enßlin, T. A. 2000, A&A, 362, 151 [NASA ADS] (In the text)
- Dolag, K., Schindler, S., Govoni, F., & Feretti, L. 2001, A&A, 378, 777 [NASA ADS] [CrossRef] [EDP Sciences] (In the text)
- Dolag, K., Bartelmann, M., &Bottom Lesch, H. 2002, A&A, 387, 383 [NASA ADS] [CrossRef] [EDP Sciences] (In the text)
- Dunn, R. H., Fabian, A. C., & Taylor, G. B. 2005, MNRAS, 364, 1343 [NASA ADS] [CrossRef]
- Feretti, L., & Giovannini, G. 2008, A Pan-Chromatic View of Clusters of Galaxies and the Large-Scale Structure, Lect. Notes Phys., 740, 143 (In the text)
- Feretti, L., Giovannini, G., & Böhringer, H. 1997, New Astron., 2, 501 [NASA ADS] [CrossRef] (In the text)
- Feretti, L., Fusco-Femiano, R., Giovannini, G., & Govoni, F. 2001, A&A, 373, 106 [NASA ADS] [CrossRef] [EDP Sciences] (In the text)
- Bottom Feretti, L., Orrù, E., Brunetti, et al. 2004, A&A, 423, 111 [NASA ADS] [CrossRef] [EDP Sciences] (In the text)
- Feretti, L., Schuecker, P., Böhringer, H., Govoni, F., & Giovannini, G. 2005, A&A, 444, 157 [NASA ADS] [CrossRef] [EDP Sciences] (In the text)
- Ferrari, C., Govoni, F., Schindler, S., et al. 2008, Space Sci. Rev., 134, 93 [NASA ADS] [CrossRef] (In the text)
- Giovannini, G., Tordi, M., & Feretti, L. 1999, New Astron., 4, 141 [NASA ADS] [CrossRef] (In the text)
- Giovannini, G., & Feretti, L. 2000, New Astron., 5, 335 [NASA ADS] [CrossRef] (In the text)
- Gitti, M., Brunetti, G., Feretti, L., & Setti, G. 2004, A&A, 417, 1 [NASA ADS] [CrossRef] [EDP Sciences] (In the text)
- Gitti, M., Ferrari, C., Domainko, W., et al. 2007, A&A, 470, L25 [NASA ADS] [CrossRef] [EDP Sciences] (In the text)
- Govoni, F., Feretti, L., Giovannini, G., et al. 2001a, A&A, 376, 803 [NASA ADS] [CrossRef] [EDP Sciences] (In the text)
- Govoni, F., Enßlin, T. A., Feretti, L., & Giovannini, G. 2001b, A&A, 369, 441 [NASA ADS] [CrossRef] [EDP Sciences] (In the text)
- Govoni, F., Markevitch, M., Vikhlinin, A., et al. 2004, ApJ, 605, 695 [NASA ADS] [CrossRef] (In the text)
- Govoni, F., Murgia, M., Feretti, L., et al. 2005, A&A, 430, L5 [NASA ADS] [CrossRef] [EDP Sciences] (In the text)
- Govoni, F., Murgia, M., Feretti, L., et al. 2006, A&A, 460, 425 [NASA ADS] [CrossRef] [EDP Sciences]
- Govoni, F., Murgia M., Markevitch, M., et al. 2009, A&A, 499, 371 [NASA ADS] [CrossRef] [EDP Sciences] (In the text)
- Guidetti, D., Murgia, M., Govoni, et al. 2008, A&A, 483, 699 [NASA ADS] [CrossRef] [EDP Sciences] (In the text)
- Kempner, J. C., & Sarazin, C. L. 2001, ApJ, 548, 639 [NASA ADS] [CrossRef] (In the text)
- Kempner, J. C., & David, L. P. 2004, MNRAS, 349, 385 [NASA ADS] [CrossRef] (In the text)
- Murgia, M., Govoni, F., Feretti, L., et al. 2004, A&A, 424, 429 [NASA ADS] [CrossRef] [EDP Sciences] (In the text)
- Orrù, E., Murgia, M., Feretti, L., et al. 2007, A&A, 467, 943 [NASA ADS] [CrossRef] [EDP Sciences] (In the text)
- Pedlar, A., Ghataure, H. S., Davies, R. D., et al. 1990, MNRAS, 246, 477 [NASA ADS] (In the text)
- Petrosian, V. 2001, ApJ, 557, 560 [NASA ADS] [CrossRef] (In the text)
- Pfrommer, C., & Enßlin, T. A. 2004, A&A, 426, 777 [NASA ADS] [CrossRef] [EDP Sciences] (In the text)
- Rengelink, R. B., Tang, Y., de Bruyn, A. G., et al. 1997, A&AS, 124, 259 [NASA ADS] [CrossRef] [EDP Sciences] (In the text)
- Rybicki, G. B., & Lightman, A. P. 1979, Radiative processes in astrophysics (New York: Wiley-Interscience) (In the text)
- Venturi, T., Giacintucci, S., Brunetti, G., et al. 2007, A&A, 463, 937 [NASA ADS] [CrossRef] [EDP Sciences] (In the text)
- Venturi, T., Giacintucci, S., Dallacasa, D., et al. 2008, A&A, 484, 327 [NASA ADS] [CrossRef] [EDP Sciences] (In the text)
Footnotes
- ...
![[*]](/icons/foot_motif.png)
- G.B. Taylor is also an Adjunct Astronomer at the National Radio Astronomy Observatory
- ...
steep-spectrum
- We use the convention
 .
.
- ... noise
- In this paper, we define
 as the distance from the cluster center at which the
azimuthally averaged brightness profile of the diffuse emission
reaches the
as the distance from the cluster center at which the
azimuthally averaged brightness profile of the diffuse emission
reaches the  noise level of the radio image.
- ... emissivity
- However, we cannot
exclude the possibility that large halos with faint surface
brightness (I0<0.5
 Jy/arcsec2) could have been missed
by the current searches at 1.4 GHz such that we are just seeing the
``tip of the iceberg''. As an example, the
sensitivity
level of the NVSS is indicated by the dot-dashed line in the top
panel of Fig. 5.
Jy/arcsec2) could have been missed
by the current searches at 1.4 GHz such that we are just seeing the
``tip of the iceberg''. As an example, the
sensitivity
level of the NVSS is indicated by the dot-dashed line in the top
panel of Fig. 5.
All Tables
Table 1: The mini-halos analyzed in this work and the basic properties of the radio images at 1.4 GHz.
Table 2: Radio properties of the mini halos derived from the fit procedure.
Table 3: Radio information of halos and mini halos taken from the literature and reanalyzed in this work with the exponential model fit.
All Figures
| |
Figure 1:
The azimuthally averaged brightness profiles of the radio emission
in A1835 ( top), A2029 ( middle), and Ophiuchus ( bottom).
The profiles have been calculated in concentric annuli,
as shown in the left panels.
All the discrete sources (except the central source)
have been masked.
For each cluster the horizontal dashed-dotted line indicates the 3 |
| Open with DEXTER | |
| In the text | |
| |
Figure 2:
Azimuthally averaged brightness profiles of the radio halos in A2744
(Govoni et al. 2001a), A665 (Giovannini & Feretti 2000), A2219
(Bacchi et al. 2003), A2255 (Govoni et al. 2005), A773 (Govoni et al. 2001a), A545 (Bacchi et al. 2003). The profiles have been
calculated in concentric annuli, as shown in the inset panels. All
the discrete sources have been masked. For each cluster the
horizontal dashed-dotted line indicates the 3 |
| Open with DEXTER | |
| In the text | |
| |
Figure 3:
Azimuthally averaged brightness profiles of the radio
halos in A2319 (Feretti et al. 1997), A2218 (Giovannini & Feretti 2000), A2163 (Feretti et al. 2001),
A401 (Bacchi et al. 2003), A2254 (Govoni et al. 2001a), RXCJ1314.4-2515 (Feretti et al. 2005).
The profiles have been calculated in concentric annuli,
as shown in the inset panels.
All the discrete sources have been masked.
For each cluster the horizontal dashed-dotted line indicates the 3 |
| Open with DEXTER | |
| In the text | |
| |
Figure 4:
Azimuthally averaged brightness profiles of the mini-halos
in RXJ1347.5-1145, A2390, and Perseus, previously
imaged in the literature (Gitti et al. 2007; Bacchi et al. 2003;
Pedlar et al. 1990).
The profiles have been calculated in concentric annuli,
as shown in the inset panels.
All the discrete sources (except the central one)
have been masked.
For each cluster the horizontal dashed-dotted line indicates the 3 |
| Open with DEXTER | |
| In the text | |
| |
Figure 5:
Top: best fit central brightness I0 ( |
| Open with DEXTER | |
| In the text | |
| |
Figure 6:
Radio power at 1.4 GHz versus e-folding radius in kilosparsecs for mini-halos (red dots) and halos (blue triangles).
The dotted reference line represents
the expected radio power if we assume for the emissivity the average value we found for radio halos
|
| Open with DEXTER | |
| In the text | |
| |
Figure 7:
Left: fit of the azimuthally averaged brightness profiles
calculated from the NVSS image of the cluster A2744.
Right: contours of the NVSS image in comparison with the
contours of the deeper VLA image for A2744 (Govoni et al. 2001a).
In both images the first contour is drawn at 3 |
| Open with DEXTER | |
| In the text | |
| |
Figure 8: Synthetic image ( left panel) and fit profile ( right panel) drawn from the Monte Carlo simulation of the Ophiuchus mini-halo. |
| Open with DEXTER | |
| In the text | |
| |
Figure 9: Monte Carlo simulations for the six mini-halos analyzed in this work, see text for further details. |
| Open with DEXTER | |
| In the text | |
| |
Figure 10:
Comparison of the exponential (solid line) and equipartition models (dashed lines) with
|
| Open with DEXTER | |
| In the text | |
| |
Figure 11: Abell 2744. Comparison of the exponential (solid line) and re-acceleration model (dashed line). |
| Open with DEXTER | |
| In the text | |
Copyright ESO 2009
Current usage metrics show cumulative count of Article Views (full-text article views including HTML views, PDF and ePub downloads, according to the available data) and Abstracts Views on Vision4Press platform.
Data correspond to usage on the plateform after 2015. The current usage metrics is available 48-96 hours after online publication and is updated daily on week days.
Initial download of the metrics may take a while.