| Issue |
A&A
Volume 499, Number 1, May III 2009
|
|
|---|---|---|
| Page(s) | 279 - 290 | |
| Section | Stellar structure and evolution | |
| DOI | https://doi.org/10.1051/0004-6361/200911643 | |
| Published online | 12 March 2009 | |
Sub-surface convection zones in hot massive stars and
their observable consequences![[*]](/icons/foot_motif.png)
M. Cantiello1 - N. Langer1,2 - I. Brott1 - A. de Koter1,3 - S. N. Shore4 - J. S. Vink5 - A. Voegler1 - D. J. Lennon6 - S.-C. Yoon7
1 - Astronomical Institute, Utrecht University,
Princetonplein 5, 3584 CC, Utrecht, The Netherlands
2 -
Argelander-Institut für Astronomie der Universität Bonn, Auf dem Hügel 71, 53121 Bonn, Germany
3 -
Astronomical Institute Anton Pannekoek, University of Amsterdam, Kruislaan 403, 1098 SJ, Amsterdam, The Netherlands
4 -
Dipartmento di Fisica ``Enrico Fermi'', Università di Pisa, via Buonarroti 2, Pisa 56127 and INFN - Sezione di Pisa, Italy
5 -
Armagh Observatory, College Hill, Armagh, BT61 9DG, Northern Ireland, UK
6 -
Space Telescope Science Institute, 3700 San Martin Drive, Baltimore, MD 21218, USA
7 -
Department of Astronomy & Astrophysics, University of California, Santa Cruz, High Street, Santa Cruz, CA 95064, USA
Received 12 January 2009 / Accepted 3 March 2009
Abstract
Context. We study the convection zones in the outer envelope of hot massive stars which are caused by opacity peaks associated with iron and helium ionization.
Aims. We determine the occurrence and properties of these convection zones as function of the stellar parameters. We then confront our results with observations of OB stars.
Methods. A stellar evolution code is used to compute a grid of massive star models at different metallicities. In these models, the mixing length theory is used to characterize the envelope convection zones.
Results. We find the iron convection zone (FeCZ) to be more prominent for lower surface gravity, higher luminosity and higher initial metallicity. It is absent for luminosities below about
![]() ,
,
![]() ,
and
,
and
![]() for the Galaxy, LMC and SMC, respectively. We map the strength of the FeCZ on the Hertzsprung-Russell diagram for three metallicities, and compare this with the occurrence of observational phenomena in O stars: microturbulence, non-radial pulsations, wind clumping, and line profile variability.
for the Galaxy, LMC and SMC, respectively. We map the strength of the FeCZ on the Hertzsprung-Russell diagram for three metallicities, and compare this with the occurrence of observational phenomena in O stars: microturbulence, non-radial pulsations, wind clumping, and line profile variability.
Conclusions. The confirmation of all three trends for the FeCZ as function of stellar parameters by empirical microturbulent velocities argues for a physical connection between sub-photospheric convective motions and small scale stochastic velocities in the photosphere of O- and B-type stars. We further suggest that clumping in the inner parts of the winds of OB stars could be caused by the same mechanism, and that magnetic fields produced in the FeCZ could appear at the surface of OB stars as diagnosed by discrete absorption components in ultraviolet absorption lines.
Key words: convection - stars: early-type - stars: evolution - stars: atmospheres - stars: magnetic fields - stars: oscillations
1 Introduction
Massive stars, in a general sense, have convective cores and radiative
envelopes (Kippenhahn & Weigert 1990). The introduction
of the so called ``iron peak'' in stellar opacities (Iglesias et al. 1992) led, however,
to the prediction of a small convection
zone in the envelope of sufficiently luminous massive main sequence models
(Stothers & Chin 1993). It is often accompanied by an even smaller convection zone
which originates from an opacity peak associated with
partial helium ionization. These two convection zones comprise
almost negligible amount of mass.
The reality of the iron opacity bump, as predicted by various groups (e.g., Iglesias et al. 1992; Badnell et al. 2005),
is unambiguous. It is most obvious in the field of
stellar pulsations. Only the inclusion of this feature allows an agreement of
observed and predicted instability regimes in the HR diagram, from the white
dwarf regime (e.g. Charpinet et al. 1997; Saio 1993), for main sequence stars (e.g., ![]() Cephei stars; see Deng & Xiong 2001, and references therein), and up to hot supergiants (Saio et al. 2006).
Cephei stars; see Deng & Xiong 2001, and references therein), and up to hot supergiants (Saio et al. 2006).
While the envelope convection zones may, at first glance, be negligible for the internal evolution of hot massive stars, they may cause observable phenomena at the stellar surface. The reason is that the zones are located very close to the photosphere for some mass interval (see below). Here, we will discuss which observed features in hot stars might be produced by these near surface convection zones. In particular, we examine whether a link exists between these convective regions and observable small scale velocity fields at the stellar surface and in the stellar wind, ``microturbulence''. A similar idea has been used to explain microturbulence in low mass stars (Edmunds 1978), in which deeper envelope convection zones reach the photosphere. While Edmunds (1978) concludes that the same mechanism cannot explain microturbulent velocities in O and B stars, the iron-peak induced sub-photospheric convection zones in these stars had not yet been discovered. We demonstrate in this paper that these convection zones may not only cause motions which are observable, but possibly even directly affect the evolution: first, we discuss how photospheric velocity fields may affect the structure of massive star winds by inducing clumping at the base of the wind and thereby affecting the stellar mass-loss. And second, we argue that the near surface convection zones may generate magnetic fields which - if they migrate to the surface - further affect the stellar wind mass-loss and, more significantly, the associated stellar angular momentum loss.
We construct grids of massive main sequence star models, for various metallicities, that allow us to predict the occurrence and properties of sub-surface convection zones as function of the stellar parameters (Sect. 3). We then compare the model predictions with observed stellar properties, e.g., empirically derived microturbulent velocities and observations of wind clumping in hot massive stars (Sect. 4).
2 Method
Our stellar models are calculated with a hydrodynamic stellar evolution code. This code can calculate the effect of rotation on the stellar structure, rotationally induced chemical mixing, and the transport of angular momentum by magnetic torques (see Petrovic et al. 2005; Yoon et al. 2006, and references therein). Compositional mixing is treated as a diffusive process. The rate of change of a nuclear species of mass fraction Xi is calculated as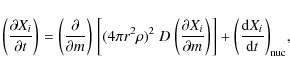 |
(1) |
where D is the diffusion coefficient constructed from the sum of individual diffusion coefficients for the range of mixing processes (see Heger et al. 2000, and references therein). The second term on the right hand side is the schematic symbol to stand for all nuclear reactions. The contributions to the diffusion coefficient are convection, semiconvection and thermohaline mixing. For rotating models also the contributions from rotationally induced mixing and magnetic diffusion are computed. The transport of angular momentum is also treated as a diffusive process (Heger et al. 2000; Endal & Sofia 1978; Pinsonneault et al. 1989).
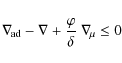
The Ledoux criterion is used to determine
which regions of the star are unstable to convection:
 |
(2) |
(e.g., Kippenhahn & Weigert 1990) where
 |
(3) |
where
![\begin{displaymath}D=\frac{1}{3}~\alpha^{2/3} {H}_{{\rm P}}~\Big[\frac{c}{\varka...
...rm\!ad}}(\nabla_{{\rm\!rad}}-\nabla_{{\rm\!ad}}) \Big]^{1/3} ,
\end{displaymath}](/articles/aa/full_html/2009/19/aa11643-09/img41.png) |
(4) |
where
We use the solar composition proposed by Asplund et al. (2005). The opacities in our code are extracted from the OPAL tables (Iglesias & Rogers 1996).
Figure 1 shows the opacity coefficient as
function of temperature in our 60
![]() models
for various metallicities. The peaks at
models
for various metallicities. The peaks at
![]() and
and
![]() are caused by helium and iron, respectively. The peak at
are caused by helium and iron, respectively. The peak at
![]() is caused by carbon, oxygen and iron.
is caused by carbon, oxygen and iron.
We use the metallicity dependent mass-loss predictions of Vink et al. (2001).
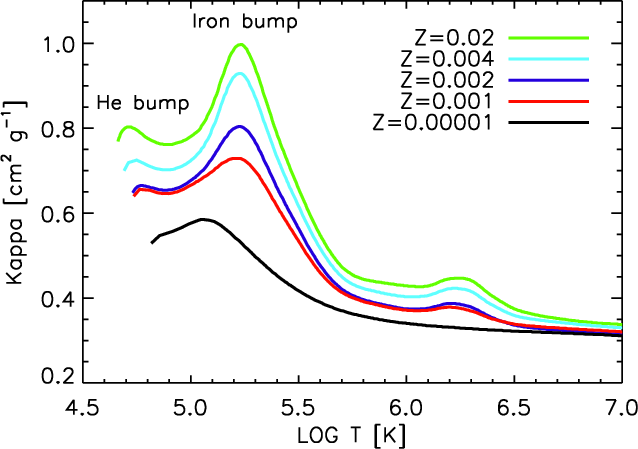 |
Figure 1:
Opacity in the interior of 60
|
| Open with DEXTER | |
Table 1:
Properties of the envelope convection zones in our 20 and
60
![]() models of solar metallicity. These are the same models shown in the top panel of Figs. 2 and in 3. The values in the table refer
to t =
models of solar metallicity. These are the same models shown in the top panel of Figs. 2 and in 3. The values in the table refer
to t =
![]() for the 20
for the 20
![]() model and t =
model and t =
![]() for the 60
for the 60
![]() model.
model.
2.1 The helium convection zone
In the very weak helium convection zone, radiative diffusion is
the dominant energy transport mechanism,
which may have consequences for the development of convection.
In fact, in viscous fluids the Ledoux-criterion is not
strictly correct, since it ignores any dissipative
effect on the evolution of a perturbation.
A more accurate criterion can be expressed in terms of the non-dimensional Rayleigh
number, ![]() which for compressible, stratified convection, is
which for compressible, stratified convection, is

Here L is the thickness of the convective layer, and
For convection to develop, ![]() must exceed some critical value,
must exceed some critical value,
![]() .
The estimate of
.
The estimate of ![]() in the helium convective
region depends on the choice of the viscosity coefficient. For the Spitzer formula
(Spitzer 1962),
in the helium convective
region depends on the choice of the viscosity coefficient. For the Spitzer formula
(Spitzer 1962),
![]() ,
and the region
can be considered convective. In contrast, for the radiative viscosity
(e.g, Kippenhahn & Weigert 1990, p. 445),
,
and the region
can be considered convective. In contrast, for the radiative viscosity
(e.g, Kippenhahn & Weigert 1990, p. 445),
![]() .
There is an additional uncertainty in these estimates since the expressions
for the radiative transport coefficients in our models
are strictly correct only in the diffusion limit.
Likewise, the value of the heat capacity
.
There is an additional uncertainty in these estimates since the expressions
for the radiative transport coefficients in our models
are strictly correct only in the diffusion limit.
Likewise, the value of the heat capacity
![]() can vary by
an order of magnitude depending on whether the radiative energy reservoir a T4
is coupled to the internal energy of the gas or not. Since the helium convection zone
occurs very close to the surface in our models, these
additional uncertainties could be relevant.
can vary by
an order of magnitude depending on whether the radiative energy reservoir a T4
is coupled to the internal energy of the gas or not. Since the helium convection zone
occurs very close to the surface in our models, these
additional uncertainties could be relevant.
Ideally, the properties of the helium convection zone could be studied through multi-dimensional hydrodynamic calculations. However, the large thermal diffusivity poses a formidable computational challenge since it makes the problem numerically stiff: the diffusive timescale is much shorter than the dynamical one, which leads to very short time steps if an explicit solver is used (unfortunately, most codes used for compressible convection are explicit). Any simulation would have only limited value unless it includes a sufficiently realistic treatment of the coupling between plasma and radiation.
In the presence of strong wind mass-loss,
another consideration related to the He convective zone becomes important,
due to the fact that it comprises only a tiny amount of mass.
Convection can set in only if the turnover time
![]() is shorter than the time scale for
which convection is predicted to prevail at a fixed Lagrangian mass shell
inside the convection zone,
is shorter than the time scale for
which convection is predicted to prevail at a fixed Lagrangian mass shell
inside the convection zone,
![]() ,
which is
,
which is
![]() .
We find a critical mass-loss rate
.
We find a critical mass-loss rate
![]() ,
above which
convection has no time to develop in the helium region, since the wind is removing
an amount of mass equivalent to the mass of the convection
zone before a convective eddy can turn over (see Table 1).
For a metallicity Z=0.02, stars above 40
,
above which
convection has no time to develop in the helium region, since the wind is removing
an amount of mass equivalent to the mass of the convection
zone before a convective eddy can turn over (see Table 1).
For a metallicity Z=0.02, stars above 40
![]() cannot
develop the He convection zone, and in a 20
cannot
develop the He convection zone, and in a 20
![]() such a layer is
convective only for 10-100 turnovers before convection moves to a lower
mass coordinate.
None of these concerns is significant for the iron convection zone (FeCZ hereafter),
where convection is always fully developed.
Moreover the convective velocities for the FeCZ are always
found to be much higher than those in the helium convection zones.
We disregard the occurrence of the helium convection zones unless it
is explicitly mentioned.
such a layer is
convective only for 10-100 turnovers before convection moves to a lower
mass coordinate.
None of these concerns is significant for the iron convection zone (FeCZ hereafter),
where convection is always fully developed.
Moreover the convective velocities for the FeCZ are always
found to be much higher than those in the helium convection zones.
We disregard the occurrence of the helium convection zones unless it
is explicitly mentioned.
3 Results
We calculated a grid of non-rotating stellar evolution sequences for initial masses
between
![]() and
and
![]() ,
at metallicities of Z=0.02, Z=0.008 and Z=0.004, roughly corresponding to
the Galaxy, the LMC and the SMC, respectively. Additionally, we computed several models at
lower metallicity. Since rapid rotation can change the properties of
sub-surface convection (Maeder et al. 2008), we calculated a few rotating models to evaluate the effects of rotation on our results.
These effects are discussed in Sect. 3.1.
,
at metallicities of Z=0.02, Z=0.008 and Z=0.004, roughly corresponding to
the Galaxy, the LMC and the SMC, respectively. Additionally, we computed several models at
lower metallicity. Since rapid rotation can change the properties of
sub-surface convection (Maeder et al. 2008), we calculated a few rotating models to evaluate the effects of rotation on our results.
These effects are discussed in Sect. 3.1.
Figures 2 and 3 show the evolution
of the radial extent and location of the sub-surface convection zones in
20
![]() and 60
and 60
![]() models during the main sequence phase.
models during the main sequence phase.
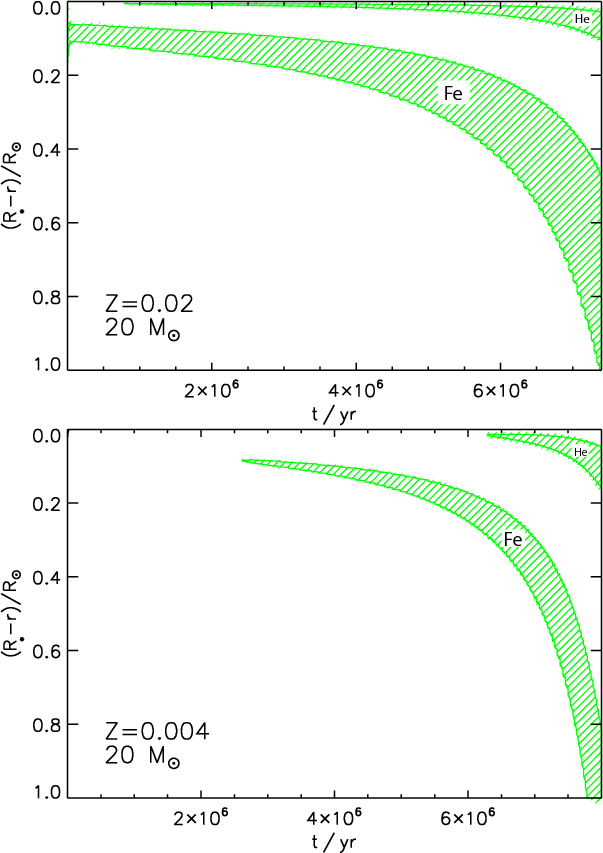 |
Figure 2:
Evolution of the radial extent of the helium and iron convective regions
(hatched) as function of time,
from the zero age main sequence to roughly the end of core hydrogen burning, for a 20
|
| Open with DEXTER | |
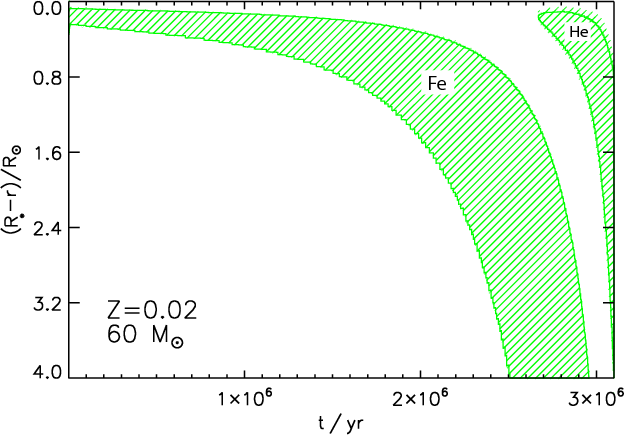 |
Figure 3:
Same as Fig. 2, but for a 60
|
| Open with DEXTER | |
As outlined above,
the He opacity bump at around
![]() is responsible for a
convective zone which occurs close to the stellar surface and is very inefficient:
only a very small fraction of the heat flux is transported by bulk motions
in this region.
The upper boundary is typically found at an optical depth in the range
is responsible for a
convective zone which occurs close to the stellar surface and is very inefficient:
only a very small fraction of the heat flux is transported by bulk motions
in this region.
The upper boundary is typically found at an optical depth in the range
![]() ,
where
,
where ![]() is the Rosseland mean optical depth.
Below this convective zone, the Fe opacity bump at around
is the Rosseland mean optical depth.
Below this convective zone, the Fe opacity bump at around
![]() is
associated with a more efficient and extended convective region.
is
associated with a more efficient and extended convective region.
The radial extent of the FeCZ is quite substantial,
i.e. a significant fraction of one solar radius, which corresponds
typically to 2-10 pressure scale heights, comprising a
mass on the order of 10
![]() to 10
to 10
![]() ,
while
the amount of mass between the top of the FeCZ and the stellar
surface is around several times 10
,
while
the amount of mass between the top of the FeCZ and the stellar
surface is around several times 10
![]() (cf. Table 1).
In the 20
(cf. Table 1).
In the 20
![]() model the upper border of the FeCZ
is located at
model the upper border of the FeCZ
is located at
![]() on the ZAMS, and at
on the ZAMS, and at
![]() on the cool side of the main sequence band. In
the 60
on the cool side of the main sequence band. In
the 60
![]() model the upper border at ZAMS is located at
model the upper border at ZAMS is located at
![]() ,
reaching
,
reaching
![]() during
the late main sequence evolution.
Convective velocities predicted by the MLT are on the order of 10 s of
during
the late main sequence evolution.
Convective velocities predicted by the MLT are on the order of 10 s of
![]() ,
where more extended zones achieve higher velocities.
For a quantitative analysis, we define an average convective velocity
,
where more extended zones achieve higher velocities.
For a quantitative analysis, we define an average convective velocity
where
From Figs. 2 and 3, three trends for the extent
of the sub-surface convection zones are noticeable. First, with increasing
time during the main sequence evolution,
these zones become more extended, and are
located deeper inside the stellar envelope. This is because the stellar envelope expands,
and becomes cooler, while the temperature of the opacity peak remains nearly constant.
In our
![]() model at Z=0.02, the mass of the He convective zone increases
from about
model at Z=0.02, the mass of the He convective zone increases
from about
![]() to
to
![]() ,
and that of the FeCZ is growing from
,
and that of the FeCZ is growing from
![]() to
to
![]() .
For sufficiently hot models, the helium convection zones can even vanish (Fig. 2, lower panel).
Second, comparing the 20
.
For sufficiently hot models, the helium convection zones can even vanish (Fig. 2, lower panel).
Second, comparing the 20
![]() and the 60
and the 60
![]() model at Z=0.02 demonstrates that the
FeCZ becomes more prominent for higher luminosity. This is because the opacity is not substantially changing
among main sequence models at the same metallicity, such that a higher luminosity
renders a larger portion of the envelope convectively unstable (both in radius and mass fraction).
Our models show that the FeCZ disappears below a threshold luminosity
of about
model at Z=0.02 demonstrates that the
FeCZ becomes more prominent for higher luminosity. This is because the opacity is not substantially changing
among main sequence models at the same metallicity, such that a higher luminosity
renders a larger portion of the envelope convectively unstable (both in radius and mass fraction).
Our models show that the FeCZ disappears below a threshold luminosity
of about
![]() on the ZAMS at solar metallicity. Third, comparing the two
20
on the ZAMS at solar metallicity. Third, comparing the two
20
![]() models in Fig. 2 shows that the extent of the FeCZ,
and its presence, depends on the metallicity. We find that for Z=0.001, it
is completely absent below 40
models in Fig. 2 shows that the extent of the FeCZ,
and its presence, depends on the metallicity. We find that for Z=0.001, it
is completely absent below 40
![]() ,
and at Z=0.00001 it does not occur for
,
and at Z=0.00001 it does not occur for
![]() .
In summary, our models predict an increase of the importance of the FeCZ for
cooler surface temperature or lower surface gravity, for higher luminosity, and for higher metallicity.
.
In summary, our models predict an increase of the importance of the FeCZ for
cooler surface temperature or lower surface gravity, for higher luminosity, and for higher metallicity.
While in the discussed range of luminosity and effective temperature,
the average convective velocity
![]() is on the order of 1 to 10
is on the order of 1 to 10
![]() for the
FeCZ,
we found that the average convective velocity
for the
FeCZ,
we found that the average convective velocity
![]() in the He convective zone is always very low (
in the He convective zone is always very low (
![]() ).
Convection due to hydrogen
recombination is absent; this dominates at lower effective temperatures
than the ones studied here.
).
Convection due to hydrogen
recombination is absent; this dominates at lower effective temperatures
than the ones studied here.
For our grid of stellar evolution models, we map the average convective velocity of the FeCZ (Eq. (6)) in the HR diagram for the three different metallicities (see Fig. 9, and Sect. 4.1.2). This figure displays the three qualitative trends of the iron zone we have just described.
- For given luminosity and metallicity, the average convective velocity near the
upper boundary of the FeCZs increases with decreasing surface temperature.
The convection zones are located deeper inside the star (in radius, not in mass),
and the resulting larger pressure scale height leads to higher velocities.
At solar metallicity and
 (i.e. roughly at
 )
the velocities
increase from just a few
)
the velocities
increase from just a few
 at the ZAMS to more than
 in the supergiant regime,
where
in the supergiant regime,
where
 is achieved at
 K.
At the lowest considered metallicity, the FeCZ
is absent at the ZAMS at
,
and a level of
is only reached
at
K.
At the lowest considered metallicity, the FeCZ
is absent at the ZAMS at
,
and a level of
is only reached
at
 K.
K.
- For fixed effective temperature and metallicity, the
iron zone convective velocity
increases with increasing luminosity, since a larger flux
demanded to be convectively transported
requires faster convective motions. Figure 9 in Sect. 4.1.2 also
shows that there are
threshold luminosities below which FeCZs do not occur, i.e.,
below about
 ,
,
 ,
and
,
and
 for the Galaxy,
LMC and SMC, respectively.
for the Galaxy,
LMC and SMC, respectively.
- The FeCZs become weaker for lower metallicities, since due to the lower opacity, more of the flux can be transported by radiation. The threshold luminosity for the occurrence of the FeCZ quoted above for Z=0.02 is ten times lower than that for Z=0.004. And above the threshold, for a given point in the HR diagram, the convective velocities are always higher for higher metallicity.
3.1 Rotating models
We considered two 20As pointed out by Maeder et al. (2008), the effects of rotation on sub-surface convection become substantial for stars rotating close to critical velocity. While stars rotating with such high velocities exist (e.g. Be stars), their number is modest. The study of sub-surface convection in these very fast rotators is interesting, but may require 2-dimensional stellar models, which is beyond the scope of this paper.
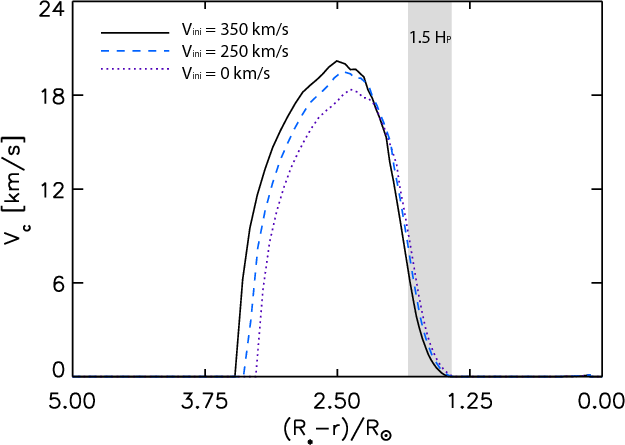 |
Figure 4:
Convective velocity in the FeCZ as function of radial distance from the stellar surface. The dotted line
corresponds to a non-rotating 20
|
| Open with DEXTER | |
4 Comparison with observations
In the following, we investigate the idea that these sub-surface convection zones might be related to observable phenomena at the stellar surface. In particular, we investigate potential connections with microturbulence in massive stars, and discuss whether small scale or large scale clumping in massive star winds, magnetic fields, and non-radial pulsations could be related to sub-surface convection. For each point, we first briefly discuss the theoretical motivation, and then the corresponding observational evidence.
4.1 Microturbulence
4.1.1 Theoretical considerations
The convective cells in the upper part of a convection zone excite
acoustic and gravity waves that propagate outward.
The generation of sound waves by turbulent motions was first discussed
by Lighthill (1952) and extended to a stratified atmosphere by Stein (1967) and Goldreich & Kumar (1990).
In a stratified medium, gravity acts as a restoring force and allows the excitation
of gravity waves. For both acoustic and gravity waves, the most important parameter
determining the emitted kinetic energy flux is the velocity of the convective motions.
This is why, in the following, we use the average convective velocity
![]() as the crucial parameter determining the efficiency of sub-surface convection.
as the crucial parameter determining the efficiency of sub-surface convection.
Goldreich & Kumar (1990) showed that convection excites acoustic and gravity waves,
resulting in maximum emission for those waves with horizontal
wave vector
![]() and angular frequency
and angular frequency
![]() ,
where now
,
where now
![]() and
and
![]() are evaluated at the top of
the convective region. They calculated that
the amount of convective kinetic energy flux
going into acoustic and gravity waves is
are evaluated at the top of
the convective region. They calculated that
the amount of convective kinetic energy flux
going into acoustic and gravity waves is
 |
(7) |
and
| (8) |
respectively, where we take
The Brunt-Vaisäla frequency in the radiative layer above the FeCZ is about mHz. Molecular viscosity can only damp the highest frequencies, while wavelengths that will be resonant with the scale length of the line forming region should not be affected (see e.g. Lighthill 1967). This is the case for the gravity waves stochastically excited by convective motions: they can easily propagate through the sub-surface radiative layer, steepening and becoming dissipative only in the region of line formation.
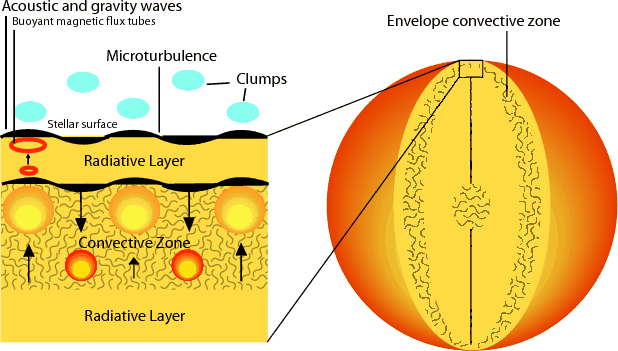 |
Figure 5: Schematic representation of the physical processes connected to sub-surface convection. Acoustic and gravity waves emitted in the convective zone travel through the radiative layer and reach the surface, inducing density and velocity fluctuations. In this picture microturbulence and clumping at the base of the wind are a consequence of the presence of sub-surface convection. Buoyant magnetic flux tubes produced in the convection zone could rise to the stellar surface. |
| Open with DEXTER | |
Again, multi-dimensional hydrodynamic simulations would be the best way to
compute the energy loss of these waves during their propagation through the
radiatively stable envelope above the FeCZ, but this is
beyond what we can presently do. We can, however, obtain
an upper limit to the expected velocity amplitudes at the stellar surface,
where we only consider the energy transport through gravity waves.
The kinetic energy per unit volume associated with the surface velocity
fluctuations ![]() must be comparable to or lower than the
kinetic energy density associated
with the waves near the sub-surface convection zone,
must be comparable to or lower than the
kinetic energy density associated
with the waves near the sub-surface convection zone,
![]() ,
or
,
or
where
 |
(10) |
In our models with well developed FeCZs,
4.1.2 Observations
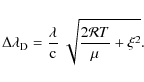
The microturbulent velocity ![]() is defined as the microscale nonthermal component of the
gas velocity in the region of spectral line formation:
is defined as the microscale nonthermal component of the
gas velocity in the region of spectral line formation:
 |
(11) |
Assuming that the gas in this zone has a temperature only slightly different from the effective temperature, one finds empirically that the observed Doppler widths
Photospheric microturbulence is routinely required, e.g., to derive consistent surface abundances
for one element from different photospheric absorption lines through stellar model atmospheres
(among many others Rolleston et al. 1996; Hibbins et al. 1998; Vrancken et al. 2000).
Unfortunately, differences in physical assumptions or atomic physics can require
somewhat different microturbulent velocities for the same star in different studies.
Here, we restrict our detailed comparison
to the data of Trundle et al. (2007) and Hunter et al. (2008b) from the ESO
VLT-FLAMES Survey of Massive Stars (Evans et al. 2005), since
it comprises the largest available uniformly analyzed data set.
In Fig. 6, we plot the microturbulent velocities derived for
the LMC early B type stars analyzed by Hunter et al. (2008b) versus their
projected rotational velocity.
The error bar on the derived microturbulent velocities is usually quite big,
![]() ,
and is often comparable to the measured quantity itself.
There seems to be no positive correlation between
,
and is often comparable to the measured quantity itself.
There seems to be no positive correlation between
![]() and the apparent projected rotational velocity
and the apparent projected rotational velocity
![]() .
Though
.
Though
![]() is plotted and not
is plotted and not
![]() itself, the lack of a correlation in such a large
data set (justifying the assumption of random orientation of the
sample) argues against rotation as an important effect in triggering
microturbulence in hot stars. To compare microturbulent velocities
to properties of sub-photospheric convection we use only data
obtained for slow rotators (i.e.
itself, the lack of a correlation in such a large
data set (justifying the assumption of random orientation of the
sample) argues against rotation as an important effect in triggering
microturbulence in hot stars. To compare microturbulent velocities
to properties of sub-photospheric convection we use only data
obtained for slow rotators (i.e.
![]() )
as microturbulent velocities are more difficult to measure for
faster rotators.
)
as microturbulent velocities are more difficult to measure for
faster rotators.
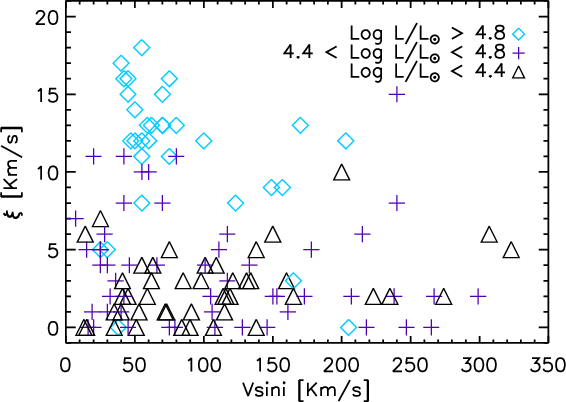 |
Figure 6:
Projected rotational velocity
|
| Open with DEXTER | |
In Fig. 7, we show the microturbulent velocities for the LMC stars of Hunter et al. (2008b)
versus the stellar surface gravity. Trends of the microturbulent velocity with ![]() have been
previously reported for hot stars (e.g. Hunter et al. 2007; Gies & Lambert 1992).
The figure shows that indeed, for
have been
previously reported for hot stars (e.g. Hunter et al. 2007; Gies & Lambert 1992).
The figure shows that indeed, for
![]() ,
there is a clear trend. However,
the luminosity coding in Fig. 7 suggests that this trend may be largely produced by
the increase in convective velocity with increasing luminosity (Sect. 3).
This figure displays a detection threshold of about
,
there is a clear trend. However,
the luminosity coding in Fig. 7 suggests that this trend may be largely produced by
the increase in convective velocity with increasing luminosity (Sect. 3).
This figure displays a detection threshold of about
![]() for
the microturbulent velocities
so in the following we restrict the comparison to
for
the microturbulent velocities
so in the following we restrict the comparison to
![]() .
.
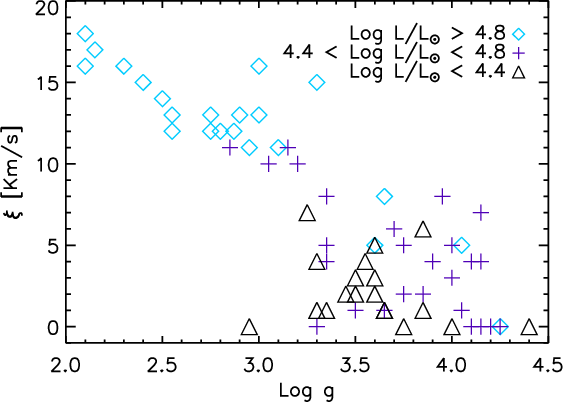 |
Figure 7:
Logarithm of surface gravity versus microturbulent velocity |
| Open with DEXTER | |
In order to compare these observations to our model predictions, we evaluated
the ratio
of the kinetic energy in the form of gravity waves at the
surface of the FeCZ to the kinetic
energy of the surface velocity field,
![]() (Eq. (9)),
assuming
(Eq. (9)),
assuming
![]() ,
in the HR diagram.
Figure 8 shows two different iso-contours of this ratio;
the stars of the LMC sample shown in Fig. 7 are over plotted.
Notably, all but one of the LMC stars of Fig. 8 with
,
in the HR diagram.
Figure 8 shows two different iso-contours of this ratio;
the stars of the LMC sample shown in Fig. 7 are over plotted.
Notably, all but one of the LMC stars of Fig. 8 with
![]() are found in that part of the HR diagram where it is energetically
possible that the FeCZ-induced gravity waves trigger a significant
surface velocity field (
are found in that part of the HR diagram where it is energetically
possible that the FeCZ-induced gravity waves trigger a significant
surface velocity field (
![]() ).
Thus, a physical connection of the FeCZ with the observed microturbulent
velocities appears energetically possible. Moreover, that the iso-contour line of
).
Thus, a physical connection of the FeCZ with the observed microturbulent
velocities appears energetically possible. Moreover, that the iso-contour line of
![]() in Fig. 8 almost perfectly divides the
observed sample in stars with significant (
in Fig. 8 almost perfectly divides the
observed sample in stars with significant (
![]() )
and insignificant
(
)
and insignificant
(
![]() )
microturbulence is a further
indication of such a physical connection.
)
microturbulence is a further
indication of such a physical connection.
![\begin{figure}
\par\resizebox{8.8cm}{!}{\includegraphics[width=1.0\textwidth]{1643fig9.eps}}
\end{figure}](/articles/aa/full_html/2009/19/aa11643-09/img154.png) |
Figure 8:
Values of the ratio
|
| Open with DEXTER | |
Figure 9 shows the iso-contours in the HR diagram of the
average convective velocity from our models
in the upper layers of the iron convective zone,
![]() (cf., Sect. 4.1.1),
at the three considered metallicities.
We have over plotted the microturbulent velocities derived by
Trundle et al. (2007) and Hunter et al. (2008b) as filled circles.
Again, we distinguish between sample stars with significant (
(cf., Sect. 4.1.1),
at the three considered metallicities.
We have over plotted the microturbulent velocities derived by
Trundle et al. (2007) and Hunter et al. (2008b) as filled circles.
Again, we distinguish between sample stars with significant (
![]() ;
Group A) and insignificant
(
;
Group A) and insignificant
(
![]() ;
Group B) microturbulent velocities.
Comparing the plot for the LMC in Fig. 9 with Fig. 8 identifies
;
Group B) microturbulent velocities.
Comparing the plot for the LMC in Fig. 9 with Fig. 8 identifies
![]() as a critical convection velocity to be able to trigger
microturbulence. Interestingly, the contour
of
as a critical convection velocity to be able to trigger
microturbulence. Interestingly, the contour
of
![]() in our stellar models forms an almost perfect dividing line between Groups A and B
for all three considered metallicities.
in our stellar models forms an almost perfect dividing line between Groups A and B
for all three considered metallicities.
![\begin{figure}
\par\includegraphics[angle=0,width=8.5cm]{1643fig10.eps}
\inclu...
...fig11.eps}\par\includegraphics[angle=0,width=8.5cm]{1643fig12.eps}
\end{figure}](/articles/aa/full_html/2009/19/aa11643-09/img156.png) |
Figure 9:
Average convective velocity within 1.5 pressure scale heights of the
upper border of the iron convection zone in our models, as function of the location
in the HR diagram (see color scale), based on evolutionary models between 5
|
| Open with DEXTER | |
In fact, Fig. 9 provides evidence for all three trends found in the average
convection velocity as function of stellar parameters (cf., Sect. 3) to be present also in the
empirical data on microturbulent velocities. The LMC data shows
that in the luminosity range
![]() microturbulence is found only for
microturbulence is found only for
![]() K.
The data for all three metallicities clearly suggests a key role of the luminosity,
as the stars with
K.
The data for all three metallicities clearly suggests a key role of the luminosity,
as the stars with
![]() are the most luminous ones in each sub sample.
And finally, the stars with high microturbulent velocities are all comfortably above
our theoretical contour line corresponding to
are the most luminous ones in each sub sample.
And finally, the stars with high microturbulent velocities are all comfortably above
our theoretical contour line corresponding to
![]() .
As the latter trends toward the upper right corner of the
HR diagram for lower metallicity, the metallicity dependence is also confirmed
by the empirical data.
.
As the latter trends toward the upper right corner of the
HR diagram for lower metallicity, the metallicity dependence is also confirmed
by the empirical data.
Lyubimkov et al. (2004) studied microturbulence in a sample of 100 Galactic early B stars.
Interestingly, they found significant microturbulent velocities (i.e., clearly above 5
![]() )
in the mass
range 7...11
)
in the mass
range 7...11
![]() for stars with a relative age on the main sequence of
for stars with a relative age on the main sequence of
![]() ,
and in the range 12...19
,
and in the range 12...19
![]() for
for
![]() ,
but only insignificant
microturbulent velocities for younger or less massive stars.
Again, these results appear to agree with Fig. 9 up to a remarkable
quantitative level.
,
but only insignificant
microturbulent velocities for younger or less massive stars.
Again, these results appear to agree with Fig. 9 up to a remarkable
quantitative level.
In summary, our comparison provides evidence for a physical connection of microturbulence in hot star photospheres with the existence and strength of a sub-photospheric FeCZ.
If microturbulence has a physical origin and is not just a fudge factor,
the pressure and energy terms associated with such a velocity field
should be included in the calculations of atmospheric models of massive
stars. Hubeny et al. (1991) have investigated part of these effects by
accounting for a constant microturbulent velocity in the pressure term
only. They find that for stars with conspicuous ![]() values
(of 25
values
(of 25
![]() )
the inclusion of the pressure term leads to higher
values of the surface gravity, which can reduce the mass discrepancy
for O stars and O-type central stars of planetary nebula.
A similar approach was also studied by Smith & Howarth (1998).
The impact on gravity discussed by Hubeny et al. (1991) is likely an upper limit to the
effect as, first, the
)
the inclusion of the pressure term leads to higher
values of the surface gravity, which can reduce the mass discrepancy
for O stars and O-type central stars of planetary nebula.
A similar approach was also studied by Smith & Howarth (1998).
The impact on gravity discussed by Hubeny et al. (1991) is likely an upper limit to the
effect as, first, the ![]() values are in most cases less
than 25
values are in most cases less
than 25
![]() ,
and, second, a positive gradient in the
atmospheric
,
and, second, a positive gradient in the
atmospheric ![]() would decrease the pressure gradient due to
microturbulence but, to date, the radial
stratification of the microturbulent velocity in the atmospheres of hot
massive stars has not been studied in detail. From a theoretical
perspective, investigating
would decrease the pressure gradient due to
microturbulence but, to date, the radial
stratification of the microturbulent velocity in the atmospheres of hot
massive stars has not been studied in detail. From a theoretical
perspective, investigating ![]() requires hydrodynamic simulations
of the stellar atmosphere, including the presence of sub-surface convection.
requires hydrodynamic simulations
of the stellar atmosphere, including the presence of sub-surface convection.
The mass discrepancy in massive stars is a well documented problem (see for example Mokiem et al. 2007; Trundle & Lennon 2005; Herrero et al. 1992; Lennon et al. 2003; Massey et al. 2005). It is typically found that the difference between spectroscopic mass and evolutionary mass is most pronounced in supergiants. In main sequence stars it may not be present at all, but see Hunter et al. (2008b). Given that microturbulent velocities are highest in supergiants (see Fig. 7) an empirical correlation between mass discrepancy and microturbulent velocity is to be expected and is shown in Fig. 10 using data analysed by Trundle et al. (2007) and Hunter et al. (2008b). If indeed microturbulence is related to subsurface convection and supergiants have intrinsically higher microturbulent velocities than dwarfs (see Sect. 3) potentially part of the gradient in Fig. 10 may be explained by the effect discussed by Hubeny et al. (1991).
4.2 Non-radial pulsation
4.2.1 Theoretical considerations
In our discussion thus far we have considered only the propagation of running waves, it is possible that the stochastic convective motions can also excite standing waves, i.e. high-order non-radial pulsations. For example, stochastic excitation is thought to be the cause of the Solar oscillations (Ulrich 1970; Leibacher & Stein 1971). It may thus be possible that the FeCZ excites non-radial pulsations in hot early-type stars.
Several classes of OB star models are found to be linearly unstable against non-radial
pulsations, among which are
the
![]() stars and the
slowly pulsating B stars (e.g., Pamyatnykh 1999; Dupret 2001).
The key ingredient required for the pulsational instability is the iron opacity
peak described in Sect. 2.
As convection is not required to produce the pulsations in these models,
it is not considered in detail as excitation mechanism (Dziembowski 2008).
It is conceivable that the convective excitation could modify the predicted pulsation
spectrum and/or extend the instability region of certain linear instabilities.
The convective kinetic energy flow into waves
could be predominantly directed into those modes for
which instability is predicted in the models.
In certain parts of the HR diagram, one may thus
suspect an intricate connection between
the occurrence of a sub-photospheric iron convection
zone and the properties of non-radial pulsations.
stars and the
slowly pulsating B stars (e.g., Pamyatnykh 1999; Dupret 2001).
The key ingredient required for the pulsational instability is the iron opacity
peak described in Sect. 2.
As convection is not required to produce the pulsations in these models,
it is not considered in detail as excitation mechanism (Dziembowski 2008).
It is conceivable that the convective excitation could modify the predicted pulsation
spectrum and/or extend the instability region of certain linear instabilities.
The convective kinetic energy flow into waves
could be predominantly directed into those modes for
which instability is predicted in the models.
In certain parts of the HR diagram, one may thus
suspect an intricate connection between
the occurrence of a sub-photospheric iron convection
zone and the properties of non-radial pulsations.
Non-radial pulsations have also been considered as the origin of various observed
small scale (e.g., line profile variability, Fullerton et al. 1996,1997) and large scale phenomena
(e.g., so called discrete absorption components, Massa et al. 1995; Prinja et al. 2002; Prinja & Howarth 1988; Kaper et al. 1997)
at the surface or in the wind of massive OB stars.
Non-radial g-mode pulsations were also recently proposed as the origin
of observable macroturbulence in massive B type stars (Aerts et al. 2008).
In Fig. 11 we compare the regions where strange mode, g-mode,
and p-mode pulsations are predicted to occur in the HR diagram
with the region where our models predict a strong FeCZ.
Pulsations appear to be almost ubiquitous when all types of variables are accounted
for. The strange mode pulsators are predicted to cover the HR diagram at high
luminosity, where we plotted only the predictions for the radial strange modes of Kiriakidis et al. (1993);
high-order non-radial strange modes seem to be omnipresent
as well for stars above 40
![]() or so (Glatzel & Mehren 1996).
Non-radial g-mode pulsators are predicted by Saio et al. (2006)
in the B supergiant region. And radial and low order non-radial p-modes are predicted for the
or so (Glatzel & Mehren 1996).
Non-radial g-mode pulsators are predicted by Saio et al. (2006)
in the B supergiant region. And radial and low order non-radial p-modes are predicted for the
![]() Cephei regime by Deng & Xiong (2001) and by Pamyatnykh (1999) and
Saio et al. (2006) for a considerably larger region in the HR diagram.
At lower metallicity, many of the predicted areas in the HR diagram are
smaller (cf., Kiriakidis et al. 1993; Deng & Xiong 2001) but
the general picture is still incomplete.
Cephei regime by Deng & Xiong (2001) and by Pamyatnykh (1999) and
Saio et al. (2006) for a considerably larger region in the HR diagram.
At lower metallicity, many of the predicted areas in the HR diagram are
smaller (cf., Kiriakidis et al. 1993; Deng & Xiong 2001) but
the general picture is still incomplete.
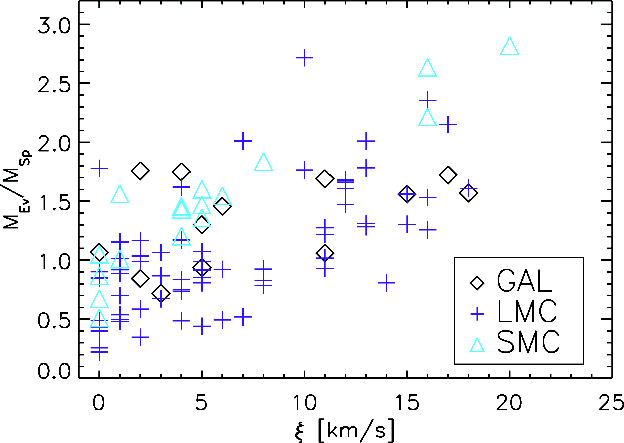 |
Figure 10:
Values of the mass discrepancy (evolutionary mass divided
by spectroscopic mass) as function of microturbulent velocity in the
sample of B stars analysed by Trundle et al. (2007) and Hunter et al. (2008b).
Here, we use only data for stars with an apparent rotational velocity of
|
| Open with DEXTER | |
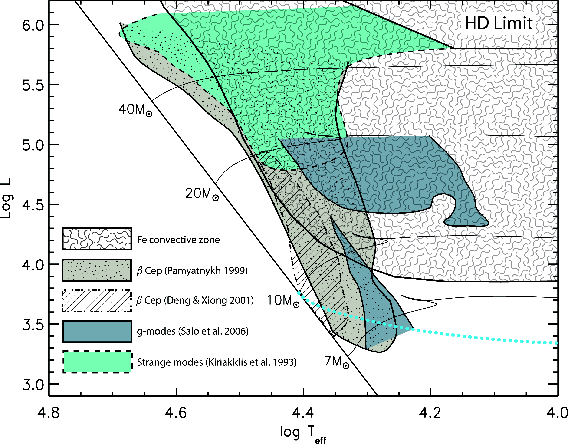 |
Figure 11:
The plot shows regions of the HR diagram where pulsational instabilities are predicted, compared to our calculations for the occurrence
of iron convection. The cloudy region marks the presence of iron sub-surface convection with
|
| Open with DEXTER | |
4.2.2 Observations
Observationally, the classical ![]() Cephei stars are concentrated in the
region predicted by Deng & Xiong (Stankov & Handler 2005), while the
B supergiant non-radial g-mode pulsators overlap with the prediction of Saio et al. (2006)
but extend to an effective temperature of
Cephei stars are concentrated in the
region predicted by Deng & Xiong (Stankov & Handler 2005), while the
B supergiant non-radial g-mode pulsators overlap with the prediction of Saio et al. (2006)
but extend to an effective temperature of
![]() K (Lefever et al. 2007).
Pulsations are also found for the most luminous stars (e.g., the
K (Lefever et al. 2007).
Pulsations are also found for the most luminous stars (e.g., the ![]() Cygni-variables; van Leeuwen et al. 1998),
but there is now no clear evidence for strange mode pulsators.
Comparing the prediction for the FeCZ
with that for pulsational instability
(Fig. 11) shows two things. Firstly, the FeCZ-region is much larger than any region for
a particular pulsational instability. Thus, distinguishing whether a certain observational
feature is caused by a particular pulsational instability by the FeCZ might, in principle,
be possible, since the area in the HR diagram where the latter occurs but
the pulsational instability does not is relatively large.
Secondly, some regions exist where (so far) no pulsations are predicted but the FeCZ in our
models is strong, or where, vice versa, pulsations are predicted but the FeCZ is weak or absent.
Cygni-variables; van Leeuwen et al. 1998),
but there is now no clear evidence for strange mode pulsators.
Comparing the prediction for the FeCZ
with that for pulsational instability
(Fig. 11) shows two things. Firstly, the FeCZ-region is much larger than any region for
a particular pulsational instability. Thus, distinguishing whether a certain observational
feature is caused by a particular pulsational instability by the FeCZ might, in principle,
be possible, since the area in the HR diagram where the latter occurs but
the pulsational instability does not is relatively large.
Secondly, some regions exist where (so far) no pulsations are predicted but the FeCZ in our
models is strong, or where, vice versa, pulsations are predicted but the FeCZ is weak or absent.
Comparing Figs. 11 with 9, where we show the observations of microturbulence and the FeCZ predictions, it is unlikely that microturbulence is associated with a particular pulsational instability. Strong microturbulence is observed at too low a luminosity to be attributable to strange mode pulsations alone, while p-mode pulsators are found where microturbulence seems not to occur. Concerning the g-mode pulsators the situation is less clear. Figure 11 shows that, at solar metallicity, g-mode pulsations for post-main sequence stars are expected only in a rather narrow luminosity interval. Unfortunately, the five Galactic stars shown in Fig. 5 for which strong microturbulence is derived are all inside this luminosity range, so they cannot distinguish between a pulsational or FeCZ origin of microturbulence. However, looking at the LMC data, stars above the g-mode luminosity upper limit with microturbulence are found; whether or not corresponding stellar models are g-mode unstable is currently not known. A connection of microturbulence with non-radial pulsations is thus not impossible, but it is also not very likely.
Comparing Fig. 11 with the discrete absorption components (DACs) found in 200 Galactic O stars above
![]() by Howarth & Prinja (1989) all the way to the zero age main sequence,
seems to argue against non-radial pulsations as the origin of the DACs phenomenon
(see also Sect. 4.4).
by Howarth & Prinja (1989) all the way to the zero age main sequence,
seems to argue against non-radial pulsations as the origin of the DACs phenomenon
(see also Sect. 4.4).
4.3 Wind clumping
4.3.1 Theoretical considerations
Observational evidence exists for stellar wind inhomogeneities on small and on large scales. While the latter will be discussed in Sect. 4.4, here we consider only small scale wind structure, or wind clumping. In Sect. 4.1, we discussed that waves produced by the FeCZ could lead to velocity fluctuations at the stellar surface. In order to induce wind clumping, those waves should induce density fluctuations at the stellar surface. Through the occurrence of porosity or shifts in the ionisation balance of the gas the mass-loss rate may be affected. For this to happen, the amplitude of the velocity fluctuations at the surface should be on the same order of the sound speed. Alternatively, the velocity fluctuations might directly affect the local mass-loss rate through the Doppler effect, if the amplitude of the velocity fluctuations is on the same order as the speed of the wind flow, which, at the base of the wind, is approximately the sound speed. As the sound speed at the surface in our massive main sequence models is on the order of a few times
Assuming the horizontal extent of the clumps to be comparable to the
sub-photospheric pressure scale height ![]() ,
we may estimate
the number of convective cells by dividing the stellar surface area
by the surface area of a convective cell finding that it scales
with (
,
we may estimate
the number of convective cells by dividing the stellar surface area
by the surface area of a convective cell finding that it scales
with (
![]() .
For our main sequence O star models in the mass
range 20-60
.
For our main sequence O star models in the mass
range 20-60
![]() ,
we find pressure scale heights in the range
0.04-0.24
,
we find pressure scale heights in the range
0.04-0.24
![]() ,
corresponding to a total number of clumps in the range
,
corresponding to a total number of clumps in the range
![]() .
In principle, this might be testable through
linear polarization variability measurements, which can probe wind asphericity
at the very base of the wind (Davies et al. 2007).
.
In principle, this might be testable through
linear polarization variability measurements, which can probe wind asphericity
at the very base of the wind (Davies et al. 2007).
4.3.2 Observations
Evidence has been accumulating that the winds of massive stars
may be subject to small scale clumping. So far this is best
documented for Wolf-Rayet (WR) stars, where line variability on time
scales of minutes to hours is thought to constitute direct evidence of
outflows that are clumped already in the acceleration zone near the
base of the wind (Lépine & Moffat 1999). This clumping may be
part of the explanation for the wealth of intricate detail seen in
nebulae around WR stars (Grosdidier et al. 1998). Recently,
Lepine & Moffat (2008) reported spectroscopic variability in
the Of supergiants ![]() Pup (see also Eversberg et al. 1998)
and HD 93 129A. The amplitude of the variation (at the 1-3% level) is
similar as in WR stars supporting the notion that clumping is not
restricted to WR stars.
Pup (see also Eversberg et al. 1998)
and HD 93 129A. The amplitude of the variation (at the 1-3% level) is
similar as in WR stars supporting the notion that clumping is not
restricted to WR stars.
Indeed, evidence that O star winds are clumped is given by, among others,
Puls et al. (2006). These authors investigate the clumping
behavior of the inner wind (inside about two stellar radii) relative
to the clumping in the outer wind (beyond tens of stellar radii)
of a large sample of supergiant and giant stars.
They find that in stars that have strong winds, the inner
wind is more strongly clumped than the outer wind, whereas those
having weak winds have similar clumping properties in the inner and
outer regions. Their analysis only allows for such a relative statement.
In principle, for weak winds the outer part could be homogeneous.
If so, weak winds are not clumped.
In any case, strong winds - identified as such if H![]() is seen in
emission - are clumped near the base of the wind.
A measure of the degree of clumping is the clumping factor
is seen in
emission - are clumped near the base of the wind.
A measure of the degree of clumping is the clumping factor
![]() where angle brackets denote (temporal) average
values (e.g. Puls et al. 2006).
where angle brackets denote (temporal) average
values (e.g. Puls et al. 2006).
Apparently, this type of radial behavior is not consistent with hydrodynamical predictions of the intrinsic, self-excited line-driven instability (Runacres & Owocki 2002,2005). Such models predict a lower clumping in the inner wind than the outer wind. Moreover, if there was any dependence on wind density predicted at all, optically thin winds should be more strongly clumped than optically thick winds (Puls et al. 2006; Owocki & Puls 1999). Therefore, the findings on the radial clumping behavior in O stars may point to an additional excitation mechanism of wind structure.
Figure 12 shows that
the O stars investigated by Puls et al. (2006) populate the
regime in the HR diagram
in which our models predict the average convective velocity in the
top part of the FeCZ to change from a few to
over
![]() ,
indicating that surface velocity fluctuations
on the order of the local sound speed are possible (cf. Sect. 4.3.1).
Though the part of the HR diagram that is covered by the
sample is limited (
,
indicating that surface velocity fluctuations
on the order of the local sound speed are possible (cf. Sect. 4.3.1).
Though the part of the HR diagram that is covered by the
sample is limited (
![]() ;
;
![]() ), the trend is such that stars with
relatively strong clumping in the inner winds are in a regime where
), the trend is such that stars with
relatively strong clumping in the inner winds are in a regime where
![]() is higher. A correlation between clumping
at the base of the wind and
is higher. A correlation between clumping
at the base of the wind and
![]() ,
i.e., between wind clumping and the properties of the FeCZ,
appears therefore possible.
To further test the idea that the FeCZ
produces wind clumping at the wind base for sufficiently luminous and cool stars
it would be desirable to derive the radial clumping profiles for cooler (i.e. B-type) stars.
If correct, such stars, both the ones with weak and
strong winds, should have relatively strong clumping at the base
of the wind.
,
i.e., between wind clumping and the properties of the FeCZ,
appears therefore possible.
To further test the idea that the FeCZ
produces wind clumping at the wind base for sufficiently luminous and cool stars
it would be desirable to derive the radial clumping profiles for cooler (i.e. B-type) stars.
If correct, such stars, both the ones with weak and
strong winds, should have relatively strong clumping at the base
of the wind.
To derive the spatial scale of the wind clumps from linear polarimetry has not yet been
possible for main sequence OB stars. A limitation
is that this technique requires very high signal-to-noise observations
(see discussion in Harries et al. 2002). Luminous Blue Variables (LBVs) however provide
a more appropriate category of objects to test wind clump sizes, because of a
combination of higher mass-loss rates, and lower wind velocities than for O stars
(Davies et al. 2005). Indeed,
Davies et al. (2007) show that in order to produce the observed
polarization variability of P Cygni, the wind
should consist of about ![]() 1000 clumps per wind flow-time (
1000 clumps per wind flow-time (
![]() ).
To see whether this observational result is compatible with sub-surface convection
causing wind clumping,
we considered the sub-surface convective regions of a massive star model with global
properties similar to those of P Cygni (initial mass 60
).
To see whether this observational result is compatible with sub-surface convection
causing wind clumping,
we considered the sub-surface convective regions of a massive star model with global
properties similar to those of P Cygni (initial mass 60
![]() ,
,
![]() ,
and
,
and
![]() K). As a result of the lower gravity,
the pressure scale height in the FeCZ in this model
is about 4
K). As a result of the lower gravity,
the pressure scale height in the FeCZ in this model
is about 4
![]() ,
which is much bigger than in our O star models.
Consequently, the same estimate for the number of clumps as done for the main sequence
models in Sect. 4.3.1 yields about 500 clumps per wind flow time, a
number which is quite comparable
to that derived for P Cygni observationally (about 103 clumps per
wind flow time).
,
which is much bigger than in our O star models.
Consequently, the same estimate for the number of clumps as done for the main sequence
models in Sect. 4.3.1 yields about 500 clumps per wind flow time, a
number which is quite comparable
to that derived for P Cygni observationally (about 103 clumps per
wind flow time).
Finally, Fullerton et al. (1996) have conducted a spectroscopic survey of O stars and observed intrinsic absorption line profile variability (LPVs) for about 77% of their sample. They report an increase of incidence and amplitude of variability with increasing stellar radius and luminosity, as well as no statistically significant line profile variability for dwarfs earlier than O7. While Fullerton et al. attempt to relate their findings to the predictions of strange-mode pulsation in O stars by Kiriakidis et al. (1993), a comparison of their results (see their Fig. 13) with the occurrence of sub-surface convection as depicted in Fig. 9 indicates the possibility of a physical connection between line profile variability and sub-surface convection in O stars.
4.4 Magnetic fields
4.4.1 Fields from iron convection zones
In solar-type stars, surface convection zones modified by the stellar rotation
are thought of being capable of producing a
magnetic field through the so called
![]() -dynamo (Parker 1975; Spiegel & Weiss 1980; Spiegel & Zahn 1992).
The FeCZ in our massive main sequence stellar models has a spatial extent similar to the
Solar convection zone, although its mass is much smaller, and OB stars are rapid rotators, so it is possible that a
dynamo may also work in the envelopes of OB stars.
If so, the magnetic field may be able to
penetrate the radiatively stable layer above the FeCZ, and
dynamically significant field strengths might be achievable.
To this end, we follow the model by MacGregor & Cassinelli (2003)
for the rise of buoyant magnetic flux tubes
generated at the edge of the convective core of massive stars through their radiative
envelope and apply this model to the FeCZ and the overlying radiative
layer. The magnetic field strength B0 in the iron convection
zone is estimated assuming equipartition of
kinetic energy density and magnetic energy
density inside the convective layers:
-dynamo (Parker 1975; Spiegel & Weiss 1980; Spiegel & Zahn 1992).
The FeCZ in our massive main sequence stellar models has a spatial extent similar to the
Solar convection zone, although its mass is much smaller, and OB stars are rapid rotators, so it is possible that a
dynamo may also work in the envelopes of OB stars.
If so, the magnetic field may be able to
penetrate the radiatively stable layer above the FeCZ, and
dynamically significant field strengths might be achievable.
To this end, we follow the model by MacGregor & Cassinelli (2003)
for the rise of buoyant magnetic flux tubes
generated at the edge of the convective core of massive stars through their radiative
envelope and apply this model to the FeCZ and the overlying radiative
layer. The magnetic field strength B0 in the iron convection
zone is estimated assuming equipartition of
kinetic energy density and magnetic energy
density inside the convective layers:
| (12) |
which, for our 60
As a consequence, even though we are far from a detailed picture, it seems conceivable that the FeCZs in massive main sequence stars produce localized magnetic fields at their surface. The interaction of the stellar wind with the localized surface magnetic fields could enhance the rate at which the wind induces a loss of stellar angular momentum. Furthermore, co-rotating density patterns in the outflowing wind could be produced by these local magnetic spots.
Rotation may play an important role in the dynamo process, possibly resulting in the appearance of stronger fields at the surface for faster rotating stars. To estimate this effect, a dynamo model accounting for the differential rotation needs to be implemented in the stellar evolution calculations. This will be discussed in a subsequent paper.
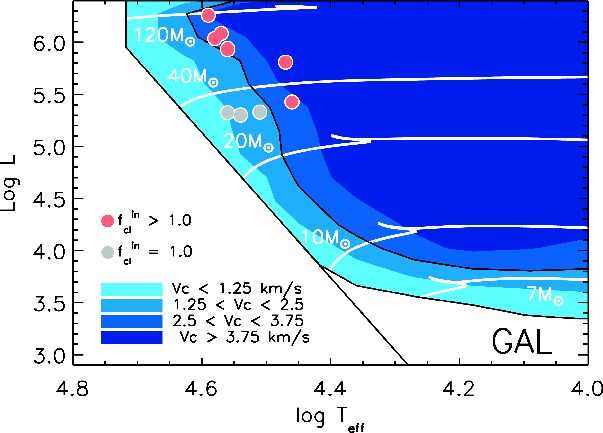 |
Figure 12:
Average convective velocity within 1.5 pressure scale heights of the
upper border of the iron convection zone in our models, as function of the location
in the HR diagram (see color scale), based on evolutionary models between 5
|
| Open with DEXTER | |
4.4.2 Observations
Surface magnetic fields have been linked to several observed phenomena in OB stars, e.g. discrete absorption components (DACs) in UV resonance lines (e.g., Massa et al. 1995; Prinja et al. 2002; Prinja & Howarth 1988; Kaper et al. 1997), which are thought to diagnose large scale coherent wind anisotropies (Lobel & Blomme 2008; Cranmer & Owocki 1996), or the less coherent line profile variability mentioned above (Fullerton et al. 1996,1997). Also non-thermal X-ray emission of OB main sequence stars has been proposed to relate to surface magnetic fields (e.g., Babel & Montmerle 1997; ud-Doula & Owocki 2002).
A connection of the FeCZ in massive stars
with the phenomena mentioned above has not yet been considered.
However, such a connection becomes testable through our results.
While in our comparison to observed microturbulence presented above
we discussed when sub-surface convection may lead to detectable surface velocity
fluctuations, the presence of surface magnetic fields may simply depend on
whether an FeCZ is present in the star or not.
Looking at Fig. 9, we see that in our models the FeCZ
is absent for luminosities below about
![]() ,
,
![]() ,
and
,
and
![]() for the Galaxy, LMC and SMC, respectively. If DACs or line profile variability
were produced by magnetic flux tubes generated in the FeCZ,
those phenomena would not be expected for OB stars below those luminosities.
Howarth & Prinja (1989) find DACs in nearly all O stars (97%)
in a large Galactic sample, with
for the Galaxy, LMC and SMC, respectively. If DACs or line profile variability
were produced by magnetic flux tubes generated in the FeCZ,
those phenomena would not be expected for OB stars below those luminosities.
Howarth & Prinja (1989) find DACs in nearly all O stars (97%)
in a large Galactic sample, with
![]() and with effective temperatures
as high as the zero-age main sequence values of stars above
and with effective temperatures
as high as the zero-age main sequence values of stars above
![]() .
Since those stars are well above the luminosity threshold for the occurrence of the
iron convection at Galactic metallicity, these observations do not
exclude DACs being due to FeCZ induced B-fields.
Also, all eleven early B supergiants with DACs in the sample
of Prinja et al. (2002)
are predicted to have strong FeCZ by our results.
Notably, between about
.
Since those stars are well above the luminosity threshold for the occurrence of the
iron convection at Galactic metallicity, these observations do not
exclude DACs being due to FeCZ induced B-fields.
Also, all eleven early B supergiants with DACs in the sample
of Prinja et al. (2002)
are predicted to have strong FeCZ by our results.
Notably, between about
![]() and
and
![]() ,
stars
close to the zero-age main sequence are not predicted to be pulsationally
unstable (cf. Fig. 11), which may be in conflict with
pulsations as the origin for DACs.
,
stars
close to the zero-age main sequence are not predicted to be pulsationally
unstable (cf. Fig. 11), which may be in conflict with
pulsations as the origin for DACs.
4.4.3 Other types of fields
It may be interesting to briefly compare the expectation
from surface magnetic fields produced via the FeCZ to that for
fields produced by other means. Surface fields produced by convective cores
(Charbonneau & MacGregor 2001; MacGregor & Cassinelli 2003; Schuessler & Paehler 1978) have been proposed to relate to the same phenomena as those
mentioned above, even if for massive stars the buoyant rise of magnetic fields from the convective core seems to be unlikely (MacDonald & Mullan 2004).
In contrast to the sub-surface FeCZ, convective cores
are prevalent in all stars above about 1.2
![]() .
It has been found
that the longer lifetime of stars of lower
mass may favor the drift of fields produced in the core to the surface (MacGregor & Cassinelli 2003; Schuessler & Paehler 1978).
Therefore, the expected trend is opposite to that found for fields produced
by the FeCZ, where surface fields may occur only for stars
above a critical mass (or luminosity), and stronger fields are found for
more massive stars.
.
It has been found
that the longer lifetime of stars of lower
mass may favor the drift of fields produced in the core to the surface (MacGregor & Cassinelli 2003; Schuessler & Paehler 1978).
Therefore, the expected trend is opposite to that found for fields produced
by the FeCZ, where surface fields may occur only for stars
above a critical mass (or luminosity), and stronger fields are found for
more massive stars.
On the other hand, in contrast to fields from the FeCZ, magnetic flux tubes produced in the core may carry CNO-processed material to the surface. This might thus constitute a mechanism to explaining nitrogen enrichment in slowly rotating early B stars (Hunter et al. 2008a; Morel et al. 2008,2006). Strong fossil magnetic fields are thought to persist in only a fraction of massive stars (Ferrario & Wickramasinghe 2005; Braithwaite & Spruit 2004), and may lead to, among other phenomena, highly anomalous surface chemical compositions, wind confinement, and variable X-ray emission (e.g., Wade et al. 2006; Townsend et al. 2005). Those strong features can clearly not be produced by fields originating from the FeCZs.
Finally, magnetic fields produced in differentially rotating massive stars by the Spruit-Taylor dynamo (Spruit 2002) may transport angular momentum and chemical species (cf., Heger et al. 2005). These fields are predominantly of toroidal geometry and would quickly decay near the stellar surface, and are thus not thought to lead to observable fields at the stellar surface (but see also Mullan & MacDonald 2005).
5 Concluding remarks
Hot luminous stars show a variety of phenomena at their photosphere and in their winds which still lack a clear physical interpretation at this time. Among these phenomena are photospheric turbulence, spectral line variability (DACs and LPVs; see Sect. 4), wind clumping, variable or constant non-thermal X-ray and radio emission, chemical composition anomalies, and intrinsic slow rotation. In the previous section, we argued that the iron convection zone could be responsible for various of these phenomena.
We proposed in Sect. 4.1 that a physical connection may exist between microturbulence in hot star atmospheres and a sub-surface FeCZ. The strength of the FeCZ is predicted to increase with increasing metallicity Z, decreasing effective temperature T and increasing luminosity L (Sect. 3), and all three predicted trends are reflected in the observational data. This suggests that microturbulence corresponds to a physical motion of the gas in hot star atmospheres. This motion may then be connected to wind clumping (Sect. 4.3), since the empirical microturbulent velocities are comparable to the local sound speed at the stellar surface. In order to verify such a picture, multi-dimensional calculations of the FeCZ and the radiative layers above, including the stellar atmosphere, are required - similar to the recent generation of atmosphere models for cool stars (e.g., Wedemeyer et al. 2004; Asplund et al. 1999).
In Sect. 4.4, we proposed that the FeCZ in hot stars might also produce
localized surface magnetic fields, in Galactic stars for luminosities above
![]() .
This could explain the occurrence of DACs (discrete absorption
components in UV absorption lines), also in very hot main sequence stars for which pulsational
instabilities are not predicted.
We further argued that there may be regions of the upper HR diagram for which the presence of
the FeCZ influences, or even excites, non-radial
stellar pulsations (Sect. 4.2).
.
This could explain the occurrence of DACs (discrete absorption
components in UV absorption lines), also in very hot main sequence stars for which pulsational
instabilities are not predicted.
We further argued that there may be regions of the upper HR diagram for which the presence of
the FeCZ influences, or even excites, non-radial
stellar pulsations (Sect. 4.2).
The FeCZ could also turn out to directly affect the evolution of hot massive stars. If it induces wind clumping, it may alter the stellar wind mass-loss rate. Such a change would also influence the angular momentum loss. In addition magnetic fields produced by the iron convection zone could lead to an enhanced rate of angular momentum loss. These effects become weaker for lower metallicity, where the FeCZ is less prominent or absent (see Sect. 3).
Finally, we note that the consequences of the FeCZ might be strongest in Wolf-Rayet stars. These stars are so hot that the iron opacity peak, and therefore the FeCZ, can be directly at the stellar surface, or - to be more precise - at the sonic point of the wind flow (Heger & Langer 1996). This may relate to the very strong clumping found observationally in Wolf-Rayet winds (Marchenko et al. 2006; Lépine & Moffat 1999), and may be required for an understanding of the very high mass-loss rates of Wolf-Rayet stars (Kato & Iben 1992; Heger & Langer 1996; Eichler et al. 1995).
Acknowledgements
The authors would like to thank Myron Smith, Alex Fullerton, Derk Massa and the members of the VLT-FLAMES consortium. M.C. wants to thank the STScI for kind hospitality and the Leids Kerkhoven-Bosscha Fonds for financial support. S.-C. Y. is supported by the DOE SciDAC Program (DOE DE-FC02-06ER41438).
References
- Abbett, W. P., Beaver, M., Davids, B., et al. 1997, ApJ, 480, 395 [NASA ADS] [CrossRef]
- Aerts, C., Puls, J., Godart, M., & Dupret, M. 2008, ArXiv e-prints (In the text)
- Asplund, M., Nordlund, Å., Trampedach, R., & Stein, R. F. 1999, A&A, 346, L17 [NASA ADS]
- Asplund, M., Grevesse, N., & Sauval, A. J. 2005, in Cosmic Abundances as Records of Stellar Evolution and Nucleosynthesis, ed. T. G. Barnes, III, & F. N. Bash, ASP Conf. Ser., 336, 25 (In the text)
- Babel, J., & Montmerle, T. 1997, ApJ, 485, L29 [NASA ADS] [CrossRef]
- Badnell, N. R., Bautista, M. A., Butler, K., et al. 2005, MNRAS, 360, 458 [NASA ADS] [CrossRef]
- Böhm-Vitense, E. 1958, Z. Astrophys., 46, 108 [NASA ADS] (In the text)
- Braithwaite, J., & Spruit, H. C. 2004, Nature, 431, 819 [NASA ADS] [CrossRef]
- Charbonneau, P., & MacGregor, K. B. 2001, ApJ, 559, 1094 [NASA ADS] [CrossRef]
- Charpinet, S., Fontaine, G., Brassard, P., et al. 1997, ApJ, 483, L123 [NASA ADS] [CrossRef]
- Cowley, C. R. 1970, The theory of stellar spectra Topics in Astrophysics and Space Physics (New York: Gordon and Breach) (In the text)
- Cranmer, S. R., & Owocki, S. P. 1996, ApJ, 462, 469 [NASA ADS] [CrossRef]
- Davies, B., Oudmaijer, R. D., & Vink, J. S. 2005, A&A, 439, 1107 [NASA ADS] [CrossRef] [EDP Sciences] (In the text)
- Davies, B., Vink, J. S., & Oudmaijer, R. D. 2007, A&A, 469, 1045 [NASA ADS] [CrossRef] [EDP Sciences] (In the text)
- Deng, L., & Xiong, D. R. 2001, MNRAS, 327, 881 [NASA ADS] [CrossRef] (In the text)
- Dupret, M. A. 2001, A&A, 366, 166 [NASA ADS] [CrossRef] [EDP Sciences]
- Dziembowski, W. A. 2008, ArXiv e-prints (In the text)
- Edmunds, M. G. 1978, A&A, 64, 103 [NASA ADS] (In the text)
- Eichler, D., Bar Shalom, A., & Oreg, J. 1995, ApJ, 448, 858 [NASA ADS] [CrossRef]
- Endal, A. S., & Sofia, S. 1978, ApJ, 220, 279 [NASA ADS] [CrossRef]
- Evans, C. J., Smartt, S. J., Lee, J.-K., et al. 2005, A&A, 437, 467 [NASA ADS] [CrossRef] [EDP Sciences] (In the text)
- Eversberg, T., Lepine, S., & Moffat, A. F. J. 1998, ApJ, 494, 799 [NASA ADS] [CrossRef] (In the text)
- Ferrario, L., & Wickramasinghe, D. T. 2005, MNRAS, 356, 615 [NASA ADS] [CrossRef]
- Fullerton, A. W., Gies, D. R., & Bolton, C. T. 1996, ApJS, 103, 475 [NASA ADS] [CrossRef]
- Fullerton, A. W., Massa, D. L., Prinja, R. K., Owocki, S. P., & Cranmer, S. R. 1997, A&A, 327, 699 [NASA ADS]
- Gies, D. R., & Lambert, D. L. 1992, ApJ, 387, 673 [NASA ADS] [CrossRef]
- Glatzel, W., & Mehren, S. 1996, MNRAS, 282, 1470 [NASA ADS] (In the text)
- Goldreich, P., & Kumar, P. 1990, ApJ, 363, 694 [NASA ADS] [CrossRef] (In the text)
- Grosdidier, Y., Moffat, A. F. J., Joncas, G., & Acker, A. 1998, ApJ, 506, L127 [NASA ADS] [CrossRef] (In the text)
- Harries, T. J., Howarth, I. D., & Evans, C. J. 2002, MNRAS, 337, 341 [NASA ADS] [CrossRef] (In the text)
- Heger, A., & Langer, N. 1996, A&A, 315, 421 [NASA ADS] (In the text)
- Heger, A., Langer, N., & Woosley, S. E. 2000, ApJ, 528, 368 [NASA ADS] [CrossRef] (In the text)
- Heger, A., Woosley, S. E., & Spruit, H. C. 2005, ApJ, 626, 350 [NASA ADS] [CrossRef] (In the text)
- Herrero, A., Kudritzki, R. P., Vilchez, J. M., et al. 1992, A&A, 261, 209 [NASA ADS]
- Hibbins, R. E., Dufton, P. L., Smartt, S. J., & Rolleston, W. R. J. 1998, A&A, 332, 681 [NASA ADS]
- Howarth, I. D., & Prinja, R. K. 1989, ApJS, 69, 527 [NASA ADS] [CrossRef] (In the text)
- Hubeny, I., Heap, S. R., & Altner, B. 1991, ApJ, 377, L33 [NASA ADS] [CrossRef] (In the text)
- Hunter, I., Dufton, P. L., Smartt, S. J., et al. 2007, A&A, 466, 277 [NASA ADS] [CrossRef] [EDP Sciences]
- Hunter, I., Brott, I., Lennon, D. J., et al. 2008a, ApJ, 676, L29 [NASA ADS] [CrossRef]
- Hunter, I., Lennon, D. J., Dufton, P. L., et al. 2008b, A&A, 479, 541 [NASA ADS] [CrossRef] [EDP Sciences] (In the text)
- Iglesias, C. A., & Rogers, F. J. 1996, ApJ, 464, 943 [NASA ADS] [CrossRef] (In the text)
- Iglesias, C. A., Rogers, F. J., & Wilson, B. G. 1992, ApJ, 397, 717 [NASA ADS] [CrossRef] (In the text)
- Kaper, L., Henrichs, H. F., Fullerton, A. W., et al. 1997, A&A, 327, 281 [NASA ADS]
- Kato, M., & Iben, I. J. 1992, ApJ, 394, 305 [NASA ADS] [CrossRef]
- Kippenhahn, R., & Weigert, A. 1990, Stellar Structure and Evolution XVI (Berlin Heidelberg New York: Springer-Verlag), Astron. Astrophys. Library, 468, 192 (In the text)
- Kiriakidis, M., Fricke, K. J., & Glatzel, W. 1993, MNRAS, 264, 50 [NASA ADS] (In the text)
- Lefever, K., Puls, J., & Aerts, C. 2007, A&A, 463, 1093 [NASA ADS] [CrossRef] [EDP Sciences] (In the text)
- Leibacher, J. W., & Stein, R. F. 1971, Astrophys. Lett., 7, 191 [NASA ADS]
- Lennon, D. J., Dufton, P. L., & Crowley, C. 2003, A&A, 398, 455 [NASA ADS] [CrossRef] [EDP Sciences]
- Lépine, S., & Moffat, A. F. J. 1999, ApJ, 514, 909 [NASA ADS] [CrossRef] (In the text)
- Lepine, S., & Moffat, A. F. J. 2008, ArXiv e-prints, 805 (In the text)
- Lighthill, M. F. 1967, in Aerodynamic Phenomena in Stellar Atmospheres, ed. R. N. Thomas, IAU Symp., 28, 429 (In the text)
- Lighthill, M. J. 1952, Royal Soc. London Proc. Ser. A, 211, 564 [NASA ADS] [CrossRef] (In the text)
- Lobel, A., & Blomme, R. 2008, ApJ, 678, 408 [NASA ADS] [CrossRef]
- Ludwig, H.-G., Freytag, B., & Steffen, M. 1999, A&A, 346, 111 [NASA ADS]
- Lyubimkov, L. S., Rostopchin, S. I., & Lambert, D. L. 2004, MNRAS, 351, 745 [NASA ADS] [CrossRef] (In the text)
- MacDonald, J., & Mullan, D. J. 2004, MNRAS, 348, 702 [NASA ADS] [CrossRef] (In the text)
- MacGregor, K. B., & Cassinelli, J. P. 2003, ApJ, 586, 480 [NASA ADS] [CrossRef] (In the text)
- Maeder, A., Georgy, C., & Meynet, G. 2008, A&A, 479, L37 [NASA ADS] [CrossRef] [EDP Sciences] (In the text)
- Marchenko, S. V., Moffat, A. F. J., St-Louis, N., & Fullerton, A. W. 2006, ApJ, 639, L75 [NASA ADS] [CrossRef]
- Massa, D., Fullerton, A. W., Nichols, J. S., et al. 1995, ApJ, 452, L53 [NASA ADS]
- Massey, P., Puls, J., Pauldrach, A. W. A., et al. 2005, ApJ, 627, 477 [NASA ADS] [CrossRef]
- Mokiem, M. R., de Koter, A., Evans, C. J., et al. 2007, A&A, 465, 1003 [NASA ADS] [CrossRef] [EDP Sciences]
- Morel, T., Butler, K., Aerts, C., Neiner, C., & Briquet, M. 2006, A&A, 457, 651 [NASA ADS] [CrossRef] [EDP Sciences]
- Morel, T., Hubrig, S., & Briquet, M. 2008, A&A, 481, 453 [NASA ADS] [CrossRef] [EDP Sciences]
- Mullan, D. J., & MacDonald, J. 2005, MNRAS, 356, 1139 [NASA ADS] [CrossRef] (In the text)
- Owocki, S. P., & Puls, J. 1999, ApJ, 510, 355 [NASA ADS] [CrossRef]
- Pamyatnykh, A. A. 1999, Acta Astron., 49, 119 [NASA ADS]
- Parker, E. N. 1975, ApJ, 198, 205 [NASA ADS] [CrossRef]
- Petrovic, J., Langer, N., Yoon, S.-C., & Heger, A. 2005, A&A, 435, 247 [NASA ADS] [CrossRef] [EDP Sciences]
- Pinsonneault, M. H., Kawaler, S. D., Sofia, S., & Demarque, P. 1989, ApJ, 338, 424 [NASA ADS] [CrossRef]
- Prinja, R. K., & Howarth, I. D. 1988, MNRAS, 233, 123 [NASA ADS]
- Prinja, R. K., Massa, D., & Fullerton, A. W. 2002, A&A, 388, 587 [NASA ADS] [CrossRef] [EDP Sciences]
- Puls, J., Markova, N., Scuderi, S., et al. 2006, A&A, 454, 625 [NASA ADS] [CrossRef] [EDP Sciences] (In the text)
- Rolleston, W. R. J., Brown, P. J. F., Dufton, P. L., & Howarth, I. D. 1996, A&A, 315, 95 [NASA ADS]
- Runacres, M. C., & Owocki, S. P. 2002, A&A, 381, 1015 [NASA ADS] [CrossRef] [EDP Sciences]
- Runacres, M. C., & Owocki, S. P. 2005, A&A, 429, 323 [NASA ADS] [CrossRef] [EDP Sciences]
- Saio, H. 1993, MNRAS, 260, 465 [NASA ADS]
- Saio, H., Kuschnig, R., Gautschy, A., et al. 2006, ApJ, 650, 1111 [NASA ADS] [CrossRef] (In the text)
- Schuessler, M., & Paehler, A. 1978, A&A, 68, 57 [NASA ADS]
- Shore, S. N. 1992, An introduction to astrophysical hydrodynamics (San Diego: Academic Press) (In the text)
- Smith, K. C., & Howarth, I. D. 1998, MNRAS, 299, 1146 [NASA ADS] [CrossRef] (In the text)
- Spiegel, E. A., & Weiss, N. O. 1980, Nature, 287, 616 [NASA ADS] [CrossRef]
- Spiegel, E. A., & Zahn, J.-P. 1992, A&A, 265, 106 [NASA ADS]
- Spitzer, L. 1962, Physics of Fully Ionized Gases, 2nd edn. (New York: Interscience) (In the text)
- Spruit, H. C. 2002, A&A, 381, 923 [NASA ADS] [CrossRef] [EDP Sciences] (In the text)
- Stankov, A., & Handler, G. 2005, ApJS, 158, 193 [NASA ADS] [CrossRef] (In the text)
- Stein, R. F. 1967, Sol. Phys., 2, 385 [NASA ADS] [CrossRef] (In the text)
- Stothers, R. B., & Chin, C.-W. 1993, ApJ, 408, L85 [NASA ADS] [CrossRef] (In the text)
- Townsend, R. H. D., Owocki, S. P., & Groote, D. 2005, ApJ, 630, L81 [NASA ADS] [CrossRef]
- Trundle, C., & Lennon, D. J. 2005, A&A, 434, 677 [NASA ADS] [CrossRef] [EDP Sciences]
- Trundle, C., Dufton, P. L., Hunter, I., et al. 2007, A&A, 471, 625 [NASA ADS] [CrossRef] [EDP Sciences] (In the text)
- Ud-Doula, A. & Owocki, S. P. 2002, ApJ, 576, 413 [NASA ADS] [CrossRef]
- Ulrich, R. K. 1970, ApJ, 162, 993 [NASA ADS] [CrossRef]
- van Leeuwen, F., van Genderen, A. M., & Zegelaar, I. 1998, A&AS, 128, 117 [NASA ADS] [CrossRef] [EDP Sciences] (In the text)
- Vink, J. S., de Koter, A., & Lamers, H. J. G. L. M. 2001, A&A, 369, 574 [NASA ADS] [CrossRef] [EDP Sciences] (In the text)
- Vrancken, M., Lennon, D. J., Dufton, P. L., & Lambert, D. L. 2000, A&A, 358, 639 [NASA ADS]
- Wade, G. A., Fullerton, A. W., Donati, J.-F., et al. 2006, A&A, 451, 195 [NASA ADS] [CrossRef] [EDP Sciences]
- Wedemeyer, S., Freytag, B., Steffen, M., Ludwig, H.-G., & Holweger, H. 2004, A&A, 414, 1121 [NASA ADS] [CrossRef] [EDP Sciences]
- Yoon, S.-C., Langer, N., & Norman, C. 2006, A&A, 460, 199 [NASA ADS] [CrossRef] [EDP Sciences]
Online Material
Appendix A: Models
Table A.1:
Outermost 4
![]() of a 60
of a 60
![]() model at solar metallicity (Z=0.02). The table shows physical variables at t =
model at solar metallicity (Z=0.02). The table shows physical variables at t =
![]() years. Columns
contain the progressive grid point of the model, the status (
years. Columns
contain the progressive grid point of the model, the status (
![]() ,
,
![]() ), the optical depth
), the optical depth ![]() ,
the opacity
,
the opacity ![]() ,
the density
,
the density ![]() ,
the radius R, the value M*-Mr (where M* is the total stellar mass and Mr is the mass coordinate), the temperature T,
the convective velocity
,
the radius R, the value M*-Mr (where M* is the total stellar mass and Mr is the mass coordinate), the temperature T,
the convective velocity ![]() and the local sound speed
and the local sound speed ![]() .
All the values are in cgs units if not otherwise specified.
.
All the values are in cgs units if not otherwise specified.
Table A.2:
Outermost 1
![]() of a 20
of a 20
![]() model at solar metallicity (Z=0.02). The table shows the physical variables at t =
model at solar metallicity (Z=0.02). The table shows the physical variables at t =
![]() years. Columns
contain the progressive grid point of the model, the status (R = radiative,
C = convective), the optical depth
years. Columns
contain the progressive grid point of the model, the status (R = radiative,
C = convective), the optical depth ![]() ,
the opacity
,
the opacity ![]() ,
the density
,
the density ![]() ,
the radius R, the value M*-Mr (where M* is the total stellar mass and Mr is the mass coordinate), the temperature T,
the convective velocity
,
the radius R, the value M*-Mr (where M* is the total stellar mass and Mr is the mass coordinate), the temperature T,
the convective velocity ![]() and the local sound speed
and the local sound speed ![]() .
All the values are in cgs units if not otherwise specified.
.
All the values are in cgs units if not otherwise specified.
Footnotes
- ... consequences
- Tables A.1 and A.2 are only available in electronic form via http://www.aanda.org
All Tables
Table 1:
Properties of the envelope convection zones in our 20 and
60
![]() models of solar metallicity. These are the same models shown in the top panel of Figs. 2 and in 3. The values in the table refer
to t =
models of solar metallicity. These are the same models shown in the top panel of Figs. 2 and in 3. The values in the table refer
to t =
![]() for the 20
for the 20
![]() model and t =
model and t =
![]() for the 60
for the 60
![]() model.
model.
Table A.1:
Outermost 4
![]() of a 60
of a 60
![]() model at solar metallicity (Z=0.02). The table shows physical variables at t =
model at solar metallicity (Z=0.02). The table shows physical variables at t =
![]() years. Columns
contain the progressive grid point of the model, the status (
years. Columns
contain the progressive grid point of the model, the status (
![]() ,
,
![]() ), the optical depth
), the optical depth ![]() ,
the opacity
,
the opacity ![]() ,
the density
,
the density ![]() ,
the radius R, the value M*-Mr (where M* is the total stellar mass and Mr is the mass coordinate), the temperature T,
the convective velocity
,
the radius R, the value M*-Mr (where M* is the total stellar mass and Mr is the mass coordinate), the temperature T,
the convective velocity ![]() and the local sound speed
and the local sound speed ![]() .
All the values are in cgs units if not otherwise specified.
.
All the values are in cgs units if not otherwise specified.
Table A.2:
Outermost 1
![]() of a 20
of a 20
![]() model at solar metallicity (Z=0.02). The table shows the physical variables at t =
model at solar metallicity (Z=0.02). The table shows the physical variables at t =
![]() years. Columns
contain the progressive grid point of the model, the status (R = radiative,
C = convective), the optical depth
years. Columns
contain the progressive grid point of the model, the status (R = radiative,
C = convective), the optical depth ![]() ,
the opacity
,
the opacity ![]() ,
the density
,
the density ![]() ,
the radius R, the value M*-Mr (where M* is the total stellar mass and Mr is the mass coordinate), the temperature T,
the convective velocity
,
the radius R, the value M*-Mr (where M* is the total stellar mass and Mr is the mass coordinate), the temperature T,
the convective velocity ![]() and the local sound speed
and the local sound speed ![]() .
All the values are in cgs units if not otherwise specified.
.
All the values are in cgs units if not otherwise specified.
All Figures
| |
Figure 1:
Opacity in the interior of 60
|
| Open with DEXTER | |
| In the text | |
| |
Figure 2:
Evolution of the radial extent of the helium and iron convective regions
(hatched) as function of time,
from the zero age main sequence to roughly the end of core hydrogen burning, for a 20
|
| Open with DEXTER | |
| In the text | |
| |
Figure 3:
Same as Fig. 2, but for a 60
|
| Open with DEXTER | |
| In the text | |
| |
Figure 4:
Convective velocity in the FeCZ as function of radial distance from the stellar surface. The dotted line
corresponds to a non-rotating 20
|
| Open with DEXTER | |
| In the text | |
| |
Figure 5: Schematic representation of the physical processes connected to sub-surface convection. Acoustic and gravity waves emitted in the convective zone travel through the radiative layer and reach the surface, inducing density and velocity fluctuations. In this picture microturbulence and clumping at the base of the wind are a consequence of the presence of sub-surface convection. Buoyant magnetic flux tubes produced in the convection zone could rise to the stellar surface. |
| Open with DEXTER | |
| In the text | |
| |
Figure 6:
Projected rotational velocity
|
| Open with DEXTER | |
| In the text | |
| |
Figure 7:
Logarithm of surface gravity versus microturbulent velocity |
| Open with DEXTER | |
| In the text | |
| |
Figure 8:
Values of the ratio
|
| Open with DEXTER | |
| In the text | |
| |
Figure 9:
Average convective velocity within 1.5 pressure scale heights of the
upper border of the iron convection zone in our models, as function of the location
in the HR diagram (see color scale), based on evolutionary models between 5
|
| Open with DEXTER | |
| In the text | |
| |
Figure 10:
Values of the mass discrepancy (evolutionary mass divided
by spectroscopic mass) as function of microturbulent velocity in the
sample of B stars analysed by Trundle et al. (2007) and Hunter et al. (2008b).
Here, we use only data for stars with an apparent rotational velocity of
|
| Open with DEXTER | |
| In the text | |
| |
Figure 11:
The plot shows regions of the HR diagram where pulsational instabilities are predicted, compared to our calculations for the occurrence
of iron convection. The cloudy region marks the presence of iron sub-surface convection with
|
| Open with DEXTER | |
| In the text | |
| |
Figure 12:
Average convective velocity within 1.5 pressure scale heights of the
upper border of the iron convection zone in our models, as function of the location
in the HR diagram (see color scale), based on evolutionary models between 5
|
| Open with DEXTER | |
| In the text | |
Copyright ESO 2009
Current usage metrics show cumulative count of Article Views (full-text article views including HTML views, PDF and ePub downloads, according to the available data) and Abstracts Views on Vision4Press platform.
Data correspond to usage on the plateform after 2015. The current usage metrics is available 48-96 hours after online publication and is updated daily on week days.
Initial download of the metrics may take a while.