| Issue |
A&A
Volume 499, Number 1, May III 2009
|
|
|---|---|---|
| Page(s) | 21 - 29 | |
| Section | Cosmology (including clusters of galaxies) | |
| DOI | https://doi.org/10.1051/0004-6361/200810693 | |
| Published online | 12 March 2009 | |
Constraints on CDM cosmology from galaxy power spectrum, CMB and SNIa evolution
L. D. Ferramacho1,3 - A. Blanchard1 - Y. Zolnierowski2
1 - Laboratoire d'Astrophysique de Toulouse-Tarbes, Université de Toulouse, CNRS, 14 Avenue E. Belin, 31400 Toulouse, France
2 - LAPP, Université de Savoie, CNRS/IN2P3, Annecy-le-Vieux, France
3 - CENTRA, Departamento de Física, Edíficio Ciência, Instituto Superior Técnico, Av. Rovisco Pais 1, 1049-001 Lisboa, Porugal
Received 28 July 2008 / Accepted 4 February 2009
Abstract
Aims. We examine the constraints that can be obtained on standard cold dark matter models from the most currently used data set: CMB anisotropies, type Ia supernovae and the SDSS luminous red galaxies. We also examine how these constraints are widened when the equation of state parameter w and the curvature parameter
![]() are left as free parameters. Finally, we investigate the impact on these constraints of a possible form of evolution in SNIa intrinsic luminosity.
are left as free parameters. Finally, we investigate the impact on these constraints of a possible form of evolution in SNIa intrinsic luminosity.
Methods. We obtained our results from MCMC analysis using the full likelihood of each data set.
Results. For the ![]() CDM model, our ``vanilla'' model, cosmological parameters are tightly constrained and consistent with current estimates from various methods. When the dark energy parameter w is free we find that the constraints remain mostly unchanged, i.e. changes are smaller than the 1 sigma uncertainties. Similarly, relaxing the assumption of a flat universe leads to nearly identical constraints on the dark energy density parameter of the universe
CDM model, our ``vanilla'' model, cosmological parameters are tightly constrained and consistent with current estimates from various methods. When the dark energy parameter w is free we find that the constraints remain mostly unchanged, i.e. changes are smaller than the 1 sigma uncertainties. Similarly, relaxing the assumption of a flat universe leads to nearly identical constraints on the dark energy density parameter of the universe
![]() ,
baryon density of the universe
,
baryon density of the universe
![]() ,
the optical depth
,
the optical depth ![]() ,
the index of the power spectrum of primordial fluctuations
,
the index of the power spectrum of primordial fluctuations ![]() ,
with most one sigma uncertainties better than 5%. More significant changes appear on other parameters: while preferred values are almost unchanged, uncertainties for the physical dark matter density
,
with most one sigma uncertainties better than 5%. More significant changes appear on other parameters: while preferred values are almost unchanged, uncertainties for the physical dark matter density
![]() ,
Hubble constant H0 and
,
Hubble constant H0 and ![]() are typically twice as large. The constraint on the age of the Universe, which is very accurate for the vanilla model, is the most degraded. We found that different methodological approaches on large scale structure estimates lead to appreciable differences in preferred values and uncertainty widths. We found that possible evolution in SNIa intrinsic luminosity does not alter these constraints by much, except for w, for which the uncertainty is twice as large. At the same time, this possible evolution is severely constrained.
are typically twice as large. The constraint on the age of the Universe, which is very accurate for the vanilla model, is the most degraded. We found that different methodological approaches on large scale structure estimates lead to appreciable differences in preferred values and uncertainty widths. We found that possible evolution in SNIa intrinsic luminosity does not alter these constraints by much, except for w, for which the uncertainty is twice as large. At the same time, this possible evolution is severely constrained.
Conclusions. We conclude that systematic uncertainties for some estimated quantities are similar or larger than statistical ones.
Key words: cosmology: cosmological parameters - cosmology: observations
1 Introduction
The field of cosmology has made impressive developments in the past decade. It is now widely accepted that the present universe is well represented by a dark energy dominated universe with dark matter being in the form of a cold component and matter fluctuations arising from primordial adiabatic Gaussian fluctuations generated in the early universe, a picture consistent with simple inflationary models.
Such a paradigm was obtained after a remarkable advance in the quality of observational data. The Hubble diagram derived from type Ia supernovae allowed to obtain the first evidence for dark energy and provided measurements on the properties of this component (Perlmutter et al. 1999; Riess et al. 1998). Another important contribution came from the results of the Wilkinson Microwave Anisotropy Probe (WMAP) (Spergel et al. 2003, 2007), which have provided strong constraints on many cosmological parameters and allowed for precise estimations of cosmological parameters . Those constraints are consistent with a wide set of constraints coming from different cosmological tests and have considerably reinforced early claims of flat cosmology (Lineweaver et al. 1997; Webster et al. 1998). The use of combined constraints is therefore a way to increase the accuracy of cosmological parameter estimations and reduce degeneracies.
Among the many different cosmological tests available beyond the CMB, two are particularly robust and based on geometrical considerations: the already mentioned Hubble diagram of type Ia supernovae, and the recent large
galaxy surveys that provided a first detection of the predicted baryonic acoustic oscillations (Eisenstein et al. 2005, E05 hereafter; Tegmark et al. 2006, T06 hereafter; Percival et al. 2007). All these observations reinforce the case of the concordance model in cosmology, in which the Universe appears to be in an accelerated expansion due to some ``dark energy'' whose true nature remains one of cosmology's most compelling mysteries. The ability of the concordance model
to accommodate recent high precision data is indeed impressive. Although alternative views exist, it is fair to say that the so called concordance cosmology has led to specific predictions that were verified a posteriori. The most common interpretations for this ``dark energy'' are an unknown energy component of the Universe or a modification in the equations of general relativity (for some reviews on this subject, see Frieman et al. 2008; Padmanabhan 2006). In order to distinguish between models beyond the ![]() CDM model, one needs to have very good constraints on the equation of state of dark energy by combining reliable results from quality observations. Some multi-observational constraints have been published recently (Tegmark et al. 2006; Komatsu et al. 2008; Kowalski et al. 2008; Wright 2007; Xia et al. 2008), but do not include a detailed likelihood analysis of the three most recent observational data sets (i.e. information from one or several data sets was reduced to a single number).
CDM model, one needs to have very good constraints on the equation of state of dark energy by combining reliable results from quality observations. Some multi-observational constraints have been published recently (Tegmark et al. 2006; Komatsu et al. 2008; Kowalski et al. 2008; Wright 2007; Xia et al. 2008), but do not include a detailed likelihood analysis of the three most recent observational data sets (i.e. information from one or several data sets was reduced to a single number).
In this paper, we propose to constrain several cosmological parameters, including the w parameter in the equation of state of dark energy (supposed constant), using the recent results on the matter power spectrum of LRG galaxies, SNIa and WMAP-5 year data. Although there are other promising methods to test cosmological models and dark energy properties, such as galaxy clusters (Vikhlinin et al. 2008; Allen et al. 2008) or weak lensing (Benjamin et al. 2008), we have not included these in our analysis due to the level of incertitude that may still be present in these methods (Ferramacho & Blanchard 2007; Vauclair et al. 2005; Nuza & Blanchard 2006; Blanchard & Douspis 2005). Given the high number of parameters to be constrained, we adopt the Markov chain Monte Carlo (MCMC) method to perform our analysis. The paper is structured as follows: in Sect. 2 we present and discuss the quality of the data. In Sect. 3 we describe the method and the cosmological models to be constrained and in Sect. 4 we present the obtained results. Our conclusions are given in Sect. 5.
Table 1: Summary of the posterior distribution mean values for the different sets of parameters constrained, with the corresponding 68% confidence intervals.
![\begin{figure}
\par\includegraphics[width=16.7cm,clip]{10693fig1.eps}
\end{figure}](/articles/aa/full_html/2009/19/aa10693-08/img68.png) |
Figure 1:
Posterior distributions for the parameters constrained in our MCMC analysis. Doted curves represent the mean likelihood of the samples, while solid lines show the fully marginalized posterior. The four parameter sets constrained are represented by different colours: Vanilla (black), Vanilla +
|
| Open with DEXTER | |
2 Data
2.1 CMB
We use the 5-year data from the WMAP team available at website http://lambda.gsfc.nasa.gov, which consists of the all-sky anisotropy maps of the cosmic microwave background (CMB) in fits format together with a likelihood code which allows us to read these maps and calculate the TT and TE power spectra and use them to obtain the likelihood of a given cosmological model. We also include the recent ACBAR data (Reichardt et al. 2008) which provide additional stringent data on small scales. The new generation of codes publicly available that compute very efficiently the predicted CMB anisotropies in the line of CMBFAST (Seljak & Zaldarriaga 1996) have revolutionised the approach of constraining cosmological parameters from CMB data.
2.2 SDSS LRG galaxies
The shape of the present day matter power spectrum depends on conditions that prevailed during inflation (or more generally during very early stages of the universe) producing the initial fluctuations and on the detailed contents of fields and matter of the universe which alter the growth of fluctuations during the expansion. This complex process is summarised through the transfer function. In simple inflationary cold dark matter models, the initial spectrum is assumed to follow a power law: P(k) = Akn and the final power spectrum can be determined using the transfer function which is specified as soon as the cosmological parameters are set, including neutrino properties. These transfer functions can be obtained through public codes like CMBFAST (Seljak & Zaldarriaga 1996) or CAMB (Lewis et al. 2000). The distribution function of galaxies on large scales in the present day universe is supposed to be representative of the present distribution of dark matter providing that one can specify a biasing scheme for galaxy formation. The SDSS survey (York et al. 2000) allowed to obtain unprecedented data on the large scale distribution of galaxies. In this paper we use the power spectrum published in T06 and derived from 58 380 Luminous Red Galaxies (LRG) along with narrow window functions and uncorrelated minimum-variance errors. For comparison purposes, we will also use the data from E05 on the correlation function derived from 46 748 LRG, with the covariance matrix between data points. Both these data sets can thus be used for likelihood computation, after providing a model which takes into account various corrective effects, such as non-linear evolution and redshift-space distortions.
2.3 SNIa
Since the first results that showed evidence for an accelerated expansion of the Universe using a relatively small number of distant supernovae, the number of supernovae available for determination of cosmological constraints has significantly increased due to several supernova observation programs. Kowalski et al. (2008) have compiled the most up to date set of supernovae including the recent large samples of SNIa from SNLS (Astier et al. 2006) and ESSENCE (Miknaitis et al. 2007) surveys, older data sets and the recently extended data set of distant supernovae observed with HST. The compilation contains 414 SNIa and after selection cuts reduces to 307 SN1a. In this paper we use the supernovae magnitude and covariance data provided by Kowalski et al. (2008) on the 307 SN1a which passed selection cuts.
3 MCMC analysis and results
The constraints were obtained using the public code COSMOMC (Lewis & Bridle 2002), which
implements a Metropolis-Hastings algorithm to perform a Markov chain Monte Carlo (MCMC) using the above data. This method is the one most currently used; we do not address the question
of the difference between Bayesian and frequentist approaches, which could lead to differences in preferred values and uncertainty estimates (see for instance Dunkley et al. 2008). We
investigated four different sets of parameters to be constrain by this method, the simplest being
our ``vanilla'' model with
![]() ,
,
![]() ,
,
![]() ,
,
![]() ,
,
![]() ,
,
![]() ). The
). The ![]() parameter represents the ratio between the sound horizon and the angular diameter distance to the last scattering surface. It is used instead of the Hubble parameter h since
parameter represents the ratio between the sound horizon and the angular diameter distance to the last scattering surface. It is used instead of the Hubble parameter h since ![]() provides a better efficiency and less correlation with other parameters. The physical meaning of all constrained parameters is described in Table 1.
By imposing a flat Universe with w=-1, it is possible to describe all the used data with just these six parameters.
These parameters were directly constrained by COSMOMC, while other important
parameters as h or
provides a better efficiency and less correlation with other parameters. The physical meaning of all constrained parameters is described in Table 1.
By imposing a flat Universe with w=-1, it is possible to describe all the used data with just these six parameters.
These parameters were directly constrained by COSMOMC, while other important
parameters as h or
![]() were derived from those six basic parameters. The two parameters required to correct for non-linearity and bias effects (Tegmark et al. 2006) were introduced in the code that computes the SDSS likelihood, but marginalised analytically.
The other parameter sets consisted of adding the dark energy equation of state parameter w and the curvature parameter
were derived from those six basic parameters. The two parameters required to correct for non-linearity and bias effects (Tegmark et al. 2006) were introduced in the code that computes the SDSS likelihood, but marginalised analytically.
The other parameter sets consisted of adding the dark energy equation of state parameter w and the curvature parameter ![]() to our vanilla model.
to our vanilla model.
In order to obtain a better and faster convergence, we ran a first chain up to around 10 000 points and then used the results to obtain a good estimate of the covariance matrix for the parameters. This matrix was then used as an input to perform a final chain run until convergence.
We ran one chain for each parameter set until it satisfied the Raftery-Lewis convergence test (Raftery & Lewis 1992)
which typically happened after 15 000-30 000 accepted iterations. The posterior distribution was then used to derive the confidence intervals for the parameters. A flat prior was attributed to all directly constrained parameters, and
there is a restriction on h (0.4<h<1.0) imposed in CAMB. Table 1 shows the marginalised mean values for all parameters constrained, either directly or indirectly, as well as the 1![]() confidence intervals. We note the fact that the quoted values do not represent exactly the best fit model in either case, but the mean and standard deviation of the marginalised probability distribution of each parameter. These distributions are shown in Fig. 1 for comparison between the different parameter sets. We also present the 2D marginalised distributions for the main cosmological parameters in the case where 8 parameters were directly constrained (Fig. 2). This figure allows us to identify possible
correlations among parameters.
confidence intervals. We note the fact that the quoted values do not represent exactly the best fit model in either case, but the mean and standard deviation of the marginalised probability distribution of each parameter. These distributions are shown in Fig. 1 for comparison between the different parameter sets. We also present the 2D marginalised distributions for the main cosmological parameters in the case where 8 parameters were directly constrained (Fig. 2). This figure allows us to identify possible
correlations among parameters.
![\begin{figure}
\par\includegraphics[width=14cm,clip]{10693fig2.eps}
\end{figure}](/articles/aa/full_html/2009/19/aa10693-08/img70.png) |
Figure 2:
2D constraints on most correlated cosmological parameters when Vanilla+
|
| Open with DEXTER | |
Finally, we compared the data published on the evolution of the Hubble parameter H(z) (Simon et al. 2005; Gaztañaga et al. 2008) with the region allowed by our constraints on the vanilla model (Fig. 3). This was done by taking the envelop of H(z)
of models falling inside 1![]() confidence intervals in the distributions for
confidence intervals in the distributions for
![]()
![]() ,
,
![]() .
This comparison illustrates
the ability of the
.
This comparison illustrates
the ability of the ![]() CDM model to fit accurately various type of astrophysical data, although the evaluation of possible systematics is difficult for such type of data.
CDM model to fit accurately various type of astrophysical data, although the evaluation of possible systematics is difficult for such type of data.
![\begin{figure}
\par\includegraphics[width=8.7cm,clip]{10693fig3.eps}
\end{figure}](/articles/aa/full_html/2009/19/aa10693-08/img71.png) |
Figure 3:
Comparison between the data on the Hubble parameter evolution from
three data set (triangle: Freedman et al. 2001; dark circles Simon et al. 2005; open circles: Gaztañaga et al. 2008) and one |
| Open with DEXTER | |
4 Systematics
4.1 LSS analysis and compressed data
![\begin{figure}
\par\includegraphics[width=16.9cm,clip]{10693fig4.eps}\end{figure}](/articles/aa/full_html/2009/19/aa10693-08/img72.png) |
Figure 4: Joint marginalised posterior distributions for relevant cosmological parameters in a vanilla model comparing four approaches to the LSS data: Matter power spectrum and corrections for non-linear effects from T06 (black), correlation function from E05 with corrections for non-linear effects from E05 (red) and T06 (blue). The final constraint uses the distance parameter A derived in E05 (green). |
| Open with DEXTER | |
Table 1 provides an up to date estimation of cosmological parameters by combining the likelihood from each data set. Clearly, the accuracy is impressive. Given this precision, it is vital to evaluate possible systematics that could seriously alter these estimations.
One possible source of systematic uncertainty lies in the analysis of the large scale galaxy
distribution.
Most of recent analyses include SDSS data on BAO.
In E05 and T06, the authors have used different descriptors to quantify the galaxy clustering. In principle, the use of the correlation function or power spectrum should give the same results, but
using different numerical estimators can lead to different answers, providing an indication on the amplitude of possible biases.
Another sensible aspect is that of non-linear corrections. In order to compare the observed galaxy clustering with that from underlying dark matter, one has to account for changes in the linear power spectrum (or correlation function) due to non-linear gravitational collapse and scale dependent bias of galaxies. Such effects introduce distortions on the linear power spectrum shape and can even shift the position of the acoustic peak of up to 3% (Smith et al. 2008). Several models have been proposed to correct for these effects, usually supported by numerical simulations. In T06, non-linear corrections were performed using a one parameter model introduced by Cole et al. (2005):
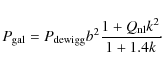
Here
In E05, the authors used the same correction for the baryonic peak supression, but the scale dependent bias and non-linear collapse were treated differently, by means of the HALOFIT formalism and an expression derived from the numerical simulation of Seo et al. (2008) and applied directly to the real space correlation function.
We have thus compared
the different approaches referred to above, when combined with the CMB and SNIa information. We restricted this analysis to the vanilla model and the results are shown in Fig. 3 for relevant parameters. One can see that using the E05 two point correlation function and non-linear corrections results in a difference
in the mean value of some parameters compared to using the T06 data on the matter power spectrum together with a Q-model. The parameters most affected are the densities
![]() ,
,
![]() ,
,
![]() and the Hubble parameter H0. For instance,
and the Hubble parameter H0. For instance,
![]() is shifted from 0.262 to 0.275 while the uncertainty is of the order of 0.015, the difference is therefore of the order of
1
is shifted from 0.262 to 0.275 while the uncertainty is of the order of 0.015, the difference is therefore of the order of
1![]() or more.
or more.
In order to
track the origin of such a difference, we ran another chain using the correlation function data from E05, but with a Q-model correction for non-linear effects. One could expect that by using the same modelling as T06, the observed difference would be reduced. However, the blue curves in Fig. 3 show that the difference increases in this case, with
![]() .
This result is the same if we leave the
.
This result is the same if we leave the
![]() parameter in Eq. (1) as a free parameter or if we use the best value found by T06,
parameter in Eq. (1) as a free parameter or if we use the best value found by T06,
![]() .
Such a result indicates a significant difference between the estimations in E05 and T06,
since they both used similar galaxy catalogs. Although the observed differences are no more than 1 to 2
.
Such a result indicates a significant difference between the estimations in E05 and T06,
since they both used similar galaxy catalogs. Although the observed differences are no more than 1 to 2![]() ,
they are significative enough to consider that the present LSS and BAO data has to be used with some caution. Clearly, future works on this subject must address carefully the issue of bias in estimators (Norberg et al. 2008) and modelling of non-linear effects. With this caveat, we stress that the use of the matter power spectrum was less time consuming and we kept this approach for wider parameter investigations.
,
they are significative enough to consider that the present LSS and BAO data has to be used with some caution. Clearly, future works on this subject must address carefully the issue of bias in estimators (Norberg et al. 2008) and modelling of non-linear effects. With this caveat, we stress that the use of the matter power spectrum was less time consuming and we kept this approach for wider parameter investigations.
It is also interesting to notice that several recent papers provide constraints from combination of these three data sets, but in which some of the constraints were obtained from highly compressed information, typically one number, for instance in the form of a reduced distance. Obviously different compressed information from the same data could result in different constraints (see for instance Lewis 2008); the use of compressed information and approximate likelihoods should therefore be tested to ensure they do not lead to inadequate approximation of the likelihood on the full data set. Although some compression is necessary to reduce the numerical cost of likelihood analyses, too strongly compressed information may result in biases on both the preferred values and on the uncertainties. We have used the distance parameter A from E05 to perform our constraints, with the results also plotted in Fig. 3 (red curves). This parameter seems to capture quite accurately the cosmological information from the full correlation function with non-linear corrections used in E05. The mean values for all parameters are highly compatible in both analyses. The main difference lies in the uncertainties of some parameters, which seem to be overestimated by an factor of 25% to 30% when we use this reduced distance.
4.2 Possible astrophysical troubles
Even in the presence of ideal data with no systematics or in the data acquisition either in the data analysis, inferred constraints may be biased because of unidentified complex astrophysics. For instance CMB fluctuations are contaminated by various foregrounds, which may introduce bias in estimation if incorrectly subtracted (Douspis et al. 2006). Similarly, the acoustic scale as well as the whole correlation function inferred from galaxy samples could be biased by distortion in redshift space, non-linear dynamics and the biasing of the galaxy population. All these effects are believed to be controlled to a much higher precision than present surveys allow by now (Seo et al. 2008).
4.2.1 SNIa evolution and consequences
The situation for SNIa is more problematic: SNIa are complex objects probably resulting from mass accretion of a white dwarf in a binary system; the properties of the final explosion may depend on many of the parameters of the progenitors (age, metalicities, environment, ...) and the properties of the explosion are not well known (detonation/deflagration, physics of the ignition points). The SNIa results heavily rely on the assumption that the peak luminosity, once corrected for duration-luminosity dependence (Phillips 1993), does not vary with redshift. Some evolution in the progenitor population is expected from the general stellar population. Some evolution may therefore be present and hard to detect. Indeed, this is one of the main weakness of SNIa results (Riess & Livio 2006). From the observational point of view only differences in the spectroscopic properties of distant and close supernovae can be quantified (Balland et al. 2007; Foley et al. 2007). The role of possible grey dust (Goobar et al. 2002) or evolving dust may also be important (Holwerda 2008).
Despite the remarkable efforts on observations of distant SNIa, it is clear that
the hypothesis of negligible evolution is extremely difficult to prove. As it is commonly written, the absence of evidence is not an evidence of absence. A simple evolution law could be:
(Nordin et al. 2008). Wright (2002) showed that an evolution model in which peak luminosity varies as an exponential function of cosmic time within an Einstein de Sitter universe may mimic the accelerated expansion. We have therefore also examined the possible consequences on cosmological constraints assuming that the peak magnitude of SNIa evolved linearly with time as:
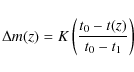
where t0 is the present age of the universe, t1 is the age of the universe at z = 1 and t(z) is the age of the universe at the redshift of the supernova explosion. The parameters b or K represent the typical change in magnitude at redshift 1. We first examined the consequence of such evolution for the SNIa Hubble diagram. In Fig. 5 we determined the constraints in the
for the vanilla model. We also examine how constraints are relaxed when the curvature parameter,
Our analysis shows that evolution is not required by the data. Most noticeably, it changes significantly the constraints on w: while the vanilla model is almost at the center of the 1
![\begin{figure}
\par\includegraphics[width=8.1cm,clip]{10693fig5.eps}\vspace*{2mm}
\includegraphics[width=8.1cm,clip]{10693fig6.eps}
\end{figure}](/articles/aa/full_html/2009/19/aa10693-08/img82.png) |
Figure 5:
Constraints in the
|
| Open with DEXTER | |
![\begin{figure}
\par\includegraphics[width=7.5cm,clip]{10693fig7.eps}
\end{figure}](/articles/aa/full_html/2009/19/aa10693-08/img83.png) |
Figure 6: Posterior distribution for the SN evolution parameter K, for different parameter sets of CDM models. The colour code is the same as the one used in Fig. 1. Evolution is systematically preferred, although the non evolving solution remains acceptable. |
| Open with DEXTER | |
Table 2: Similar to Table 1, but including an evolution parameter for the supernova intrinsic luminosity.
Interestingly enough, constraints on others parameters are quite stable even in the most general case (curvature and w free) and therefore insensitive to such a possible evolution.
Our results put a stringent constraint on the possible evolution of SNIa
and thereby provide an idea of the level at which systematic uncertainty for
possible evolution should be controlled in order to provide
useful constraints
on the problem of the determination of cosmological parameters in conjunction with other methods: even in the worse case the amount of evolution
is found to be of the order of
![]() (1
(1![]() level),
at redshift z = 0.5, while in the vanilla model we found that evolution is limited to
level),
at redshift z = 0.5, while in the vanilla model we found that evolution is limited to
![]() at the same redshift. We notice that spectral SNIa evolution is constrained to be less than 10% from the observed properties of a sample of SNIa with a median redshift of 0.5 (Foley et al. 2007).
at the same redshift. We notice that spectral SNIa evolution is constrained to be less than 10% from the observed properties of a sample of SNIa with a median redshift of 0.5 (Foley et al. 2007).
![\begin{figure}
\par\includegraphics[width=8cm,clip]{10693fig8.eps}
\end{figure}](/articles/aa/full_html/2009/19/aa10693-08/img124.png) |
Figure 7:
Joint 2D marginalised constraint on the dark energy equation of
state parameter w (supposed constant) and the curvature density
|
| Open with DEXTER | |
Finally, we have examined how the so-called figure of merit (f.o.m), defined
according to the DETF ( 2006) (see for instance Virey & Ealet 2007), is modified when possible evolution in the SNIa of the above type is taken into account. We therefore used the CPL formulation (Chevallier & Polarski 2001; Linder 2003) for dark energy evolution. The state equation parameter is supposed to evolve according to:
where a is the expansion factor normalised to one at the present epoch. We restricted ourselves to the flat case. The f.o.m is defined as the area of the 90% contour in the w0,w1 diagram. The joint constraint contours are presented in Fig. 8. The f.o.m. is found to be 2.03 when no evolution was assumed and is lowered to 1.17 when evolution is considered. This is in agreement with our previous finding: taking into account evolution leads to degraded constraints although the loss in precision is limited.
![\begin{figure}
\par\includegraphics[width=8cm,clip]{10693fig9.eps}
\end{figure}](/articles/aa/full_html/2009/19/aa10693-08/img125.png) |
Figure 8: Joint 2D marginalised constraint on the dark energy equation of state, assuming a CPL parameterization. |
| Open with DEXTER | |
5 Discussion and conclusions
In this paper, we have used three of the most solid sets of observational data in
cosmology to perform an up to date constraint on the ![]() CDM model: CMB, the
Hubble diagram of distant SN and the shape of the power spectrum of galaxy
distribution on large scales. We have chosen to use the power spectrum shape
because the analysis using the
correlation function was appreciably longer. We have confirmed that
6 parameters only are enough
to reproduce the three currently used data sets. Using appropriate likelihoods for each data set, we obtained very good
constraints with typical uncertainties of the order of a few percent. The comparison between the values obtained in this work
and those found using only WMAP3+SDSS (Tegmark et al. 2006) data do not show
significant changes in most of the parameters, which demonstrates the great
constraining power of these large scale observations. Indeed, the introduction
of the supernova data produces changes mostly on the parameters that
govern the geometry of the Universe, namely
CDM model: CMB, the
Hubble diagram of distant SN and the shape of the power spectrum of galaxy
distribution on large scales. We have chosen to use the power spectrum shape
because the analysis using the
correlation function was appreciably longer. We have confirmed that
6 parameters only are enough
to reproduce the three currently used data sets. Using appropriate likelihoods for each data set, we obtained very good
constraints with typical uncertainties of the order of a few percent. The comparison between the values obtained in this work
and those found using only WMAP3+SDSS (Tegmark et al. 2006) data do not show
significant changes in most of the parameters, which demonstrates the great
constraining power of these large scale observations. Indeed, the introduction
of the supernova data produces changes mostly on the parameters that
govern the geometry of the Universe, namely
![]() and h, which have their
mean values reduced by around 0.02/0.03. As for the dark energy EoS parameter
w, we do not obtain a better constraint by adding the supernova data, and the results point to a value highly compatible with a cosmological constant although the 1
and h, which have their
mean values reduced by around 0.02/0.03. As for the dark energy EoS parameter
w, we do not obtain a better constraint by adding the supernova data, and the results point to a value highly compatible with a cosmological constant although the 1![]() error bars are appreciably larger than on other parameters (of the order of 5 to 10%).
error bars are appreciably larger than on other parameters (of the order of 5 to 10%).
We found that adding extra freedom to the vanilla model does not
decrease the quality of the constraints in an appreciable way for several parameters: as can be seen from Fig. 1, constraints on the baryonic content of the universe
![]() ,
the dark energy content
,
the dark energy content
![]() ,
the matter content of the universe
,
the matter content of the universe
![]() and the primordial index of scalar fluctuations
and the primordial index of scalar fluctuations ![]() are almost unchanged. We get a slightly wider distribution in other parameters,
with preferred values unchanged but with uncertainties increased by a factor of up to two.
The most drastic change happens for the age of the universe, with an uncertainty increased by a factor of more than five, although the uncertainty remains still only of the order of 5%.
are almost unchanged. We get a slightly wider distribution in other parameters,
with preferred values unchanged but with uncertainties increased by a factor of up to two.
The most drastic change happens for the age of the universe, with an uncertainty increased by a factor of more than five, although the uncertainty remains still only of the order of 5%.
Our constraints have been established within some assumptions. For instance we do not investigate the possible contribution of tensor modes (Zaldarriaga & Seljak 1997; Liddle & Lyth 2000) or neutrino mass (Goobar et al. 2006) . Obviously, the addition of new freedom could modify some of our constraints. There is no general method to avoid this type of limitation; for instance, one of the most critical assumptions on constraints obtained from the CMB is the power law shape of the spectrum of primordial fluctuations. Relaxing this assumption could lead to dramatic modification of the constraints (Blanchard et al. 2003; Hunt & Sarkar 2007).
While preparing this paper, we benefited from the release of the 5-year WMAP results. The WMAP team presents MCMC constrains on the
![]() model (Komatsu et al. 2008), using WMAP+SN+BAO. They used the BAO measurements on the angular diameter scale
model (Komatsu et al. 2008), using WMAP+SN+BAO. They used the BAO measurements on the angular diameter scale ![]() derived from the SDSS LRG correlation function (Eisenstein et al. 2005), while we preferentially used the full power spectrum shape data.
By comparing the two approaches
we find very similar constraints on all parameters
and similar
derived from the SDSS LRG correlation function (Eisenstein et al. 2005), while we preferentially used the full power spectrum shape data.
By comparing the two approaches
we find very similar constraints on all parameters
and similar
![]() confidence intervals, which indicates that the
use of the distance parameter A in implementing the LSS constraint is essentially sufficient.
Also, we find that the use of the power spectrum instead of the correlation function leads to appreciable difference of up to two sigma.
Finally our investigation on the consequence of a specific model for the evolution of SNIa luminosities has been interesting in several respects: first, although evolution does not allow any conclusion on cosmological parameters from the Hubble diagram alone, we found that most of the constraints from combinations remained
unchanged, and at the same time the amount of evolution is severely
constrained to be less than 5 to 20% for redshifts between 0.5 to 1.
confidence intervals, which indicates that the
use of the distance parameter A in implementing the LSS constraint is essentially sufficient.
Also, we find that the use of the power spectrum instead of the correlation function leads to appreciable difference of up to two sigma.
Finally our investigation on the consequence of a specific model for the evolution of SNIa luminosities has been interesting in several respects: first, although evolution does not allow any conclusion on cosmological parameters from the Hubble diagram alone, we found that most of the constraints from combinations remained
unchanged, and at the same time the amount of evolution is severely
constrained to be less than 5 to 20% for redshifts between 0.5 to 1.
The current status of cosmology seems then to be highly compatible with the ![]() CDM. Present-day existing data allows to estimate cosmological parameters to within a few percent whithin a specific model. This raises the fundamental question of the role of astrophysical sources of uncertainties.
Clearly the next step is to understand in more detail the nature of dark energy (cosmological constant, dynamic scalar field or modified gravity) and this is yet to be achieved. The ever increasing quality of data, anticipated from future large observational programs, could be used to rule out or validate some of theses alternatives. However, future projects would need to keep systematic effects, both from methodological and astrophysical origin, controlled to achieve a typical anticipated precision of one percent or better.
CDM. Present-day existing data allows to estimate cosmological parameters to within a few percent whithin a specific model. This raises the fundamental question of the role of astrophysical sources of uncertainties.
Clearly the next step is to understand in more detail the nature of dark energy (cosmological constant, dynamic scalar field or modified gravity) and this is yet to be achieved. The ever increasing quality of data, anticipated from future large observational programs, could be used to rule out or validate some of theses alternatives. However, future projects would need to keep systematic effects, both from methodological and astrophysical origin, controlled to achieve a typical anticipated precision of one percent or better.
Acknowledgements
L. Ferramacho acknowledges financial support provided by Fundação para a Ciência e Tecnologia (FCT, Portugal) under fellowship contract SFRH/BD/16416/2004.
References
- Allen, S. W., Rappetti, D. A., Schmidt, R. W. et al. 2008, MNRAS, 383, 879 [NASA ADS] [CrossRef] (In the text)
- Astier, P., Guy, J., & Regnault, N. 2006, A&A, 447, 31 [NASA ADS] [CrossRef] [EDP Sciences] (In the text)
- Balland, C., Mouchet, M., Amanullah, R., et al. 2007, A&A, 464, 827 [NASA ADS] [CrossRef] [EDP Sciences] (In the text)
- Blanchard, A., & Douspis, M. 2005, A&A, 436, 411 [NASA ADS] [CrossRef] [EDP Sciences] (In the text)
- Blanchard, A., Douspis, M., Rowan-Robinson, M., & Sarkar, S. 2003, A&A, 412, 35 [NASA ADS] [CrossRef] [EDP Sciences] (In the text)
- Benjamin, J., Heymans, C., Sembolini, E., et al. 2008, MNRAS, 381, 702 [NASA ADS] [CrossRef] (In the text)
- Chevallier, M., & Polarski, D. 2001, Int. J. Modern Physics D, 10, 213 [NASA ADS] [CrossRef] (In the text)
- Cole, S., Percival, W. J., Peacock, J. A., et al. 2005, MNRAS, 362, 505 [NASA ADS] [CrossRef] (In the text)
- Dark Energy Task Force report to the Astronomy and Astrophysics Advisory Committee 2006, http://www.nsf.gov/mps/ast/detf.jsp (In the text)
- Douspis, M., Aghanim, N., & Langer, M. 2006, A&A, 456, 819 [NASA ADS] [CrossRef] [EDP Sciences] (In the text)
- Dunkley, J., Komatsu, E., Nolta, R., et al. 2008, [arXiv:0803.0586v1] (In the text)
- Eisentein, D. J., Zehavi, I., Hogg, D. W., et al. 2005, ApJ, 633, 560 [NASA ADS] [CrossRef] (In the text)
- Ferramacho, L. D., & Blanchard, A. 2007, A&A, 463, 423 [NASA ADS] [CrossRef] [EDP Sciences] (In the text)
- Foley, R. J., et al. 2007, [arXiv:0710.2338] (In the text)
- Freedman, W. L., Madore, B. F., Gibson, B. K., et al. 2001, ApJ, 553, 47 [NASA ADS] [CrossRef] (In the text)
- Frieman, J. A., Turner, M. S., & Huterer, D. 2008, ARA&A, 46, 385 [NASA ADS] [CrossRef] (In the text)
- Gaztañaga, E., Cabré, A., & Hui, L. 2008, [arXiv:0807.3551v1] (In the text)
- Goobar, A., Bergström, L., & Möumlrtsell, E. 2002, A&A, 384, 1 [NASA ADS] [CrossRef] [EDP Sciences] (In the text)
- Goobar, A., Hannestad, S., Mörtsell, E., & Tu, H. 2006, J. Cosm. Astro-Part. Phys., 6, 19 [NASA ADS] [CrossRef] (In the text)
- Hunt, P., & Sarkar, S. 2007, Phys. Rev. D, 76, 123504 [NASA ADS] [CrossRef] (In the text)
- Komatsu, E., Dunkley, J., Nolta, R., et al. 2008, [arXiv:0803.0547v1] (In the text)
- Kowalski, M., Rubin, D., Aldering, G., et al. 2008, [arXiv:0804.4142] (In the text)
- Lewis, A. 2008, [arXiv:0804.3865] (In the text)
- Lewis, A., & Bridle, S., PhRvD, 66, 10 (In the text)
- Lewis, A., Challinor, A., & Lasenby, A. 2000, ApJ, 538, 473 [NASA ADS] [CrossRef] (In the text)
- Liddle, A. R., & Lyth, D. H. 2000, Cosmological inflation and large scale structure (Cambridge University Press)
- Linder, E. V. 2003, Phys. Rev. Lett., 90, 091301 [NASA ADS] [CrossRef] (In the text)
- Lineweaver, C. H., Barbosa, D., Blanchard, A., & Bartlett, J. G. 1997, A&A, 322, 365 [NASA ADS] (In the text)
- Miknaitis, G., Pignata, G., Rest, A., et al. 2007, ApJ, 666, 674 [NASA ADS] [CrossRef] (In the text)
- Norberg, P., Baugh, C. M., Gaztanaga, E., & Croton, D. J. 2008, [arXiv:0810.1885] (In the text)
- Nordin, J., Goobar, A., & Jöumlnsson, J. 2008, J. Cosm. Astro-Part. Phys., 2, 8 [NASA ADS] [CrossRef] (In the text)
- Nuza, S. E., & Blanchard. A. 2006, A&A, 452, 47 [NASA ADS] [CrossRef] [EDP Sciences] (In the text)
- Padmanabhan, T. 2006, AIP Conf. Proc., 861, 179 [NASA ADS] (In the text)
- Percival, W. J., Cole, S., Eisenstein, D., et al. 2007, MNRAS, 381, 1053 [NASA ADS] [CrossRef] (In the text)
- Perlmutter, S., Aldering, G., Goldhaber, G., et al. 1999, ApJ, 517, 2 [CrossRef], 565 (In the text)
- Phillips, M. M. 1993, ApJ, 413, L105 [NASA ADS] [CrossRef] (In the text)
- Raftery, A. E., & Lewis, S. M. 1992, in Baysean Statistics, ed. J. M. Bernardo, J. O. Berger, A. Dawid, & A. Smith (Oxford University Press), 4, 763 (In the text)
- Reichardt, C. L., et al. 2008, [arXiv:0801.1491] (In the text)
- Riess, A. G., & Livio, M. 2006, ApJ, 648, 884 [NASA ADS] [CrossRef] (In the text)
- Riess, A. G., Filippenko, A. V., Challis, P., et al. 1998, AJ, 116, 1009 [NASA ADS] [CrossRef] (In the text)
- Riess, A. G., Strolger, L., Casertano, S., et al. 2007, ApJ, 659, 98 [NASA ADS] [CrossRef]
- Smith, R. E., Scoccimarro, R., & Sheth, R. K. 2008, Phys. Rev. D, 77, 043525 [NASA ADS] [CrossRef] (In the text)
- Seljak, U., & Zaldarriaga, M. 1996, ApJ, 469, 437 [NASA ADS] [CrossRef] (In the text)
- Seo, H.-J., Siegel, E. R., Eisenstein, D. J., & White, M. 2008, [arXiv:0805.0117] (In the text)
- Simon, J., Verde, L., & Jimenez, R. 2005, PhRvD, 71, 123001 [NASA ADS] [CrossRef]
- Spergel, D. N., Verde, L., Peiris, H. V., et al. 2003, ApJS, 148, 175 [NASA ADS] [CrossRef] (In the text)
- Spergel, D. N., Bean, R., Doré, O., et al. 2007, ApJS, 170, 377 [NASA ADS] [CrossRef] (In the text)
- Tegmark, M., Eisenstein, D., Strauss, M. A., et al. 2006, PhRvD, 74, 12 (In the text)
- Vauclair, S. C., Blanchard, A., Sadat, R., et al. 2003, A&A, 412, L37 [NASA ADS] [CrossRef] [EDP Sciences] (In the text)
- Vikhlinin, A., Burenin, R. A., Ebeling, H. et al. 2008, [arXiv:0805.2207v2] (In the text)
- Wright, E. L. 2002, [arXiv:astro-ph/0201196]
- Wright, E. L. 2007, ApJ, 664, 633 [NASA ADS] [CrossRef] (In the text)
- Xia, J.-Q., Li, H., Zhao, G.-B., & Zhang, X. 2008, [arXiv:0807.3878] (In the text)
- Yèche, C., Ealet, A., Réfrégier, A., et al. D. 2006, A&A, 448, 831 [NASA ADS] [CrossRef] [EDP Sciences]
- York, D. G., et al. 2002, Astron. J., 120, 1579 [NASA ADS] [CrossRef] (In the text)
- Virey, J.-M., & Ealet, A. 2007, A&A, 464, 837 [NASA ADS] [CrossRef] [EDP Sciences] (In the text)
- Webster, A. M., Bridle, S. L., Hobson, M. P., et al. 1998, ApJ, 509, L65 [NASA ADS] [CrossRef] (In the text)
- Zaladarriaga, M., & Seljak, U., 1997, PhRvD, 55, 1830 [NASA ADS] [CrossRef]
All Tables
Table 1: Summary of the posterior distribution mean values for the different sets of parameters constrained, with the corresponding 68% confidence intervals.
Table 2: Similar to Table 1, but including an evolution parameter for the supernova intrinsic luminosity.
All Figures
| |
Figure 1:
Posterior distributions for the parameters constrained in our MCMC analysis. Doted curves represent the mean likelihood of the samples, while solid lines show the fully marginalized posterior. The four parameter sets constrained are represented by different colours: Vanilla (black), Vanilla +
|
| Open with DEXTER | |
| In the text | |
| |
Figure 2:
2D constraints on most correlated cosmological parameters when Vanilla+
|
| Open with DEXTER | |
| In the text | |
| |
Figure 3:
Comparison between the data on the Hubble parameter evolution from
three data set (triangle: Freedman et al. 2001; dark circles Simon et al. 2005; open circles: Gaztañaga et al. 2008) and one |
| Open with DEXTER | |
| In the text | |
| |
Figure 4: Joint marginalised posterior distributions for relevant cosmological parameters in a vanilla model comparing four approaches to the LSS data: Matter power spectrum and corrections for non-linear effects from T06 (black), correlation function from E05 with corrections for non-linear effects from E05 (red) and T06 (blue). The final constraint uses the distance parameter A derived in E05 (green). |
| Open with DEXTER | |
| In the text | |
| |
Figure 5:
Constraints in the
|
| Open with DEXTER | |
| In the text | |
| |
Figure 6: Posterior distribution for the SN evolution parameter K, for different parameter sets of CDM models. The colour code is the same as the one used in Fig. 1. Evolution is systematically preferred, although the non evolving solution remains acceptable. |
| Open with DEXTER | |
| In the text | |
| |
Figure 7:
Joint 2D marginalised constraint on the dark energy equation of
state parameter w (supposed constant) and the curvature density
|
| Open with DEXTER | |
| In the text | |
| |
Figure 8: Joint 2D marginalised constraint on the dark energy equation of state, assuming a CPL parameterization. |
| Open with DEXTER | |
| In the text | |
Copyright ESO 2009
Current usage metrics show cumulative count of Article Views (full-text article views including HTML views, PDF and ePub downloads, according to the available data) and Abstracts Views on Vision4Press platform.
Data correspond to usage on the plateform after 2015. The current usage metrics is available 48-96 hours after online publication and is updated daily on week days.
Initial download of the metrics may take a while.