| Issue |
A&A
Volume 497, Number 2, April II 2009
|
|
|---|---|---|
| Page(s) | 545 - 550 | |
| Section | Planets and planetary systems | |
| DOI | https://doi.org/10.1051/0004-6361/200810917 | |
| Published online | 09 February 2009 | |
OGLE2-TR-L9b: an exoplanet transiting a rapidly rotating F3 star![[*]](/icons/foot_motif.png)
I. A. G. Snellen1 - J. Koppenhoefer2,3 - R. F. J. van der Burg1 - S. Dreizler4 - J. Greiner3 - M. D. J. de Hoon1 - T. O. Husser5 - T. Krühler3,6 - R. P. Saglia3 - F. N. Vuijsje1
1 - Leiden Observatory, Leiden University, Postbus 9513, 2300 RA, Leiden, The Netherlands
2 -
Universitäts-Sternwarte München, Munich, Germany
3 -
Max-Planck-Institut für extraterrestrische Physik, Giessenbachstrasse, 85748 Garching, Germany
4 -
Institut für Astrophysik, Georg-August-Universität Göttingen, Friedrich-Hund-Platz 1, 37077 Göttingen, Germany
5 -
South African Astronomical Observatory, PO Box 9, Observatory 7935, South Africa
6 -
Universe Cluster, Technische Universität München, Boltzmannstraße 2, 85748, Garching, Germany
Received 5 September 2008 / Accepted 5 December 2008
Abstract
Context. The photometric observations of the OGLE-II microlens monitoring campaign have been taken in the period 1997-2000. All light curves of this campaign have recently become public. Our analysis of these data has revealed 13 low-amplitude transiting objects among  15 700 stars in three Carina fields towards the Galactic disk. One of these objects, OGLE2-TR-L9 (
 days), turned out to be an excellent transiting-planet candidate.
Aims. We report on our investigation of the true nature of OGLE2-TR-L9. By re-observing the photometric transit, we attempt to determine the transit parameters to high precision, and, by spectroscopic observations, to estimate the properties of the host star and determine the mass of the transiting object by means of radial-velocity measurements.
Methods. High precision photometric observations were obtained in g', r', i', and z' band simultaneously, using the new GROND detector, mounted on the MPI/ESO 2.2 m telescope at La Silla. Eight epochs of high-dispersion spectroscopic observations were obtained using the fiber-fed FLAMES/UVES Echelle spectrograph, mounted on ESO's Very Large Telescope at Paranal.
Results. The photometric transit, now more than 7 years after the last OGLE-II observations, was re-discovered only 8 min from its predicted time. The primary object is a rapidly rotating F3 star with
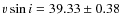 km s-1,
 K,
K,
 ,
and
,
and
![${\rm [Fe/H]} = -0.05\pm0.20$](/articles/aa/full_html/2009/14/aa10917-08/img20.png) .
The transiting object is an extrasolar planet with
.
The transiting object is an extrasolar planet with
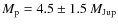 and
and
 .
Since this is the first planet detected orbiting a fast rotating star, the uncertainties in both the radial-velocity measurements and the planetary mass are larger than for most other planets discovered to date. The rejection of possible blend scenarios was based on a quantitative analysis of the multi-color photometric data. A stellar-blend scenario of an early F-star with a faint eclipsing-binary system is excluded, due to 1) the consistency between the spectroscopic parameters of the star and the mean density of the transited object as determined from the photometry, and 2) the excellent agreement between the transit signal as observed at four different wavelengths.
.
Since this is the first planet detected orbiting a fast rotating star, the uncertainties in both the radial-velocity measurements and the planetary mass are larger than for most other planets discovered to date. The rejection of possible blend scenarios was based on a quantitative analysis of the multi-color photometric data. A stellar-blend scenario of an early F-star with a faint eclipsing-binary system is excluded, due to 1) the consistency between the spectroscopic parameters of the star and the mean density of the transited object as determined from the photometry, and 2) the excellent agreement between the transit signal as observed at four different wavelengths.
Key words: stars: planetary systems - techniques: photometric - eclipses - stars: rotation
1 Introduction
Transiting extrasolar planets allow direct measurements of their fundamental parameters, such as planet mass, radius, and mean density. Furthermore, their atmospheres can be probed by secondary eclipse observations (e.g. Charbonneau et al. 2005; Deming et al. 2005; Knutson et al. 2007), and atmospheric transmission spectroscopy (e.g. Charbonneau et al. 2002; Tinetti et al. 2007; Snellen et al. 2008). This makes transiting exoplanets of significant scientific value.
Many photometric monitoring surveys are currently underway. Several of these surveys are very successful, such as the transit campaigns of the Optical Gravitational Lens Experiment (OGLE-III; 7 planets; e.g. Udalski et al. 2008), the Trans-Atlantic Exoplanet Survey (TrES; 4 planets; e.g. Mandushev et al. 2007), the Hungarian Automated Telescope Network (HATNet; 9 planets; e.g. Shporer et al. 2008), the XO survey (5 planets; e.g. Burke et al. 2007), and the Wide Area Search for Planets (SuperWASP; 15 planets; e.g. Anderson et al. 2008). In addition, CoRoT is targeting planet transits from space (4 planets; e.g. Aigrain et al. 2008), with the ultimate aim of finding Earth or super-Earth size planets.
In this paper, we present a new transiting extrasolar planet, OGLE2-TR-L9 b.
The system has an I-band magnitude of I=13.97, and an orbital period of
2.5 days. The host star is the most rapidly rotating and hottest (main sequence) star around
which an orbiting extrasolar planet has been detected to date.
The transit system was the prime planetary candidate from a sample
of thirteen objects presented by Snellen et al. (2007, S07). They were drawn
from the online database of the second phase of the OGLE project,
a campaign that aimed to identify microlensing events,
which was conducted between 1997 and 2000 (OGLE-II; Szymanski 2005; Udalski et al. 1997).
The low amplitude transits were discovered among the light curves of
15 700 stars, with
13.0<I<16.0, located in three Carina fields
towards the Galactic plane. We note that the light-curve data have a
different cadence than is usual for transit surveys, with 1-2 photometric
points taken per night, totalling 500-600 epochs over 4 years.
This work shows that such a data set is indeed sensitive to
low-amplitude transits, and can detect transiting extrasolar planets.
In Sect. 2 of this paper we present the analysis of new transit photometry of OGLE2-TR-L9, acquired with the GROND instrument mounted on the MPI/ESO 2.2 m telescope at La Silla. The particular goals of these observations were the re-discovery of the transit, improved transit parameters and orbital ephemeris. In Sect. 3, the spectroscopic observations with the FLAMES/UVES multi-fiber spectrograph on ESO's Very Large Telescope are described, including a description of the analysis of the radial-velocity variations, of the bisector span, and the spectroscopic parameters of the host star. In Sects. 4 and 5, the stellar and planetary parameters with their uncertainties are determined, and arguments against a stellar-blend scenario are presented. Our results are discussed in Sect. 6.
2 Transit photometry with GROND
2.1 Data acquisition and analysis
We observed one full transit of OGLE-TR-L9 with GROND (Greiner et al. 2008),
which is a gamma-ray burst follow-up instrument mounted on the MPI/ESO 2.2 m
telescope at the La Silla observatory. GROND
is a 7-channel imager that allows 4 optical (g'r'i'z') and 3 near-infrared (JHK) exposures to be acquired simultaneously.
On January 27, 2008, a total of 104 images in each optical band and 1248 images in each near-infrared band were taken. The JHK-images were found to be of
insufficient signal-to-noise ratio to be able to detect the transit, and will not be
considered further. Using exposure times of 66 s and a cycle rate of
2.5 min, we covered a period of about 4 h centered on the predicted,
transit time.
All optical images were reduced with the mupipe software
developed at the University Observatory in
Munich![]() . After the initial
bias and flat-field corrections, cosmic rays and bad pixels were masked,
and the images were resampled to a common grid. The frames did not suffer from
detectable fringing, even in the z-band. Aperture photometry was performed on
OGLE2-TR-L9 and eight to ten interactively selected reference stars, after
which light curves were created for each of the 4 bands.
The aperture radius was chosen to be 12 pixels, corresponding to 1.9 arcsec, and the seeing was typically 1.1 arcsec during the observations.
The sky was determined in an annulus between 20 and 30 pixels from the object
positions. The rms in the individual light curves of the reference stars was
in all cases lower than 0.3%, which provided typical precisions
in the relative fluxes superior to 0.2%.
. After the initial
bias and flat-field corrections, cosmic rays and bad pixels were masked,
and the images were resampled to a common grid. The frames did not suffer from
detectable fringing, even in the z-band. Aperture photometry was performed on
OGLE2-TR-L9 and eight to ten interactively selected reference stars, after
which light curves were created for each of the 4 bands.
The aperture radius was chosen to be 12 pixels, corresponding to 1.9 arcsec, and the seeing was typically 1.1 arcsec during the observations.
The sky was determined in an annulus between 20 and 30 pixels from the object
positions. The rms in the individual light curves of the reference stars was
in all cases lower than 0.3%, which provided typical precisions
in the relative fluxes superior to 0.2%.
2.2 Fitting the transit light curves
The light curves in g', r', i', and z', were fitted with the analytic
models presented by Mandel & Agol (2002). We
used quadratic limb-darkening coefficients taken from
Claret (2004), for a star of metallicity
![$[\rm {Fe/H}]=0.0$](/articles/aa/full_html/2009/14/aa10917-08/img23.png) ,
surface gravity
,
surface gravity
 ,
and effective temperature
,
and effective temperature
 K (close to the spectroscopic parameters of
the star determined below). The values of the limb-darkening
coefficients are given in Table 1.
Using a simultaneous fit to all 4 light curves, we derived the mean
stellar density,
K (close to the spectroscopic parameters of
the star determined below). The values of the limb-darkening
coefficients are given in Table 1.
Using a simultaneous fit to all 4 light curves, we derived the mean
stellar density,
 /
/
 ,
in solar units, the radius
ratio
,
in solar units, the radius
ratio
 /
/
 ,
the impact parameter
,
the impact parameter
 in units of
,
and the timing of the central transit. With a scaling
factor for each band, eight free parameters could be fitted.
in units of
,
and the timing of the central transit. With a scaling
factor for each band, eight free parameters could be fitted.
The light curves and the model fits are shown in Fig. 1, and the resulting parameters are listed in Table 2. The model fits the light curves well except for the g-band light curve, which is attributed to the significantly more noisy light curve, and the poorly determined baseline, particularly before ingress.
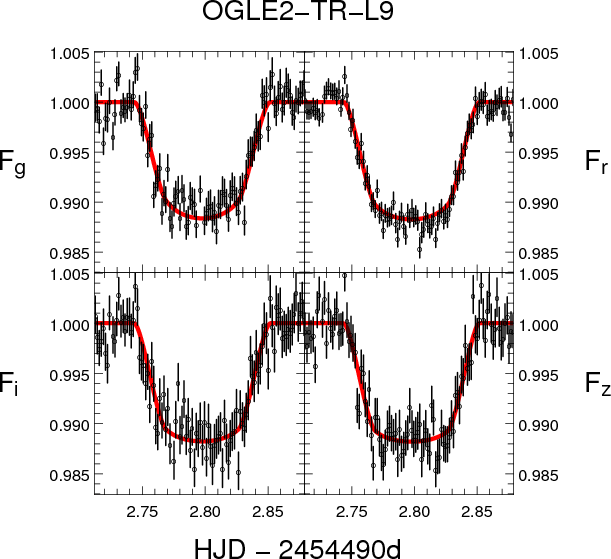 |
Figure 1: Transit lightcurves of OGLE-TR-L9 in g', r', i', and z' observed simultaneously with the GROND instrument, mounted on the MPI/ESO 2.2 m telescope. The line shows the best fit model for the combined light curves, as discussed in the text. |
| Open with DEXTER | |
Table 1:
Limb-darkening coefficients used for the transit fitting, taken
from Claret (2004) for a star with metallicity
![$\rm [Fe/H]=0.0$](/articles/aa/full_html/2009/14/aa10917-08/img1.png) ,
surface gravity
,
and effective temperature
K.
,
surface gravity
,
and effective temperature
K.
3 Spectroscopic observations with UVES/FLAMES
We observed OGLE2-TR-L9 with the
UV-visual echelle spectrograph (UVES, Dekker et al. 2000), mounted
at the Nasmyth B focus of UT2 of ESO's very large
telescope (VLT) at Paranal, Chile. The aims of these observations were
to estimate the spectroscopic parameters of the host star, and
to determine the radial-velocity variations.
The observations were performed in fiber mode, with UVES connected to the
FLAMES fiber facility (Pasquini et al. 2002), with 7 science fibers and
with simultaneous thorium-argon wavelength calibration (UVES7 mode).
Apart from our main target, fibers were allocated to two other OGLE-II
transit candidates from S07 (OGLE2-TR-L7 and OGLE2-TR-L12), and three
random stars within the 25' FLAMES field. In addition, one fiber was
positioned on the empty sky. A setup with a central wavelength of 580 nm
was used, resulting in a wavelength coverage of 4785-6817  over
two CCDs, at a resolving power of R=47 000. Since the upper CCD was found to cover only a small number of strong stellar absorption lines,
in addition to being affected by significant telluric contamination,
only the lower CCD (4785-5729 )
was used for further analysis.
over
two CCDs, at a resolving power of R=47 000. Since the upper CCD was found to cover only a small number of strong stellar absorption lines,
in addition to being affected by significant telluric contamination,
only the lower CCD (4785-5729 )
was used for further analysis.
Eight observations were taken in Director's Discretionary Time, in service
mode during December 2007 and January 2008, and
spread in such a way that the data would be evenly distributed across the orbital phases of our main target (see Table 3).
The data were analysed using the midas-based UVES/FLAMES pipeline
provided by ESO, which results in fully reduced, wavelength-calibrated
spectra. Since we were concerned with the wavelength calibration of the
fifth epoch (see below), we also analysed the data using purpose-build IDL
routines. No significant differences in the wavelength solutions were found.
The resulting signal-to-noise ratio per resolution element, in the central part of
the orders, varied between 10 and 20 during the different epochs
(see Table 3).
3.1 Determination of stellar spectroscopic parameters
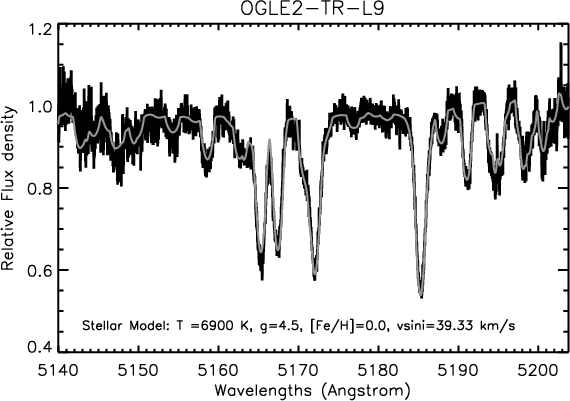 |
Figure 2:
The central part of one order of the combined UVES
spectrum of OGLE2-TR-L9,
with overplotted a synthetic spectrum with T=6900 K, g=4.5,
|
| Open with DEXTER | |
 km s-1.
Table 2: The transit, host star, and planetary companion parameters as determined from our photometric and spectroscopic observations.
Table 3: Spectroscopic observations of OGLE2-TR-L9 taken with UVES/FLAMES. The first three columns give the Heliocentric Julian Date, the planet's orbital phase at the time of observation, and the signal-to-noise ratio of the spectra per resolution element in the center of the middle order. Columns 4 and 5 give the radial velocity and the bisector span measurements.
The spectroscopic parameters of the star,  ,
surface temperature,
surface gravity, and metallicity, were determined from the SNR-weighted,
radial-velocity shifted combination of the eight epochs taken with UVES.
This combined spectrum has a signal-to-noise ratio of 42 in the
central areas of the orders.
Detailed synthetic spectra were computed using the interactive data
language (IDL) interface SYNPLOT (Hubeny, private communication) of the
spectrum synthesis program SYNSPEC (Hubeny et al. 1995), utilising
Kurucz model atmospheres
,
surface temperature,
surface gravity, and metallicity, were determined from the SNR-weighted,
radial-velocity shifted combination of the eight epochs taken with UVES.
This combined spectrum has a signal-to-noise ratio of 42 in the
central areas of the orders.
Detailed synthetic spectra were computed using the interactive data
language (IDL) interface SYNPLOT (Hubeny, private communication) of the
spectrum synthesis program SYNSPEC (Hubeny et al. 1995), utilising
Kurucz model atmospheres![]() .
These were least-squares
fitted to each individual order of the combined UVES spectrum.
The final atmospheric parameters were taken as the average values
across the available orders. The uncertainties in the fitted parameters
both estimated by using a
.
These were least-squares
fitted to each individual order of the combined UVES spectrum.
The final atmospheric parameters were taken as the average values
across the available orders. The uncertainties in the fitted parameters
both estimated by using a  -square analysis and from the scatter between
orders, provided similar results, of which the latter are adopted.
-square analysis and from the scatter between
orders, provided similar results, of which the latter are adopted.
The best-fit solution parameters and their uncertainties are given in Table 2.
One order of the combined UVES spectrum is shown in Fig. 2,
showing the
Mg
 5170
complex, with the synthetic spectrum
with T=6900 K,
5170
complex, with the synthetic spectrum
with T=6900 K,
 ,
,
![$\rm [Fe/H]=0$](/articles/aa/full_html/2009/14/aa10917-08/img4.png) ,
and
,
and
 km s-1,
overplotted.
km s-1,
overplotted.
3.2 Radial-velocity measurements
The orders of the eight spectra were first cosine-tapered to reduce
edge effects. Cross-correlations were performed using the best-fit
velocity-broadened synthetic spectrum, as determined above, as a reference.
The spectrum of the sky-fiber indicated that the sky contribution
was typically of the order of 0.5%. However, for the observation at
0.74 orbital phase (epoch 5), the
relative sky levels were an order of magnitude higher,
due to a combination of bad seeing and a full moon.
We therefore subtracted the sky spectrum from all target spectra before
cross-correlation.
The resulting radial-velocity data are presented in Table 3, after correction to
heliocentric values. The uncertainties are estimated from the variation in the radial-velocity fits between the different orders. The final radial-velocity data as function of orbital phase (the latter determined from the transit photometry), are shown in Fig. 3. The data were fitted with a sine function with amplitude, K, and a zero point, V0, as free parameters. The radial-velocity amplitude was determined at
 m/s, with V0=+0.2 km s-1.
We also determined the variations in the bisector span (following Queloz et al. 2001) as function of both radial velocity and orbital phase, which are shown
in Fig. 4. We performed a least-squares fit of the bisector span measurements as a function of orbital phase with a sinusoid, but no significant variations
at a level of
 km s-1 were found.
Although this means that there is no indication that the measured radial-velocity variations are due to line-shape variations, caused by either stellar
activity or blends of more than one star, the errors are large,
making any claim based on the bisector span uncertain.
km s-1 were found.
Although this means that there is no indication that the measured radial-velocity variations are due to line-shape variations, caused by either stellar
activity or blends of more than one star, the errors are large,
making any claim based on the bisector span uncertain.
![\begin{figure}
\par\includegraphics[width=8.5cm,clip]{0917fig3.ps}
\end{figure}](/articles/aa/full_html/2009/14/aa10917-08/img59.png) |
Figure 3: The radial velocity measurements of OGLE2-TR-L9 as function of orbital phase from the ephemeris of the transit photometry. |
| Open with DEXTER | |
![\begin{figure}
\par\includegraphics[width=8.8cm,clip]{0917fig4.ps}
\end{figure}](/articles/aa/full_html/2009/14/aa10917-08/img60.png) |
Figure 4:
Bisector variations as function of orbital phase
( top panel) and radial-velocity value ( bottom panel). The solid line and
dashed lines in the top panel indicate the least-squares fit to the sinusoidal
variation in the bisector span and its uncertainty at
|
| Open with DEXTER | |
4 Estimation of the stellar and planetary parameters
4.1 Stellar mass, radius, and age
The transit photometry provides an estimate of the mean density of the
host star, while the spectroscopic observations yield its surface temperature,
surface gravity, and metallicity. The stellar evolutionary tracks of
Siess et al. (2000) were used subsequently to estimate the star's mass, radius,
and age, resulting in
 ,
,
 ,
and an age of <0.66 Gyr.
These parameters correspond to a surface gravity of
,
which is in reasonable agreement, but about 1.7
,
and an age of <0.66 Gyr.
These parameters correspond to a surface gravity of
,
which is in reasonable agreement, but about 1.7 lower than the
spectroscopic value. It should be realised that it is notoriously difficult
to obtain reliable log g values from spectra at relatively low signal-to-noise ratio.
lower than the
spectroscopic value. It should be realised that it is notoriously difficult
to obtain reliable log g values from spectra at relatively low signal-to-noise ratio.
4.2 Planetary mass and radius
Using the values obtained from the transit fit to the GROND light curves,
the radial-velocity curve fit, and the stellar parameters derived above,
we obtain a planetary mass of
 and
a planetary radius of
and
a planetary radius of
 .
The semi-major axis of the orbit is
.
The semi-major axis of the orbit is
 AU, and the mean density
of the planet is
AU, and the mean density
of the planet is
 g cm-3.
This implies that OGLE2-TR-L9b is one of the largest known transiting
hot Jupiters, only TrES-4b and WASP-12b are marginally larger,
although its mean density is similar to that of Jupiter.
Even so, OGLE2-TR-L9b is significantly larger than expected for
an irradiated 4.5
 planet (Fressin et al. 2007).
5 Rejection of blended eclipsing binary scenarios
Large photometric transit surveys are prone to produce a significant fraction of false interlopers among genuine, transiting, extrasolar planets. If the light from a short-period eclipsing stellar binary is blended with that from a third, brighter star, the combined photometric signal can mimic a transiting exoplanet. Although the radial-velocity variations induced by an eclipsing binary should be orders of magnitude larger than those caused by a planet, the blending of the spectral lines with those from the brighter, third star could produce variations in the overal cross-correlation profile that have significantly smaller amplitudes, possibly as small as expected for giant planets. Since this would be accompanied by significant line-shape variations, bisector-span analyses are often used to reject a blended eclipsing-binary scenario.
![\begin{figure}
\par\includegraphics[width=8cm]{0917fg5a.ps}\vspace*{5mm}
\includegraphics[width=8cm]{0917fg5b.ps}\par
\end{figure}](/articles/aa/full_html/2009/14/aa10917-08/img70.png) |
Figure 5:
The upper panel shows the stellar surface temperature,
|
| Open with DEXTER | |
 ,
versus the
mean density,
,
versus the
mean density,
 ,
for evolutionary tracks of Siess et al.
(
,
for evolutionary tracks of Siess et al.
( years, (and
 years for
 ), with larger symbols indicating higher ages.
The dashed line indicates the maximum possible
), with larger symbols indicating higher ages.
The dashed line indicates the maximum possible
 )
of light contamination.
)
of light contamination.Although no significant variations in the bisector span are observed in OGLE2-TR-L9, it could be argued that this is due to the low signal-to-noise ratio of the data. We show however that a blended eclipsing-binary scenario can be rejected anyway, because of the following observations:
- 1
- Transit light curves from g' to z' band: as can be seen in Fig. 1, there is excellent agreement between the light curves from g to z band. This means that if the transit was caused by a background eclipsing binary blended with a bright foreground star, the colors (and thus the surface temperatures) of the eclipsed binary star and foreground star should be similar.
- 2
- Transit shape and spectral classification: the mean stellar density determined from the transit photometry is in excellent agreement with that inferred from the spectral classification, both beingconsistent with an early F-star. Using the argument above, this means that if this is a blend, then both the foreground star and the eclipsed binary star should be early F stars.
To explore further the possible role of additional light from
a blended star, we performed a quantitative analysis, simulating
background eclipsing-binary systems with their light
diluted by that from a third star. We first used the stellar evolutionary
tracks of Siess et al. (2000) to determine the full range of stellar
parameters that can be present in eclipsing binaries, of which only
the stellar surface temperature,
 ,
and the mean stellar
density,
,
and the mean stellar
density,
 of the eclipsed star are of interest in the
simulations. We note that the evolutionary status of the third star is not
important, since we do not restrict ourselves to physical triple systems,
but also include chance-alignments of back- and foreground stars.
As indicated in the top panel of Fig. 5, where
the stellar evolutionary tracks are shown, there is a maximum possible
mean-stellar density at a given surface temperature.
This was used as a boundary condition in the simulations.
of the eclipsed star are of interest in the
simulations. We note that the evolutionary status of the third star is not
important, since we do not restrict ourselves to physical triple systems,
but also include chance-alignments of back- and foreground stars.
As indicated in the top panel of Fig. 5, where
the stellar evolutionary tracks are shown, there is a maximum possible
mean-stellar density at a given surface temperature.
This was used as a boundary condition in the simulations.
In our simulations, we varied two parameters, 1) the difference
between the surface temperature of the eclipsed star and that of the third
star,  (-1000 K <
 K), and 2) the fraction of light originating from the third (possibly unrelated) star,
 (
(
 %).
The combined light of the eclipsing binary and third star
should produce a spectrum with a surface temperature of
%).
The combined light of the eclipsing binary and third star
should produce a spectrum with a surface temperature of
 K. Therefore, a
simple linear relation between
K. Therefore, a
simple linear relation between
 and the surface temperatures
of the individual stars was assumed, such that
and the surface temperatures
of the individual stars was assumed, such that
 .
We note that any small fraction of light that could originate from the eclipsing star is simply added to
.
In this way,
each combination of
and
results in a
and
a maximum possible
.
It also results in a fractional
contribution of light from the third star that varies over the four filters.
.
We note that any small fraction of light that could originate from the eclipsing star is simply added to
.
In this way,
each combination of
and
results in a
and
a maximum possible
.
It also results in a fractional
contribution of light from the third star that varies over the four filters.
For each combination of
and ,
model eclipsing-binary light curves were fitted to the g'r'i'z' GROND data, using as before the algorithms of Mandel & Agol (2002), in which the binary size ratio and the impact parameter were completely free to vary, and
was restricted to below the upper limit set by
.
In this way, all possible blended eclipsing-binary scenarios were simulated, independently of whether or not the third star was physically related to the binary. The bottom panel of Fig. 5 shows the confidence contours of the -squared analysis of all possible blended
eclipsing binary scenarios. It shows that the combined g'r'i'z' data can only be fitted by light curves of eclipsing-binaries with a low level  30% (90% confidence level) of blended light, meaning that most of the light in the stellar spectrum must originate from the eclipsed star. Scenarios in which the stellar spectrum is dominated by a third star with a small contribution from a background eclipsing binary, can be strongly rejected. The transit light curves produced by those
rejected scenariosare simply too wide, too V-shaped, and/or too color dependent to fit the GROND data. One scenario that we cannot reject, is a small contribution from a blended star. For example, it could in principle be possible that the light from the transited F3 star is diluted at a 30% level by light from another F-star (with a similar
30% (90% confidence level) of blended light, meaning that most of the light in the stellar spectrum must originate from the eclipsed star. Scenarios in which the stellar spectrum is dominated by a third star with a small contribution from a background eclipsing binary, can be strongly rejected. The transit light curves produced by those
rejected scenariosare simply too wide, too V-shaped, and/or too color dependent to fit the GROND data. One scenario that we cannot reject, is a small contribution from a blended star. For example, it could in principle be possible that the light from the transited F3 star is diluted at a 30% level by light from another F-star (with a similar  and radial velocity, otherwise it would be evident in the spectra). In this case, the transiting planet would be 30% more massive (and 15% larger) than determined above, by no means outside the planet mass range.
We note that for most transiting planets presented in the literature, such a low-level contamination scenario cannot be excluded, since the variations in the bisector span would be orders of magnitude smaller than in the case of a blended eclipsing stellar binary. This is because the radial-velocity variations in the latter case are 102-3 times larger than in the first case.
There have been several reports of blended eclipsing binaries
hiding out as transiting planets, most notably by Mandushev et al. (2005) and
Torres et al. (2004). However, these studies dealt with low
signal-to-noise-ratio light curves, whereas the true nature of these systems
would have been easily established
by high quality photometric data similar to that presented in this paper.
Mandushev et al. (2005) rejected a transiting planet scenario
for the rapidly rotating (
 km s-1) F5 star GSC 01944-02289, in
favour of a blended eclipsing binary. This system was shown to
be a hierarchical triple consisting of an eclipsing binary with G0V and M3V components, in
orbit around a slightly evolved F5 dwarf. The latter star in this
scenario contributes 89% of the total light in the system.
Although they claim that the true nature of this system was not revealed
by their BVI light curves,
the color difference between the G0V and F5V star implies that the transit
must be 25-30% deeper in I-band than in B-band. However, no quantitative
analysis of the light curves was presented, and the authors claimed that
the true nature of the system was only brought to light by spectroscopic
means.
In a similar fashion, Torres et al. (2004) presented the case of OGLE-TR-33,
which was identified as a triple system consisting of an eclipsing
binary with F4 and K7-M0 components orbiting a slightly evolved F6 star.
However, the photometry in this study relied solely on the original I-band
OGLE-III data, resulting in a relatively low SNR transit detection for which the
ingress and bottom of the transit were not well covered. They also claimed
that the blended eclipsing binary was only revealed by spectroscopy.
However, their best-fit planet model already pointed towards a
very unlikely planet radius of 3
km s-1) F5 star GSC 01944-02289, in
favour of a blended eclipsing binary. This system was shown to
be a hierarchical triple consisting of an eclipsing binary with G0V and M3V components, in
orbit around a slightly evolved F5 dwarf. The latter star in this
scenario contributes 89% of the total light in the system.
Although they claim that the true nature of this system was not revealed
by their BVI light curves,
the color difference between the G0V and F5V star implies that the transit
must be 25-30% deeper in I-band than in B-band. However, no quantitative
analysis of the light curves was presented, and the authors claimed that
the true nature of the system was only brought to light by spectroscopic
means.
In a similar fashion, Torres et al. (2004) presented the case of OGLE-TR-33,
which was identified as a triple system consisting of an eclipsing
binary with F4 and K7-M0 components orbiting a slightly evolved F6 star.
However, the photometry in this study relied solely on the original I-band
OGLE-III data, resulting in a relatively low SNR transit detection for which the
ingress and bottom of the transit were not well covered. They also claimed
that the blended eclipsing binary was only revealed by spectroscopy.
However, their best-fit planet model already pointed towards a
very unlikely planet radius of 3
 ,
and the V-shaped
transit produced by the blended eclipsing binary would have been
easily detected by our high precision photometry. We note that while
Torres et al. (2004) and Mandushev et al. (2005) only considered
physical triple systems, our analysis presented above covers all
possible scenarios, including those involving chance-alignment of background
or foreground stars.
,
and the V-shaped
transit produced by the blended eclipsing binary would have been
easily detected by our high precision photometry. We note that while
Torres et al. (2004) and Mandushev et al. (2005) only considered
physical triple systems, our analysis presented above covers all
possible scenarios, including those involving chance-alignment of background
or foreground stars.
6 Discussion
More than seven years and >1000 orbital periods after the last observations of OGLE2-TR-L9, we have rediscovered the transit signal only 8 min from its predicted time (from S07). Our study not only shows that an observing campaign with long time intervals between measurements can produce reliable light curves, it also shows that it produces extremely accurate orbital periods.
OGLE2-TR-L9b is the first extrasolar planet discovered transiting a rapidly rotating (
 km s-1) F star. OGLE2-TR-L9 is also the star with the highest surface temperature (T=6933 K) of all main-sequence stars that host an exoplanet known to date. It is therefore unsurprising that the uncertainties in the radial-velocity variations are higher than for most other transiting exoplanets presented in the literature. Only because of the high mass of OGLE2-TR-L9b, were we able to detect its radial-velocity signature. We note, however, that since a blend scenario can be rejected at high significance, an upper limit to the mass of OGLE2-TR-L9b would have been sufficient to claim the presence of a transiting, extrasolar planet, although of unknown mass. Similar arguments may have to be used in the case of future detection of the transits of Earth-size planets from Kepler or CoRoT, since their radial-velocity signature may be too small to measure.
OGLE2-TR-L9b has a significantly larger radius than expected for a planet of about 4.5 times the mass of Jupiter, even if it is assumed that 0.5% of the incoming stellar luminosity is dissipated at the planet's center (Fressin et al. 2007). However, it is not the only planet found to be too large (e.g. CoRoT-exo-2b, TrES-4b, and XO-3b). Several mechanisms have been proposed to explain these ``bloated'' radii, such as more significant core heating and/or orbital tidal heating (see Liu et al. 2008, for a recent detailed discussion).
The measured
and estimated stellar radius have been combined to infer a
rotation period of the host star of
 days. This implies that the rotation of the star is not locked to the orbital period of OGLE2-TR-L9b. A
of 39 km s-1 is within
the normal range for stars of this spectral type.
The mean
of F5 to F0 stars
in the solar neighbourhood range from 102 to 103 km s-1
respectively. We note that the
of OGLE2-TR-L9a is only
9% of the expected break-up velocity for a star of this
mass and radius. Assuming the general Roche model for a rotating
star (e.g. Seidov 2004), the ratio of polar to equatorial radius
of OGLE2-TR-L9a will be of the order of,
days. This implies that the rotation of the star is not locked to the orbital period of OGLE2-TR-L9b. A
of 39 km s-1 is within
the normal range for stars of this spectral type.
The mean
of F5 to F0 stars
in the solar neighbourhood range from 102 to 103 km s-1
respectively. We note that the
of OGLE2-TR-L9a is only
9% of the expected break-up velocity for a star of this
mass and radius. Assuming the general Roche model for a rotating
star (e.g. Seidov 2004), the ratio of polar to equatorial radius
of OGLE2-TR-L9a will be of the order of,
 .
Thus, the rotational
flattening of the host star is not expected to
influence the transit shape significantly.
OGLE2-TR-L9 is expected to exhibit a strong Rossiter-McLaughlin effect.
Simulations using a segmented, stellar surface predict an amplitude of
230 m/s.
.
Thus, the rotational
flattening of the host star is not expected to
influence the transit shape significantly.
OGLE2-TR-L9 is expected to exhibit a strong Rossiter-McLaughlin effect.
Simulations using a segmented, stellar surface predict an amplitude of
230 m/s.
Acknowledgements
We thank the anonymous referee very much for his or her insightful comments. Based on observations collected at the European Organisation for Astronomical Research in the Southern Hemisphere, Chile (280.C-5036(A)). T.K. acknowledges support by the DFG cluster of excellence ``Origin and Structure of the Universe''.
References
- Aigrain, S., Collier Cameron, A., Ollivier, M., et al. 2008, A&A, 488, L43 In the text
- Anderson, D. R., Gillon, M., Hellier, C., et al. 2008, MNRAS, 387, L4 In the text
- Burke, C. J., et al. 2008, ApJ, submitted, [arXiv:0805.2399]
- Charbonneau D., Brown T. M., Noyes R. W., & Gilligand R. L. 2002, ApJ 568, 377 In the text
- Charbonneau D., Allen L., Megeath S., et al. 2005, ApJ, 626, 523 In the text
- Claret, A. 2004, A&A, 428, 1001 In the text
- Dekker, H., D' Odorico, S., Kaufer, A., Delabre, B., & Kotzlowski, H. 2000, SPIE, 4008, 534 In the text
- Deming, D., Seager, S., Richardson, L. J., & Harrington, J. 2005, Nature, 434, 740 In the text
- Fressin, F., Guillot, T., Morello, V., & Pont, F. 2007, A&A, 475, 729 In the text
- Greiner, J., Bornemann, W., Clemens, C., et al. 2008, PASP, 120, 405 In the text
- Hubeny, I., Lanz, T., & Jeffery, C. S. 1994, SYNSPECa User's Guide, in Newsl. on Analysis of Astronomical Spectra 20, St. Andrews Univ.
- Knutson, H. A., Bornemann, W., Clemens, C., et al. 2007, Nature, 447, 183 In the text
- Liu, X., Burrows, A., & Ibgui, L. 2008, ApJ, in press [arXiv:0805.1733] In the text
- Mandel, K., & Agol, E. 2002, ApJ, 580, L171 In the text
- Mandushev, G., Torres, G., Latham, D. W., et al. 2005, ApJ, 621, 1061 In the text
- Mandushev, G., O'Donovan, F. T., Charbonneau, D., et al. 2007, ApJ, 667, L195 In the text
- Pasquini, L., Avila, G., Blecha, A., et al. 2002, The Messenger, 110, 1 In the text
- Queloz, D., Henry, G. W., Sivan, J. P., et al. 2001, A&A, 379, 279 In the text
- Seidov Z. 2004, The generalized Roche model [arXiv:astro-ph/0407174] In the text
- Shporer, A., et al. 2008, ApJ, submitted [arXiv:0806.4008] In the text
- Siess, L., Dufour, E., & Forestini, M. 2000, A&A, 358, 593 In the text
- Snellen, I. A. G., van der Burg, R. F. J., de Hoon, M. D. J., & Vuijsje, F. N. 2007, A&A, 476, 1357 (S07) In the text
- Snellen, I. A. G., Albrecht, S., de Mooij, E. J. W., & Le Poole, R. S. 2008, A&A, 487, 357 In the text
- Szymanski, 2005, Acta Astron., 55, 43 In the text
- Tinetti, G., Vidal-Madjar, A., Liang, M.-C., et al. 2007, Nature, 448, 169 In the text
- Torres G., Konacki M., Sasselov D., & Saurabh J. 2004, ApJ, 614, 979 In the text
- Udalski, A., Kubiak, M., & Szymanski, M. 1997, Acta Astron., 47, 319 In the text
- Udalski, A., Pont, F., Naef, D., et al. 2008, A&A, 482, 299 In the text
Footnotes
- ... star
- Based on observations collected at the European Organisation for Astronomical Research in the Southern Hemisphere, Chile (280.C-5036(A)).
- ...
Munich
- http://www.usm.lmu.de/~arri/mupipe/
- ... atmospheres
- http://kurucz.harvard.edu/grids.html
All Tables
Table 1:
Limb-darkening coefficients used for the transit fitting, taken
from Claret (2004) for a star with metallicity
![]() ,
surface gravity
,
surface gravity
![]() ,
and effective temperature
,
and effective temperature
![]() K.
K.
Table 2: The transit, host star, and planetary companion parameters as determined from our photometric and spectroscopic observations.
Table 3: Spectroscopic observations of OGLE2-TR-L9 taken with UVES/FLAMES. The first three columns give the Heliocentric Julian Date, the planet's orbital phase at the time of observation, and the signal-to-noise ratio of the spectra per resolution element in the center of the middle order. Columns 4 and 5 give the radial velocity and the bisector span measurements.
All Figures
| |
Figure 1: Transit lightcurves of OGLE-TR-L9 in g', r', i', and z' observed simultaneously with the GROND instrument, mounted on the MPI/ESO 2.2 m telescope. The line shows the best fit model for the combined light curves, as discussed in the text. |
| Open with DEXTER | |
| In the text | |
| |
Figure 2:
The central part of one order of the combined UVES
spectrum of OGLE2-TR-L9,
with overplotted a synthetic spectrum with T=6900 K, g=4.5,
|
| Open with DEXTER | |
| In the text | |
| |
Figure 3: The radial velocity measurements of OGLE2-TR-L9 as function of orbital phase from the ephemeris of the transit photometry. |
| Open with DEXTER | |
| In the text | |
| |
Figure 4:
Bisector variations as function of orbital phase
( top panel) and radial-velocity value ( bottom panel). The solid line and
dashed lines in the top panel indicate the least-squares fit to the sinusoidal
variation in the bisector span and its uncertainty at
|
| Open with DEXTER | |
| In the text | |
| |
Figure 5:
The upper panel shows the stellar surface temperature,
|
| Open with DEXTER | |
| In the text | |
Copyright ESO 2009
Current usage metrics show cumulative count of Article Views (full-text article views including HTML views, PDF and ePub downloads, according to the available data) and Abstracts Views on Vision4Press platform.
Data correspond to usage on the plateform after 2015. The current usage metrics is available 48-96 hours after online publication and is updated daily on week days.
Initial download of the metrics may take a while.