| Issue |
A&A
Volume 497, Number 2, April II 2009
|
|
|---|---|---|
| Page(s) | 481 - 485 | |
| Section | Stellar structure and evolution | |
| DOI | https://doi.org/10.1051/0004-6361/200810512 | |
| Published online | 05 March 2009 | |
Five colour photometry of the RRd star V372 Serpentis![[*]](/icons/foot_motif.png) (Research Note)
(Research Note)
J. M. Benko![]() -
S. Barcza
-
S. Barcza
Konkoly Observatory of the Hungarian Academy of Sciences, PO Box 67, 1525 Budapest, Hungary
Received 3 July 2008 / Accepted 30 January 2009
Abstract
Aims. The first U-band and new
 photometry of the RRd star (Obj)V372 Ser(Obj) is presented to determine some parameters of the star.
Methods. In April, May 2007, 2812
 frames were obtained at Konkoly and Teide Observatories and 1508 V observations were collected from the literature. Fourier fitted light curves were derived in all bands.
Results. The non-linearly coupled frequencies
 ,
,
 ,
i.e. periods
,
i.e. periods
 days,
days,
 d,
P1/P0=0.7441950, amplitudes
A0(V)=0.15399 mag,
A1(V)=0.20591 mag, and phases have been found.
d,
P1/P0=0.7441950, amplitudes
A0(V)=0.15399 mag,
A1(V)=0.20591 mag, and phases have been found.
 has been found from averaging the amplitude ratio in the different bands i.e. the first overtone is the dominant pulsation mode. From the V observations, upper limits are given for secular change of the Fourier parameters. The period ratio and period put V372 Ser among the RRd stars of the globular clusters M3 and IC 4499; mass, luminosity, and metallicity estimates are given.
Key words: stars: variables: RR Lyr - stars: fundamental parameters - stars: individual: V372 Serpentis
1 Introduction
Double mode pulsation plays a key role in the mass determination of RR Lyrae (RRL) variable stars because a confirmed RRL type component is not known in binary systems. We have indirect methods to determine their mass (Smith 1995): for double mode RRL (RRd) stars the Petersen diagram (Petersen 1973) offers a possibility of the most accurate determination. Of course, the derived values depend on the theoretical input.
In spite of the importance of RRd stars there are very few observed data of their multicolour photometric behaviour. This is partially due to the moderate number of known stars: at the moment of this writing we know 30 more or less bright RRd stars (V < 14 mag) in the Galactic field discovered by the NSVS and ASAS all-sky variability surveys (Pilecki & Szczygiel 2007; Wils et al. 2006; Khruslov 2007; Szczygiel & Fabrycky 2007). Only two stars ((Obj)GSC 4868-0831(Obj) and V372 Ser) are known with V < 11.5 mag. A number of fainter objects were discovered in the Galactic bulge (Mizerski 2003) and several more in extragalactic systems allowing us to draw statistically significant conclusions concerning distribution of the RRd stars in the Petersen diagram, etc. (see Clementini et al. 2004, and references therein).
To date (Obj)AQ Leo(Obj), (Obj)CU Com(Obj), two fainter Galactic, and nine extragalactic RRd stars have been studied spectroscopically (Gratton et al. 2004; Clement et al. 1991; Clementini et al. 2000). Multicolour photometric time series are available for CU Com (CCD BVI, Clementini et al. 2000), (Obj)BS Com(Obj) (CCD BVRI, Dékány 2008) and AQ Leo (photoelectric BV,Jerzykiewicz & Wenzel 1977; Jerzykiewicz et al. 1982). Some multicolour CCD time series were also published for six globular clusters containing at least one RRd star ((Obj)IC 4499(Obj), (Obj)M15(Obj), (Obj)M68(Obj), (Obj)M3(Obj), (Obj)NGC 6426(Obj), and (Obj)NGC 2419(Obj)).
The RRd character of V372 Ser ((Obj)GSC 5002-0629(Obj),
 ,
,
 )
was discovered a few years ago (Garcia-Melendo et al. 2001). It is the second brightest known field RRd star (Szczygiel & Fabrycky 2007) and it is especially suited for high precision CCD photometric observations because in its vicinity there are comparison and check stars
((Obj)GSC 5002-0506(Obj), (Obj)GSC 5002-0525(Obj), (Obj)GSC 5002-0566(Obj)) approximately of the same brightness and colour.
)
was discovered a few years ago (Garcia-Melendo et al. 2001). It is the second brightest known field RRd star (Szczygiel & Fabrycky 2007) and it is especially suited for high precision CCD photometric observations because in its vicinity there are comparison and check stars
((Obj)GSC 5002-0506(Obj), (Obj)GSC 5002-0525(Obj), (Obj)GSC 5002-0566(Obj)) approximately of the same brightness and colour.
This study presents the first U-band as well as new
time-series data for this RRd star and the fundamental parameters which could be derived from the frequencies. Section 2 describes the observations and reductions, Sect. 3 presents the frequency analysis and Fourier fitted colour curves. In Sect. 4 a short discussion is given and the conclusions
are drawn.
2 Observations and reduction
2.1 Observations
Table 1: Log of the observations of V372 Ser.
The observational material of V372 Ser was collected in the spring of 2007 with two telescopes (see Table 1 for details). The 1-m RCC telescope is mounted at the Piszkésteto Mountain Station of the Konkoly Observatory. It was used with the UV-enhancement coating Versarray 1300B camera constructed by Princeton Instruments. This device contains a back illuminated EEV CCD36-40 1340  1300 chip that corresponds to a

 field of view (FOV) with
 pixel-1 resolution. The camera was driven by QPAsO, a Tcl based observing software running on Linux platforms developed by the Konkoly staff. The IAC80
![]() telescope of Teide Observatory with its standard camera was the other telescope. It contains an EEV UV-coated back illuminated
2148
2048 chip, 11'
telescope of Teide Observatory with its standard camera was the other telescope. It contains an EEV UV-coated back illuminated
2148
2048 chip, 11'
 FOV with
 pixel-1 resolution. Standard Johnson
  and Kron-Cousins
 filters were used in the observations.
We obtained 2812 images in all colours, more than 560 for each filter. The typical exposure times were 150, 80, 40, 20, 20 s (IAC80), 120-180, 60, 15-40, 5-20, 10-20 s (RCC) for
,
respectively. Each night, sky flats (or alternatively dome flats) and some bias frames (5-50) were taken as main calibration images.
2.2 Data reduction and photometry
We used the IRAF/CCDRED![]() package for the standard reduction procedures: bias and flat field correction. Other corrections (e.g. dark current, deferred charge, non-linearity) were also investigated, but they were found to be negligible.
package for the standard reduction procedures: bias and flat field correction. Other corrections (e.g. dark current, deferred charge, non-linearity) were also investigated, but they were found to be negligible.
The star brightness was determined by using the aperture photometry task DAOPHOT/PHOT of I RAF. This method provides robust flux estimates with small errors for isolated stars such as V372 Ser, its comparison and the check stars. For a finding chart see Fig. 1 in Garcia-Melendo et al. (2001). We carried out relative photometry using GSC 5002-0506 (star A of Garcia-Melendo et al. 2001) as the primary comparison star. GSC 5002-0525 and GSC 5002-0566 (stars B and C, respectively) were the check stars. The red star (Obj)GSC 5002-0560(Obj) (star D of Garcia-Melendo et al. 2001) was excluded from our study because its colour indices differ from those of the variable and the brightness we measured differs significantly from the value given by Garcia-Melendo et al. (2001). It might be a long period red variable of small amplitude.
2.3 Transformation into the standard system
![\begin{figure}
\par\includegraphics[width=18cm,clip]{0512fig1.eps}
\end{figure}](/articles/aa/full_html/2009/14/aa10512-08/img20.png) |
Figure 1: V light curve of V372 Ser. Blue, green, and red symbols denote observations of Garcia-Melendo et al. (2001), observations with the 1 m RCC telescope at Konkoly Observatory and the IAC80 telescope at Teide Observatory, respectively. Line: fitted Fourier solution Eq. (2). |
| Open with DEXTER | |
Table 2: Standard magnitudes and colour indices of the comparison and check stars.
The instrumental magnitudes were transformed into the
 Johnson-Cousins system.
The standard sequence published by Landolt (1973) was used as a source of standard magnitudes. Our standard
magnitudes for stars A-C were determined on the nights HJD-2 454 200 = 23 and 48. Within the errors our values were identical to those of Garcia-Melendo et al. (2001), therefore, we used the weighted mean (giving half weight to our measurements of 2 454 223). Table 2 gives our accepted magnitudes and colour indices. Each night, colour differences
Johnson-Cousins system.
The standard sequence published by Landolt (1973) was used as a source of standard magnitudes. Our standard
magnitudes for stars A-C were determined on the nights HJD-2 454 200 = 23 and 48. Within the errors our values were identical to those of Garcia-Melendo et al. (2001), therefore, we used the weighted mean (giving half weight to our measurements of 2 454 223). Table 2 gives our accepted magnitudes and colour indices. Each night, colour differences
 were determined from all frames and correlated with
 ,
where u,b,...are the instrumental magnitudes of stars A-C. Since almost perfect linear relations and
random scatter were found, the magnitude differences of V372 Ser were transformed to the standard
magnitudes by the formulae
,
where u,b,...are the instrumental magnitudes of stars A-C. Since almost perfect linear relations and
random scatter were found, the magnitude differences of V372 Ser were transformed to the standard
magnitudes by the formulae
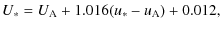
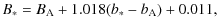
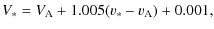
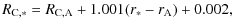
where the asterisk indicates V372 Ser. Between HJD-2 454 245 = 0.3971-.5280 we have simultaneous observations with the telescopes RCC and IAC80. Zero point corrections -0.043,-.025,-0.034,-0.019,+0.004 were added to the RCC
 magnitudes in order to obtain congruence of the RCC and IAC80 light curves.
The typical errors of individual observations were between 0.01-0.02 mag in
 and 0.03 mag in U.
The construction of our observational database![]() is simple: the file includes the heliocentric Julian date (HJD) and magnitudes in the Johnson-Cousins reference
,
respectively. In the last column of the table a quality flag is given, it indicates the 13 frames that were excluded from the analysis because of poor atmospheric conditions (e.g. sudden transparency loss exceeding 1.5 mag).
is simple: the file includes the heliocentric Julian date (HJD) and magnitudes in the Johnson-Cousins reference
,
respectively. In the last column of the table a quality flag is given, it indicates the 13 frames that were excluded from the analysis because of poor atmospheric conditions (e.g. sudden transparency loss exceeding 1.5 mag).
Table 3: Fourier decomposition of the UBV(RI)C light curves.
3 Analysis of the light curves
3.1 Pulsation frequencies
We performed standard Fourier frequency analysis on our time series data using the program
package MuFrAn (Kolláth 1990). The frequencies of the fundamental and first overtone
modes (
 ,
,
 )
and their
)
and their
 daily aliases were clearly observed. With the first approximation of these two frequencies and some harmonics a simultaneous nonlinear fit was carried out. Then the light curves were whitened out by subtracting the result of the fit. The Fourier spectra of the residual light curves contain strong peaks which can be identified with the coupling term f0+f1 and its aliases. Their appearance is an unambiguous signal of strong nonlinear coupling in the stellar pulsation. In order to identify further frequency components, a successive prewhitening procedure was performed. The subsequently found frequencies were fitted simultaneously with all previously identified ones and their overall
contribution was subtracted from the original data set. This iterative method increases the signal detection probability by eliminating the strong alias structure in the vicinity of a frequency peak, enabling one to identify hidden low amplitude components suppressed by aliases and separate
frequency peaks that are close to each other. As a result, 14 frequencies of the light variation were found (see Table 3).
daily aliases were clearly observed. With the first approximation of these two frequencies and some harmonics a simultaneous nonlinear fit was carried out. Then the light curves were whitened out by subtracting the result of the fit. The Fourier spectra of the residual light curves contain strong peaks which can be identified with the coupling term f0+f1 and its aliases. Their appearance is an unambiguous signal of strong nonlinear coupling in the stellar pulsation. In order to identify further frequency components, a successive prewhitening procedure was performed. The subsequently found frequencies were fitted simultaneously with all previously identified ones and their overall
contribution was subtracted from the original data set. This iterative method increases the signal detection probability by eliminating the strong alias structure in the vicinity of a frequency peak, enabling one to identify hidden low amplitude components suppressed by aliases and separate
frequency peaks that are close to each other. As a result, 14 frequencies of the light variation were found (see Table 3).
To determine the final set of frequencies we investigated the CCD V data set observed in the years 1997-1998 by Garcia-Melendo et al. (2001). Performing the above described frequency search we obtained a Fourier solution with 12 elements of very similar parameters to our previous ones, both for the
frequencies (
 ,
,
 )
and the amplitudes.
Differences between periods are 3.78 and 12.64 s for f1-1 and f0-1, respectively:
the frequency content of the light variations seems to be unchanged within the last ten years. To verify this conjecture we tried to perform a common fit of all the available V data. Because of the lack of data for 10 years, to unify the two data sets in a common Fourier analysis is not practical due to the very unfavourable window function. None of the further determined Fourier parameters (frequencies, amplitudes and phase) based only on either of the data sets gave us an acceptable fit for the unified data. Therefore, we refined the frequency analysis by a successive approximation on the combined data, where the residuals of the non-linear fit were minimized while the structure of the decomposition (number of harmonics and linear combinations) was fixed and the two frequencies were independently changed in their limiting intervals. As a result of this process we could fit the total light curve at the frequencies
)
and the amplitudes.
Differences between periods are 3.78 and 12.64 s for f1-1 and f0-1, respectively:
the frequency content of the light variations seems to be unchanged within the last ten years. To verify this conjecture we tried to perform a common fit of all the available V data. Because of the lack of data for 10 years, to unify the two data sets in a common Fourier analysis is not practical due to the very unfavourable window function. None of the further determined Fourier parameters (frequencies, amplitudes and phase) based only on either of the data sets gave us an acceptable fit for the unified data. Therefore, we refined the frequency analysis by a successive approximation on the combined data, where the residuals of the non-linear fit were minimized while the structure of the decomposition (number of harmonics and linear combinations) was fixed and the two frequencies were independently changed in their limiting intervals. As a result of this process we could fit the total light curve at the frequencies
 ,
,
 with a rms accuracy of 0.014 mag.
Since the frequencies were found to be stable we can employ the spectrum averaging method (SAM) as implemented by Nagy & Kovács (2006) to find additional peaks which remained hidden in the individual spectra.
The two spectra were added, weighted inversely with their variances. The morphology of the peaks of the summed spectrum confirmed again that the frequencies were constant within their errors. We subtracted a non-linear fit of the accurate frequencies and their harmonics from both light curves separately, then the Fourier spectra of residuals were summed again to find the next frequency and so on. At the end of this process we achieved a spectrum without any significant additional peaks at a  level (for the definition of the significance level of a peak see Alcock et al. 2000).
Our conclusion is that an additional signal has not been found: the Fourier decomposition of our data revealed all significant frequencies.
level (for the definition of the significance level of a peak see Alcock et al. 2000).
Our conclusion is that an additional signal has not been found: the Fourier decomposition of our data revealed all significant frequencies.
3.2 Fourier amplitudes and phase
Using the obtained frequencies, their harmonics and linear combinations, non-linear fits were computed determining amplitudes and phase for all bands. We assumed the light curves m(t) to be in the form
![\begin{displaymath}%
m(t)=A_{00}^{(c)}+\sum_{jk}{A_{jk}}^{(c)}\sin[2\pi\nu_{jk}(t-t_0)
+\varphi_{jk}^{(c)}],
\end{displaymath}](/articles/aa/full_html/2009/14/aa10512-08/img65.png)
where
 ,
,
 ,
,
 ,
and the epoch of an arbitrarily chosen phase was
t0=2450539. The results are given in Table 3. These parameters allowed us to construct synthetic light curves. As an example
the synthetic and observed V light curves are shown in Fig. 1. The residual rms scatters of the fits are 0.012, 0.015, 0.015, 0.018 for
,
and the epoch of an arbitrarily chosen phase was
t0=2450539. The results are given in Table 3. These parameters allowed us to construct synthetic light curves. As an example
the synthetic and observed V light curves are shown in Fig. 1. The residual rms scatters of the fits are 0.012, 0.015, 0.015, 0.018 for
 bands,
respectively, and it is 0.028 for U. These values of scatter are compatible with the
observational accuracy. For the unified V filter data (Garcia-Melendo et al. 2001, and ours) we also found a fit with rms = 0.014, similar amplitudes, and phase as given in Table 3. This indicates that on a 10 year scale not only were frequencies and amplitudes stable but phase as well. Folded V light curves are given in Fig. 2.
bands,
respectively, and it is 0.028 for U. These values of scatter are compatible with the
observational accuracy. For the unified V filter data (Garcia-Melendo et al. 2001, and ours) we also found a fit with rms = 0.014, similar amplitudes, and phase as given in Table 3. This indicates that on a 10 year scale not only were frequencies and amplitudes stable but phase as well. Folded V light curves are given in Fig. 2.
![\begin{figure}
\par\includegraphics[width=8.5cm,clip]{0512fig2.eps}
\end{figure}](/articles/aa/full_html/2009/14/aa10512-08/img70.png) |
Figure 2: Folded V light curve of V372 Ser, blue and red symbols denote observations of Garcia-Melendo et al. (2001) and the observations with the 1 m RCC and IAC80 telescopes, respectively. Upper panel: folded with P1, middle panel: prewhitened with P0, folded with P1, lower panel: prewhitened with P1, folded with P0. |
| Open with DEXTER | |
The amplitudes of all detected frequencies increase towards shorter wavelengths and the amplitudes of the linear combination frequency components are smaller than those of their constituent frequencies. All of the detected coupling terms are at positive linear combination frequencies of the modes except for f0-f1. This seems to be in agreement with model results of Antonello & Aikawa (1998). According to their non-linear transient double-mode Cepheid models, frequency terms of positive linear combinations always have larger amplitudes than those of negative linear combinations.
To estimate the accuracy of the parameters in Table 3, Monte Carlo simulations were carried out. 1000 artificial time series were constructed for data in each band with the help of the determined Fourier parameters, Gaussian noise and sampling according to the real observations.
The epochs of the beginning of data sampling were randomly chosen for the first trial, then they were shifted by 0.01 day for each subsequently produced synthetic time series. As stressed by
Benko et al. (2006), this is important for the interpretation of possible amplitude variations such as mode changes. The accuracies were found to be between 0.0025 and 0.0007 mag for all amplitudes. The greatest errors are for the U filter data and the smallest ones are for filters  and
and  .
Typical errors of the phase are between 0.01 and 0.004 radians for the two main frequencies.
.
Typical errors of the phase are between 0.01 and 0.004 radians for the two main frequencies.
4 Discussion and conclusions
Table 4 summarizes the relevant data of V372 Ser derived from our Fourier analysis. The average of the amplitude ratios
 shows that the amplitude ratio is independent of colour at the
 level.
From the point of view of frequencies and amplitudes V372 Ser is a double mode RR Lyrae star: the period ratio 0.7441950 is in the canonical range given by non-linear theoretical values expected for RR Lyrae stars (Cox et al. 1983). The first overtone is the dominant mode. In different bands identical frequency content has been found: the atmosphere is grey from the point of view of transmitting pulsation frequencies.
The magnitude-averaged colour indices obtained by fitting the data with Eq. (2) are given in Table 4; they differ slightly from those of Garcia-Melendo et al. (2001):
 ,
,
 ,
except for
,
except for
 .
We attribute this difference to their much smaller sampling of the
.
We attribute this difference to their much smaller sampling of the
 bands and to a possible misprint in their
 instead of 0.19. V372 Ser has reddish colours even if they are dereddened by the upper limit
E(B-V)=0.08 for the galactic coordinates of V372 Ser (Schlegel et al. 1998).
instead of 0.19. V372 Ser has reddish colours even if they are dereddened by the upper limit
E(B-V)=0.08 for the galactic coordinates of V372 Ser (Schlegel et al. 1998).
Table 4: Summary of the relevant data of V372 Ser.
![\begin{figure}
\par\includegraphics[width=9cm,clip]{0512fig3.eps}
\end{figure}](/articles/aa/full_html/2009/14/aa10512-08/img91.png) |
Figure 3: Observed U light curves of a medium, large, and small ascending branch. |
| Open with DEXTER | |
Three U light curves of night quality 1 are reproduced in Fig. 3. They are smooth: humps or bumps indicating atmospheric shocks are not present, in contrast with the ascending branch of e.g. (Obj)SU Dra(Obj) (Preston & Paczynski 1964; Barcza 2002). The duration of an ascending branch is  P1/2.
P1/2.
Upper limits have been estimated for secular change
 of the periods from Monte Carlo simulations and a change of 10-6 in the frequencies in order to find a minimal standard deviation of the V synthetic light curve and observations:

For comparison:
 is typical during the whole lifetime of an RRL star pulsating in single mode except for the short phase before leaving the instability strip (Smith 1995). Upper limits for secular amplitude and phase changes are
 ,
,
 .
.
The ratio
P1/P0=0.744195 and
P0=0.471289 are approximately equal to those of the RRd stars of M3 and IC 4499; both are moderately metal deficient globular clusters (
[M]=-1.57,-1.50,
respectively). Interpolating
P1/P0, P0 in the Petersen diagram of Bono et al. (1996) (derived from non-linear, non-local, time dependent models with the new opacities) gives
 and luminosity
 .
Turbulent convection and more sophisticated hydrodynamic treatment are added to the above model assumptions in (Szabó et al. 2004). Interpolation in their diagrams and tables gives
.
Turbulent convection and more sophisticated hydrodynamic treatment are added to the above model assumptions in (Szabó et al. 2004). Interpolation in their diagrams and tables gives
![$[M]\approx -1.7, {\cal M}> 0.7~\cal{M}_\odot$](/articles/aa/full_html/2009/14/aa10512-08/img101.png) and
and
 .
.
Acknowledgements
This work was partially supported by the OTKA Grant K-62304 and Spanish-Hungarian Bilateral Agreement E-29/04. We are grateful to P. Ábrahám and A. Oscoz for calling our attention to the vacancy in the time table of telescope IAC80 and awarding this to our program on V372 Ser. J.M.B. acknowledges the opportunity to work at IAC80 telescope (Tenerife Observatory, IAC, Spain). We also thank E. Garcia-Melendo for sending us their observational material, L. Szabados for reading the manuscript, R. Szabó for communicating unpublished material, and an anonymous referee for comments.
References
- Alcock, C., Allsman, R., Alves, D. R., et al. 2000, ApJ, 542, 257 In the text
- Antonello, E., & Aikawa, T. 1998, A&A, 337, 145 In the text
- Barcza, S., 2002, A&A, 384, 460 In the text
- Benko, J. M., Bakos, G. Á., & Nuspl, J. 2006, MNRAS, 372, 1657 In the text
- Bono, G., Caputo, F., Castellani, V., & Marconi, M. 1996, ApJ, 471, L33 In the text
- Bono, G., Caputo, F., Castellani, V., et al. 2003, MNRAS, 344, 1097
- Clement, C. M., Kinman, T. D., Suntzeff, N. B., 1991, ApJ, 372, 273 In the text
- Clementini, G., Di Tomaso, S., Di Fabrizio, L., et al. 2000, AJ, 120, 2054 In the text
- Clementini, G., Corwin, T. M., Carney, B. W., et al. 2004, AJ, 127, 938 In the text
- Cox, A. N., Hodson, S. W., Ceancy, S. P., 1983, ApJ, 266, 94 In the text
- Dékány, I. 2008, Astron. Nachr., 328, 833 In the text
- Garcia-Melendo, E., Henden, A. A., & Gomez-Forrellad, J. M. 2001, IBVS, 5167 In the text
- Gratton, R. G., Bragaglia, A., Clementini, G., et al. 2004, A&A, 421, 937 In the text
- Jerzykiewicz, M., & Wenzel, W. 1977, , 27, 35 In the text
- Jerzykiewicz, M., Schult, R. H., & Wenzel, W. 1982, , 32, 357 In the text
- Khruslov, A. V. 2007, Perem. Zvezdy Pril., 7, 7 In the text
- Kolláth, Z. 1990, Occ. Tech. Notes Konkoly. Obs., 1 In the text
- Landolt, A. U. 1973, AJ, 78, 959 In the text
- Mizerski, T. 2003, , 53, 307 In the text
- Nagy, A., & Kovács, G. 2006, A&A, 454, 257 In the text
- Petersen, J. O. 1973, A&A, 27, 89 In the text
- Pilecki, B., & Szczygiel, D. M. 2007, IBVS, 5785 In the text
- Preston, G. W., & Paczynski, B. 1964, ApJ, 140, 181 In the text
- Schlegel, D. J., Finkbeiner, D. P., & Davis, M. 1998, ApJ, 500, 525 In the text
- Smith, H. A. 1995, RR Lyrae Stars (Cambridge: Cambridge Univ. Press) In the text
- Szabó, R., Kolláth, Z., & Buchler, R. 2004, A&A, 425, 627 In the text
- Szczygiel, D. M., & Fabrycky, P. C. 2007, MNRAS, 377, 1263 In the text
- Wils, P., Lloyd, C., & Bernhard, K. 2006, MNRAS, 368, 1757 In the text
Footnotes
- ... V372 Serpentis
- Photometric data are only available in electronic form at CDS via anonymous ftp to cdsarc.u-strasbg.fr (130.79.128.5) or via http://cdsweb.u-strasbg.fr/cgi-bin/qcat?J/A+A/497/481
- ...o
- Guest observer at Teide Observatory, IAC, Spain.
- ... IAC80
- The 0.82 m IAC80 Telescope is operated on the island Tenerife by the Instituto de Astrofisica de Canarias in the Spanish Observatorio del Teide.
- ... IRAF/CCDRED
- IRAF is distributed by the NOAO, operated by the Association of Universities for Research in Astronomy Inc., under contract with the NSF.
- ... database
- Available also at the webpage http://www.konkoly.hu/staff/benko/pub.html
All Tables
Table 1: Log of the observations of V372 Ser.
Table 2: Standard magnitudes and colour indices of the comparison and check stars.
Table 3: Fourier decomposition of the UBV(RI)C light curves.
Table 4: Summary of the relevant data of V372 Ser.
All Figures
| |
Figure 1: V light curve of V372 Ser. Blue, green, and red symbols denote observations of Garcia-Melendo et al. (2001), observations with the 1 m RCC telescope at Konkoly Observatory and the IAC80 telescope at Teide Observatory, respectively. Line: fitted Fourier solution Eq. (2). |
| Open with DEXTER | |
| In the text | |
| |
Figure 2: Folded V light curve of V372 Ser, blue and red symbols denote observations of Garcia-Melendo et al. (2001) and the observations with the 1 m RCC and IAC80 telescopes, respectively. Upper panel: folded with P1, middle panel: prewhitened with P0, folded with P1, lower panel: prewhitened with P1, folded with P0. |
| Open with DEXTER | |
| In the text | |
| |
Figure 3: Observed U light curves of a medium, large, and small ascending branch. |
| Open with DEXTER | |
| In the text | |
Copyright ESO 2009
Current usage metrics show cumulative count of Article Views (full-text article views including HTML views, PDF and ePub downloads, according to the available data) and Abstracts Views on Vision4Press platform.
Data correspond to usage on the plateform after 2015. The current usage metrics is available 48-96 hours after online publication and is updated daily on week days.
Initial download of the metrics may take a while.