| Issue |
A&A
Volume 494, Number 3, February II 2009
|
|
|---|---|---|
| Page(s) | 857 - 865 | |
| Section | Cosmology (including clusters of galaxies) | |
| DOI | https://doi.org/10.1051/0004-6361:200810795 | |
| Published online | 11 December 2008 | |
The origin of redshift asymmetries: how  CDM explains anomalous
redshift
CDM explains anomalous
redshift
S.-M. Niemi1,2 - M. Valtonen1
1 - University of Turku, Department of Physics and Astronomy, Tuorla
Observatory, Väisäläntie 20, Piikkiö, Finland
2 -
Nordic Optical Telescope, Apartado 474, 38700 Santa Cruz de
La Palma, Santa Cruz de Tenerife, Spain
Received 13 August 2008 / Accepted 13 November 2008
Abstract
Aims. Several authors have found a statistically significant excess of galaxies with higher redshifts relative to the group centre, so-called discordant redshifts, in particular in groups where the brightest galaxy, identified in apparent magnitudes, is a spiral. Our aim is to explain the observed redshift excess.
Methods. We use a semi-analytical galaxy catalogue constructed from the Millennium Simulation to study redshift asymmetries in spiral-dominated groups in the ![]() cold dark matter (
cold dark matter (![]() CDM) cosmology. We create two mock catalogues of galaxy groups with the Friends-of-Friends percolation algorithm to carry out this study.
CDM) cosmology. We create two mock catalogues of galaxy groups with the Friends-of-Friends percolation algorithm to carry out this study.
Results. We show that discordant redshifts in small galaxy groups arise when these groups are gravitationally unbound and the dominant galaxy of the group is misidentified. About one quarter of all groups in our mock catalogues belong to this category. The redshift excess is especially significant when the apparently brightest galaxy can be identified as a spiral, in full agreement with observations. On the other hand, the groups that are gravitationally bound do not show a significant redshift asymmetry. When the dominant members of groups in mock catalogues are identified by using the absolute B-band magnitudes, our results show a small blueshift excess. This result is due to the magnitude limited observations that miss the faint background galaxies in groups.
Conclusions. When the group centre is not correctly identified it may cause the major part of the observed redshift excess. If the group is also gravitationally unbound, the level of the redshift excess becomes as high as in observations. There is no need to introduce any ``anomalous'' redshift mechanism to explain the observed redshift excess. Further, as the Friends-of-Friends percolation algorithm picks out the expanding parts of groups, in addition to the gravitationally bound group cores, group catalogues constructed in this way cannot be used as if the groups are purely bound systems.
Key words: galaxies: clusters: general - galaxies: distances and redshifts - methods: N-body simulations - methods: numerical - cosmology: large-scale structure of Universe
1 Introduction
Groups of galaxies contain a large fraction of all galaxies in the Universe (Huchra & Geller 1982; Geller & Huchra 1983; Nolthenius & White 1987; Ramella et al. 2002; Humason et al. 1956; Holmberg 1950). These density enhancements in the sky and in the redshift space are important cosmological indicators of the distribution of matter in the Universe, and may provide important clues for galaxy formation. Groups of galaxies are, in general, divided into a large number of different classes, for example, loose groups (e.g. Ramella et al. 1995; Tucker et al. 2000; Einasto et al. 2003), poor groups (e.g. Zabludoff & Mulchaey 1998; Mahdavi et al. 1999), compact groups (e.g. Hickson 1982; Shakhbazyan 1973; Focardi & Kelm 2002; Hickson et al. 1989) and fossil groups (e.g. Jones et al. 2003; Ponman et al. 1994; D'Onghia et al. 2005; Santos et al. 2007). However, from the observational point of view, groups of galaxies and their member galaxies are not extremely well defined.In recent years a number of grouping algorithms have been developed and applied (e.g. Bahcall et al. 2003; Materne 1978; Botzler et al. 2004; Koester et al. 2007; Yang et al. 2007; Kim et al. 2002; Turner & Gott 1976; Huchra & Geller 1982; Goto et al. 2002) to identify real groups. Despite the vast number of grouping algorithms, the Friends-of-Friends (FoF; Huchra & Geller 1982, hereafter HG82) percolation algorithm remains the most frequently applied. The FoF algorithm or slightly modified versions of it are widely used even for modern day galaxy surveys. Several authors have presented group and cluster catalogues that applied the FoF algorithm based on the SDSS (Sloan digital sky survey) data (e.g. Tago et al. 2008; Berlind et al. 2006; Merchán & Zandivarez 2005) and on the 2dF (the two degree field) data (e.g. Eke et al. 2004; Tago et al. 2006).
Few studies (see Niemi et al. 2007, and references therein) have argued that grouping algorithms may not always return true groups; a significant number of groups can be spurious and contain interlopers. Niemi et al. (2007, hereafter Paper I) have shown that the FoF algorithm produces a significant fraction of groupings which are not gravitationally bound systems, but merely groups in a visual sense. This can introduce various errors when these groups are studied in detail and treated as gravitationally bound structures.
This may even be true for compact groups of galaxies. In this case, and also in general, extended X-ray emission can be used to distinguish real, gravitationally bound groups from spurious ones. The analysis of X-ray data suggests that errors are rather common (Ostriker et al. 1995, and references therein). Unfortunately, groups with low mass and a spiral-dominated main galaxy in general do not show any extended X-ray emission. Therefore this method is not useful for small and loose groups of galaxies.
An excess of higher redshift galaxies was discovered by Arp (1970,1982) and it was studied in detail by Jaakkola (1971). Since then many authors have found a statistically significant excess of high redshift companions relative to the group centre. Bottinelli & Gouguenheim (1973) extended the study of Arp (1970) to nearby groups of galaxies in which the magnitude difference between the companion and the main galaxy was greater than 0.4 mag. Sulentic (1984) found a statistically significant excess of positive redshifts while studying spiral-dominated (i.e. the central galaxy is a spiral galaxy) groups in the catalogue of galaxy groups by HG82, and derived the redshift excess Z = 0.21for spiral-dominated groups while the E/S0 dominated (i.e. the central galaxy is an E/S0 galaxy) groups showed a blueshift excess Z = -0.13. Girardi et al. (1992) found discordant redshifts while studying nearby small groups identified by Tully (1988) in the Nearby Galaxy Catalogue. However, the conventional theory holds that the distribution of redshift differentials for galaxies moving under the gravitational potential of a group should be evenly distributed. Even systematic radial motions within a group would be expected to produce redshift differentials that are evenly distributed.
Multiple theories have been suggested to explain the observed redshift excess. Sulentic (1984) listed some possible origins for the observed redshift excess. Byrd & Valtonen (1985) and Valtonen & Byrd (1986) argued that this positive excess is mainly due to the unbound expanding members and the fact that the dominant members of these groups are sometimes misidentified. Girardi et al. (1992) argued that the positive excess may be explained if groups are still collapsing and contain dust in the intragroup medium. Hickson et al. (1988) ran Monte Carlo simulations and concluded that the random projection can explain discordant redshifts. Iovino & Hickson (1997) found that projection effects alone can account for the high incidence of discordant redshifts. However, studies by Hickson et al. (1988) and Iovino & Hickson (1997) dealt only with Hickson's compact groups of galaxies. Tully (1987) analyzed his catalogue of nearby groups of galaxies and did not find evidence of redshift asymmetries in galaxy groups. However, unlike in earlier work, his reference system was not the apparently brightest group member, but the unweighted average velocity of members. Zaritsky (1992) studied asymmetric distribution of satellite galaxy velocities with Monte Carlo simulations and concluded that observational biases partially explain the observed redshift asymmetry. Despite the number of explanations none of these explanations are satisfactory. Even new physics has been suggested for the solution (see e.g. Arp 1970).
However, there may be a simple explanation of redshift asymmetries which
does not require modifications of well accepted physics, now that the
![]() CDM model can be counted as generally accepted. This was first proposed
by Byrd & Valtonen (1985) who pointed out that redshift asymmetries should arise
in nearby groups of galaxies such as HG groups if a large fraction of the group
population is unbound to the group. They argued that the redshift asymmetry
explains the need for ``missing matter'', the dark matter that was at the time
supposed to exist at the level of the closing density of the universe in groups
of galaxies. If the group as a whole is not virialized, there is no need for
excessive amounts of binding matter. It has now become possible to test this
assumption quantitatively, and this is the main focus of this paper. Independent
evidence has recently appeared of unbound outlying populations of galaxies around
the Local Group and a few other nearby groups, as one would expect in the
CDM model can be counted as generally accepted. This was first proposed
by Byrd & Valtonen (1985) who pointed out that redshift asymmetries should arise
in nearby groups of galaxies such as HG groups if a large fraction of the group
population is unbound to the group. They argued that the redshift asymmetry
explains the need for ``missing matter'', the dark matter that was at the time
supposed to exist at the level of the closing density of the universe in groups
of galaxies. If the group as a whole is not virialized, there is no need for
excessive amounts of binding matter. It has now become possible to test this
assumption quantitatively, and this is the main focus of this paper. Independent
evidence has recently appeared of unbound outlying populations of galaxies around
the Local Group and a few other nearby groups, as one would expect in the
![]() CDM cosmology (Teerikorpi et al. 2008). Thus in principle the
redshift asymmetry explanation of Valtonen & Byrd (1986) should work; whether it
works quantitatively is a question to be answered in this paper.
CDM cosmology (Teerikorpi et al. 2008). Thus in principle the
redshift asymmetry explanation of Valtonen & Byrd (1986) should work; whether it
works quantitatively is a question to be answered in this paper.
In this paper we study redshift asymmetries theoretically in small groups of galaxies by taking advantage of the largest cosmological N-body simulation conducted so far: the Millennium Run (Springel et al. 2005). We create two ``mock'' catalogues of groups of galaxies from the semi-analytical galaxy catalogue (Lucia & Blaizot 2007) of the Millennium Simulation by mimicking observational methods. For the creation of mock catalogues we apply the Friends-of-Friends percolation algorithm developed by HG82. The two mock catalogues differ in the values of free parameters of the FoF grouping algorithm.
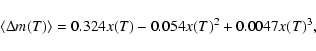
We show that the excess of positive redshifts is mainly due to wrong identification of the dominant galaxy in a group and, at the same time, the group being gravitationally unbound. We also show that groups that show a large excess of positive redshifts are more often gravitationally unbound than groups that do not show any significant excess. These errors in the identification of the dominant galaxy result from our current inability to measure the relative distances inside groups of galaxies, except for a few of the nearest ones (Karachentsev et al. 1997; Rekola et al. 2005a; Teerikorpi et al. 2008; Jerjen et al. 2001; Rekola et al. 2005b). Due to peculiar motions of group members we cannot transform the apparent magnitudes of galaxies in group catalogues into absolute magnitudes precisely. If it were possible and the dominant group members were correctly identified, would it lead to a small blueshift excess, which is due to the magnitude limited observations that cause some of the background galaxies to be invisible and thus excluded from groups.
Table 1: Values of free parameters used for creating mock and observed group catalogues.
This paper is organized as follows. In Sect. 2, we discuss our sample of galaxy groups, the Millennium Simulation data and the grouping algorithm adopted. We present our findings and results in Sect. 3. Finally, we summarize our results in Sect. 4. Throughout this paper we adopt a parametrized Hubble constant: H0 = 100 h km s-1 Mpc-1. Unless explicitly noted, we adopt h = 1.0 for convenient comparison with older literature.
2 The sample of galaxy groups
The two mock catalogues of groups of galaxies from Millennium Simulation data were constructed so that they would be comparable to the real observational group catalogues HG82 and UZC-SSRS2 (Ramella et al. 2002) as much as possible. Both of these catalogues are produced with the FoF algorithm. However, slightly different values for the free parameters of the algorithm have been used. We show in Sect. 3.1 that our groups from the Millennium Simulation are comparable to observed groups in a statistical sense. We also discuss briefly how our results compare to works of other authors.
2.1 Millennium simulation data
The Millennium simulation (MS; Springel et al. 2005) is a cosmological
N-body simulation of the ![]() CDM model performed by the Virgo Consortium. The
MS was carried out with a customized version of the GADGET2 code developed by
Springel et al. (2001b). The MS follows the evolution of 21603particles from redshift z = 127 in a box of 500 h-1 Mpc on a side. The
cosmological parameters of the MS simulation are:
CDM model performed by the Virgo Consortium. The
MS was carried out with a customized version of the GADGET2 code developed by
Springel et al. (2001b). The MS follows the evolution of 21603particles from redshift z = 127 in a box of 500 h-1 Mpc on a side. The
cosmological parameters of the MS simulation are:
![]() ,
,
![]() ,
h = 0.73,
,
h = 0.73,
![]() ,
n = 1, and
,
n = 1, and
![]() (for a detailed description of the MS
see Springel et al. 2005).
(for a detailed description of the MS
see Springel et al. 2005).
The galaxy formation modeling of the MS data is based on merger trees built from 64 individual snapshots. Properties of galaxies in MS data are obtained by using semi-analytical galaxy formation models, where the star formation and its regulation by feedback processes is parametrized in terms of analytical physical models. A detailed description of the creation of the MS galaxy catalogue can be found in Lucia & Blaizot (2007), see also Croton et al. (2006).
The MS galaxy database does not directly give a morphology for galaxies. We have
used a method which takes an advantage of bulge-to-disk ratios to assign a
morphology to every galaxy. Simien & de Vaucouleurs (1986) found a correlation between
the B-band bulge-to-disc ratio, and the Hubble type T of galaxies. The mean
relation may be written:
where
2.2 Group catalogues
Our mock catalogues of groups of galaxies are generated with the FoF percolation
algorithm developed by HG82. Even though new algorithms have been developed, the
FoF still remains the most applied one. The FoF algorithm uses only two criteria
for finding group members: position and redshift. It essentially finds density
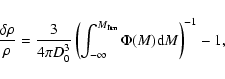
enhancements in position and in redshift space above a set threshold factor. This
threshold depends on a chosen value of the free parameter D0, the apparent
magnitude limit of the search and the Schechter (1976) luminosity function. Density
enhancement relative to the mean number density can be calculated from the equation:
 |
(2) |
where D0 is the projected separation in Mpc chosen at some fiducial redshift,
We produce two mock catalogues with different choices of free parameters. Both group catalogues are generated from five independent volumes of the Millennium Simulation galaxy catalogue. Each of the cubes used have a side length of 250 h-1 Mpc, and they do not overlap. The observation point inside each volume was chosen to be in the centre of the particular cube. No additional criteria were applied for the selection of observation points. Reasonable statistical agreement, as shown in the next section between mock catalogues and observed group catalogues shows that our method of choosing the origin without any further criteria is strict enough in a statistical study of galaxy groups. Both of our catalogues from simulations, Mock1 and Mock2, contain groups of galaxies whose lower limit on the number of members, n, is 3. All groups containing n > 2 members are considered when group properties are studied in Sect. 3.1. In Sect. 3.2 we limit the number of group members to 2 < n < 11, comparable to S84.
Our first mock catalogue, named Mock1, is generated with the same values
(
![]() ,
in the Zwicky or de Vaucouleurs B(0) magnitude system,
D0 =
0.60 h-1 Mpc and
V0 = 400 km s-1) of the free parameters as the
original HG82 catalogue. This choice guarantees that we can compare results found
in S84 directly to our simulated catalogue and we can be sure that different
choices of parameter values do not effect the results. Even though the Mock1
catalogue uses the same values of parameters as HG82 it contains over 10 times
more groups than the original HG82 catalogue. Thus it provides significantly
better statistics.
,
in the Zwicky or de Vaucouleurs B(0) magnitude system,
D0 =
0.60 h-1 Mpc and
V0 = 400 km s-1) of the free parameters as the
original HG82 catalogue. This choice guarantees that we can compare results found
in S84 directly to our simulated catalogue and we can be sure that different
choices of parameter values do not effect the results. Even though the Mock1
catalogue uses the same values of parameters as HG82 it contains over 10 times
more groups than the original HG82 catalogue. Thus it provides significantly
better statistics.
Our Mock2 catalogue has an apparent B-band magnitude limit of
![]() ,
while
V0 = 200 km s-1 and
D0 = 0.37 h-1 Mpc were adopted for
the free parameters of the FoF algorithm, corresponding to the space density
enhancement of
,
while
V0 = 200 km s-1 and
D0 = 0.37 h-1 Mpc were adopted for
the free parameters of the FoF algorithm, corresponding to the space density
enhancement of ![]() 68. Despite the use of more strict parameters, Mock2
contains almost 10 times more groups than Mock1 due to the fainter apparent
B-band magnitude limit adopted. Because of the greater number of groups, Mock2 is
used for comparison and for better statistics. It should also contain groups
which are more often gravitationally bound due to the higher density enhancement
of groups.
68. Despite the use of more strict parameters, Mock2
contains almost 10 times more groups than Mock1 due to the fainter apparent
B-band magnitude limit adopted. Because of the greater number of groups, Mock2 is
used for comparison and for better statistics. It should also contain groups
which are more often gravitationally bound due to the higher density enhancement
of groups.
Table 1 shows the values of free parameters used in creating our mock catalogues. It also shows parameter values of various group catalogues based on modern redshift surveys. All catalogues shown in Table 1 have been generated with the FoF algorithm. However, catalogues based on the SDSS and the 2dF data have taken advantage of modified versions of the original FoF. The most noticeable modifications include the use of dark matter mock catalogues and group re-centering.
There are large differences between the Mock1 and Mock2 catalogues. The most obvious
difference is in the total number of groups. Mock1 contains
1601 groups in total while Mock2 contains 13 786 groups. Note that five
different ``observation'' points inside the MS are used, and none of these
observation points overlap each other. The difference in the number of groups is
due to the difference in the adopted apparent B-band magnitude limit. If we
compare the fraction of gravitationally bound groups between the two catalogues, (i.e.
![]() ,
where
,
where
![]() is the kinetic energy and U is the absolute value of the potential
energy of the group; for a detailed description see Paper I)
the differences are not great. The fraction of gravitationally bound
groups is surprisingly low in both mock catalogues. In the Mock1 catalogue the
fraction of bound groups is
is the kinetic energy and U is the absolute value of the potential
energy of the group; for a detailed description see Paper I)
the differences are not great. The fraction of gravitationally bound
groups is surprisingly low in both mock catalogues. In the Mock1 catalogue the
fraction of bound groups is
![]() while in Mock2 it is only
while in Mock2 it is only
![]() .
The error limits are standard deviation errors
between the five observation points.
.
The error limits are standard deviation errors
between the five observation points.
It is an indication of the reliability of the group-finding algorithm that the
same relative number of bound groups are found in spite of the fact that the Mock2
catalogue has about three times higher density enhancement than Mock1. In
Paper I we found that the fraction of gravitationally bound groups of dark matter
haloes
is ![]() 30% when a
30% when a ![]() CDM model has been adopted. The fraction of
gravitationally unbound groups is significant in all these mock group catalogues,
which suggests that group catalogues based on the FoF algorithm contain a
significant fraction of groups that are not gravitationally bound systems.
CDM model has been adopted. The fraction of
gravitationally unbound groups is significant in all these mock group catalogues,
which suggests that group catalogues based on the FoF algorithm contain a
significant fraction of groups that are not gravitationally bound systems.
3 Analysis of groups
3.1 Comparison with observations
In this subsection we briefly show that our mock catalogues are comparable to real observational group catalogues. We compare our simulated mock catalogues to UZC-SSRS2 and to HG82 catalogues. We only show comparisons in velocity dispersion and in the ``observable'' mass of groups. Even though our mock catalogues are comparable to observations, we find some differences. We also find differences between the two mock catalogues. Before discussing these differences we briefly review the comparison catalogues and parameters.
The HG82 group catalogue was derived from a whole sky catalogue of 1312 galaxies
brighter than
mB = 13.2 (in Zwicky or de Vaucouleurs B(0) magnitude system)
with complete redshift information. The velocity of each galaxy has been
corrected for a dipole Virgo-centric flow. The catalogue of groups was obtained
with
D0 = 0.60 h-1 Mpc (corresponding to a density enhancement of
![]() 20) and with
V0 = 400 km s-1. Only groups containing more than
two members have been included in the final catalogue.
20) and with
V0 = 400 km s-1. Only groups containing more than
two members have been included in the final catalogue.
The UZC-SSRS2 group catalogue was derived from a magnitude-limited redshift
sample of galaxies. A compilation of 6846 galaxies with the apparent magnitude limit of
![]() was used for the creation of the UZC-SSRS2 catalogue, which
contains, in total, 1168 groups. The group catalogue covers 4.69 sr, and the
parameter values of
V0 = 350 km s-1 and
D0 = 0.25 h-1 Mpc have
been adopted for the creation of the UZC-SSRS2 catalogue. These values correspond
to a density contrast threshold
was used for the creation of the UZC-SSRS2 catalogue, which
contains, in total, 1168 groups. The group catalogue covers 4.69 sr, and the
parameter values of
V0 = 350 km s-1 and
D0 = 0.25 h-1 Mpc have
been adopted for the creation of the UZC-SSRS2 catalogue. These values correspond
to a density contrast threshold ![]() 80. Only groups containing more than two
members have been included in the final catalogue.
80. Only groups containing more than two
members have been included in the final catalogue.
Our mock catalogues were discussed in the previous section. However, we would
like to point out that our Mock1 (Mock2) catalogue is comparable to HG82
(UZC-SSRS2) in the choice of parameters. The Mock2 catalogue does not adopt exactly
the same parameters as the UZC-SSRS2, even though the density enhancement is
comparable. The reason for not adopting exactly the same values is that volumes
inside the MS are not large enough. Adopting
![]() would have
introduced errors in groups and their properties due to edge effects and missing
group members. We wish to avoid this, as our purpose is to study distribution of
group members and possible redshift asymmetries.
would have
introduced errors in groups and their properties due to edge effects and missing
group members. We wish to avoid this, as our purpose is to study distribution of
group members and possible redshift asymmetries.
We have shown in Paper I that cosmological N-body simulations can produce groups of galaxies which are comparable to observations. However, in Paper I, we were greatly limited by the volume of our simulation boxes, causing comparisons to be less conclusive. Moreover, In Paper I we compared properties of dark matter haloes to real observed galaxies. As Millennium Simulation offers a larger volume and the properties of the galaxy data are derived with semi-analytical models, the comparison between mock catalogues and observational catalogues (UZC-SSRS2 and HG82) is now more robust. We use the same definitions and equations for velocity dispersion and ``observable'' mass of a group as in Paper I.
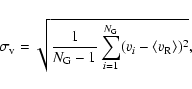
The velocity dispersion
![]() of a group is defined as:
of a group is defined as:
 |
(3) |
where
where
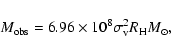
![\begin{displaymath}R_{\rm H} = \frac{\pi \langle v_{\rm R}\rangle}{H_{0}} \sin \...
...N_{\rm G}}
\theta_{ij} \right)^{-1} \right] \right\rbrace ,
\end{displaymath}](/articles/aa/full_html/2009/06/aa10795-08/img31.gif) |
(5) |
where
To compare abundances of groups in magnitude-limited samples we weight each group
according to its distance (Moore et al. 1993; Diaferio et al. 1999). This
weighting is necessary as there is no ``total'' volume of a galaxy sample in
magnitude-limited group catalogues. After weighting each group individually we
can scale abundances of groups in Figs. 1 and 2
to the comoving volume of the sample. We include all galaxies with cz > 500 km s-1. This lower cut-off avoids including faint objects that are close to the
observation point as these groups could contain galaxies fainter than in real
magnitude-limited surveys. Therefore we consider only groups with mean radial
velocity,
![]() ,
greater than 500 km s-1 in Mock1, Mock2, HG82 and
UZC-SSRS2 catalogues.
,
greater than 500 km s-1 in Mock1, Mock2, HG82 and
UZC-SSRS2 catalogues.
![\begin{figure}
\par\includegraphics[width=9cm,clip]{0795fig1.eps}
\end{figure}](/articles/aa/full_html/2009/06/aa10795-08/img34.gif) |
Figure 1:
The cumulative number density of velocity dispersion
|
| Open with DEXTER | |
![\begin{figure}
\par\includegraphics[width=9cm,clip]{0795fig2.eps}
\end{figure}](/articles/aa/full_html/2009/06/aa10795-08/img35.gif) |
Figure 2:
Group abundance by ``observable'' mass of the groups. Simulation data are
averaged over the ensemble of 5 observation points. The error bars are 1 |
| Open with DEXTER | |
Figures 1 and 2 show that cosmological N-body
simulations can produce groups of galaxies whose statistical properties are
similar to observed ones. The agreement is, in general, within 2![]() error
bars. However, there are clear differences visible between all catalogues in both
figures. These differences are discussed below in greater detail. We use a
statistical Kolmogorov-Smirnov (K-S) test to prove or disprove the null
hypothesis,
error
bars. However, there are clear differences visible between all catalogues in both
figures. These differences are discussed below in greater detail. We use a
statistical Kolmogorov-Smirnov (K-S) test to prove or disprove the null
hypothesis,
![]() ,
that the two distributions are alike and are drawn from
the same population distribution function. Results of the K-S tests are
presented as significance levels (value of the Q function) for the null
hypothesis and are listen in Table 2.
,
that the two distributions are alike and are drawn from
the same population distribution function. Results of the K-S tests are
presented as significance levels (value of the Q function) for the null
hypothesis and are listen in Table 2.
Both figures show that the total density of the Mock1 and HG82 catalogue is lower than of Mock2 and UZC-SSRS2. This result is due to the lower apparent magnitude limit of these catalogues, even when weighting is applied. Mock1 and the HG82 are missing more faint galaxies than Mock2 and UZC-SSRS2 due to the lower magnitude limit. Because of this, these catalogues are missing groups that are built only from relatively faint galaxies i.e. these catalogues miss small groups with small velocity dispersions in comparison to Mock2 and UZC-SSRS2.
Figure 1 shows that groups of galaxies in our mock catalogues
are similar to observed ones in a statistical sense when velocity dispersions are
studied. However, both mock catalogues show an excess of high velocity dispersion
groups in comparison to observations. Despite these differences the K-S test is
approved (at level of 0.01) for Mock1 when the comparison is to HG82 and for
Mock2 when the comparison is to the UZC-SSRS2 catalogue. It is also noteworthy
that the Mock1 catalogue shows a small excess of groups around ![]() 500 km s-1in comparison to Mock2. This difference is probably due to the larger value of
V0 in Mock1 that allows a greater difference between group members in
redshift space.
500 km s-1in comparison to Mock2. This difference is probably due to the larger value of
V0 in Mock1 that allows a greater difference between group members in
redshift space.
Qualitatively better agreement in velocity dispersion is observed when mock catalogues are compared to the UZC-SSRS2 catalogue. There are also some differences between the HG82 and UZC-SSRS2 catalogue, especially when the abundance of high velocity dispersion groups are considered. The discrepancy between the mock catalogues and the HG82 group catalogue is relatively large when large velocity dispersions are considered. This difference is due to the low number of groups (92) in HG82. Also the volume of the HG82 catalogue is relatively small. Thus, the HG82 catalogue lacks high velocity dispersion groups and clusters as the Virgo cluster is the only big cluster within the visible volume of the catalogue.
The quartile values of velocity dispersion of the Mock1 (Mock2) catalogue groups are 131.0/213.4/347.4 km s-1 (80.5/131.0/213.4 km s-1). The values of the Mock2 catalogue groups are closer to the observed ones than the values of mock catalogue groups of Paper I. The large values of Mock1 groups can be explained with larger number of interlopers due to the lower density enhancement and the relatively large value of V0. The above differences show that the selection of V0 is important, especially for velocity dispersions of groups.
Table 2: The significance levels of the K-S tests.
From Fig. 2 it is clear that our mock catalogues show an excess in the abundance of heavier groups. Despite the differences the K-S test supports the null hypothesis for the Mock2 catalogue (for numerical details see Table 2). Because of the strong connection between group mass and the velocity dispersion (see Eq. (4)) the Mock1 catalogue shows (qualitatively) similar behavior in both Figs. 1 and 2. There is also a significant difference between HG82 and UZC-SSRS2 catalogue when the abundance of massive groups is studied. However, the most striking difference is between mock catalogues and HG82 when massive groups and clusters are considered. These differences can be explained with the small volume and the low number of large groups in HG82. In total, HG82 has only two groups with more than 30 members while the UZC-SSRS2 catalogue has 14 groups. The Mock1 (Mock2) catalogue has 45 (276) groups that have more than 30 members. It is obvious that the most massive groups are the ones that have highest velocity dispersion and that are the most expanded ones, meaning simply the ones having most members.
The quartile values of ``observable'' mass of the Mock1 (Mock2) catalogue groups
are
![]() (
(
![]() ). The values of Mock2 are close to the observed
values (see Table 4 in Paper I for numerical details) even if there is an excess in
the abundance of massive groups in comparison to observations. The good agreement
in quartile values suggests that simulated groups are similar in a statistical
sense, as the greatest differences in Fig. 2 are observed at very
low densities.
). The values of Mock2 are close to the observed
values (see Table 4 in Paper I for numerical details) even if there is an excess in
the abundance of massive groups in comparison to observations. The good agreement
in quartile values suggests that simulated groups are similar in a statistical
sense, as the greatest differences in Fig. 2 are observed at very
low densities.
Despite the differences discussed above, our mock catalogues are comparable to
observational catalogues in a statistical sense (see Table 2). This
conclusion is supported by the K-S tests, by the good agreement on
quartile values and by the fact that the properties of simulated groups are, in
general, within ![]() error limits. We do not compare other properties of
groups in this paper, as the focus of the paper is to study and explain the
observed redshift asymmetries. However, before explaining these asymmetries
we briefly compare our results to the findings of other authors.
error limits. We do not compare other properties of
groups in this paper, as the focus of the paper is to study and explain the
observed redshift asymmetries. However, before explaining these asymmetries
we briefly compare our results to the findings of other authors.
Eke et al. (2004,2006) have previously applied the same
method to galaxy groups identified in the 2dFGR Survey. These groups are
typically much further away than our groups, as the median redshift of their groups is 0.11.
Despite this difference we make an attempt to compare their results to ours. Eke et al. (2004) found the median velocity dispersion of
227 km s-1 for groups with at least three members. This is rather close to
our Mock1 catalogue value (![]() 213 km s-1) implying that our mock groups
are similar to their groups in a statistical sense. The median velocity dispersion
of the Mock2 catalogue is only
213 km s-1) implying that our mock groups
are similar to their groups in a statistical sense. The median velocity dispersion
of the Mock2 catalogue is only ![]() 131 km s-1, and differs significantly from
the value of Eke et al. (2004). This result is somewhat expected, as our mock
groups are all found at very close distances. The median value of dynamical mass in
our Mock1 catalogue is close to the value of Eke et al. (2004); even though their
definition of dynamical mass is different to ours.
131 km s-1, and differs significantly from
the value of Eke et al. (2004). This result is somewhat expected, as our mock
groups are all found at very close distances. The median value of dynamical mass in
our Mock1 catalogue is close to the value of Eke et al. (2004); even though their
definition of dynamical mass is different to ours.
Eke et al. (2004) found that as much as ![]() 40 per cent of groups can
contain interlopers. This fraction is close to the fraction of groups we find to
be gravitationally unbound. Eke et al. (2006) found that dynamical
group masses give higher abundances to the mass function. It is possible that the
reason for this discrepancy lies in the large fraction of unbound groups. If
the (dynamical) mass of a group is calculated by adopting the virial theorem, one has
to assume that the group is a bound structure. However, if one applies the virial
theorem to a group that is gravitationally unbound, the dynamical mass of the
group can be overestimated significantly. Even if the virial theorem is not used
while calculating the dynamical mass, one can easily overestimate the mass, as
unbound groups can have significantly higher velocity dispersion and size,
leading to the higher abundance noticed by Eke et al. (2006).
40 per cent of groups can
contain interlopers. This fraction is close to the fraction of groups we find to
be gravitationally unbound. Eke et al. (2006) found that dynamical
group masses give higher abundances to the mass function. It is possible that the
reason for this discrepancy lies in the large fraction of unbound groups. If
the (dynamical) mass of a group is calculated by adopting the virial theorem, one has
to assume that the group is a bound structure. However, if one applies the virial
theorem to a group that is gravitationally unbound, the dynamical mass of the
group can be overestimated significantly. Even if the virial theorem is not used
while calculating the dynamical mass, one can easily overestimate the mass, as
unbound groups can have significantly higher velocity dispersion and size,
leading to the higher abundance noticed by Eke et al. (2006).
As groups observed by Eke et al. (2004,2006) are typically much further away, these groups are not expected to show significant redshift asymmetry. In our groups the distance ratio of the far side of the group relative to the front side of the group can be rather large, and this causes the interesting effects that are discussed next.
3.2 Redshift asymmetries in groups
In this subsection we use our mock catalogues to study and explain the observed redshift asymmetries. However, before that, we discuss the suitability of our mock catalogues and quantify the methods of calculating the redshift asymmetries.
The Mock1 catalogue has been generated with the same parameters as the original HG82
catalogue, from which S84 found positive redshift excess. Because of this it is
most suitable for this study and for the comparison of redshift excesses found in S84.
Mock1 is also favoured because a redshift excess is most noticeable for
nearby groups for which there is a larger distance ratio between the background
and the foreground galaxies. Mock2 is used to provide better statistics
and for comparison. Note, however, that Mock2 probes groups deeper in
redshift space than Mock1, and therefore the total effect of nearby
groups is not as strong. It is also noteworthy that in this subsection we study
small groups, therefore we limit the number of group members to less than 11
(i.e.
![]() ).
).
Both mock catalogues have been generated from the Millennium Simulation.
Even though the Millennium run provides reliable statistics its mass resolution is only
![]() .
This complicates the matter of identifying low mass
groups with at least three members inside. The low mass resolution might have a
large effect on studies of the abundance or space density of
individual objects. An even greater effect would be noticed if one was interested in
subhalo properties or abundances. However, as our purpose is to study the
relative location and distribution of galaxies inside groups, we do not consider
the low mass resolution as a significant problem. Further, Sect. 3.1 showed that the abundance of low mass groups in the Millennium
Simulation is comparable to observable catalogues. This ensures that the mass
resolution is good enough for a statistical study like ours, especially as in
a statistical sense missing dwarf galaxies could reside anywhere inside the dark
matter halo.
.
This complicates the matter of identifying low mass
groups with at least three members inside. The low mass resolution might have a
large effect on studies of the abundance or space density of
individual objects. An even greater effect would be noticed if one was interested in
subhalo properties or abundances. However, as our purpose is to study the
relative location and distribution of galaxies inside groups, we do not consider
the low mass resolution as a significant problem. Further, Sect. 3.1 showed that the abundance of low mass groups in the Millennium
Simulation is comparable to observable catalogues. This ensures that the mass
resolution is good enough for a statistical study like ours, especially as in
a statistical sense missing dwarf galaxies could reside anywhere inside the dark
matter halo.
We calculate redshift asymmetries both on a group and on a galaxy level. On a
group level we use groups from five different observation points and calculate
the sum of groups with redshift/blueshift excess in each point. The redshift or
the blueshift excess percentage shown is the mean value of the excesses from the
five observation points when ties have been removed. The error limits are standard
deviation errors between five observation points. When the redshift asymmetries
are studied on a member galaxy level, we quantify the redshift excess as in
Byrd & Valtonen (1985):

where NB is the number of galaxies having a redshift lower than the apparently brightest group member and NR is the number of galaxies having a redshift higher than the apparently brightest group member.
Table 3 shows a general comparison of the mock catalogues and
samples from S84 when the asymmetries have been calculated on a group level. Mock
catalogues show a (weak) positive redshift excess when spiral-dominated (i.e. the
central galaxy is a spiral galaxy) groups are studied. However, the excess is not
significant for elliptical (E or S0) dominated groups. These groups actually show
a small blueshift excess, similar to S84. By conventional theory, this suggests
that these groups could be mostly gravitationally bound. However, we find that
![]() (
(
![]() )
per cent of E/S0-dominated groups in Mock1
(Mock2) are gravitationally unbound. This suggests that the absence of
redshift asymmetry does not alone guarantee that these groups are
gravitationally bound systems.
)
per cent of E/S0-dominated groups in Mock1
(Mock2) are gravitationally unbound. This suggests that the absence of
redshift asymmetry does not alone guarantee that these groups are
gravitationally bound systems.
Table 3: A general comparison of the mock catalogues and samples from S84.
Table 4 further divides the mock catalogues to subsamples on the basis of whether the groups are gravitationally bound or not. The unbound groups are important, since about one half of all groups in both of our mock catalogues belong to this category. A further division in Table 4 is made on the basis of whether the dominant galaxy is correctly identified, i.e. whether the brightest, in apparent magnitudes group member is also the most massive galaxy in the group. A large and statistically highly significant redshift excess appears only in those subsamples where the groups are gravitationally unbound, and in addition, their dominant galaxies have been misidentified. These comprise approximately one quarter of all groups. The excess appears both among elliptical and spiral dominated groups but is stronger among the spiral dominated groups.
Table 4 also shows that groups that are gravitationally bound show larger error limits for redshift asymmetries than groups which are unbound, suggesting that there are large differences in the fraction of bound groups between our five observation points. This result shows that projection effects can play a significant role when the FoF percolation algorithm is applied, and that it can produce groups which are spurious because of these projection effects. It also shows that the choice of free parameters can affect the results, as the Mock2 catalogue does not show larger errors for bound groups in comparison to unbound ones.
When redshift asymmetries are studied at a member galaxy level, the results stay similar. If we consider only spiral-dominated groups which are unbound and whose centre is wrongly identified, we find a redshift excess of Z = 0.22 and Z = 0.10 for the Mock1 and Mock2 catalogues, respectively. When only bound groups from Mock1 (Mock2) are considered, the redshift excess is only 0.07(0.04). The former values are similar to observed ones, as S84 found a redshift excess of Z = 0.21 for spiral-dominated (i.e. the apparently brightest galaxy is a spiral galaxy) groups. Byrd & Valtonen (1985) and Valtonen & Byrd (1986) derived values of the redshift excess from an analytical model that ranges from Z = 0.1 to Z = 0.5 depending on the parameters adopted, while the most probable value was 0.2. The good agreement between observations, analytical models and simulations (unbound and wrongly identified groups) suggests that most of the membership of HG82's spiral dominated groups is unbound and that the centre has been misidentified for these groups. Simulations further show that to obtain as high a redshift excess as observed, we have to select groups that are gravitationally unbound and whose centre has been misidentified.
If we concentrate on E/S0-dominant groups at a member galaxy level, we see similar results as in Tables 3 and 4. Now Mock1 (Mock2) shows a blueshift excess of Z = -0.05 (Z = -0.01) for gravitationally unbound groups, whose central galaxies are correctly identified. This is a slightly weaker blueshift excess than S84 found (-0.13), but comparable. These values are in agreement with the analytical calculations of Byrd & Valtonen (1985) and Valtonen & Byrd (1986) that showed the blueshift excess of correctly identified, but unbound E-dominated groups ranging from Z = -0.13 to Z = 0.03depending on the values of free parameters. Here the agreement between observations, analytical models and simulations is reasonable. This points to the possibility that E/S0 galaxies do mark the position of the group centre correctly.
Table 4 shows that E/S0 galaxies mark the position of the centre
correctly more often than spiral galaxies. If we calculate the percentage of
groups whose dominant member has been correctly identified it is clear that ![]() 73.9 per cent of E/S0-dominated groups are correctly identified while as much
as
73.9 per cent of E/S0-dominated groups are correctly identified while as much
as ![]() 60.0 per cent of spiral-dominant groups are incorrectly identified. The
incorrect identification of the central galaxy is important as it may lead to a
redshift excess, since it is more likely that the apparently brightest galaxy is
in the front part of the cluster than in the back part of it. The galaxies in the
front part of the group appear brighter, and in the back part of the group
fainter than what their absolute magnitudes would lead us to expect, i.e.
compared with the situation when they all are at the same distance from us. This
greater apparent brightness of the group members in the front makes it also more
likely that the apparently brightest member is picked from the front volume of
the group. Statistically this applies to groups of all sizes. In a
gravitationally bound group this would not in itself cause a redshift excess, but
if the whole group or a substantial part of it is in Hubble flow, then the
galaxies in front are typically blueshifted while the galaxies in the back are
redshifted relative to the apparently brightest galaxy.
60.0 per cent of spiral-dominant groups are incorrectly identified. The
incorrect identification of the central galaxy is important as it may lead to a
redshift excess, since it is more likely that the apparently brightest galaxy is
in the front part of the cluster than in the back part of it. The galaxies in the
front part of the group appear brighter, and in the back part of the group
fainter than what their absolute magnitudes would lead us to expect, i.e.
compared with the situation when they all are at the same distance from us. This
greater apparent brightness of the group members in the front makes it also more
likely that the apparently brightest member is picked from the front volume of
the group. Statistically this applies to groups of all sizes. In a
gravitationally bound group this would not in itself cause a redshift excess, but
if the whole group or a substantial part of it is in Hubble flow, then the
galaxies in front are typically blueshifted while the galaxies in the back are
redshifted relative to the apparently brightest galaxy.
Table 4: A detailed view of the redshift asymmetries in mock catalogues.
To further test the cause of redshift asymmetries we use absolute B-band
magnitudes rather than apparent ones to identify the dominant group member and
calculate the redshift asymmetries in this case. The use of absolute magnitudes
leads to a small blueshift excess for all groups. The blueshift excess is highest
for unbound, spiral-dominated and misidentified groups, being
![]() per cent (
per cent (
![]() ). For all gravitationally bound groups we find a small
blueshift excess of
). For all gravitationally bound groups we find a small
blueshift excess of
![]() (
(
![]() ). This small and hardly
significant blueshift excess is expected and is due to the fact that
magnitude limited observations will miss faint members from the back part of the
group with higher probability than from the front part. Additionally, if the group is
expanding (unbound) it can further lead to a case where the group is missing
redshifted members. A small blueshift excess is also present if we consider only
groups that are correctly identified.
). This small and hardly
significant blueshift excess is expected and is due to the fact that
magnitude limited observations will miss faint members from the back part of the
group with higher probability than from the front part. Additionally, if the group is
expanding (unbound) it can further lead to a case where the group is missing
redshifted members. A small blueshift excess is also present if we consider only
groups that are correctly identified.
Although the redshift excess disappears when using absolute B-band magnitudes, it
does not lead to a significantly smaller number of misidentifications as the
fraction remains roughly the same as in the case of apparent magnitudes. The
percentage of misidentifications for all galaxies in the case of apparent magnitudes
for Mock2 is
![]() while it is
while it is
![]() in the case of absolute magnitudes. This result is due to the fact that both
B-band magnitudes are a poor indicator of the most massive
galaxy as they tend to favour spiral galaxies over elliptical ones.
in the case of absolute magnitudes. This result is due to the fact that both
B-band magnitudes are a poor indicator of the most massive
galaxy as they tend to favour spiral galaxies over elliptical ones.
4 Summary and conclusions
In this paper we have compared cosmological N-body simulations to observations. We have studied fractions of unbound groups, redshift asymmetries and their connection. We have found an explanation for the positive redshift excess found by many authors from different observational group catalogues.
Our mock catalogues of groups of galaxies are in reasonable agreement (in
general, within 2![]() )
with observational catalogues when dynamical
properties of groups are studied. Both mock catalogues show a significant
fraction of gravitationally unbound groups, independent of the choices of free
parameter values in the Friends-of-Friends algorithm. Even though the density
enhancement of the Mock2 catalogue is more than three times higher than the density
enhancement of Mock1, we found that both mock catalogues contain roughly
)
with observational catalogues when dynamical
properties of groups are studied. Both mock catalogues show a significant
fraction of gravitationally unbound groups, independent of the choices of free
parameter values in the Friends-of-Friends algorithm. Even though the density
enhancement of the Mock2 catalogue is more than three times higher than the density
enhancement of Mock1, we found that both mock catalogues contain roughly ![]() gravitationally unbound groups. Even though the density enhancement does
not have a significant effect on the fraction of gravitationally bound groups,
the values of free parameters of the FoF algorithm have an effect on group
properties. Our results show that the value of V0 has an effect on the
abundance of high velocity groups. This is an expected result as a higher V0value gives the percolation algorithm more room in redshift space leading to a
higher number of high velocity dispersion groups.
gravitationally unbound groups. Even though the density enhancement does
not have a significant effect on the fraction of gravitationally bound groups,
the values of free parameters of the FoF algorithm have an effect on group
properties. Our results show that the value of V0 has an effect on the
abundance of high velocity groups. This is an expected result as a higher V0value gives the percolation algorithm more room in redshift space leading to a
higher number of high velocity dispersion groups.
Mock catalogues produce similar redshift asymmetries as found in observations. The Mock1 catalogue produces higher redshift asymmetries than Mock2 in all cases, because the redshift asymmetries are most noticeable for nearby groups for which there is a larger distance ratio between the background and the foreground galaxies. The redshift excess is similar to observations for groups that are gravitationally unbound and in which, at the same time, the apparently brightest galaxy is not the most massive galaxy. The misidentification of the group centre is important as it can lead to a redshift excess, since it is more likely that the apparently brightest galaxy is in the front part of the cluster than in the back part of it. The galaxies in the front part of the group appear brighter, and in the back part of the group fainter than what their absolute magnitudes would lead us to expect, i.e. compared with the situation when they all are at the same distance from us.
The use of absolute B-band magnitudes does not lead to a redshift excess; however,
a small blueshift excess is present. This is due to the fact that magnitude
limited observations miss faint group members from the back rather than from the
front part of the group. Despite the lack of redshift excess, the fraction of
groups in which the dominant group member has been incorrectly identified remains
as we observe roughly the same number of misidentified groups (![]() 52 per cent) as in the case of apparent magnitudes when all groups from Mock2 are
considered. Thus, absolute and apparent B-band magnitude is a poor indicator of
the dominant member in a group. Our results also show that the E/S0 galaxies tend
to mark the group centre correctly, as
52 per cent) as in the case of apparent magnitudes when all groups from Mock2 are
considered. Thus, absolute and apparent B-band magnitude is a poor indicator of
the dominant member in a group. Our results also show that the E/S0 galaxies tend
to mark the group centre correctly, as ![]() 75 per cent of E/S0-dominated
groups have been correctly identified. These groups do not show significant
redshift excess in any case.
75 per cent of E/S0-dominated
groups have been correctly identified. These groups do not show significant
redshift excess in any case.
Gravitationally bound groups do not show any significant redshift excess. This is in agreement with conventional theory, where it is expected that distribution of redshift differentials should be evenly distributed. The subsample of the Mock1 catalogue that includes only gravitationally bound groups has an equal number of galaxies relative to the brightest member within statistical errors.
We conclude that when the group centre is not correctly identified, it may cause the major part of the observed redshift excess. If the group is also gravitationally unbound, the level of the redshift excess becomes as high as in S84. Thus the explanation of Byrd & Valtonen (1985) and Valtonen & Byrd (1986) for the origin of the redshift excess is verified. It further means that there is no need to introduce any ``anomalous'' redshift mechanism to explain the redshift excess of Arp (1970).
This paper shows that the Friends-of-Friends percolation algorithm picks out the expanding parts of the groups, in addition to the gravitationally bound group cores. Thus the group catalogues constructed in this way cannot be used as if the groups are purely bound systems. For example, the use of the virial theorem to estimate group masses easily leads to wrong answers. As about 50 per cent of groups in our mock catalogues are bound, in principle one could apply the virial theorem only to this subclass of groups, but then it is difficult to identify this subclass in observations. The redshift excess in a sample of groups would tell us readily that there must be many unbound groups in the sample. However, the absence of redshift excess alone does not guarantee that these groups are gravitationally bound systems.
To overcome the difficulty of finding gravitationally bound groups, one can, for example, use stellar mass rather than luminosity for identifying the central galaxy. Even then dark matter and the lack of knowledge of relative distances inside observed groups complicates matters. If the grouping algorithm concentrates on finding satellite galaxies that belong to the same dark matter halo (see Yang et al. 2007), it could return groupings that are mainly gravitationally bound. Detection of extended X-ray radiation can also indicate gravitationally bound groups.
Acknowledgements
S.M.N. acknowledges the funding by Finland's Academy of Sciences and Letters and the nordic optical telescope (NOT) scientific association (NOTSA). S.M.N. would like to thank Dr. Gerard Lemson for invaluable help with the Millennium Simulation database. S.M.N. would also like to acknowledge the support and help provided by Dr. Pekka Heinämäki and Dr. Pasi Nurmi. We thank the anonymous referee for detailed reading of the manuscript and comments that helped us to improve the original manuscirpt. The Millennium Simulation databases used in this paper and the web application providing online access were constructed as part of the activities of the German Astrophysical Virtual Observatory.
References
- Arp, H. 1970, Nature, 225, 1033 [NASA ADS] [CrossRef]
- Arp, H. 1982, ApJ, 256, 54 [NASA ADS] [CrossRef]
- Bahcall, N. A., McKay, T. A., Annis, J., et al. 2003, ApJS, 148, 243 [NASA ADS] [CrossRef]
- Berlind, A. A., Frieman, J., Weinberg, D. H., et al. 2006, ApJS, 167, 1 [NASA ADS] [CrossRef]
- Bottinelli, L., & Gouguenheim, L. 1973, A&A, 26, 85 [NASA ADS] (In the text)
- Botzler, C. S., Snigula, J., Bender, R., & Hopp, U. 2004, MNRAS, 349, 425 [NASA ADS] [CrossRef]
- Byrd, G. G., & Valtonen, M. J. 1985, ApJ, 289, 535 [NASA ADS] [CrossRef] (In the text)
- Croton, D. J., Springel, V., White, S. D. M., et al. 2006, MNRAS, 365, 11 [NASA ADS] [CrossRef] (In the text)
- Diaferio, A., Kauffmann, G., Colberg, J. M., & White, S. D. M. 1999, MNRAS, 307, 537 [NASA ADS] [CrossRef]
- D'Onghia, E., Sommer-Larsen, J., Romeo, A. D., et al. 2005, ApJ, 630, L109 [NASA ADS] [CrossRef]
- Driver, S. P., Allen, P. D., Liske, J., & Graham, A. W. 2007, ApJ, 657, L85 [NASA ADS] [CrossRef]
- Einasto, M., Einasto, J., Müller, V., Heinämäki, P., & Tucker, D. L. 2003, A&A, 401, 851 [NASA ADS] [CrossRef] [EDP Sciences]
- Eke, V. R., Baugh, C. M., Cole, S., et al. 2004, MNRAS, 348, 866 [NASA ADS] [CrossRef]
- Eke, V. R., Baugh, C. M., Cole, S., Frenk, C. S., & Navarro, J. F. 2006, MNRAS, 370, 1147 [NASA ADS] [CrossRef]
- Focardi, P., & Kelm, B. 2002, A&A, 391, 35 [NASA ADS] [CrossRef] [EDP Sciences]
- Geller, M. J., & Huchra, J. P. 1983, ApJS, 52, 61 [NASA ADS] [CrossRef]
- Girardi, M., Mezzetti, M., Giuricin, G., & Mardirossian, F. 1992, ApJ, 394, 442 [NASA ADS] [CrossRef] (In the text)
- Goto, T. 2005, MNRAS, 359, 1415 [NASA ADS] [CrossRef]
- Goto, T., Sekiguchi, M., Nichol, R. C., et al. 2002, AJ, 123, 1807 [NASA ADS] [CrossRef]
- Hickson, P. 1982, ApJ, 255, 382 [NASA ADS] [CrossRef]
- Hickson, P., Kindl, E., & Huchra, J. P. 1988, ApJ, 329, L65 [NASA ADS] [CrossRef] (In the text)
- Hickson, P., Kindl, E., & Auman, J. R. 1989, ApJS, 70, 687 [NASA ADS] [CrossRef]
- Holmberg, E. 1950, Meddelanden fran Lunds Astronomiska Observatorium Serie II, 128, 1 [NASA ADS]
- Huchra, J. P., & Geller, M. J. 1982, ApJ, 257, 423 [NASA ADS] [CrossRef]
- Humason, M. L., Mayall, N. U., & Sandage, A. R. 1956, AJ, 61, 97 [NASA ADS] [CrossRef]
- Iovino, A., & Hickson, P. 1997, MNRAS, 287, 21 [NASA ADS] (In the text)
- Jaakkola, T. 1971, Nature, 234, 534 [NASA ADS] [CrossRef] (In the text)
- Jerjen, H., Rekola, R., Takalo, L., Coleman, M., & Valtonen, M. 2001, A&A, 380, 90 [NASA ADS] [CrossRef] [EDP Sciences]
- Jones, L. R., Ponman, T. J., Horton, A., et al. 2003, MNRAS, 343, 627 [NASA ADS] [CrossRef]
- Karachentsev, I., Drozdovsky, I., Kajsin, S., et al. 1997, A&AS, 124, 559 [CrossRef] [EDP Sciences]
- Kim, R. S. J., Kepner, J. V., Postman, M., et al. 2002, AJ, 123, 20 [NASA ADS] [CrossRef]
- Koester, B. P., McKay, T. A., Annis, J., et al. 2007, ApJ, 660, 239 [NASA ADS] [CrossRef]
- Lucia, G. D., & Blaizot, J. 2007, MNRAS, 375, 2 [NASA ADS] [CrossRef] (In the text)
- Mahdavi, A., Geller, M. J., Böhringer, H., Kurtz, M. J., & Ramella, M. 1999, ApJ, 518, 69 [CrossRef]
- Materne, J. 1978, A&A, 63, 401
- Merchán, M. E., & Zandivarez, A. 2005, ApJ, 630, 759 [NASA ADS] [CrossRef]
- Moore, B., Frenk, C. S., & White, S. D. M. 1993, MNRAS, 261, 827 [NASA ADS]
- Niemi, S.-M., Nurmi, P., Heinämäki, P., & Valtonen, M. 2007, MNRAS, 382, 1864 [NASA ADS] (In the text)
- Nolthenius, R., & White, S. D. M. 1987, MNRAS, 225, 505 [NASA ADS]
- Ostriker, J. P., Lubin, L. M., & Hernquist, L. 1995, ApJ, 444, L61 [NASA ADS] [CrossRef] (In the text)
- Ponman, T. J., Allan, D. J., Jones, L. R., et al. 1994, Nature, 369, 462 [NASA ADS] [CrossRef]
- Ramella, M., Geller, M. J., Huchra, J. P., & Thorstensen, J. R. 1995, AJ, 109, 1469 [NASA ADS] [CrossRef]
- Ramella, M., Geller, M. J., Pisani, A., & da Costa, L. N. 2002, AJ, 123, 2976 [NASA ADS] [CrossRef]
- Rekola, R., Jerjen, H., & Flynn, C. 2005a, A&A, 437, 823 [NASA ADS] [CrossRef] [EDP Sciences]
- Rekola, R., Richer, M. G., McCall, M. L., et al. 2005b, MNRAS, 361, 330 [NASA ADS] [CrossRef]
- Santos, W. A., de Oliveira, C. M., & Sodré, L. 2007, AJ, 134, 1551 [NASA ADS] [CrossRef]
- Schechter, P. 1976, AJ, 203, 297 [NASA ADS] [CrossRef] (In the text)
- Shakhbazyan, R. K. 1973, Astrofizika, 9, 495 [NASA ADS]
- Simien, F., & de Vaucouleurs, G. 1986, ApJ, 302, 564 [NASA ADS] [CrossRef] (In the text)
- Springel, V., White, S. D. M., Tormen, G., & Kauffmann, G. 2001a, MNRAS, 328, 726 [NASA ADS] [CrossRef] (In the text)
- Springel, V., Yoshida, N., & White, S. D. M. 2001b, New Astron., 6, 79 [NASA ADS] [CrossRef] (In the text)
- Springel, V., White, S. D. M., Jenkins, A., et al. 2005, Nature, 435, 629 [NASA ADS] [CrossRef] (In the text)
- Sulentic, J. W. 1984, ApJ, 286, 442 [NASA ADS] [CrossRef] (In the text)
- Tago, E., Einasto, J., Saar, E., et al. 2006, Astron. Nachr., 327, 365 [NASA ADS] [CrossRef]
- Tago, E., Einasto, J., Saar, E., et al. 2008, A&A, 479, 927 [NASA ADS] [CrossRef] [EDP Sciences]
- Teerikorpi, P., Chernin, A. D., Karachentsev, I. D., & Valtonen, M. J. 2008, A&A, 483, 383 [NASA ADS] [CrossRef] [EDP Sciences] (In the text)
- Tucker, D. L., Oemler, A., Hashimoto, Y., et al. 2000, ApJS, 130, 237 [NASA ADS] [CrossRef]
- Tully, R. B. 1987, ApJ, 321, 280 [NASA ADS] [CrossRef] (In the text)
- Tully, R. B. 1988, Nearby galaxies catalog (Cambridge, New York: Cambridge University Press), 221 (In the text)
- Turner, E. L., & Gott, J. R. 1976, ApJ, 32, 409 [CrossRef]
- Valtonen, M. J., & Byrd, G. G. 1986, ApJ, 303, 523 [NASA ADS] [CrossRef] (In the text)
- Yang, X., Mo, H. J., van den Bosch, F. C., et al. 2007, ApJ, 671, 153 [NASA ADS] [CrossRef]
- Zabludoff, A. I., & Mulchaey, J. S. 1998, ApJ, 496, 39 [NASA ADS] [CrossRef]
- Zaritsky, D. 1992, ApJ, 400, 74 [NASA ADS] [CrossRef] (In the text)
All Tables
Table 1: Values of free parameters used for creating mock and observed group catalogues.
Table 2: The significance levels of the K-S tests.
Table 3: A general comparison of the mock catalogues and samples from S84.
Table 4: A detailed view of the redshift asymmetries in mock catalogues.
All Figures
| |
Figure 1:
The cumulative number density of velocity dispersion
|
| Open with DEXTER | |
| In the text | |
| |
Figure 2:
Group abundance by ``observable'' mass of the groups. Simulation data are
averaged over the ensemble of 5 observation points. The error bars are 1 |
| Open with DEXTER | |
| In the text | |
Copyright ESO 2009
Current usage metrics show cumulative count of Article Views (full-text article views including HTML views, PDF and ePub downloads, according to the available data) and Abstracts Views on Vision4Press platform.
Data correspond to usage on the plateform after 2015. The current usage metrics is available 48-96 hours after online publication and is updated daily on week days.
Initial download of the metrics may take a while.