| Issue |
A&A
Volume 494, Number 2, February I 2009
|
|
|---|---|---|
| Page(s) | 799 - 815 | |
| Section | Catalogs and data | |
| DOI | https://doi.org/10.1051/0004-6361:200809602 | |
| Published online | 04 December 2008 | |
The construction of the large quasar astrometric catalogue (LQAC)![[*]](/icons/foot_motif.gif)
J. Souchay1 - A. H. Andrei2,1 - C. Barache1 - S. Bouquillon1 - A.-M. Gontier1 - S. B. Lambert1 - C. Le Poncin-Lafitte3,1 - F. Taris1 - E. F. Arias4,1 - D. Suchet1 - M. Baudin1
1 - Observatoire de Paris, Systèmes de Référence Temps Espace (SYRTE), CNRS/UMR 8630, Paris, France
2 - Observatório Nacional/MCT and Observatório do Valongo/UFRJ, Rio de Janeiro, Brasil
3 - Technische Universität Dresden, Institut für Planetare Geodäsie, Lohrmann Observatorium, Dresden, Germany
4 - Bureau International des Poids et Mesures, Sèvres, France
Received 18 February 2008 / Accepted 3 November 2008
Abstract
Context. The very large and increasing number of quasars reckoned from various sky surveys leads to a large quantity of data which brings various and inhomogeneous information in the fields of astrometry, photometry, radioastronomy and spectroscopy.
Aims. In this paper, we describe our work that aims to make available a general compilation of the largest number of recorded quasars obtained from all the available catalogues, with their best position estimates, and providing physical information at both optical and radio wavelengths. Thus, we construct a catalogue compilation designated Large Quasar Astrometric Catalogue (LQAC) giving coordinates, multiband photometry, radio fluxes, redshift, luminosity distances and absolute magnitudes.
Methods. We gather the 12 largest quasar catalogues (4 from radio interferometry programs, 8 from optical surveys), and we carry out systematic cross-identifications of the objects. Information concerning u, b, v, g, r, i, z, J, K photometry as well as redshift and radio fluxes at 1.4 GHz, 2.3 GHz, 5.0 GHz, 8.4 GHz and 24 GH are given when available. A small proportion of remaining objects, not present in the 12 catalogues and included in the Véron-Cetty & Véron quasar catalogues, are added to the compilation.
Results. The LQAC contains 113 666 quasars. We discuss the external homogeneity of the data by comparing the coordinates, the redshifts and the magnitudes of objects belonging to different catalogues. We use up-to-date cosmological parameters as well as recent models for galactic extinction and K-correction in order to evaluate the absolute magnitudes of the objects.
Key words: reference systems - astrometry - quasars: general - catalogs
1 Introduction
The very rapidly increasing number of quasars discovered in recent years through automated surveys and modern techniques, such as the Sloan Digital Sky Survey, motivated the construction of a complete compilation of all the quasars that have already been reckoned. This kind of systematic archiving was initiated two decades ago, starting with about 2000 objects (Véron-Cetty & Véron 1987), and has been regularly updated since then with now more than 85 000 sources in the latest release (Véron-Cetty & Véron 2006, hereafter referred to as VV06). It was regularly updated in order to follow the always increasing number of recorded quasars and it succeeds in being as complete as possible. Moreover it systematically gives the origin of the survey in which any quasar had been found, by adding for the majority of objects their names in the related original catalogues when available.
VV06 however is not entirely approriate for astrometric and photometric studies. First, there is no guarantee of precision and accuracy for the coordinates of the sources. In that sense it cannot be considered as an astrometric catalogue. Second, the physical information concerning the sources is relatively limited, reduced at a maximum of three bands at optical wavelengths and two radio wavelengths.
Another important compilation, the QORG was made available recently (Flesch & Hardcastle 2004), however no attempt is made to give astrometric positions, nor to retain a single entry for each object.
The goal of our work is the construction of a compiled catalogue designated the Large Quasar Astrometric Catalogue (referred to as LQAC in the following). We aim to give useful data concerning all quasars already detected and to bring fundamental improvements that can be summarized as follows: (i) the LQAC is larger than any of the previous quasars catalogues; (ii) it gives a more accurate determination of the celestial positions of the quasars (iii) it contains more information concerning the photometric properties of the objects; (iv) for homogeneity purpose it systematically privileges large surveys above to small catalogues; (v) it gives clear and direct information about the cross-identification between the catalogues involved in the compilation; (vi) it is based on a compilation strategy related to the astrometric quality of the catalogues; and (vii) it proposes a determination of the absolute magnitudes of the quasars in bands r and i by using up-to-date models of galactic extinction and new values of cosmological parameters.
2 Compilation strategy
2.1 Basic aims and principles
To compile all quasars recorded in catalogues, a first step is to establish the strategy, i.e., to decide on the priorities for catalogue selection, to adopt criteria for cross-identifications, and to make the choice of photometric data. A crucial issue concerns the cross-identifications: for the purpose of identifying the same object in two catalogues, it is necessary to select a recognition radius with the postulate that if the difference in the positions of two objects in two catalogues is smaller than the given radius, then the objects are the same. If the difference in the positions is larger than the radius, then the objects are considered as different. The choice of a very small search radius may result in having that the same object identified as two different ones; if the search radius is too large, the number of common objects may be overestimated. Though, for catalogues with good astrometric precision, selecting a significantly large search radius should not lead to any confusion, the discrimination between one or two objects and the selection of the search radius become questionable in catalogues having relatively poor precisions.
For the construction of the LQAC, we have selected the a priori best astrometric measurements for each of the recorded quasars. The LQAC can therefore be considered as an astrometric catalogue, since it improves the quality of the coordinates of the sources.
We have also collected extensive information on the physical properties of the quasars. We provide, when available, the magnitudes of the objects in the u, b, v, g, r, i, z, optical bands, and in the J and K infrared bands. We also give, whenever possible, the radio fluxes of the objects at 1.4 GHz, 2.3 GHz, 5.0 GHz, 8.4 GHz, and 24 GHz.
We have adopted an archiving strategy which consists of privileging large surveys rather than small ones, and giving priority to the large catalogues in decreasing order of astrometric accuracy, as asserted by the bibliography associated with the catalogues. Each of the twelve selected surveys has been assigned a one-letter acronym from A to L. Consequently the LQAC is the final result of a succession of pre-compiled catalogues which can be named A-B (compilation of A and B), A-C (compilation of A-C) etc... In the LQAC the presence of a flag (or catalogue code) attached to each quasar indicates the catalogues in which it can be found. The first letter indicates the catalogue from which the celestial coordinates of the object have been taken. If the recorded quasar does not belong to any of the twelve large catalogues, which happens for a minority of known quasars, but is listed in VV06, it is labelled M. In such cases, we indicate with a number the original catalogue from which VV06 have taken this quasar.
The order of entry of the photometric, redshift and radio flux information in the LQAC follows the same rules as for the coordinates, giving priority to the catalogues from A to L. For example, if the u magnitude of a given quasar is present both in the SDSS survey (flag E) and in the 2QZ survey (flag F), the former is privileged.
The LQAC is a compromise between several advantages: accessibility (the data is easily readable in a one line ASCII format), homogeneity (the data concerning a large majority of sources come from no more than twelve different catalogues), and density of information (we collect fourteen different pieces of photometric or flux information, one redshift determination, and two calculated values for the absolute magnitude). As a complement, there is relevant information concerning the cross-identifications which have been carried out during the compilation, in terms of differences in coordinates as well as number of cross identified objects.
2.2 Nomenclature
The A-M letter codes for the individual compiled catalogues are provided in Table 1.
The first four catalogues have an optimal astrometric quality due to the fact that the quasar coordinates have been determined from very long baseline interferometry (VLBI) for A and B or from connected interferometry (C and D). The flag order roughly corresponds to a decreasing accuracy in
the position of the quasars. Note that the 2MASS, B1.0 and GSC2.3 do not provide a specific list of quasars, therefore they do not provide new quasars. However they are used to bring supplementary information about photometry (for instance 2MASS at infrared wavelengths). We have deliberately split the VLA catalogue in two sub-catalogues with designations C and H to distinguish
two levels of astrometric accuracy: in the VLA-0.15 this accuracy is better than 0.15
![]() ,
whereas in the VLA+0.15 it is worse than this value. VV06 is used as a final resource in order to include all the quasars which are not present in any of the catalogues from A to L, for completeness. The number of quasars in this category is
,
whereas in the VLA+0.15 it is worse than this value. VV06 is used as a final resource in order to include all the quasars which are not present in any of the catalogues from A to L, for completeness. The number of quasars in this category is ![]() 7% of the total number of quasars recorded in the LQAC.
7% of the total number of quasars recorded in the LQAC.
2.3 Virtual observatory input data catalogues and manipulation tools
Most catalogues included in this compilation were extracted from the Centre de Données astronomiques de Strasbourg using the web tool Vizier (http://vizier.u-strasbg.fr/viz-bin/VizieR) and Votable format, as defined by the International Virtual Observatory Alliance (IVOA). We made use of Aladin, a freeware tool provided by the CDS, to manipulate star or quasar catalogues and data imaging associated with these objects (see http://aladin.u-strasbg.fr/aladin.gml) for preliminary studies and to plot the sky distribution of the quasars in the catalogues. To validate our tools and input data, two different software packages have been used for cross identification and data processing but dealing with the same parameters and strategy: (i) in-house FORTRAN programs; and (ii) scripts using the Virtual Observatory tools named Stilts (see http://www.starlink.ac.uk/stilts) and Topcat (see http://www.star.bris.ac.uk/~mbt/topcat).
3 Description of the quasars catalogues in the LQAC
The main characteristics of the individual catalogues that contributed to the LQAC are summarized in Table 1. The spatial distribution of the quasars in each catalogue is presented in Figs. 1 (equatorial frame) and 2 (galactic frame).
Table 1: Characteristics of the catalogues contributing to the LQAC.
![\begin{figure}
\par\includegraphics[width=8cm,clip]{9602fig1.eps}
\end{figure}](/articles/aa/full_html/2009/05/aa09602-08/img14.gif) |
Figure 1: Spatial distribution of the main input catalogs of the LQAC in a J2000 equatorial reference frame with a Hammer-Aitoff projection. |
| Open with DEXTER | |
![\begin{figure}
\par\includegraphics[width=8cm,clip]{9602fig2.eps}
\end{figure}](/articles/aa/full_html/2009/05/aa09602-08/img15.gif) |
Figure 2: Spatial distribution of the main input catalogs of the LQAC in a Galactic reference frame with a Hammer-Aitoff projection. |
| Open with DEXTER | |
3.1 The ICRF-Ext.2
The second extension of the International Celestial Reference Frame (ICRF-Ext.2, Fey et al. 2004) is the current conventional realization of the International Celestial Reference System (ICRS) at radio frequencies. It represents the best realization of the system with respect to which the position of any object in the celestial sphere should be measured. In its basic content, the ICRF consists of 212 sources, called ``defining'', whose positions define the axes of the ICRS which are independent of the classical plane (ecliptic) and reference point (equinox), but consistent with
the previous realizations of the ICRS as the FK5 J2000.0 optical system. Thanks to the VLBI observations, the individual positions of the defining sources have been checked to be better than 1 milliarc second (mas), while the stability of the axes attains 20 micro arc second (![]() as).
The original ICRF also provided positions for another 396 sources to increase the number of defining sources (Ma et al. 1998). The ICRF-Ext.1 (IERS 1999) and ICRF-Ext.2 provided an additional 109 sources to the catalogue, thus leading to a total number of 717 radio-sources. Note that, in the ICRF-Ext.2, 361 objects are known as quasars, 122 as standard active galactic nuclei (AGN) and 62 as BL Lacertae (BL Lac). Although a priori we are considering exclusively quasars in the compilation, we kept these particular objects beacause of their astrometric accuracy (they appear as very stable point-like sources) and their importance (the ICRF is the conventional reference frame used by all astronomers).
as).
The original ICRF also provided positions for another 396 sources to increase the number of defining sources (Ma et al. 1998). The ICRF-Ext.1 (IERS 1999) and ICRF-Ext.2 provided an additional 109 sources to the catalogue, thus leading to a total number of 717 radio-sources. Note that, in the ICRF-Ext.2, 361 objects are known as quasars, 122 as standard active galactic nuclei (AGN) and 62 as BL Lacertae (BL Lac). Although a priori we are considering exclusively quasars in the compilation, we kept these particular objects beacause of their astrometric accuracy (they appear as very stable point-like sources) and their importance (the ICRF is the conventional reference frame used by all astronomers).
3.2 The VLBA Calibrator Survey
The Very Long Baseline Array (VLBA) Calibrator Survey (VCS) contains milliarcsecond accurate positions for more than 3000 extragalacic radio sources, mainly quasars. These positions have been derived from astrometric analysis of dual-frequency 2.3 and 8.4 GHz VLBA observations.
The original VCS1 catalogue (Beasley et al. 2002) contains 1289 sources whose positions were derived from dual frequency observations, while an additional 43 sources had positions derived from the 8.4 GHz only solutions. Since then, several updates have been done such as the VCS2 (Fomalont et al. 2003) which includes 276 additional calibrator sources near the galactic
plane (
![]() )
and Very Large Array calibrators (see next sub-section). The final catalogue used in our compilation contains 3357 objects. Considering the very high acccuracy of the coordinates of the quasars, we put this catalogue in second position, with flag B, just after the ICRF-Ext.2. The only additional information that we pick up from
the VCS catalogue is the radio flux at the two observed frequency bands.
)
and Very Large Array calibrators (see next sub-section). The final catalogue used in our compilation contains 3357 objects. Considering the very high acccuracy of the coordinates of the quasars, we put this catalogue in second position, with flag B, just after the ICRF-Ext.2. The only additional information that we pick up from
the VCS catalogue is the radio flux at the two observed frequency bands.
3.3 The Very Large Array
The Very Large Array (VLA) inteferometer consists of 27 radio antennas in a Y shaped configuration at San Augustin (New Mexico, USA). The 25-m diameter antennas are electronically linked to give the same resolution as one antenna of 36-km across, with the sensitivity of a 130-m dish. The VLA quasar catalogue, which can be found in the VLA Calibrator manual (http://www/aoc.edu/~gtaylor/csource.html) provides information concerning the accuracy of source positions (Claussen 2006). Therefore we have split the original catalogue in two sub-catalogues, one with accuracy better than 0.15
![]() and another containing all the sources with accuracy worse than this value. The first sub catalogue, with flag C, contains 1701 quasars
with an astrometric precision of a round 10 mas whereas the second one, with flag H, is much smaller with only 157 quasars with an accuracy around 0.2
and another containing all the sources with accuracy worse than this value. The first sub catalogue, with flag C, contains 1701 quasars
with an astrometric precision of a round 10 mas whereas the second one, with flag H, is much smaller with only 157 quasars with an accuracy around 0.2
![]() .
For all objects, fluxes are given at 0.3 GHz, 4 GHz, 5 GHz, 8.4 GHz, 15 GHz and 23 GHz when they are available.
.
For all objects, fluxes are given at 0.3 GHz, 4 GHz, 5 GHz, 8.4 GHz, 15 GHz and 23 GHz when they are available.
3.4 The Jodrell Bank-VLA Astrometric Survey
The Jodrell Bank-VLA Astrometric Survey (JVAS) catalogue contains 2118 sources with 8.4 GHz flux information. Here we use only the calibration sources (namely, calib.dat). The accuracy of the position is 12 mas for sources in Patnaik et al. (1992), 14 mas for sources in Browne et al. (1998), and 55 mas for sources in Wilkinson et al. (1998). The catalogue contains compact radio sources VLA, intended for use as phase calibration sources for the Multi-Element Radio Linked Interferometer Network (MERLIN).
3.5 The Sloan Digital Sky Survey
The Sloan Digital Sky Survey (SDSS, Adelman-McCarthy et al. 2007) covers about one quarter of the sky, observed from a dedicated 2.5 m telescope located at Apache Point, New Mexico, USA. Images are obtained in five broad optical bands (designated u, g, r, i, z) covering the wavelength range of the CCD response from the atmospheric ultraviolet cutoff to the near infrared (see Fukugita et al. 1996, for details). The astrometric calibration (Pier et al. 2003) yields an accuracy per coordinate of 45 mas when reduced against the USNO CCD Astrograph catalogue (UCAC) and 75 mas when reduced against Tycho-2 (Hog et al. 2000). The 5th data release of the SDSS quasars input catalogue (Schneider et al. 2005) is by far the largest one. It contains 74 868 objects. It gives moreover extensive photometric information with magnitude estimations in the u, b, v, g, r, i, z colors and a precise redshift evaluation. The quasar selection algorithm retains objects intrinsically brighter than Mi=-22, assuming a cosmology consistent with the Wilkinson Microwave Anisotropy Probe results, showing at least one emission line with FWHM larger than 1000 km s-1, fainter than mi=15 and having a reliable determination of the redshift. Note that the latest data release (DR6) of the SDSS was not avalable when we began this compilation. We plan to take it into account in the future versions of the LQAC.
To estimate the probability of finding two SDSS quasars in the same field of given radius, we have cross-identified the SDSS catalogue with itself. The resulting histogram showing the number of close pairs of quasars according to their angular separation is presented in Fig. 3,
from 1
![]() to
to ![]() ,
with 1
,
with 1
![]() step. We note that no pair was found at a distance smaller than 3
step. We note that no pair was found at a distance smaller than 3
![]() ,
which means that we can reject the ambiguity of finding two SDSS quasars below this threshold.
,
which means that we can reject the ambiguity of finding two SDSS quasars below this threshold.
![\begin{figure}
\par\includegraphics[width=8.5cm,clip]{9602fig3.eps}
\end{figure}](/articles/aa/full_html/2009/05/aa09602-08/img19.gif) |
Figure 3: Number of internal cross-identified quasars in the SDSS-DR5 catalog within a shell of given radius. |
| Open with DEXTER | |
![\begin{figure}
\par\includegraphics[width=8.5cm,clip]{9602fig4.eps}
\end{figure}](/articles/aa/full_html/2009/05/aa09602-08/img20.gif) |
Figure 4: Number of internal cross-identified quasars in the 2QZ catalog within a shell of given radius. |
| Open with DEXTER | |
3.6 The 2-degree Field quasar Redshift Survey
The 2-degree Field (2dF) quasar Redshift Survey, quoted as 2QZ (Croom et al. 2004) is based on a pre-selection of quasar candidates using well defined criteria based on broadband u, bj, r colors obtained from automated plate measurements of UKST photographic plates. The magnitude of the pre-selected objects is such that
16 < bj < 20.85. The survey area comprises 30 fields arranged in two
![]()
![]()
![]() declination strips, one passing across the South Galactic Cap, centered on
declination strips, one passing across the South Galactic Cap, centered on
![]() and the other passing across the North Galactic Cap, centered on
and the other passing across the North Galactic Cap, centered on
![]() .
A spectroscopic follow-up of the quasar candidates already selected from the photometric criteria was completed by a
.
A spectroscopic follow-up of the quasar candidates already selected from the photometric criteria was completed by a ![]() minimization technique to fit each spectrum to a number of quasars, galaxies and stellar templates, with redshifts determination for extragalactic objects. In total the 2QZ provides a sample of 22 971 quasars for our compilation, with only a little more than 2000 of them also belonging to the SDSS catalogue (Souchay et al. 2008).
minimization technique to fit each spectrum to a number of quasars, galaxies and stellar templates, with redshifts determination for extragalactic objects. In total the 2QZ provides a sample of 22 971 quasars for our compilation, with only a little more than 2000 of them also belonging to the SDSS catalogue (Souchay et al. 2008).
Figure 4 shows the histogram of the number of close pairs of 2QZ quasars according to the angular separation. We remark that the global feature is similar to the one obtained for the SDSS. This tends to prove that the density of quasars in different parts of the sky
is equivalent. In the 2QZ, the smallest distance for which we found a pair is 7
![]() .
.
3.7 The FIRST catalogue
The FIRST radio survey (Gregg et al. 1996) has provided a new resource for constructing a large quasar sample, with positions accurate to better than 1
![]() and with high radio sensitivity. One of the main tasks consisted of matching the radio catalogue from the NRAO VLA survey (Becker et al. 1995) with an optical catalogue provided by the automated plate machine digitization of Palomar Sky Survey Plates. Optical selection was accompanied by several spectroscopic campaigns in order to refine the selection criteria. The first release concerned 300 deg2 and contained about 200 objects. It was completed by a second release (White et al. 2000) containing 636 quasars distributed over 2682 deg2 and a third one (Becker et al. 2001) in the South Galactic Cap, containing 321 quasars for 589 deg2. For compiling the LQAC, we have used 972 quasars from the most recent catalogue. In addition to their position (accurate to =1
and with high radio sensitivity. One of the main tasks consisted of matching the radio catalogue from the NRAO VLA survey (Becker et al. 1995) with an optical catalogue provided by the automated plate machine digitization of Palomar Sky Survey Plates. Optical selection was accompanied by several spectroscopic campaigns in order to refine the selection criteria. The first release concerned 300 deg2 and contained about 200 objects. It was completed by a second release (White et al. 2000) containing 636 quasars distributed over 2682 deg2 and a third one (Becker et al. 2001) in the South Galactic Cap, containing 321 quasars for 589 deg2. For compiling the LQAC, we have used 972 quasars from the most recent catalogue. In addition to their position (accurate to =1
![]() ), we kept the r and b magnitudes together with the radio flux at 1.4 GHz and the redshift for our compilation.
), we kept the r and b magnitudes together with the radio flux at 1.4 GHz and the redshift for our compilation.
3.8 Hewitt & Burbidge catalogue
Hewitt & Burbidge (1993) published a catalogue (hereafter referred to as HB) containing all known quasars with measured emission redshifts, complete to 1992, December 31. This catalogue contains 7245 objects, nearly all quasars, with about 90 BLac objects. The information about the objects is exhaustive and complete, containing positions, colors, magnitudes, emission-line redshifts, absorption, variability, polarization, as well as X-ray, radio and infrared data. A weakness of this catalogue is the poor accuracy of the coordinates for a significant proportion of the quasars in the list. In the next section we describe how we dealt with this disadvantage.
3.9 Additional information from the 2MASS, GSC2.3 and B1.0 catalogues
These three surveys do not bring any new quasars into our sample, but using cross-identifications they allowed us to fill gaps in the photometric information provided by the catalogue pre-compiled from the previous survey.
The USNO-B1.0 catalogue (Monet et al. 2003) provides magnitude in up to three colors (Johnston B, R and I), for 1 042 618 261 objects over all the sky. The photometry results from scans of 7435 Schmidt plates taken from various sky surveys and calibrated using the Tycho-2 stars. The resulting photometric accuracy is 0.3 mag, up to V=20.
The GSC2.3 catalogue (Lasker et al. 2008) established from the Space Telescope Science Institute and the Osservatorio Astronomico di Torino, is an all-sky catalogue of 945 592 683 objects, resulting from photographic Sky Survey plates, at two epochs and three optical bands, from the Palomar and UK Schmidt telescopes (DSS). The magnitudes are consistent with B, R, and I Johnston photometric standards, and an estimation of the visual magnitude is also given. The GSC2.3 has no formal magnitude limit. The parameters of the bright objects overexposed on the Schmidt plates, are taken from the Tycho-2 catalogue.
The Two Micron All-Sky Survey (2MASS) catalogue (Cutri et al. 2003) was obtained from a uniform scanning of the entire sky in three near-infrared bands to detect and characterize point sources brighter than about 1 mJy in each band, with signal-to-noise ratio greater than 10. The detectors worked at J (1.25 ![]() m), H (1.65
m), H (1.65 ![]() m), and Ks (2.17
m), and Ks (2.17 ![]() m) bands, to a 3
m) bands, to a 3![]() limiting sensitivity of 17.1, 16.4 and 15.3 mag respectively. The 2MASS catalogue has a total of 470 992 970 sources.
limiting sensitivity of 17.1, 16.4 and 15.3 mag respectively. The 2MASS catalogue has a total of 470 992 970 sources.
4 Cross-identifications
4.1 General procedure
When the positions of quasars in catalogues are accurate at the level of the sub-arcsecond, as is the case for all the catalogue, except the Hewitt & Burbridge one, the cross-identifications between the objects do not present any difficulty because a search radius of 1
![]() is large enough to identify the common objects and the probability of a mismatch is close to zero. Table 1 presents the astrometric quality of each of the above catalogues in terms of internal precision and shows the search radius adopted to identify common objects between a given individual catalogue and those in the table. For example, a search radius of 2
is large enough to identify the common objects and the probability of a mismatch is close to zero. Table 1 presents the astrometric quality of each of the above catalogues in terms of internal precision and shows the search radius adopted to identify common objects between a given individual catalogue and those in the table. For example, a search radius of 2
![]() is used for the cross-identification of quasars between the First catalogue (G) and the pre-compiled A-F. Nevertheless the cross-identification becomes puzzling as the positional accuracy in one catalogue strongly departs from 1
is used for the cross-identification of quasars between the First catalogue (G) and the pre-compiled A-F. Nevertheless the cross-identification becomes puzzling as the positional accuracy in one catalogue strongly departs from 1
![]() as is the case for the HB catalogue.
as is the case for the HB catalogue.
4.2 The cross-identification with the HB catalogue
HB must be compared with the pre-compiled A-H catalogue obtained by adding together all the catalogues with flag from A to H, according to our procedure and following a decreasing global positional accuracy of the catalogues. It contains 7154 quasars which represent approximately 6% of the total LQAC. Therefore, it is important to deal with the problem of its poor astrometric accuracy. Figure 5 displays the number of quasars cross-identified between the two catalogues for a search radius ![]() varying from 1
varying from 1
![]() to 30
to 30
![]() .
We can observe that, contrarily to the previous A-H catalogues, a large number of cross-identifications have been found for
.
We can observe that, contrarily to the previous A-H catalogues, a large number of cross-identifications have been found for
![]() and a significant number still exists for
and a significant number still exists for
![]() .
Redshift studies presented below show that most of the cross identifications correspond to the same object.
.
Redshift studies presented below show that most of the cross identifications correspond to the same object.
The possibility of having quasar pairs in a general sense (two quasars very close angularly with or without physical interaction) was discussed by Hennawi et al. (2006). These authors estimated the true binary population at a ratio of 10-3 from the SDSS sample, while Andrei et al. (2006) found odds for chance quasar pairs at a 10-2 ratio based on a search at 2
![]() of any true object up to magnitude 20. The chances become significantly smaller when the candidates are limited to recorded quasars and when poorer astrometry is considered. Figure 6 shows the excess ratio from HB relative to the SDSS for pairs of quasars with redshift differences smaller than 0.1, with a search radius extending from 10
of any true object up to magnitude 20. The chances become significantly smaller when the candidates are limited to recorded quasars and when poorer astrometry is considered. Figure 6 shows the excess ratio from HB relative to the SDSS for pairs of quasars with redshift differences smaller than 0.1, with a search radius extending from 10
![]() to 360
to 360
![]() .
In the first shell (
.
In the first shell (
![]() )
there is no excess. From there on, the excess peaks at 3.1 for
)
there is no excess. From there on, the excess peaks at 3.1 for
![]() ,
and only drops to less than 2 at
,
and only drops to less than 2 at
![]() .
To be conservative, we adopted
.
To be conservative, we adopted
![]() as the radius within which the chances of misidentification were much larger than that of missing binary quasars.
as the radius within which the chances of misidentification were much larger than that of missing binary quasars.
![\begin{figure}
\par\includegraphics[width=8.5cm,clip]{9602fig5.eps}
\end{figure}](/articles/aa/full_html/2009/05/aa09602-08/img35.gif) |
Figure 5: Number of cross-identified quasars between HB and the A-H compiled catalogue. |
| Open with DEXTER | |
![\begin{figure}
\par\includegraphics[width=7.5cm,clip]{9602fig6.eps}
\end{figure}](/articles/aa/full_html/2009/05/aa09602-08/img36.gif) |
Figure 6:
Excess ratio of pairs of quasars with
|
| Open with DEXTER | |
![\begin{figure}
\par\includegraphics[width=8.5cm,clip]{9602fig7.eps}
\end{figure}](/articles/aa/full_html/2009/05/aa09602-08/img37.gif) |
Figure 7:
Redshift differences |
| Open with DEXTER | |
In the continuity of this study we can assert that if the possibility of having two objects for
![]() is close to zero, the probability steadily increases when the distance between the two positions becomes larger. Therefore an alternate criterion must be found to discriminate between the possible matches. Fortunately this criterion exists in the form of the redshift, which is available in both catalogues in most cases. Although the redshift accuracy gradually worsens as z worsens starting from z > 2, as will be shown later in the paper, it looks like a quite reliable criterion for cross-identification in comparison to other parameters such as the magnitudes.
is close to zero, the probability steadily increases when the distance between the two positions becomes larger. Therefore an alternate criterion must be found to discriminate between the possible matches. Fortunately this criterion exists in the form of the redshift, which is available in both catalogues in most cases. Although the redshift accuracy gradually worsens as z worsens starting from z > 2, as will be shown later in the paper, it looks like a quite reliable criterion for cross-identification in comparison to other parameters such as the magnitudes.
Figure 7 shows the differences between the redshifts, as given for common objects in A-H and in HB. We can observe that even at large distances between objects (
![]() ), in most cases the redshifts agree at the level of
), in most cases the redshifts agree at the level of
![]() which strongly suggests that
although the positions in the two catalogues are relatively far, they represent the same object. Note that, from a study using the SDSS sample, the odds against a random match of redshifts to less than 0.1 reaches a maximum of 1.05% at z=1.5, and is always smaller than
1% beyond z=1.85. On the contrary we notice a significant number of quasars for which the redshifts do not correspond at all whereas their angular distance is smaller than 10
which strongly suggests that
although the positions in the two catalogues are relatively far, they represent the same object. Note that, from a study using the SDSS sample, the odds against a random match of redshifts to less than 0.1 reaches a maximum of 1.05% at z=1.5, and is always smaller than
1% beyond z=1.85. On the contrary we notice a significant number of quasars for which the redshifts do not correspond at all whereas their angular distance is smaller than 10
![]() .
The number of cross-identified objects with the same redshift noticably increases when we consider a decreasing search radius from
.
The number of cross-identified objects with the same redshift noticably increases when we consider a decreasing search radius from
![]() to
to
![]() .
.
As a consequence we finally adopted the following rules to decide whether objects present both inside the A-H compilation and HB are the same or represent two distinct quasars. If the two positions are closer than 2
![]() the two objects are considered as identical. If the two positions differ by more than 30
the two objects are considered as identical. If the two positions differ by more than 30
![]() ,
the two objects are considered as different ones. Between 2
,
the two objects are considered as different ones. Between 2
![]() and 30
and 30
![]() ,
the two objects are considered as the same only if there is a redshift determination in each catalogue and the redshift difference
,
the two objects are considered as the same only if there is a redshift determination in each catalogue and the redshift difference ![]() is such that
is such that
![]() .
If one of these two conditions is not satisfied, then the two objects are considered as different. Their status might be revised in future updates of the LQAC. Even though this should be considered as a not very formal approach, it helps in solving many doubtful cases, with a small probability of error. These cases are identified with a flag (see the end of the section) to alert the user to cross-identification problem.
.
If one of these two conditions is not satisfied, then the two objects are considered as different. Their status might be revised in future updates of the LQAC. Even though this should be considered as a not very formal approach, it helps in solving many doubtful cases, with a small probability of error. These cases are identified with a flag (see the end of the section) to alert the user to cross-identification problem.
When applying the above criteria for cross identification between HB and A-H, we find the following results: (i) 2155 quasars are considered as common to the two catalogues among which 1870 are found in a search radius
![]() ,
156 are so that
,
156 are so that
![]() and 129 are so that
and 129 are so that
![]() fullfiling the condition of an identical redshift (
fullfiling the condition of an identical redshift (
![]() ); (ii) 60 quasars have a counterpart at
); (ii) 60 quasars have a counterpart at
![]() but the lack of redshift in one of the two catalogues prevents us from concluding about a possible single identification: they are therefore considered as different objects; (iii) 56 quasars have a counterpart at
but the lack of redshift in one of the two catalogues prevents us from concluding about a possible single identification: they are therefore considered as different objects; (iii) 56 quasars have a counterpart at
![]() and the above conclusion also applied. These results are summarized in Table 2 where the flag in the last column indicates the criteria that support the objects being considered as the same quasar (just one entry) (flag * or x) or two independent quasars (flag ! or ?). These flags are included in the final LQAC catalogue.
and the above conclusion also applied. These results are summarized in Table 2 where the flag in the last column indicates the criteria that support the objects being considered as the same quasar (just one entry) (flag * or x) or two independent quasars (flag ! or ?). These flags are included in the final LQAC catalogue.
Table 2: Results of cross-identification between A-H and HB.
4.3 The use of the 2MASS, GSC2.3 and B1.0 catalogues for photometric completeness
As mentioned above, these three catalogues do not explicitly give a list of quasars, but provided that cross-identification has been made at the small radius of 1
![]() to avoid any mismatch, they can bring valuable and additional photometric information. For instance we could add J and K infrared magnitudes to 13 647 quasars in the final compiled catalogue based on the 2MASS database. From the GSC2.3 data, we could get an additional 69 355 b, 41 517 v, 3 502 r and 7517 i magnitudes to include in the LQAC. In the same way, it became possible to complete informational data with the B1.0 catalogue leading to 2131, 455 and 3765 magnitude evaluations respectively in b, r, i. This photometric information was added systematically to our data. Notice that we filled in the magnitude columns in the same chronological order as for the astrometric part.
to avoid any mismatch, they can bring valuable and additional photometric information. For instance we could add J and K infrared magnitudes to 13 647 quasars in the final compiled catalogue based on the 2MASS database. From the GSC2.3 data, we could get an additional 69 355 b, 41 517 v, 3 502 r and 7517 i magnitudes to include in the LQAC. In the same way, it became possible to complete informational data with the B1.0 catalogue leading to 2131, 455 and 3765 magnitude evaluations respectively in b, r, i. This photometric information was added systematically to our data. Notice that we filled in the magnitude columns in the same chronological order as for the astrometric part.
4.4 The final cross-identification with VV06
Before the LQAC, VV06 was the most complete compilation of recorded quasars. We have cross-identified the 104 944 objects of our A-L pre-compilation with the 85 182 objects in VV06. From VV06 we have only retained the extragalactic sources listed as quasars, without considering the BL Lac and AGN objects. As for the case of HB (see previous subsection) we have adopted well established rules to decide whether an object with close coordinates in A-L and in VV06 corresponds to a single quasar or to two different objects. If the two positions are further apart than 2
![]() the two objects are considered as identical. If the two positions ar larger than 10
the two objects are considered as identical. If the two positions ar larger than 10
![]() ,
the two objects are considered as different ones. Between 2
,
the two objects are considered as different ones. Between 2
![]() and 10
and 10
![]() of angular distance, the two objects are considered identical if there is a redshift available in each catalogue and the redshift difference is such that
of angular distance, the two objects are considered identical if there is a redshift available in each catalogue and the redshift difference is such that
![]() .
With the above criteria we find that 73 480 quasars are common to the two catalogues, corresponding to 70.0% of the pre-compiled catalog A-L and 86.3% of VV06. Among them, 72 252 objects are found in a search radius
.
With the above criteria we find that 73 480 quasars are common to the two catalogues, corresponding to 70.0% of the pre-compiled catalog A-L and 86.3% of VV06. Among them, 72 252 objects are found in a search radius
![]() ,
977 objects are found between 2
,
977 objects are found between 2
![]() and 5
and 5
![]() while 251 objects are found between 5
while 251 objects are found between 5
![]() and 10
and 10
![]() with the condition of an identical redshift (
with the condition of an identical redshift (![]()
![]()
![]() < 0.1). 26 quasars have a counterpart at
< 0.1). 26 quasars have a counterpart at
![]() but the absence of redshift in one of the two catalogues does not enable us to conclude about a possible identification; thus they are considered as different objects. 18 quasars have a counterpart at
but the absence of redshift in one of the two catalogues does not enable us to conclude about a possible identification; thus they are considered as different objects. 18 quasars have a counterpart at
![]() and the above conclusion also applies. All the remaining objects are considered as different. The same flags as in Table 2 have been chosen to characterize
the nature of the cross-identification status and are included in the LQAC.
and the above conclusion also applies. All the remaining objects are considered as different. The same flags as in Table 2 have been chosen to characterize
the nature of the cross-identification status and are included in the LQAC.
Table 3: Results of cross-identification between A-L and VV06. See Note on Table 2.
4.5 Quantitative results of the cross-identifications
The quantitative results of all cross-identifications between the 13 catalogues are summarized in terms of number of objects, photometry, redshift and radio flux information, in Tables 4-8. In the cross-identification process 132 presumably double quasars (one being a ICRF-Ext.2 source) were detected and not included in the LQAC. These objects are suspicious in the fact that they perturbed the cross-identification process without offering the guarantee of a true single or double object.
Table 4 gives the number of cross-identifications found for each pair of catalogues among those in the compilation. This table is useful for users involved in studies concerning these catalogues, at least to understand globally their possible interactions, complementarity or comparisons. As far as N=13 catalogues are concerned, we have a total number of N(N+1)/2 = 91 entries. The largest set of cross-identifications is obtained when comparing the GSC2.3 and the SDSS catalogues, with 69 705 common objects. The comparisons of the total number of objects in each catalogue (in bold) with the number of objects in common with VV06 (last column) clearly indicates the quantitative improvement brought by the LQAC.
Tables 5 and 6 indicate the number of entries, per catalogue, of a given item concerning optical magnitude and redhift (Table 5), infrared magnitude and radio flux (Table 6). Very often the information can be found in two or more catalogues for a given quasar. In that case we use the value with the same priority (from ``A'' to ``L'') as for the coordinates. In particular the r magnitude can be determined from five different original catalogues.
Table 7 indicates, for a given item and a given catalogue, the number of sources included in the LQAC. The SDSS contribution is the greatest by far for the u, g, r, i, z magnitudes as well as for the redshift. It is the only source of information for the g and z magnitudes. The contribution of the GSC2.3 catalogue has been determinant for the b and v magnitudes (respectively 72% and 88% of the total number of available values). For the radio information, a large majority of fluxes at 2.3 GHz and 8.4 GHz come from the VLBA survey. The items with the largest number of available values are the redshift z, with 89% completeness, followed by the r magnitudes with (88%), (85%) and (85%) completeness, respectively. On the other hand, the infrared information is only complete to 12%. Notice that although coming from a radio survey, the FIRST catalogue has magnitudes obtained from optical counterparts of the quasars.
Table 8 indicates, for each parameter involved in the compilation (optical or infrared magnitude, redshift, radio fluxes), the number of sources for which corresponding information is available. For that purpose we consider only three catalogues: VV06, A-L, and the final LQAC. Several parameters, such as the optical g, i, z optical magnitudes and the J, K infrared magnitudes were either not in VV06 or present only for a small sample. This table gives a clear insight to the improvements of our compilation with respect to VV06, which was up to now the densest catalogue both in terms of number of quasars and in quantity of information.
The most complete information available is the redshift with about 94.4% of the total sample (113 666 quasars) followed by the b (93.9%), the r (88.7%) and the u (87.7%) magnitudes. Notice the comparatively small amount of radio-flux information that never exceed 10% of the sample. The contribution of VV06 to the LQAC can be evaluated by subtracting the fourth and third columns of the table. It is particularly significant for the v mag but never exceeds 10% otherwise.
Table 4: Number of cross-identified objects between the 13 catalogues included in the LQAC compilation.
Table 5: Photometry and redshift information available according to each optical catalogue included in the LQAC compilation.
Table 6: Infrared photometry and radio flux information available according to the corresponding catalogues of the LQAC.
Table 7: Contribution per item for each individual catalogue used to construct the LQAC.
5 Homogeneity of the data
Since the LQAC is a compilation of all available catalogues, we can compare, when available, the positions and the photometric data of quasars common to two or several catalogues used. It is important for at least three reasons: (i) to check the published characteristics of catalogues used in LQAC compilation; (ii) to validate our compilation strategy (in particular the astrometric order of catalogues as defined in Sect. 2); and (iii) to provide the user with information about the astrometric or photometric precision in the LQAC. In the following sub-sections we analyze successively the differences in position, redshift, magnitude and spatial distribution between the catalogues.
5.1 Comparison of astrometric positions
In order to determine the degree of astrometric coherence between catalogues, we plot in Figs. 8 the two-dimensional positional difference for each cross-identified quasar between a given catalogue and the compilation made of all the preceeding catalogues. For instance, in Fig. 8.4, the SDSS is compared with the pre-compiled A-D catalogue. If we suppose that the A-D catalogue has a better astrometry, the spatial distribution of the differences in Figs. 8 then reflects predominantly the astrometric error of the SDSS.
As a complementary analysis, we want to evaluate the mean value and the standard deviation of the distributions both for the differences
![]() and
and
![]() .
For this purpose, we consider that the distributions follow a Gaussian law. Then, we adopt a
.
For this purpose, we consider that the distributions follow a Gaussian law. Then, we adopt a ![]() rejection threshold, in order to eliminate outliers. The process is iterared either until the convergence of the standard deviation or when the tenth iteration is reached. Table 9 gives the mean value, the standard deviations, the percentage of quasars kept for each comparison, when the final
rejection threshold, in order to eliminate outliers. The process is iterared either until the convergence of the standard deviation or when the tenth iteration is reached. Table 9 gives the mean value, the standard deviations, the percentage of quasars kept for each comparison, when the final ![]() cut-off or (in unfavourable case) when the tenth iteration has been reached. In Figs. 8.1-8, the standard deviations ellipses are plotted in dashed lines and for both coordinates the limits of each figure have been taken around
cut-off or (in unfavourable case) when the tenth iteration has been reached. In Figs. 8.1-8, the standard deviations ellipses are plotted in dashed lines and for both coordinates the limits of each figure have been taken around ![]() .
.
Notice that quite naturally the scales used for the plots (Figs. 8.1-8) gradually increase with the decreasing astrometric accuracy of the catalogues. The corresponding increase of the standard deviation justifies the hierarchical choice of the catalogues made in Sect. 2.
The mean of the distributions values also gradually increases except for the FIRST catalogue, which shows limited biases both in right ascension and in declination compared to the preceeding 2QZ catalogue. Except for the SDSS, large biases characterize all the optical catalogues,
at the level of a few 0.01
![]() or 0.1
or 0.1
![]() .
The SDSS is also characterized by a low standard deviation, namely 0.05
.
The SDSS is also characterized by a low standard deviation, namely 0.05
![]() in both coordinates, compared with the A-D pre compilation constructed from the four very accurate radio catalogues.
in both coordinates, compared with the A-D pre compilation constructed from the four very accurate radio catalogues.
We notice in Table 9 that even if the convergence of the standard deviations when adopting a ![]() cut-off is very fast for most of the comparisons (3 or 4 iterations), convergence needs 5 iterations for the JVAS and HB catalogues, for which almost 10% of cross-identified quasars are rejected. For the VLA catalogue, the situation is worse: the standard deviations do not converge even after 10 iterations for which more than 35% of quasars are rejected. This problem can be associated with the non-Gaussian distribution of the differences as strongly suggested in Fig. 8.2. To eliminate the effects related to non-gaussian distribution on the determination of standard deviations, we try to numerically estimate the density law corresponding to each dot set by using the kernel smoothing density function (Bowman & Azzalini 1997). By integrating these functions we determine the most narrow areas that correspond to 50% and 80% probability. The related equiprobability curves (continuous contour line in Fig. 8) are drawn in order to check the regularity of the distribution around the central peak (shown by the standard deviation with a dashed line).
cut-off is very fast for most of the comparisons (3 or 4 iterations), convergence needs 5 iterations for the JVAS and HB catalogues, for which almost 10% of cross-identified quasars are rejected. For the VLA catalogue, the situation is worse: the standard deviations do not converge even after 10 iterations for which more than 35% of quasars are rejected. This problem can be associated with the non-Gaussian distribution of the differences as strongly suggested in Fig. 8.2. To eliminate the effects related to non-gaussian distribution on the determination of standard deviations, we try to numerically estimate the density law corresponding to each dot set by using the kernel smoothing density function (Bowman & Azzalini 1997). By integrating these functions we determine the most narrow areas that correspond to 50% and 80% probability. The related equiprobability curves (continuous contour line in Fig. 8) are drawn in order to check the regularity of the distribution around the central peak (shown by the standard deviation with a dashed line).
Table 8: Number of entries per item for the following catalogues: VV06, A-L, and final LQAC.
5.2 Comparison of photometric data
As for the astrometry, it is interesting to compare the photometric properties of the cross-identified sources, especially for large surveys like the SDSS and the 2QZ. Note that the 2QZ includes u, bj, r magnitudes whereas the SDSS survey contains u, g, r, i, z magnitude information. It is then possible to compare the u and r magnitudes of the 2053 cross-identified quasars. Our purpose is not to search for a photometric adjustment between the two catalogues involving color indices and magnitudes, as is classically done, but rather to compare the u and r values in the two catalogues, to see the amplitude of the difference.
In Fig. 9 we plot the u and r magnitude given by the 2QZ with respect to the one given by the SDSS. We notice a systematic bias of about 1 mag between the two catalogues, the SDSS values being generally larger than the 2QZ ones. The mean value of the u-band differences, which corresponds to the bias between the two catalogues, is
![]() ,
with a
,
with a ![]() rms of 0.963. After removing the bias, the rms is decreasing to
rms of 0.963. After removing the bias, the rms is decreasing to
![]() mag. The SDSS magnitudes are also larger than the 2QZ ones for the r-band, but with a
mag. The SDSS magnitudes are also larger than the 2QZ ones for the r-band, but with a ![]() 0.2 mag bias only. The mean value of the differences is
0.2 mag bias only. The mean value of the differences is
![]() mag, with a rms equal to
mag, with a rms equal to
![]() mag. When the bias is removed the rms slightly decreases to
mag. When the bias is removed the rms slightly decreases to
![]() mag. Note that several outliers have been removed from the sample. For this calculation 9 and 5 quasars showing differences of more than 2 mag in the u and r bands were not considered. Moreover 25 quasars have no r-band values in the 2QZ survey.
mag. Note that several outliers have been removed from the sample. For this calculation 9 and 5 quasars showing differences of more than 2 mag in the u and r bands were not considered. Moreover 25 quasars have no r-band values in the 2QZ survey.
Table 9: Determination of the astrometric accuracy of the catalogues used in the LQAC.
![\begin{figure}
\par\includegraphics[width=14cm,clip]{9602fig8.eps}
\end{figure}](/articles/aa/full_html/2009/05/aa09602-08/img59.gif) |
Figure 8: Equatorial coordinate differences between the values in a given catalogue and the preceding compilation phase of the LQAC. The standard deviations are shown by the dashed contours. The external continuous contours are lines of probability, corresponding to 50% and 80% respectively. |
| Open with DEXTER | |
![\begin{figure}
\par\includegraphics[width=8.5cm,clip]{9602fig9.eps}\par\includegraphics[width=8.5cm,clip]{9602fig10.eps}
\end{figure}](/articles/aa/full_html/2009/05/aa09602-08/img60.gif) |
Figure 9: Comparisons between the u ( upper panel) and r ( lower panel) magnitude of the 2053 cross-identified quasars between the SDSS and the 2QZ surveys. The straight dashed line corresponds to equal magnitudes. |
| Open with DEXTER | |
We stress that the comparison concerns only quasars, while at large the 2dF Johnson-Cousins photometry was calibrated by the SDSS colors, assuming a linear relation (Fukugita et al. 1996). As we do not have further detailed information about the specificities of the photometric systems in the two catalogues, we can only suppose that the bias and rms found are due respectively to substantial differences in the photometric system and to a large uncertainty determination of the magnitudes in both catalogues. Nevertheless this bias and rms look quite large compared to the measurement error given in both surveys. For instance Croom et al. (2004) explains that the photometric incompleteness of the 2QZ is caused partly by errors of the order of 0.1 mag in the photographic magnitudes. In a future update of the LQAC, we plan to study the empirical adjustments to link the photometric systems of each individual catalogue to a common one.
5.3 Comparison of redshifts
The differences bewteen the redshifts of the common quasars of the SDSS and the 2QZ are plotted in Fig. 10. We can observe that for z < 1, they never exceed
![]() ,
while for higher redshifts they gradually worsen, without exceeding
,
while for higher redshifts they gradually worsen, without exceeding
![]() ,
except for two isolated objects. We can conclude that the determination of the redshift is generally reliable.
,
except for two isolated objects. We can conclude that the determination of the redshift is generally reliable.
Since the best determinations of the quasar coordinates by far are obtained from radio interferometry techniques (catalogues A to D) it is interesting to study the redshift distribution of the radio loud sub-population with respect the quasars detected at optical wavelengths.
Figures 11 and 12 compare the distribution of the redshifts respectively for radio loud and radio-quiet objects. We can observe that although the distribution is quite similar, it is more homogeneous between z =0 and z=2 for the first sample, whereas it gradually increases for the second one, which should indicate that the detected optical quasars in general correspond to an earlier population than radio loud ones, even if this conclusion might be contradicted by some incompleteness of the samples. Nevertheless the large number of objects involved for both populations likely rules out an observational bias.
When looking at the ICRF sources only, a similar picture arises although the first peak lies at z = 0.4, coinciding with the secondary peak of the radio quasar histogram. Thus, a large fraction of the radio loud quasars have dimmer apparent magnitudes, a fact that must be considered in systematic radio to optical comparisons. This statement might be useful to elaborate strategies for future realizations of the ICRF based on optical measurements such as those that will be acquired by the astrometric space mission GAIA.
![\begin{figure}
\par\includegraphics[width=8.5cm,clip]{9602fig11.eps}
\end{figure}](/articles/aa/full_html/2009/05/aa09602-08/img63.gif) |
Figure 10: Redshift differences of the cross-identified quasars between the SDSS and the 2QZ, with respect to the nominal redshift in the SDSS. |
| Open with DEXTER | |
![\begin{figure}
\par\includegraphics[width=7.5cm,clip]{9602fig12.eps}
\end{figure}](/articles/aa/full_html/2009/05/aa09602-08/img64.gif) |
Figure 11: Distribution of redshift for the 8229 radio loud sources in the LQAC. |
| Open with DEXTER | |
![\begin{figure}
\par\includegraphics[width=7.5cm,clip]{9602fig13.eps}
\end{figure}](/articles/aa/full_html/2009/05/aa09602-08/img65.gif) |
Figure 12: Distribution of redshift for the 93 465 sources without radio counterparts. |
| Open with DEXTER | |
5.4 Sky density
The sky density of quasars issued of the LQAC can be defined as the number of objects per square degrees of the celestial sphere. It gives direct information on the number of quasi inertial points that could be used for differential astrometry, and it is a critical value for the future improvement of the celestial reference frame in terms of astrometric quality and density. Figure 15 shows the sky density assesed by its value for each zone of the celestial sphere in equatorial system. Each figure corresponds to a tolerance threshold for the accuracy in the determination of the source coordinates, already detailed in the Sect. 5.1. This density can reach up to 50 quasars per square degree for particular small fields. In the northern hemisphere the 2QZ reach 40 quasars per square degree and the SDSS 25 quasars per square degree at maximum. Whatever the threshold, we see a large depletion zone in the southern hemipshere.
A complementary study consists of determining the number of pairs of objects in a given small sky area, as was done for the SDSS and the 2QZ surveys (see Figs. 3 and 4). Figures 13 and 14 show the number of at least one pair of quasars within circles of increasing radii. Figure 13 compares the percentage of matches for the radio quasars population with the SDSS sample. The increasing upper line reflects a number of double spots seen, for the same quasar, by radio observations. The SDSS distribution rapidly catches up due to the lack of detailed zonal radio surveys, except for the VLA and FIRST. When the original radio list (chiefly the VLBA and the VLA calibrators) was handled, an even steeper rise was seen for the first two arcseconds radii. The low values shown on the plot are due to the one entry per quasar selection criterion, that eliminates most of the double radio spots for a single quasar. Figure 14 zooms into the first 10
![]() radii and compares the SDSS sample to VV06. It shows that the later starts much too steeply, which could indicate an important number of redundant entries.
This might due to the lack of a precise strategy to eliminate redundant spots in the later paper, such as the one based on redshifts we adopted in Sect. 4.
radii and compares the SDSS sample to VV06. It shows that the later starts much too steeply, which could indicate an important number of redundant entries.
This might due to the lack of a precise strategy to eliminate redundant spots in the later paper, such as the one based on redshifts we adopted in Sect. 4.
![\begin{figure}
\par\includegraphics[width=7.5cm,clip]{9602fig14.eps}
\end{figure}](/articles/aa/full_html/2009/05/aa09602-08/img66.gif) |
Figure 13: Sky density as given by the number of (at least one) pair of sources within a given radius. Comparisons between the radio loud quasars in our sample and the SDSS - DR5 sample. The percentages are calculated with the total number of sources. |
| Open with DEXTER | |
![\begin{figure}
\par\includegraphics[width=7.5cm,clip]{9602fig15.eps}
\end{figure}](/articles/aa/full_html/2009/05/aa09602-08/img67.gif) |
Figure 14: Sky density as given by the number of (at least one) pair of sources within a given radius. Comparison between VV06 and the SDSS. The percentages are calculated with the total number of sources. |
| Open with DEXTER | |
![\begin{figure}
\par\includegraphics[width=15.8cm,clip]{9602fig16.eps}
\end{figure}](/articles/aa/full_html/2009/05/aa09602-08/img68.gif) |
Figure 15: Spatial quasars density (quasar per square degree) in the J2000.0 equatorial reference system with a Hammer-Aitoff projection for eight different pre-compiled catalogues. |
| Open with DEXTER | |
6 The determination of luminosity distances and absolute magnitudes
One of the direct and fundamental by-products of the LQAC compilation is the determination of the luminosity distance and the absolute magnitude for most of the quasars. For sources at cosmological distances, this determination requires some working hypothesis about the geometry and the kinematics of the universe. For the LQAC, we used a homogeneous and isotropic cosmological model with a Friedmann-Lemaître-Robertson-Walker metric and a null space curvature k (
![]() ), a deceleration parameter q0=-0.58 and a Hubble expansion factor H0=72 km s-1 Mpc-1.
This set of parameters is consistent and compatible with the most recent cosmological constraints (Spergel et al. 2007). The Hubble expansion factor H0 used is the mean given by the HST Key Project. It is consistent with a probability of 68% of being between 64 and 80 km s-1 Mpc-1. The values used for
), a deceleration parameter q0=-0.58 and a Hubble expansion factor H0=72 km s-1 Mpc-1.
This set of parameters is consistent and compatible with the most recent cosmological constraints (Spergel et al. 2007). The Hubble expansion factor H0 used is the mean given by the HST Key Project. It is consistent with a probability of 68% of being between 64 and 80 km s-1 Mpc-1. The values used for ![]() and q0 are in good agreement with the combination of WMAP 3-year data and the H ST Key Project constraint H0. This implies a value of
and q0 are in good agreement with the combination of WMAP 3-year data and the H ST Key Project constraint H0. This implies a value of ![]() and
and
![]() contained in the interval
contained in the interval
![]() and
and
![]() respectively with a probability of 68%. This also corresponds to a value of
respectively with a probability of 68%. This also corresponds to a value of
![]() in the interval
in the interval
![]() and a value of q0 in
and a value of q0 in
![]() .
According to Hogg (2000), with this model and the above values for the cosmological parameters, the expression of the luminosity distance
.
According to Hogg (2000), with this model and the above values for the cosmological parameters, the expression of the luminosity distance ![]() of a quasar with a redshift z is
of a quasar with a redshift z is
 |
(1) |
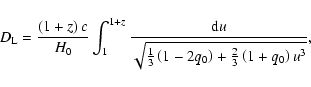
where c is the speed of light. This expression is valid only for a null space curvature.
The recent and drastic improvements of the accuracy of the cosmological parameters allow us to obtain a relatively good luminosity distance ![]() accuracy as seen in Fig. 16. We plotted the relative difference between the luminosity distance computed with our nominal values of q0 and
accuracy as seen in Fig. 16. We plotted the relative difference between the luminosity distance computed with our nominal values of q0 and ![]() and the luminosity distance computed with the limit values at one sigma interval of these same parameters against the redshift. We see that the effect of the space curvature uncertainty implies a
and the luminosity distance computed with the limit values at one sigma interval of these same parameters against the redshift. We see that the effect of the space curvature uncertainty implies a ![]() uncertainty less than
uncertainty less than ![]()
![]() .
The uncertainty in the determination of the deceleration parameter implies a
.
The uncertainty in the determination of the deceleration parameter implies a ![]() uncertainty of less than
uncertainty of less than ![]()
![]() .
The total imprecision of
.
The total imprecision of ![]() due to inaccuracy in cosmological parameters is of less than
due to inaccuracy in cosmological parameters is of less than ![]()
![]() .
It is similar to the uncertainty of
.
It is similar to the uncertainty of ![]() due to large scale inhomogeneities of the universe, as shown by Brouzakis et al. (2007). Regarding the uncertainty effect of the Hubble expansion factor H0 on
due to large scale inhomogeneities of the universe, as shown by Brouzakis et al. (2007). Regarding the uncertainty effect of the Hubble expansion factor H0 on ![]() ,
we see, with the help of Eq. (1), that
,
we see, with the help of Eq. (1), that ![]() is inversely proportional to H0: thus some new determination
is inversely proportional to H0: thus some new determination
![]() of the Hubble expansion factor could be easily taken into account by applying a scale factor.
of the Hubble expansion factor could be easily taken into account by applying a scale factor.
![\begin{figure}
\par\includegraphics[width=8.5cm,clip]{9602fig17.eps}
\end{figure}](/articles/aa/full_html/2009/05/aa09602-08/img82.gif) |
Figure 16:
Relative difference between the luminosity distance |
| Open with DEXTER | |
The absolute magnitude M of a quasar in the optical band is
| (2) |
where m represents the apparent magnitude of the source at the same optical band as M, A is the galactic extinction,
The galactic extinction A, the K-correction and the luminosity distance ![]() depend on the redshift of the considered source. The first two parameters also depend on the photometric band of the apparent magnitude of the sources. The Galactic extinction A obviously depends on the source galactic coordinates.
depend on the redshift of the considered source. The first two parameters also depend on the photometric band of the apparent magnitude of the sources. The Galactic extinction A obviously depends on the source galactic coordinates.
For the LQAC objects, we computed the absolute magnitude in the blue band (![]() )
and in the infrared band (
)
and in the infrared band (![]() ). There are three reasons for this choice: (i) for most of the LAQC quasars, the apparent magnitudes are known in these two bands; (ii) these two bands are located at the opposite edges of the optical spectrum; and (iii) the K-correction can be easily computed for these two bands using K-correction tables.
). There are three reasons for this choice: (i) for most of the LAQC quasars, the apparent magnitudes are known in these two bands; (ii) these two bands are located at the opposite edges of the optical spectrum; and (iii) the K-correction can be easily computed for these two bands using K-correction tables.
To compute the galactic extinction in the blue and infrared bands (respectively ![]() and
and ![]() ), we calculate the galactic coordinates of each source and determine the reddening value E(B-V) in magnitude based on the map of Schlegel et al. (1998). As explained by these authors, the reddening value must be multiplied by 4.325 and 2.086 to get the galactic extinction in the blue and infrared bands respectively.
), we calculate the galactic coordinates of each source and determine the reddening value E(B-V) in magnitude based on the map of Schlegel et al. (1998). As explained by these authors, the reddening value must be multiplied by 4.325 and 2.086 to get the galactic extinction in the blue and infrared bands respectively.
Because of the lack of maps the galactic extinction cannot be computed in this way for about 5000 quasars recorded in our catalogue. Since the galactic extinction could be important, especially in the blue band (about 650 sources with ![]() larger than 1 mag and 40 sources with
larger than 1 mag and 40 sources with ![]() larger than 4 mag) we chose to not compute the absolute magnitudes for all these sources (in the LQAC catalogue, the value 99.9 is inserted instead of their galactic extinction and 0 instead of their absolute magnitudes).
larger than 4 mag) we chose to not compute the absolute magnitudes for all these sources (in the LQAC catalogue, the value 99.9 is inserted instead of their galactic extinction and 0 instead of their absolute magnitudes).
To obtain the K-correction ![]() in the blue band, we used a table provided by Véron-Cetty & Véron (private communication) that gives the value of
in the blue band, we used a table provided by Véron-Cetty & Véron (private communication) that gives the value of ![]() for a source with a redshift between 0 and 5.0 in steps of 0.1. We compute, in the same way, the K-correction
for a source with a redshift between 0 and 5.0 in steps of 0.1. We compute, in the same way, the K-correction ![]() in the infrared band using the table of Richards et al. (2006) giving the value of
in the infrared band using the table of Richards et al. (2006) giving the value of
![]() for a source with a redshift between 0 and 5.49 (with a step of 0.01). These K-corrections in the blue and infrared bands are plotted against the redshift in Fig. 17.
for a source with a redshift between 0 and 5.49 (with a step of 0.01). These K-corrections in the blue and infrared bands are plotted against the redshift in Fig. 17.
![\begin{figure}
\par\includegraphics[width=8.8cm,clip]{9602fig18.eps}
\end{figure}](/articles/aa/full_html/2009/05/aa09602-08/img88.gif) |
Figure 17:
The K-correction in the infrared band |
| Open with DEXTER | |
For sources whith unknown apparent magnitudes in the blue or infrared band, we do not compute the corresponding absolute magnitude. In Fig. 18, the absolute magnitude ![]() is plotted in blue and the difference between the infrared and the blue absolute magnitudes
is plotted in blue and the difference between the infrared and the blue absolute magnitudes
![]() in red as a function of the luminosity distance
in red as a function of the luminosity distance ![]() .
.
![\begin{figure}
\par\includegraphics[width=8.5cm,clip]{9602fig19.eps}
\end{figure}](/articles/aa/full_html/2009/05/aa09602-08/img89.gif) |
Figure 18:
The blue absolute magnitude |
| Open with DEXTER | |
7 Description of the LQAC data file
The LQAC gathers total 113 666 objects which have been recorded as quasars (except for some ICRF-Ext.2) in each of the partipating catalogues. However, it does not contain the BL Lac and the Seyfert 1 type objects which are present in the various up-dates of the VV06 of which the last two releases contains respectively 1122 and 9628 objects. These objects, physically very close to quasars and sometimes identified as the same objects observed with different angles of view, might be inserted in an updated version of the LQAC, together with new quasars detected for example from an extended version of the SDSS survey such as the DR6.
![\begin{figure}
\par\includegraphics[height=22cm,width=8cm,clip]{9602fig20.eps}
\end{figure}](/articles/aa/full_html/2009/05/aa09602-08/img90.gif) |
Figure 19: Sample of the LQAC ASCII catalogue. |
| Open with DEXTER | |
7.1 Data and format
Figure 19 shows several lines of a sample page of the LQAC ASCII file. We describe in the following the various items sorted according to each column.

- Columns 1 and 2 are the
 coordinates of the quasar in the ICRS. These two coordinates are given in degrees, with a precision of 1
  10-8 (
 36
36  as). Note that no quasar, even those belonging to the ICRF, guarantees this level of accuracy. Moreover the lack of accuracy in the measurements of some quasar positions justifies that several final digits are zero.
-
- Columns 3 to 15 provide letter codes indicating the presence of the quasar in one of the 13 catalogues from A to M as given by the nomenclature of Sect. 2.2. It is therefore possible to directly view the name of the catalogues in which the quasar is present. As explained before, in each line the data was selected as indicated by the alphabetic order.
-
- Columns 16 and 17 give the flags (*, !, x, ?) already explained in Sects. 4.2 and 4.4 and presented in Tables 2 and 3. They enable one to understand the characteristics of the cross-identification ambiguity of quasars involving HB (Col. 16) and VV06 (Col. 17).
-
- Columns 18 to 24 are the visual magnitudes listed by decreasing frequency, for the u, b, v, g, r, i, z bands. Note that for each band the photometric system in which these magnitudes have been measured are not homogeneous, the priority being indicated by the flag in decreasing order of the letter of the corresponding catalogue. For instance, the value of the r magnitude for a quasar observed both by the SDSS (code E) and the 2QZ survey (code F) is taken from the SDSS, whereas the value of the b magnitude, only present in the 2QZ survey, will be taken from this survey. However, a quasar observed only in the 2QZ survey will have r magnitude in the photometric system of this survey.
-
- Columns 25 and 26 present the J and K infrared magnitude, for the 13 059 quasars with counterparts found in the 2MASS survey.
-
- Columns 27 to 31 give the radio fluxes at 1.4 GHz (20 cm), 2.3 GHz (13 cm), 5.0 GHz (6 cm), 8.4 GHz (3.6 cm) and 24 GHz (1.2 cm) respectively.
-
- Columns 32 and 33 give the redshift z and the reference of the catalogue from which it has been taken. This reference is a letter chosen from D to I if the value of z was from one of the six basic catalogues of the compilation. When the value of z was taken from VV06, a number linked to the catalogue reference in VV06 is given, from 1 to 791. These numbers determine the origin of each redshift value. We order our catalogue reference numbers by decreasing number of quasars. For instance, in the LQAC compilation, 1288 quasars have the reference number 1, which
is linked to VV06 reference number 1019 which is ``Iovino A., Clowes R., Shaver P. 1996, A&AS, 119, 265'', 407 quasars have catalogue reference number 2, 384 quasars have catalogue reference number 3, and so on. A specific file provided with the LQAC indicates the correspondences between our catalogue reference numbers, the VV06 reference numbers, the name of these catalogue references and the number of quasars concerned.
-
- Columns 34 to 39 involve the data used for the estimation of the absolute magnitude, according to the preceding section, together with the magnitude. Columns 34 and 35 are respectively the values of the bolometric distance and of the galactic extinction. Columns 36 and 37 represent the K-correction in two bands b and i. The last two Cols. 38 and 39 are the values of Mb and Mi, the absolute magnitudes at b and i bands, according to the rules explained in the previous section, and the adopted values of
 ,
K and A.
,
K and A.
7.2 Access to the LQAC data and update
Note that the LQAC extended catalogue has been stored in the VOTable format compatible with Astronomy VO Data Format and VO tools. This catalogue is more complete than the ASCII version. For instance, we kept in this database all the original catalogue references and nominal values with their uncertainties, even if not unique, for each data field (magnitude, redshift, radio flux) of a given quasar. The LQAC in ASCII and VOTable format, and all annex information are made available at the ICRS Product Center web site at the Paris Observatory (http://hpiers.obspm.fr/icrs-pc) or by anonymous ftp to ftp://syrte.obspm.fr/pub/LQAC.
We plan to update the LQAC on an annual basis, by including new quasars, gradually ameliorating the quality of the data and carrying out statistical studies.
8 Conclusion and prospects
In this paper we have compiled the large majority of the currently recorded quasars in order to construct Large Astrometric Quasar Catalogue (LQAC). Our main goal was to give the coordinates of all the objects determinde to be quasars with the best accuracy after establishing a hierarchy among the existing catalogues according to their astrometric quality. The LQAC contains 113 666 quasars, and is the largest compiled catalogue currently available. Moreover we have included additional information classified in 20 columns corresponding to 9 photometric bands (u, b, v, g, r, i, z, J, K), a redshift determination, five radio-fluxes, and 6 columns related to the estimation of the absolute magnitudes in two bands i and b. Note that for 104 944 objects, information comes from only twelve catalogues, the largest one being the data relase 5 of the SDSS. One of the LQAC characteristics is to give a flag for each of these twelve leading catalogues, enabling one to immediately know in which of these catalogues a given quasar has been identified.
We have also studied the homogenity of the data, both in astrometric and photometric fields, by comparing the parameters as equatorial coordinates, magnitudes and redshifts, given by two or more catalogues. We have also presented some statistics about the spatial distribution of the objects.
Also, we have implemented a precise and very careful method to determine with highest accuracy the absolute magnitudes of the quasars in two bands Mi and Mb, by taking into account the most recent models of galactic extinction, of K correction and of luminosity distance.
This work and its potential extensions might be useful for future investigations and the construction of a celestial reference frame more dense and accurate than it is now, both at radio and optical wavelengths. Presently the Hipparcos Catalogue reference Frame (ESA 1997) provides an extension of the ICRF at optical wavelengths, through the position, proper motion and parallaxes of 120 000 stars with a 1 mas accuracy. A complementary representation of the ICRS is being developed following its defining principles, namely kinematic non-rotating with respect to distant extragalactic objects, aligned to the mean equator and dynamical equinox of J2000.0, and realized by a list of adopted coordinates of extragalactic radio sources. This Optical Celestial Reference Frame (Andrei et al. 2006) is directly related to the optical counterpart of the ICRF sources whenever feasible.
Acknowledgements
We thank S. Derrière (CDS, Strasbourg) for his help in using the VO tools, T. Carlucci (Observatoire de Paris/SYRTE) for the maintenance of the LQAC data servers and J.-Y. Richard (Observatoire de Paris/SYRTE) for useful advice on the statistical approach used in our study of astrometric homogeneity of LQAC. We are very grateful to M. Véron for sending us useful data. A. H. Andrei thanks the Observatoire de Paris/SYRTE and the CNPq/Brazil for grants received to join the project.
References
- Adelman-McCarthy, J. K., Agüeros, M. A., Allam, S. S., et al. 2007, ApJS, 172, 634 [NASA ADS] [CrossRef] (In the text)
- Andrei, A. H., da Silva Neto, D. N., Assafin, M., et al. 2006, in Precession and New Models in Fundamental Astronomy, IAU XXVI, Joint Discussion 16, Prague, Czech Republic, ed. Capitaine et al. (In the text)
- Arias, E. F., Charlot, P., Feissel, M., & Lestrade, J.-F. 1995, A&A, 303, 604 [NASA ADS]
- Beasley, A. J., Peck, A. B., Petrov, L., et al. 2002, ApJS, 141, 13 [NASA ADS] [CrossRef] (In the text)
- Becker, R. H., White, R. L., & Helfand, D. J. 1995, ApJ, 450, 559 [NASA ADS] [CrossRef] (In the text)
- Becker, R. H., White, R. L., Gregg, M. D., et al. 2001, ApJS, 135, 227 [NASA ADS] [CrossRef] (In the text)
- Bowman, A. W., & Azzalini, A. 1997, Applied Smoothing Techniques for Data Analysis (Oxford: University Press) (In the text)
- Brouzakis, N., Tetradis, N., & Tzavara, E. 2007, JCAP, 2, 13 [NASA ADS] (In the text)
- Browne, I. W. A., Patnaik, A. R., Wilkinson, P. N., & Wrobel, J. M. 1998, MNRAS, 293, 257 [CrossRef] (In the text)
- Claussen, M. 2006, VLA Calibrator Manual (In the text)
- Croom, S. M., Smith, R. J., Boyle, B. J., et al. 2004, MNRAS, 349, 1397 [NASA ADS] [CrossRef] (In the text)
- Cutri, R. M., Skrutskie, M. F., van Dyk, S., et al. 2003, NASA/IPAC Infrared Science Archive, http://irsa.ipac.caltech.edu/applications/Gator/ (In the text)
- Fey, A. L., Ma, C., Arias, E. F., et al. 2004, AJ, 127, 3587 [NASA ADS] [CrossRef] (In the text)
- Flesch, E., & Hardcastle, M. J. 2004, A&A, 427, 387 [NASA ADS] [CrossRef] [EDP Sciences] (In the text)
- Fomalont, E. B., Petrov, L., MacMillan, D. S., et al. 2003, AJ, 126, 2562 [NASA ADS] [CrossRef] (In the text)
- Fukugita, M., Ichikawa, T., Gunn, J. E., et al. 1996, AJ, 111, 1748 [NASA ADS] [CrossRef] (In the text)
- Gregg, M. D., Becker, R. H., White, R. L., et al. 1996, AJ, 112, 407 [NASA ADS] [CrossRef] (In the text)
- Hewitt, A., & Burbidge, G. 1993, ApJS, 87, 451 [NASA ADS] [CrossRef] (In the text)
- Hogg, D. W., Pahre, M. A., Adelberger, K. L., et al. 2000, ApJS, 127, 1 [NASA ADS] [CrossRef]
- Hog, E., Fabricius, C., Makarov, V. V., et al. 2000, A&A, 355, L27 [NASA ADS] (In the text)
- Hennawi, J. F., Strauss, M. A., Oguri, M., et al. 2006, AJ, 131, 1 [NASA ADS] [CrossRef] (In the text)
- Kovalev, Y. Y., Petrov, L., Fomalont, E., & Gordon, D. 2007, AJ, 133, 1236 [NASA ADS] [CrossRef]
- IERS 1999, International Earth Rotation Service Annual Report 1998, Observatoire de Paris, 87 [CrossRef] (In the text)
- Lasker, B., Lattanzi, M. G., McLean, B. J., et al. 2008, AJ, 136, 735 [NASA ADS] [CrossRef] (In the text)
- Ma, C., Arias, E. F., Eubanks, T. M., et al. 1998, AJ, 116, 516 [NASA ADS] [CrossRef] (In the text)
- Monet, D. G., Levine, S. E., Canzian, B., et al. 2003, AJ, 125, 984 [NASA ADS] [CrossRef] (In the text)
- Patnaik, A. R., Browne, I. W. A., Wilkinson, P. N., & Wrobel, J. M. 1992, MNRAS, 254, 655 [NASA ADS] (In the text)
- Pier, J. R., Munn, J. A., Hindsley, R. B., et al. 2003, AJ, 125, 1559 [NASA ADS] [CrossRef] (In the text)
- Richards, G. T., Lacy, M., Storrie-Lombardi, L. J., et al. 2006, ApJS, 166, 470 [NASA ADS] [CrossRef] (In the text)
- Schneider, D. P., Fan, X., Hall, P. B., et al. 2003, AJ, 126, 2579 [NASA ADS] [CrossRef]
- Schneider, D. P., Hall, P. B., Richards, G. T., et al. 2005, AJ, 130, 367 [NASA ADS] [CrossRef] (In the text)
- Schlegel, D. J., Finkbeiner, D. P., & Davis, M. 1998, ApJ, 500, 525 [NASA ADS] [CrossRef] (In the text)
- Spergel, D. N., Bean, R., Doré, O., et al. 2007, ApJS, 170, 377 [NASA ADS] [CrossRef] (In the text)
- Souchay, J., Lambert, S. B., Andrei, A. H., et al. 2008, A&A, 485, 299 [NASA ADS] [CrossRef] [EDP Sciences] (In the text)
- Véron-Cetty, M.-P., & Véron, P. 1987, ESO Scientific Report, Garching (In the text)
- Véron-Cetty, M.-P., & Véron, P. 2006, A&A, 455, 773 [NASA ADS] [CrossRef] [EDP Sciences] (In the text)
- Wilkinson, P. N., Browne, I. W. A., Patnaik, A. R., et al. 1998, MNRAS, 300, 790 [CrossRef] (In the text)
- White, R. L., Becker, R. H., Gregg, M. D., et al. 2000, ApJS, 126, 133 [NASA ADS] [CrossRef] (In the text)
- Zacharias, N., Urban, S. E., Zacharias, M. I., et al. 2004, AJ, 127, 3043 [NASA ADS] [CrossRef]
Footnotes
- ... (LQAC)
- The ASCII file of the catalogue LQAC is available in electronic form at the CDS via anonymous ftp to cdsarc.u-strasbg.fr (130.79.128.5) or via http://cdsweb.u-strasbg.fr/cgi-bin/qcat?/A+A/494/799
All Tables
Table 1: Characteristics of the catalogues contributing to the LQAC.
Table 2: Results of cross-identification between A-H and HB.
Table 3: Results of cross-identification between A-L and VV06. See Note on Table 2.
Table 4: Number of cross-identified objects between the 13 catalogues included in the LQAC compilation.
Table 5: Photometry and redshift information available according to each optical catalogue included in the LQAC compilation.
Table 6: Infrared photometry and radio flux information available according to the corresponding catalogues of the LQAC.
Table 7: Contribution per item for each individual catalogue used to construct the LQAC.
Table 8: Number of entries per item for the following catalogues: VV06, A-L, and final LQAC.
Table 9: Determination of the astrometric accuracy of the catalogues used in the LQAC.
All Figures
| |
Figure 1: Spatial distribution of the main input catalogs of the LQAC in a J2000 equatorial reference frame with a Hammer-Aitoff projection. |
| Open with DEXTER | |
| In the text | |
| |
Figure 2: Spatial distribution of the main input catalogs of the LQAC in a Galactic reference frame with a Hammer-Aitoff projection. |
| Open with DEXTER | |
| In the text | |
| |
Figure 3: Number of internal cross-identified quasars in the SDSS-DR5 catalog within a shell of given radius. |
| Open with DEXTER | |
| In the text | |
| |
Figure 4: Number of internal cross-identified quasars in the 2QZ catalog within a shell of given radius. |
| Open with DEXTER | |
| In the text | |
| |
Figure 5: Number of cross-identified quasars between HB and the A-H compiled catalogue. |
| Open with DEXTER | |
| In the text | |
| |
Figure 6:
Excess ratio of pairs of quasars with
|
| Open with DEXTER | |
| In the text | |
| |
Figure 7:
Redshift differences |
| Open with DEXTER | |
| In the text | |
| |
Figure 8: Equatorial coordinate differences between the values in a given catalogue and the preceding compilation phase of the LQAC. The standard deviations are shown by the dashed contours. The external continuous contours are lines of probability, corresponding to 50% and 80% respectively. |
| Open with DEXTER | |
| In the text | |
| |
Figure 9: Comparisons between the u ( upper panel) and r ( lower panel) magnitude of the 2053 cross-identified quasars between the SDSS and the 2QZ surveys. The straight dashed line corresponds to equal magnitudes. |
| Open with DEXTER | |
| In the text | |
| |
Figure 10: Redshift differences of the cross-identified quasars between the SDSS and the 2QZ, with respect to the nominal redshift in the SDSS. |
| Open with DEXTER | |
| In the text | |
| |
Figure 11: Distribution of redshift for the 8229 radio loud sources in the LQAC. |
| Open with DEXTER | |
| In the text | |
| |
Figure 12: Distribution of redshift for the 93 465 sources without radio counterparts. |
| Open with DEXTER | |
| In the text | |
| |
Figure 13: Sky density as given by the number of (at least one) pair of sources within a given radius. Comparisons between the radio loud quasars in our sample and the SDSS - DR5 sample. The percentages are calculated with the total number of sources. |
| Open with DEXTER | |
| In the text | |
| |
Figure 14: Sky density as given by the number of (at least one) pair of sources within a given radius. Comparison between VV06 and the SDSS. The percentages are calculated with the total number of sources. |
| Open with DEXTER | |
| In the text | |
| |
Figure 15: Spatial quasars density (quasar per square degree) in the J2000.0 equatorial reference system with a Hammer-Aitoff projection for eight different pre-compiled catalogues. |
| Open with DEXTER | |
| In the text | |
| |
Figure 16:
Relative difference between the luminosity distance |
| Open with DEXTER | |
| In the text | |
| |
Figure 17:
The K-correction in the infrared band |
| Open with DEXTER | |
| In the text | |
| |
Figure 18:
The blue absolute magnitude |
| Open with DEXTER | |
| In the text | |
| |
Figure 19: Sample of the LQAC ASCII catalogue. |
| Open with DEXTER | |
| In the text | |
Copyright ESO 2009
Current usage metrics show cumulative count of Article Views (full-text article views including HTML views, PDF and ePub downloads, according to the available data) and Abstracts Views on Vision4Press platform.
Data correspond to usage on the plateform after 2015. The current usage metrics is available 48-96 hours after online publication and is updated daily on week days.
Initial download of the metrics may take a while.