| Issue |
A&A
Volume 429, Number 2, January II 2005
|
|
|---|---|---|
| Page(s) | 667 - 676 | |
| Section | Stellar structure and evolution | |
| DOI | https://doi.org/10.1051/0004-6361:20041687 | |
| Published online | 17 December 2004 | |
Type Ia supernova SN 2003du: Optical observations
1
Indian Institute of Astrophysics, II Block Koramangala, Bangalore 560 034, India e-mail: This email address is being protected from spambots. You need JavaScript enabled to view it.
2
Center for Research and Education in Science & Technology, Hosakote e-mail: This email address is being protected from spambots. You need JavaScript enabled to view it.
Received:
19
July
2004
Accepted:
15
September
2004
Abstract
 photometry and optical spectra of type Ia supernova SN 2003du
obtained at the Indian Astronomical Observatory for nearly a year since
discovery are presented.
The apparent magnitude at maximum was
photometry and optical spectra of type Ia supernova SN 2003du
obtained at the Indian Astronomical Observatory for nearly a year since
discovery are presented.
The apparent magnitude at maximum was 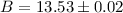 mag, and the
colour
mag, and the
colour  mag. The luminosity decline rate,
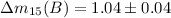 mag indicates an absolute B magnitude at
maximum of
mag indicates an absolute B magnitude at
maximum of 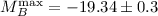 mag and the distance modulus to
the parent galaxy as
mag and the distance modulus to
the parent galaxy as  .
The light curve shapes are similar, though not identical, to those of SNe 1998bu
and 1990N, both of which had luminosity decline rates similar to that of
SN 2003du and occurred in spiral galaxies.
The peak bolometric luminosity indicates that ~
.
The light curve shapes are similar, though not identical, to those of SNe 1998bu
and 1990N, both of which had luminosity decline rates similar to that of
SN 2003du and occurred in spiral galaxies.
The peak bolometric luminosity indicates that ~ mass
of 56Ni was ejected by the supernova.
The spectral evolution and the evolution of the Si II and Ca II absorption
velocities closely follows that of SN 1998bu, and in general, is within the
scatter of the velocities observed in normal type Ia supernovae.
The spectroscopic and photometric behaviour of SN 2003du is quite typical for
SNe Ia in spirals.
A high velocity absorption component in the Ca II (H and K) and IR-triplet
features, with absorption velocities of ~
mass
of 56Ni was ejected by the supernova.
The spectral evolution and the evolution of the Si II and Ca II absorption
velocities closely follows that of SN 1998bu, and in general, is within the
scatter of the velocities observed in normal type Ia supernovae.
The spectroscopic and photometric behaviour of SN 2003du is quite typical for
SNe Ia in spirals.
A high velocity absorption component in the Ca II (H and K) and IR-triplet
features, with absorption velocities of ~ km s-1 and ~
 km s-1 respectively, is detected in the pre-maximum spectra
of days -11 and -7.
km s-1 respectively, is detected in the pre-maximum spectra
of days -11 and -7.
Key words: stars: supernovae: general / stars: supernovae: individual: SN2003du
© ESO, 2005
Current usage metrics show cumulative count of Article Views (full-text article views including HTML views, PDF and ePub downloads, according to the available data) and Abstracts Views on Vision4Press platform.
Data correspond to usage on the plateform after 2015. The current usage metrics is available 48-96 hours after online publication and is updated daily on week days.
Initial download of the metrics may take a while.