| Issue |
A&A
Volume 495, Number 2, February IV 2009
|
|
|---|---|---|
| Page(s) | 577 - 586 | |
| Section | The Sun | |
| DOI | https://doi.org/10.1051/0004-6361:200810409 | |
| Published online | 07 October 2008 | |
A spectroscopic analysis of the most polarizing
atomic lines of the second solar spectrum![[*]](/icons/foot_motif.gif)
L. Belluzzi - E. Landi Degl'Innocenti
Dipartimento di Astronomia e Scienza dello Spazio, University of Firenze, Largo E. Fermi, 2 - 50 125 Firenze, Italy
Received 17 June 2008 / Accepted 18 September 2008
Abstract
We present an analysis of the second solar spectrum, as plotted in graphical form in the three volumes of the atlas ``The Second Solar Spectrum'', in the wavelength range between 3160 Å and 6995 Å. All the strongest positive linear polarization signals produced by atomic spectral lines are identified, and their amplitudes are listed, along with the most relevant spectroscopic properties of the lines. The various signals are divided into five classes according to the shape of their Q/I profiles. Three empirical rules are formulated from the analysis of the amplitude and shape of the various signals, and of the spectroscopic properties of the spectral lines.
Key words: atomic data - line: profiles - polarization - scattering - Sun: atmosphere
1 Introduction
The theoretical interpretation of the ``second solar spectrum'', namely the linearly polarized spectrum of the solar radiation coming from the quiet solar atmosphere close to the limb, is presently one of the most interesting topics in solar physics. The term second solar spectrum, first suggested by Ivanov, is indeed appropriate since this spectrum has a structural richness that can be compared to that of the intensity spectrum, and, at the same time, it shows a significantly different aspect. The first detection of a linear polarization signal in a spectral line observed close to the solar limb (Ca I at 4227 Å) dates back to 1941 (Redman 1941). After Redman's discovery, other strongly polarizing lines were detected during the 1960s and 1970s (Stenflo 1974; Brückner 1963; Wiehr 1978,1975). The first systematic analysis was performed by Stenflo and collaborators in the 1980s (Stenflo et al. 1983a,1980,1983b), though with instruments of reduced polarimetric sensitivity. Most of the spectral structures of the second solar spectrum therefore remained inaccessible until about one decade ago, when the first instruments capable of performing observations with polarimetric sensitivities better than 10-3 were developed (Stenflo & Keller 1996,1997). Today the second solar spectrum is available in graphic form in the atlas ``The Second Solar Spectrum'' (Gandorfer 2002,2005,2000), which covers the spectral range between 3160 Å and 6995 Å.It was soon realized that the second solar spectrum provides a new formidable window for diagnosing the Sun. Its interpretation, which represents an extraordinary theoretical challenge, seems to be a necessary and unavoidable step to improve our knowledge of the solar atmosphere. Although the fundamental physical process at the origin of the second solar spectrum (resonance scattering) is well understood, the formulation of a complete theory, able to describe the generation and transfer of polarized radiation in such a complex environment as the solar atmosphere, has revealed to be an extremely complex task. Today, we can rely on a rigorous theory of the polarization in spectral lines which has been deduced from the principles of quantum electrodynamics (see the monograph by Landi Degl'Innocenti & Landolfi 2004). Through the application of this theory, combined with the development of suitable numerical methods in polarized radiative transfer (Manso Sainz & Trujillo Bueno 2003; Trujillo Bueno 2003a), it has been possible to interpret several important features of the second solar spectrum, and to start exploiting it to investigate the physical properties of our nearest star (see Trujillo Bueno 2009, for a recent review).
The interpretation of the second solar spectrum through the above mentioned theory, as well as through other theoretical approaches that have been proposed is, however, still rather fragmentary. The reason is that, as previously observed, the problem we are facing is very complex, and either the approaches based on simplifying assumptions (last scattering approximation, flat spectrum approximation, two-level atom, unpolarized lower level, etc.), or the more sophisticated ones including detailed radiative transfer cannot be applied with success to whatever spectral line. As a consequence, most of the investigations have been dedicated to the interpretation of particular lines or multiplets of this spectrum, while not much attention has been paid to the analysis of its general properties.
In this respect, probably one of the most important questions concerning the whole second solar spectrum, that still waits for an answer, is why only particular lines, of certain elements, produce strong polarization signals. For instance, one can wonder why some elements are particularly present with their lines in the second solar spectrum, whereas other elements of comparable abundance are totally absent. Moreover, observing the second solar spectrum one can easily realize that several conspicuous polarization signals are produced by relatively weak lines in the intensity spectrum, often belonging to atomic or molecular species with low abundances. On the other hand, many strong lines in the intensity spectrum are quite anonymous in the second solar spectrum. At the moment it is difficult to explain in a quantitative way such peculiarities, and to predict which lines are expected to produce particularly strong polarization signals, though, when dealing with single spectra, interesting and encouraging, even if qualitative, results have been obtained for Ti I (Manso Sainz & Landi Degl'Innocenti 2002), and Ce II (Manso Sainz et al. 2006), two of the most remarkable elements of the second solar spectrum.
In this paper we present an investigation carried out over the whole second solar spectrum as plotted in graphical form in the three volumes of the atlas ``The Second Solar Spectrum'' (Gandorfer 2002,2005,2000). The aim is to try to answer the previous question, looking for possible general physical properties common to all the most polarizing atomic spectral lines. The first part of the investigation has been dedicated to a complete analysis of the spectrum, through which we could identify, measure and classify all the strongest polarization signals due to atomic transitions (Sect. 2). We then selected only the atomic spectral lines of unambiguous identification and free of blends, and we analyzed their spectroscopic properties (Sect. 3). This analysis lead us to the formulation of three empirical rules presented in Sect. 4. In Sect. 5 we tried to interpret some of the rules within the framework of the theory presented in Landi Degl'Innocenti & Landolfi (2004).
2 Analysis of the second solar spectrum
We analyzed the second solar spectrum as observed by
Gandorfer (2002,2005,2000) between 1999 and 2003 using the Zürich Imaging
Polarimeter (ZIMPOL) at the Gregory Coudé Telescope of IRSOL (Vols. I and II), and at the McMath-Pierce telescope of Kitt-Peak (Vol. III), in the
spectral range between 3160 Å and 6995 Å.
We decided to refer to these data since the
main aim of our investigation was to analyze the full second solar spectrum,
and it was therefore essential to refer to a set of homogeneous
observations obtained, as much as possible, with the same instrument, and in a
relatively short time interval (with respect to the solar activity cycle).
However, it is important to point out that several signals that are
not so conspicuous in Gandorfer's atlas, turned out to be much stronger in
other observing runs, made in different periods of the activity
cycle![]() .
.
Though the second solar spectrum contains many polarization signals due to molecular transitions, in this investigation we limited ourselves to the analysis of the atomic lines. We then identified all the atomic spectral lines producing positive linear polarization signals (according to the specifications better defined in Sect. 2.2) with an amplitude larger than 0.1%. To take into account the decrease of the polarization degree, both in the continuum and in the spectral lines, going towards the red part of the visible spectrum, this threshold value has been decreased to 0.05% for wavelengths larger than 4500 Å. These threshold values for the Q/I signal amplitude, as well as the wavelength limit of 4500 Å , are completely arbitrary. Although more sophisticated criteria could in principle be applied, our choice seems in any case to be quite reasonable: in the analyzed spectral range, in fact, about 250 lines producing polarization signals higher than the threshold values can be identified. This number is statistically significant and, at the same time, still easily manageable.
2.1 Classification of the Q/I signals
We divided all the selected signals into three main classes, according to the shape of the Q/I profile. The signals which show a Q/I profile with a single peak at line center have been classified as ``S'' signals (see Fig. 1, panel a), those which depolarize in the wings, and produce a narrow peak at line center have been classified as ``W'' signals (see Fig. 1, panel b), while those that polarize in the wings, show a decrease of the polarization amplitude approaching to the line-core and, eventually, show a narrow peak at line center have been classified as ``M'' signals. The ``M'' signals have been further divided into three subclasses, according to the presence or not of the line-core peak, and according to the relative width of the wing-lobes with respect to the line-core peak (if present). The ``M'' signals which do not show any polarizing peak at the line-core (or that show a weak line-core peak, with an amplitude below the threshold value) have been classified as ``M0'' (see Fig. 1, panels c and d), those which show in the wings polarization lobes much broader than the line-core peak have been classified as ``M1'' (see Fig. 1, panels e and f), while those which show in the wings polarization peaks whose width is similar to, or smaller than, the width of the line-core peak have been classified as ``MS'' (see Fig. 1, panels g and h). As far as ``M1'' and ``MS'' signals are concerned, our classification scheme does not take into account whether the line-core peak exceeds or not the continuum level or the wing-lobe amplitude. We have to remark that the classification of the signals through these criteria can be quite ambiguous in some cases. However, we believe that the scheme presented in this paper can be considered as a good starting point to organize in a few significative classes the wide variety of polarimetric signals that are found in the second solar spectrum. Examples of signals of the second solar spectrum belonging to the various classes proposed can be found in Fig. 2.
![\begin{figure}
\par\includegraphics[width=17.5cm,clip]{0409fig1.eps}\end{figure}](/articles/aa/full_html/2009/08/aa10409-08/img19.gif) |
Figure 1: Classification scheme of the Q/I profiles. The thick dashed horizontal line represents the continuum level. The vertical dashed line joins the limits between which the amplitude of the signal has been measured. |
| Open with DEXTER | |
![\begin{figure}
\par\includegraphics[width=17.5cm,clip]{0409fig2.eps}\end{figure}](/articles/aa/full_html/2009/08/aa10409-08/img20.gif) |
Figure 2: Examples of signals of the second solar spectrum belonging to the various classes proposed. Panel a): Sr I at 4607 Å (S signal); panel b): Fe I at 4415 Å (W signal); panels c) and d): Co I at 3405 Å and Ti II at 3373 Å (M0 signals), panels e) and f): Ca I at 4227 Å and Fe I at 4046 Å (M1 signals); panels g) and h): Sr II at 4078 Å and Cr I at 5208 Å (MS signals). The observations shown in this figure have been scanned from the atlas ``The Second Solar Spectrum'' (Gandorfer 2002,2005,2000). |
| Open with DEXTER | |
Some ``S'' signals lie on the large wings of strongly
depolarizing lines. In these cases, if the peak does not reach the theoretical
continuum, it is not trivial to understand if we are in the presence of
a polarizing spectral line or not.
Indeed, if the line is intrinsically ``neutral'', or less depolarizing than
the wings of the strong line, the resulting peak would be nothing but a kind
of an ``artefact'' (see Fig. 3, panel a).
In this respect, important hints can be obtained from the analysis of
other possible blends present in the same depolarizing wings.
For example, if all the blended lines produce polarization peaks, and these
are very similar to each other, very likely their polarization effect is only
apparent, and they have not been taken into account.
On the other hand, if we are in the presence of such a blend, and there are
reasons to believe that the polarization signal is ``real'', then it has been
classified as ``S![]() ''.
''.
At wavelengths shorter than 4000 Å, the solar spectrum is crowded by a large number of very intense spectral lines, usually strongly blended between each other. A significant number of these strong lines produce in the second solar spectrum strong polarization signals, which very often overlap. This peculiarity makes our investigation rather difficult in this spectral region. On one hand, in fact, it is not unusual to find interesting polarization signals strongly blended with the large wings of these lines, and in these cases it can be quite difficult to classify the shape of the signals, and to decide whether or not they exceed the threshold value. In several cases we tried to justify our conclusions with a note in Table 1 (see Sect. 2.3). On the other hand, the classification of the polarization signals produced by the same strong lines is in some cases rather difficult. If they are isolated, in the sense that their extended wings are not blended with other strong lines belonging to the same multiplet, then the signals can be usually classified following the proposed scheme (usually as ``M0'' or ``M1''). On the contrary, if blends between strong lines of the same multiplet are present, then in the far wings of the lines the polarization is mainly due to quantum interferences between different J-levels (see for example the H and K lines of Ca II), and the resulting profiles might not fall in one of the classes proposed.
| |
Figure 3:
Examples of polarization signals blended with stronger and broader
ones. Panel a): a S |
| Open with DEXTER | |
2.2 Measurement of the signal amplitude
With the exception of the ``M0'' lines, what has been measured and compared
to the threshold value is the amplitude of the line-core peak.
We believe, in fact, that this quantity contains the most interesting physical
information. Moreover, it is rather uncommon for this peak to be severely
affected by blends, since it falls at line center.
As far as the ``S'' signals are concerned, the amplitude of the peak is
measured from the continuum level which is plotted in the atlas (see
Fig. 1, panel a).
We recall that this quantity is not directly observed, but it is deduced
from the theoretical calculations of Fluri & Stenflo (1999), for
![]() Å, and of Stenflo (2005) for
Å, and of Stenflo (2005) for
![]() Å.
On the other hand, as far as ``W'' signals are concerned, the amplitude of the
peak is measured from the lowest depolarizing dip (see Fig. 1,
panel b).
Concerning the ``M1'' and ``MS'' signals, the choice of the reference level
from which the line-core peak amplitude is measured depends on whether
the polarization at the lowest depolarizing dip is below the theoretical
continuum or not.
In the former case it is measured from the lowest depolarizing dip (see
Fig. 1, panels f and h), in the latter from the
theoretical continuum (see Fig. 1, panels e and g).
As far as the ``M0'' signals are concerned, what has been measured, and
compared to the threshold value, is the amplitude of the wing-lobes with
respect to the theoretical continuum (see Fig. 1, panels c and d). It is important to note that this quantity has to be
considered with caution.
The wing-lobes, in fact, are usually very broad, and often the presence of
blends makes impossible the estimate of their real amplitude.
For the sake of completeness, also for the ``M1'' and ``MS'' signals
the amplitude of the wing-lobes has been measured and listed in
Table 1 (see Sect. 2.3) below the amplitude of the
line-core peak.
Å.
On the other hand, as far as ``W'' signals are concerned, the amplitude of the
peak is measured from the lowest depolarizing dip (see Fig. 1,
panel b).
Concerning the ``M1'' and ``MS'' signals, the choice of the reference level
from which the line-core peak amplitude is measured depends on whether
the polarization at the lowest depolarizing dip is below the theoretical
continuum or not.
In the former case it is measured from the lowest depolarizing dip (see
Fig. 1, panels f and h), in the latter from the
theoretical continuum (see Fig. 1, panels e and g).
As far as the ``M0'' signals are concerned, what has been measured, and
compared to the threshold value, is the amplitude of the wing-lobes with
respect to the theoretical continuum (see Fig. 1, panels c and d). It is important to note that this quantity has to be
considered with caution.
The wing-lobes, in fact, are usually very broad, and often the presence of
blends makes impossible the estimate of their real amplitude.
For the sake of completeness, also for the ``M1'' and ``MS'' signals
the amplitude of the wing-lobes has been measured and listed in
Table 1 (see Sect. 2.3) below the amplitude of the
line-core peak.
In the case of blends, the unblended (or less blended) left or right dip (or lobe) has been considered. The amplitude of any ``S'' signal blended with a stronger (polarizing or depolarizing) signal is not measured from the theoretical continuum of the atlas, but from a reference value qualitatively estimated from the expected shape of the Q/I profile of the blending line (see Fig. 3, panels a and b).
2.3 Table of the most polarizing atomic spectral lines of the second solar spectrum
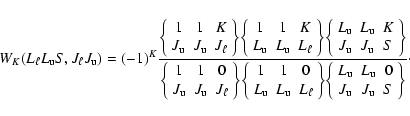
In Table 1 we list, in order of increasing wavelength, all the atomic spectral lines that produce positive polarization signals higher than the threshold value (0.1% ifIn the next 3 columns we list the value of the amplitude of the polarization signal (in percent), giving the values of (Q/I)M, (Q/I)m, and the difference Q/I=(Q/I)M-(Q/I)m. The quantities (Q/I)M and (Q/I)m are the values of (Q/I) measured at the top and at the bottom of the polarization signal, respectively. As far as ``S'' signals are concerned, an asterisk over the value of (Q/I)m indicates that this reference polarization value is not the theoretical continuum plotted in the atlas, but a value estimated by the authors as previously described, because of the presence of a blend. In the case of ``M1'' and ``MS'' signals we list both the amplitude of the line-core peak (which is the quantity we will refer to throughout our investigation) and below, for the sake of completeness, the amplitude of the wing-lobes. This last quantity has not been listed in the case of severely blended wing-lobes. Note that the amplitude of the wing-lobes, both for the ``M0'' signals, and for the ``M1'' and ``MS'' signals, has been quoted in italic. These three quantities, as explained, have been measured graphically on the three volumes of the atlas ``The Second Solar Spectrum'' (Gandorfer 2002,2005,2000). Finally, in the last column we quote the classification of the Q/I profile, according the scheme described in Sect. 2.1. Several notes have been added with the aim of clarifying either our classification, or the Q/I measurement, in the case of blended signals, and in order to point out peculiarities that have been noticed in several profiles during our analysis.
3 Selection of the Lines
Once the polarization signals exceeding the threshold value have been identified, classified, and listed in Table 1, we concentrated only on those produced by spectral lines free of blends in the intensity spectrum, and with unambiguous classification and amplitude measurement (signals free of blends in the Q/I spectrum). These lines are collected, element by element, in Table 2.
In the first six columns of Table 2 we list
the element, the solar and laboratory wavelengths, the reduced equivalent width,
the Q/I signal amplitude, and the classification of the Q/I signal.
With the exception of the laboratory wavelengths, which are taken from
Moore (1945)![]() , all the
other quantities are the same as in Table 1.
As far as ``S'' signals are concerned, an asterisk over the Q/I value
indicates that the amplitude of the peak has not been measured from the
theoretical continuum, but from another reference value because of the
presence of a blend, as explained in detail in Sect. 2.2.
, all the
other quantities are the same as in Table 1.
As far as ``S'' signals are concerned, an asterisk over the Q/I value
indicates that the amplitude of the peak has not been measured from the
theoretical continuum, but from another reference value because of the
presence of a blend, as explained in detail in Sect. 2.2.
In the next two columns we list the lower and upper terms of the transition, the multiplet number, and the J-values of the lower and upper levels of the transition. These quantities are taken from Moore (1945)2. In column nine we list the Einstein coefficients for spontaneous emission. These quantities are taken either from Ralchenko et al. (2008) or from Kurucz & Bell (1995), depending on which database quotes the more recent work.
In the next four columns we list the energies and the Landé factors of the
lower and upper levels. These values, as well as the percentage of the coupling
scheme listed in the last column, are taken from
Moore (1958,1949,1971), and from Martin et al. (1978).
The only exception are the hydrogen lines. In these cases the energies, which
are the average values over the fine structure, are taken from Kurucz & Bell (1995).
An asterisk over the Landé factor indicates that the value is not the
experimental one, but is calculated theoretically under the hypothesis of
L-S coupling.
As far as hydrogen is concerned, it has been demonstrated that the
Landé factor of all its levels is equal to 1 (Casini & Landi Degl'Innocenti 1994).
In the following column we specify if the lower level is the ground level
(GL), a metastable level (ML), or a level that, at the same time, is the upper
level of a transition that produces a polarization signal entering our
threshold values (PL).
A question mark (PL?) means that the lower level is the upper level of a
transition producing a spectral line that falls outside the wavelength
interval covered by the atlas, but for which there are hints to believe that
it might produce a strong signal in the second solar spectrum.
A short dash in this column means that the lower level does not enter any of
these three classes (there is just one line of this kind).
Hereafter, following the conventions of
spectroscopy, the transition whose lower level is the upper level of
another transition, will be referred to as a ``subordinate transition'',
while the transition whose lower level is the ground level, or a
metastable level, will be referred to as a ``resonance transition''.
A level is considered metastable if it cannot be connected through an
allowed transition (according to the selection rules in the L-S coupling
scheme) to a lower level, in other words, if there are no lower
levels showing opposite parity, and satisfying the selection rules
![]() 1,
1,
![]() ,
,
![]() ,
,
![]() 1,
1,
![]() ,
,
![]() ,
,
![]() 1,
1,
![]() .
The lower level of five Ce II lines (the first four lines, and the last
line of this ion listed in Table 2) is not metastable according to
the previous definition.
For these levels, however, L-S coupling holds only approximately, and the
allowed transitions towards lower levels fall in the infrared part of the
spectrum, at wavelengths larger than 20 000 Å (11 500 Å
as far as the level at 11 015.579 cm-1 is concerned).
Unfortunately there are no data concerning the transition probabilities and
the relative intensities of these infrared lines, but we believe that it
should be rather correct to consider these levels metastable as well.
Finally, in the last column we list, when available, the percentage of the
coupling schemes of the upper and lower terms given in column seven.
We recall that light elements are usually well described by the L-S
coupling scheme.
For the sake of completeness, if a signal, that has not been selected (because
of blends in the intensity spectrum or in the second solar spectrum), is
produced by a transition that belongs to a multiplet already present in
Table 2, this transition has been listed in italic fonts in the same
table.
.
The lower level of five Ce II lines (the first four lines, and the last
line of this ion listed in Table 2) is not metastable according to
the previous definition.
For these levels, however, L-S coupling holds only approximately, and the
allowed transitions towards lower levels fall in the infrared part of the
spectrum, at wavelengths larger than 20 000 Å (11 500 Å
as far as the level at 11 015.579 cm-1 is concerned).
Unfortunately there are no data concerning the transition probabilities and
the relative intensities of these infrared lines, but we believe that it
should be rather correct to consider these levels metastable as well.
Finally, in the last column we list, when available, the percentage of the
coupling schemes of the upper and lower terms given in column seven.
We recall that light elements are usually well described by the L-S
coupling scheme.
For the sake of completeness, if a signal, that has not been selected (because
of blends in the intensity spectrum or in the second solar spectrum), is
produced by a transition that belongs to a multiplet already present in
Table 2, this transition has been listed in italic fonts in the same
table.
4 Results
In the spectral range between 3190 Å and 6995 Å, we could identify 248 polarimetric signals, due to atomic transitions, that exceed the threshold value. The signals that can be unambiguously associated to a particular transition (no blends in the intensity spectrum), and that can be unambiguously classified and measured (no blends in the second solar spectrum) are 158. Hereafter we will always refer only to these lines (listed in roman fonts in Table 2).| |
Figure 4:
Histograms showing: a) the number of signals in each class;
b) the number of transitions with
|
| Open with DEXTER | |
Our analysis allows establishing some empirical laws. The first one can be
stated as follows. Rule 1: The lower level of the transitions
corresponding to the 158 lines listed in Table 2, namely the most
prominent lines of the second solar spectrum, is either the ground level or a
metastable level (in the sense specified above) or, alternatively, the
upper level of a resonance transition corresponding to a line also contained in
the same table. In other words, all the lines of Table 2 are either
resonance lines, or subordinate lines sharing their lower level with the upper
level of a resonance line producing a strong polarization signal.
This rule has only one exception, the Ba II line at 3891.781 Å. The lower level of the corresponding transition
(6p 2P
![]() ), in fact, is the upper level of the
transition corresponding to the Ba II D1 line at 4934.095 Å,
which shows a depolarization feature in the atlas of Gandorfer (2000),
and of the transition 5d 2D
3/2-6p 2P
), in fact, is the upper level of the
transition corresponding to the Ba II D1 line at 4934.095 Å,
which shows a depolarization feature in the atlas of Gandorfer (2000),
and of the transition 5d 2D
3/2-6p 2P
![]() at
6496.908 Å, which is a weakly polarizing line (see Gandorfer 2000).
at
6496.908 Å, which is a weakly polarizing line (see Gandorfer 2000).
Table 3: Lines of Table 2 produced by subordinate transitions, and corresponding resonance lines.
Without considering the above mentioned Ba II line, only eight lines of Table 2 are produced by subordinate transitions. As stated in Rule 1, the lower level of these transitions is always the upper level of a resonance one. Subordinate lines, and their corresponding resonance lines are listed in Table 3. In four cases the corresponding resonance transition produces a polarization signal included in Table 2, in four cases it falls outside the spectral interval covered by the three volumes of the atlas. These are the Ly ![\begin{figure}
\par\includegraphics[width=15.5cm,clip]{0409fig5.eps}\end{figure}](/articles/aa/full_html/2009/08/aa10409-08/img34.gif) |
Figure 5:
In the first three graphs ( from left to right and from top to bottom)
the amplitude of the selected signals is plotted as a function of the reduced
equivalent width.
The different colors allow distinguishing the signals belonging to the
various classes (panel a)), corresponding to transitions with different
|
| Open with DEXTER | |
4.1 Q/I profile classification
From Fig. 4 (panel a), it can be observed that most of the
signals are of type ``S'' and of type ``W''.
The only signal that does not fit into our classification scheme is the one
produced by the Na I D1 line at 5895.940 Å.
Plotting the signal amplitude as a function of the reduced equivalent width, and
distinguishing through different colors the various classes (see
Fig. 5, panel a), a second empirical rule can be
established.
Rule 2: all the signals produced by the spectral lines of Table 2
having a small
equivalent width (i.e. lines having
![]() F) are of
type ``S''.
The only line, with a large reduced equivalent width, that produces in the
second solar spectrum an ``S'' signal is the hydrogen line at 6563 Å
(H
F) are of
type ``S''.
The only line, with a large reduced equivalent width, that produces in the
second solar spectrum an ``S'' signal is the hydrogen line at 6563 Å
(H![]() ). This line, however, has to be considered with caution within
our sample of lines. Its Q/I ``S'' profile, in fact, is much broader than
all the other ``S'' signals, and also its intensity profile is quite peculiar.
The fact that lines having high values of the equivalent width show profiles
of the type ``W'' or ``M'', suggests that for these lines transfer effects and
partial redistribution effects play an important role.
). This line, however, has to be considered with caution within
our sample of lines. Its Q/I ``S'' profile, in fact, is much broader than
all the other ``S'' signals, and also its intensity profile is quite peculiar.
The fact that lines having high values of the equivalent width show profiles
of the type ``W'' or ``M'', suggests that for these lines transfer effects and
partial redistribution effects play an important role.
Table 4:
Transitions breaking the
![]() and the
and the
![]() ,
,
![]() 1,
1,
![]() rules.
rules.
4.2 Quantum numbers
Among the 158 selected lines, a reduced number (18) correspond
to transitions which do not satisfy the selection rule
![]() (the indices u and
(the indices u and ![]() meaning ``upper'' and ``lower''),
while 2 correspond to transitions which do not satisfy the selection rule
meaning ``upper'' and ``lower''),
while 2 correspond to transitions which do not satisfy the selection rule
![]() ,
,
![]() 1,
1,
![]() .
These lines are listed
in Table 4.
Note that as far as rare earth elements are concerned, the terms involved in
the transitions cannot be described following exactly the L-S coupling scheme
(see Table 2).
.
These lines are listed
in Table 4.
Note that as far as rare earth elements are concerned, the terms involved in
the transitions cannot be described following exactly the L-S coupling scheme
(see Table 2).
As it can be observed from panel b of Fig. 4, most of
the signals are produced by transitions with
![]() = 0 or
= 0 or
![]() .
The six most polarizing lines, in particular, have
.
The six most polarizing lines, in particular, have
![]() ,
while
the lines with
,
while
the lines with
![]() (six lines, all falling at wavelengths
shorter than 4500 Å) produce in general weak polarization signals,
close to the threshold value (see Fig. 5, panel b;
note that two points, corresponding to the Ni I lines at 3492.9 Å,
and 3380.6 Å, perfectly overlap so that only five red points can be
observed).
With the only exception of the Mn I line at 4034.5 Å, whose
polarization signal reaches an amplitude of 0.17%, all the other lines
with
(six lines, all falling at wavelengths
shorter than 4500 Å) produce in general weak polarization signals,
close to the threshold value (see Fig. 5, panel b;
note that two points, corresponding to the Ni I lines at 3492.9 Å,
and 3380.6 Å, perfectly overlap so that only five red points can be
observed).
With the only exception of the Mn I line at 4034.5 Å, whose
polarization signal reaches an amplitude of 0.17%, all the other lines
with
![]() produce signals that do not exceed 0.11%.
A third empirical rule can then be stated as follows.
Rule 3: the lines of Table 2 showing the strongest polarization
signals (
Q/I > 0.17%) are due to transitions having
either
produce signals that do not exceed 0.11%.
A third empirical rule can then be stated as follows.
Rule 3: the lines of Table 2 showing the strongest polarization
signals (
Q/I > 0.17%) are due to transitions having
either
![]() or
or
![]() ,
, ![]() being defined as
being defined as
![]() .
Note finally that all the transitions with
.
Note finally that all the transitions with
![]() produce
``W'' signals.
produce
``W'' signals.
From panel c of Fig. 4, it can be observed that most of
the signals correspond to transitions having either
![]() or
or
![]() .
The few transitions with
.
The few transitions with
![]() produce in general
rather weak polarization signals (see Fig. 5, panel c).
In the next section we will try to justify this empirical result within
the theoretical framework presented in Landi Degl'Innocenti & Landolfi (2004).
produce in general
rather weak polarization signals (see Fig. 5, panel c).
In the next section we will try to justify this empirical result within
the theoretical framework presented in Landi Degl'Innocenti & Landolfi (2004).
Finally, panel d of Fig. 4 shows that most of the
signals are produced by transitions with
![]() .
This seems to be due to the fact that within the same multiplet the strongest
lines in the intensity spectrum (which, as can be demonstrated, are those with
.
This seems to be due to the fact that within the same multiplet the strongest
lines in the intensity spectrum (which, as can be demonstrated, are those with
![]() )
are those which produce the strongest linear
polarization signals in the second solar spectrum.
)
are those which produce the strongest linear
polarization signals in the second solar spectrum.
5 Theoretical considerations
In this section we try to interpret some aspects of the results presented
above within the framework of the theory presented in Landi Degl'Innocenti & Landolfi (2004).
Since most of the selected lines belong to multiplets, the two-level atom
approximation cannot be applied. We consider therefore a two-term atom with
unpolarized lower term. If we neglect collisions, and we assume that no
magnetic field is present, it can be demonstrated
(see Sect. 10.17 of Landi Degl'Innocenti & Landolfi 2004) that in the neighborhood of a particular
line the explicit expression of the emission coefficient in the four Stokes
parameters is
where the product
Note that Eq. (1) is obtained assuming that the radiation field tensor, JKQ, has the same value for all the transitions of the multiplet. We consider a plane-parallel model of the solar atmosphere, and we take a Cartesian reference system with the z axis (the quantization axis) directed along the vertical. Under this approximation the radiation field illuminating the atomic system has cylindrical symmetry about the vertical, and can be fully described through only two components of the radiation field tensor: J00, and J20. The former describes the average intensity of the radiation field over all the directions of propagation, the latter gives a measure of its anisotropy. The anisotropy degree of the radiation field is usually quantified through the so-called anisotropy factor, a dimensionless parameter defined as
![\begin{figure}
\par\includegraphics[width=17cm,clip]{0409fig6.eps}\end{figure}](/articles/aa/full_html/2009/08/aa10409-08/img55.gif) |
Figure 6:
Values of
|
| Open with DEXTER | |
Taking the reference direction for positive Q parallel to the atmosphere,
the only non zero radiative transfer coefficients are ![]() ,
,
![]() ,
,
![]() and
and
![]() ,
where
,
where ![]() and
and ![]() are the
absorption coefficients in the Stokes parameters I and Q, respectively
(see Landi Degl'Innocenti & Landolfi 2004, Eqs. (7.47a-e)).
The radiative transfer equations take therefore the simpler form
are the
absorption coefficients in the Stokes parameters I and Q, respectively
(see Landi Degl'Innocenti & Landolfi 2004, Eqs. (7.47a-e)).
The radiative transfer equations take therefore the simpler form
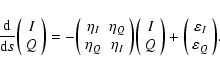 |
(3) |
Since the anisotropy degree is small in the solar atmosphere, we have
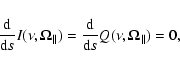 |
(4) |
and, after some algebra, we obtain (Landi Degl'Innocenti & Landolfi 2004; Trujillo Bueno 2003b)
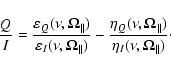
Since we are considering a two-term atom with unpolarized lower term, we have
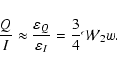
The quantity
Equation (6) shows that, under the simplifying hypotheses
introduced above, the fractional polarization is proportional to the product
of the anisotropy factor and of the quantity
![]() ,
which depends on
the quantum numbers of the transition.
Figure 6 shows the values of
,
which depends on
the quantum numbers of the transition.
Figure 6 shows the values of
![]() for a
certain number of transitions. We can easily observe that the higher values,
are found for transitions with
for a
certain number of transitions. We can easily observe that the higher values,
are found for transitions with
![]() ,
0, and with
,
0, and with
![]() ,
independently of the spin value, in agreement with
the empirical results obtained from our analysis of the second solar spectrum.
,
independently of the spin value, in agreement with
the empirical results obtained from our analysis of the second solar spectrum.
Since we are neglecting radiation transfer effects, and since
the theory we are applying neglects partial redistribution effects, we consider
hereafter only the lines with small equivalent width, for which these
effects should be small, or negligible. We consider therefore
only the ``S'' signals (the corresponding lines have
![]() F, see Fig. 5, panel a), with the exception of the
H
F, see Fig. 5, panel a), with the exception of the
H![]() line (see Sect. 4.1).
Recalling that the theory we are applying is based on the assumption that the
atomic system is described by the L-S coupling scheme, and recalling the
hypothesis of the unpolarized lower term, we restrict from now on to consider
only the ``S'' signals due to transitions between levels in L-S
coupling
line (see Sect. 4.1).
Recalling that the theory we are applying is based on the assumption that the
atomic system is described by the L-S coupling scheme, and recalling the
hypothesis of the unpolarized lower term, we restrict from now on to consider
only the ``S'' signals due to transitions between levels in L-S
coupling![]() , with
a metastable (or fundamental) lower level.
, with
a metastable (or fundamental) lower level.
Plotting the signal amplitude as a function of
![]() ,
we observe that
all the points lie either close to the straight line passing through the
origin, and having slope equal to 0.011, or below it (see
Fig. 5, panel d).
According to Eq. (6), this behavior implies that the anisotropy
factor w has to be smaller than
,
we observe that
all the points lie either close to the straight line passing through the
origin, and having slope equal to 0.011, or below it (see
Fig. 5, panel d).
According to Eq. (6), this behavior implies that the anisotropy
factor w has to be smaller than
![]() .
Since the anisotropy factor of the photospheric continuum, around
4000 Å, is of about 0.15, we immediately notice that there is a
discrepancy of about one order of magnitude
.
Since the anisotropy factor of the photospheric continuum, around
4000 Å, is of about 0.15, we immediately notice that there is a
discrepancy of about one order of magnitude![]() .
Very likely, such a significant discrepancy is due to the fact that in
Eq. (6) three fundamental ``ingredients'', all expected to
decrease the polarization, are neglected: the magnetic field, collisions, and
radiation transfer effects.
.
Very likely, such a significant discrepancy is due to the fact that in
Eq. (6) three fundamental ``ingredients'', all expected to
decrease the polarization, are neglected: the magnetic field, collisions, and
radiation transfer effects.
The effect of a unimodal microturbulent magnetic field can be taken into
account rather easily.
In the presence of such a magnetic field, in fact, Eq. (6)
is modified into
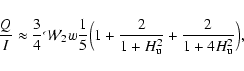
where

where A is the Einstein coefficient for spontaneous emission, expressed in 107 s-1, and
We conclude our discussion with two more plots based on Eq. (6).
If we divide the observed value of Q/I of each signal by the corresponding
![]() ,
we should obtain something proportional to the anisotropy
factor of the radiation field at the height of formation, and at the
wavelength position of the various spectral lines.
The anisotropy factor of the continuum has been plotted as a function
of wavelength by Manso Sainz & Landi Degl'Innocenti (2002), and it can be observed that in the wavelength
range considered here, it decreases with wavelength approximately by a factor
2.
If we plot the quantity
,
we should obtain something proportional to the anisotropy
factor of the radiation field at the height of formation, and at the
wavelength position of the various spectral lines.
The anisotropy factor of the continuum has been plotted as a function
of wavelength by Manso Sainz & Landi Degl'Innocenti (2002), and it can be observed that in the wavelength
range considered here, it decreases with wavelength approximately by a factor
2.
If we plot the quantity
![]() as a function of wavelength,
we see that the points spread over the Cartesian plane, showing a slight
decreasing trend with wavelength (see Fig. 5, panel e).
The black dashed line, which represents the best linear fit to the points,
shows more clearly the expected trend.
as a function of wavelength,
we see that the points spread over the Cartesian plane, showing a slight
decreasing trend with wavelength (see Fig. 5, panel e).
The black dashed line, which represents the best linear fit to the points,
shows more clearly the expected trend.
Since the observations of Gandorfer (Gandorfer 2002,2005,2000) were taken inside the limb, very likely the most relevant dependence that has to be considered is the variation of the anisotropy factor as a function of the height of formation of the various lines. In this sense it is therefore interesting to plot the quantity R as a function of the reduced equivalent width, since, as a first approximation, lines with similar equivalent widths should form at similar heights. Note that the application of Eq. (6) for the investigation of this kind of dependence is not fully consistent, as it is correct only for tangential observations, and it is based upon the assumption that the illuminating radiation field should be the same for the various components of the multiplet. As can be observed from panel f of Fig. 5, in this case the points spread over the Cartesian plane, without showing any particular trend. As far as the sensitivity to a microturbulent magnetic field is concerned, we observe that, as expected, lines with larger critical fields are in general more polarized, but too many exceptions are present in order to draw any conclusion. On the contrary, these results stress the fact that the mechanism through which the polarization is produced, and modified, is extremely complex. In particular, there are many physical processes that are involved in the generation and modification of the polarization (see, for example, Shchukina & Trujillo Bueno 2008) . As previously observed, for some of these processes we do not have a reliable knowledge of all the physical parameters which are needed in order to quantify their effects.
6 Conclusions
We have carried out a detailed analysis of the second solar spectrum, as plotted in graphical form in the three volumes of the atlas ``The Second Solar Spectrum'' (Gandorfer 2002,2005,2000). All the strongest polarization signals due to atomic transitions have been identified, classified according to the shape of their Q/I profile, and listed together with the most relevant spectroscopic properties of the corresponding lines. From the analysis of these data, three empirical rules have been formulated. The rules concern the properties of the lower level, a correlation between the shape of the polarization profiles and the reduced equivalent width of the lines in the intensity spectrum, and the quantum numbers involved in the transitions. Our initial purpose to investigate the possible existence of common properties among the strongest polarization signals of the second solar spectrum has therefore been met with success. These three rules might represent the first step to understand why only particular spectral lines show at the limb strong polarization signals, which is one of the most interesting open questions concerning the second solar spectrum.
References
- Brückner, G. 1963, ZAp, 58, 73 [NASA ADS]
- Casini, R., & Landi Degl'Innocenti, E. 1994, A&A, 291, 668 [NASA ADS] (In the text)
- Fluri, D. M., & Stenflo, J. O. 1999, A&A, 341, 902 (In the text)
- Gandorfer, A. 2000, The Second Solar Spectrum: A High Resolution Polarimetric Survey of Scattering Polarization at the Solar Limb in Graphical Representation, Vol. I: 4625 Å to 6995 Å (Zürich: vdf ETH), ISBN 3 7281 2764 7
- Gandorfer, A. 2002, The Second Solar Spectrum: A High Resolution Polarimetric Survey of Scattering Polarization at the Solar Limb in Graphical Representation, Vol. II: 3910 Å to 4630 Å (Zürich: vdf ETH), ISBN 3 7281 2844 4
- Gandorfer, A. 2005, The Second Solar Spectrum: A High Resolution Polarimetric Survey of Scattering Polarization at the Solar Limb in Graphical Representation, Vol. III: 3160 Å to 3915 Å (Zürich: vdf ETH), ISBN 3 7281 3018 4
- Kurucz, R. L., & Bell, B. 1995, Atomic Line Data Kurucz CD-ROM No. 23 [NASA ADS] [CrossRef] (Cambridge, Mass.: Smithsonian Astrophysical Observatory) (In the text)
- Landi Degl'Innocenti, E., & Landolfi, M. 2004, Polarization in Spectral Lines (Dordrecht: Kluwer) (In the text)
- Manso Sainz, R., & Landi Degl'Innocenti, E. 2002, A&A, 394, 1093 [NASA ADS] [CrossRef] [EDP Sciences] (In the text)
- Manso Sainz, R., & Trujillo Bueno, J. 2003, A Multilevel Radiative Transfer Program for Modeling Scattering Line Polarization and the Hanle Effect in Stellar Atmospheres, in Solar Polarization 3, ed. J. Trujillo Bueno, & J. Sánchez Almeida, ASP Conf. Ser., 307, 251
- Manso Sainz, R., Landi Degl'Innocenti, E., & Trujillo Bueno, J. 2006, A&A, 447, 1125 [NASA ADS] [CrossRef] [EDP Sciences] (In the text)
- Martin, W. C., Zalubas, R., & Hagan, L. 1978, Atomic Energy Levels-The Rare Earth Elements, NSRDS-NBS 60 (Washington D.C.: NSRDS-NBS) (In the text)
- Moore, C. E. 1945, A Multiplet Table of Astrophysical Interest, Revised Edition, Part I-Table of Multiplets (New Jersey: Princeton) (In the text)
- Moore, C. E. 1949, Atomic Energy Levels As Derived From the Analyses of Optical Spectra. Vol. I (Washington D.C.: NBS)
- Moore, C. E. 1958, Atomic Energy Levels As Derived From the Analyses of Optical Spectra. Vol. III (Washington D.C.: NBS)
- Moore, C. E. 1971, Atomic Energy Levels As Derived From the Analyses of Optical Spectra. Vol. II, NSRDS-NBS 35 (Washington D.C.: NSRDS-NBS)
- Moore, C. E., Minnaert, M. G. J., & Houtgast, J. 1966, The Solar Spectrum 2935 Å to 8770Å, NBS Monograph 61 (Washington D.C.: NBS) (In the text)
- Ralchenko, Yu., Kramida, A. E., Reader, J., & NIST ASD Team 2008, NIST Atomic Spectra Database (version 3.1.4) (Gaithersburg, MD.: NIST) (In the text)
- Redman, R. O. 1941, MNRAS, 101, 266 [NASA ADS] (In the text)
- Shchukina, N., & Trujillo Bueno, J. 2008, Three-dimensional Radiative Transfer Modeling of the Second Solar Spectrum of Titanium, in Solar Polarization 5, ed. S. Berdyugina, K. N. Nagendra, & R. Ramelli, ASP Conf. Ser., in press (In the text)
- Stenflo, J. O. 1974, Sol. Phys., 37, 31 [CrossRef]
- Stenflo, J. O. 1980, A&A, 84, 68 [NASA ADS]
- Stenflo, J. O. 2005, A&A, 429, 713 [NASA ADS] [CrossRef] [EDP Sciences] (In the text)
- Stenflo, J. O., & Keller, C. U. 1996, Nature, 382, 588 [NASA ADS] [CrossRef]
- Stenflo, J. O., & Keller, C. U. 1997, A&A, 321, 927
- Stenflo, J. O., Baur, T. G., & Elmore, D. F. 1980, A&A, 84, 60 [NASA ADS]
- Stenflo, J. O., Twerenbold, D., & Harvey, J. W. 1983a, A&AS, 52, 161 [NASA ADS]
- Stenflo, J. O., Twerenbold, D., Harvey, J. W., & Brault, J. W. 1983b, A&AS, 54, 505 [NASA ADS]
- Stenflo, J. O., Keller, C. U., & Gandorfer, A. 2000, A&A, 355, 789 [NASA ADS]
- Trujillo Bueno, J. 2003a, The Generation and Transfer of Polarized Radiation in Stellar Atmospheres, in Stellar Atmosphere Modeling, ed. I. Hubeny, D. Mihalas, & K. Werner, ASP Conf. Ser., 288, 551
- Trujillo Bueno, J. 2003b, New Diagnostic Windows on the Weak Magnetism of the Solar Atmosphere, in Solar Polarization 3, ed. J. Trujillo Bueno, & J. Sánchez Almeida, ASP Conf. Ser., 307, 407
- Trujillo Bueno, J. 2009, The Magnetic Sensitivity of the Second Solar Spectrum, in Solar Polarization 5, ed. S. Berdyugina, K. N. Nagendra, & R. Ramelli, ASP Conf. Ser., in press (In the text)
- Trujillo Bueno, J., Shchukina, N., & Asensio Ramos, A. 2004, Nature, 430, 326 [NASA ADS] [CrossRef] (In the text)
- Wiehr, E. 1975, A&A, 38, 303
- Wiehr, E. 1978, A&A, 67, 257
Online Material
Table 1: Table of the most polarizing atomic spectral lines of the second solar spectrum (3160 Å-6995 Å). The lines are listed by increasing wavelength. The various quantities that are listed for each line are described in Sect. 2.3.
Table 2: Spectroscopic properties of the atomic spectral lines listed in Table 1, which present unambiguous identification and Q/I profile classification and measurement. The lines are collected element by element. The various quantities that are listed for each line are described in Sect. 3.
Footnotes
- ... spectrum
- Tables 1 and 2 are only available in electronic form at http://www.aanda.org
- ...
cycle
- A particularly relevant example is the one of the Mg I b-lines. The polarization signals observed in these lines by Stenflo and collaborators in 1995 (see Stenflo et al. 2000) are significantly different from those of Gandorfer's atlas.
- ...Moore (1945)
- The data for the Nb II and the Dy II lines are taken from Kurucz & Bell (1995).
- ...
coupling
- As far as rare earth elements are concerned, if the percentage of the L-S coupling of the upper or lower level is unknown, or smaller than 70% (see Table 2), the line has been discarded.
- ... magnitude
- The value of 0.15 refers to the ``solar surface'', as defined in Sect. 12.3 of Landi Degl'Innocenti & Landolfi (2004).
- ...
level
- For the elements or ions showing hyperfine structure (HFS), the value of the Landé factor appearing in Eq. (8) is the one that would compete to the level neglecting HFS.
All Tables
Table 3: Lines of Table 2 produced by subordinate transitions, and corresponding resonance lines.
Table 4:
Transitions breaking the
![]() and the
and the
![]() ,
,
![]() 1,
1,
![]() rules.
rules.
Table 1: Table of the most polarizing atomic spectral lines of the second solar spectrum (3160 Å-6995 Å). The lines are listed by increasing wavelength. The various quantities that are listed for each line are described in Sect. 2.3.
Table 2: Spectroscopic properties of the atomic spectral lines listed in Table 1, which present unambiguous identification and Q/I profile classification and measurement. The lines are collected element by element. The various quantities that are listed for each line are described in Sect. 3.
All Figures
| |
Figure 1: Classification scheme of the Q/I profiles. The thick dashed horizontal line represents the continuum level. The vertical dashed line joins the limits between which the amplitude of the signal has been measured. |
| Open with DEXTER | |
| In the text | |
| |
Figure 2: Examples of signals of the second solar spectrum belonging to the various classes proposed. Panel a): Sr I at 4607 Å (S signal); panel b): Fe I at 4415 Å (W signal); panels c) and d): Co I at 3405 Å and Ti II at 3373 Å (M0 signals), panels e) and f): Ca I at 4227 Å and Fe I at 4046 Å (M1 signals); panels g) and h): Sr II at 4078 Å and Cr I at 5208 Å (MS signals). The observations shown in this figure have been scanned from the atlas ``The Second Solar Spectrum'' (Gandorfer 2002,2005,2000). |
| Open with DEXTER | |
| In the text | |
| |
Figure 3:
Examples of polarization signals blended with stronger and broader
ones. Panel a): a S |
| Open with DEXTER | |
| In the text | |
| |
Figure 4:
Histograms showing: a) the number of signals in each class;
b) the number of transitions with
|
| Open with DEXTER | |
| In the text | |
| |
Figure 5:
In the first three graphs ( from left to right and from top to bottom)
the amplitude of the selected signals is plotted as a function of the reduced
equivalent width.
The different colors allow distinguishing the signals belonging to the
various classes (panel a)), corresponding to transitions with different
|
| Open with DEXTER | |
| In the text | |
| |
Figure 6:
Values of
|
| Open with DEXTER | |
| In the text | |
Copyright ESO 2009
Current usage metrics show cumulative count of Article Views (full-text article views including HTML views, PDF and ePub downloads, according to the available data) and Abstracts Views on Vision4Press platform.
Data correspond to usage on the plateform after 2015. The current usage metrics is available 48-96 hours after online publication and is updated daily on week days.
Initial download of the metrics may take a while.