


| Issue |
A&A
Volume 712, August 2026
|
|
|---|---|---|
| Article Number | C1 | |
| Number of page(s) | 3 | |
| Section | Extragalactic astronomy | |
| DOI | https://doi.org/10.1051/0004-6361/202661474e | |
| Published online | 30 July 2026 | |
Gravitational-wave background from extragalactic double white dwarfs for LISA (Corrigendum)
1
Laboratoire Lagrange, Observatoire de la Côte d’Azur, Université Côte d’Azur, CNRS,
France
2
Artemis, Observatoire de la Côte d’Azur, Université Côte d’Azur, CNRS, CS 34229,
06304
Nice Cedex 4,
France
3
Dipartimento di Fisica “G. Occhialini”, Università degli Studi di Milano-Bicocca,
Piazza della Scienza 3,
20126
Milano,
Italy
4
INFN, Sezione di Milano-Bicocca,
Piazza della Scienza 3,
20126
Milano,
Italy
★ Corresponding author: This email address is being protected from spambots. You need JavaScript enabled to view it.
Key words: gravitational waves / methods: statistical / binaries: close / white dwarfs / errata, addenda
1 Introduction
We identified a numerical implementation error in Boileau et al. (2025) for the calculation of the stochastic gravitational-wave background (SGWB) from extragalactic double white dwarfs (DWDs) when using the star formation rate density (SFRD) model of Strolger et al. (2004). We report here an updated figure for the frequency evolution and tabulated values of the signal-to-noise ratios (S/Ns) and best-fit parameters for each COSMIC model of binary evolution explored in that study.
2 Updated results
2.1 Predictions for the SGWB from extragalactic DWDs
We find that population synthesis modeling dominates the uncertainties in the background amplitude and, in particular, the treatment of common envelope evolution. Across all three SFRD models, we consistently find a factor of ~3–5 between the default COSMIC model and the α4 model in the [10−3, 10−2] Hz frequency band. On the other hand, uncertainties in the high-redshift (z > 2) part of the SFRD exhibit more moderate impact, with a variation by a factor of ~1–2 in the global amplitude of the predicted backgrounds. These differences highlight the sensitivity of the SGWB from extragalactic DWDs predictions to the physical processes involved in the interactions inside stellar binaries.
Our SGWB from extragalactic DWDs predictions lie very close to the LISA sensitivity curve (black curve) in the [2 × 10⁻³, 8 × 10⁻³] Hz frequency band, and even slightly above it for the most optimistic COSMIC α4 model combined with the SFRD model of Strolger et al. (2004). This suggests that the LISA mission may allow us to put some strong observational constraints on the amplitude of this astrophysical background in that specific frequency range.
We list in Table 1 the computed S/Ns for each combination of COSMIC simulation and SFRD model explored in this study. We find a factor of ~5 between the strongest background (computed for α4 with Strolger et al. (2004)) and the most conservative one (default with Madau & Fragos (2017)). We note that all scenarios involving the commonly used SFRD from Madau & Dickinson (2014) yield S/N values well above unity, ranging from ≳100 to ≲400 for a 4-year mission and up to ≳600 for a 10-year mission.
We present in Appendix A numerical fits for the frequency evolution of each background across all the SFRD and stellar population synthesis models. In particular, the best-fit parameters for the same smoothly broken power-law model used in Boileau et al. (2025) are given in Table A.1.
S/Ns for the different combinations of SFRD models and COSMIC populations.
3 Updated conclusions
The updated findings resulting from the corrections made to our implementation of the SFRD model of Strolger et al. (2004) can be summarized as follows:
The signal is detectable by LISA across all scenarios explored after only 4 years, with S/Ns ranging from ~100 to ~550. For a 10-year mission, the S/N can reach up to ≲900, indicating that the SGWB from extragalactic DWDs will be robustly observed by LISA under all astrophysical assumptions considered here.
The dominant uncertainty on ΩGW arises from the uncertainties in binary interactions and, in particular, the treatment of common envelope evolution (by a factor of ~3–5), with additional variations arising from the uncertainties on the SFRD at high redshifts (by a factor of ~1–2).
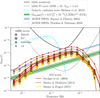 |
Fig. 1 Updated Fig. 1 in Boileau et al. (2025), showing the spectral energy density of the SGWB from extragalactic DWDs for the various population synthesis and SFRD models considered in that study. The red, brown, and gold lines represent the SFRD models from Strolger et al. (2004), Madau & Dickinson (2014), and Madau & Fragos (2017), respectively. The black line represents the LISA sensitivity curve (Colpi et al. 2024), while the gray line shows the power-law integrated curve (Thrane & Romano 2013) for four years of observation time and S/N=10. The light blue curve represents the confusion noise from the Galactic DWDs (Robson et al. 2019), and the green band represents the 90% credible interval of the SGWB from all compact object binaries estimated from gravitational wave observations (Abbott et al. 2023). As a comparison, the shaded blue band shows the SGWB from extragalactic DWDs estimated in (Farmer & Phinney 2003), and the pink curve indicates the best-fit model obtained in (Staelens & Nelemans 2024). |
References
- Abbott, R., Abbott, T. D., Acernese, F., et al. 2023, Phys. Rev. X, 13, 011048 [NASA ADS] [Google Scholar]
- Boileau, G., Bruel, T., Toubiana, A., Lamberts, A., & Christensen, N. 2025, A&A, 702, A246 [NASA ADS] [CrossRef] [EDP Sciences] [Google Scholar]
- Colpi, M., Danzmann, K., Hewitson, M., et al. 2024, LISA Definition Study Report [Google Scholar]
- Farmer, A. J., & Phinney, E. S. 2003, MNRAS, 346, 1197 [NASA ADS] [CrossRef] [Google Scholar]
- Madau, P., & Dickinson, M. 2014, ARA&A, 52, 415 [Google Scholar]
- Madau, P., & Fragos, T. 2017, ApJ, 840, 39 [Google Scholar]
- Robson, T., Cornish, N. J., & Liu, C. 2019, Class. Quantum Grav., 36, 105011 [Google Scholar]
- Smith, T. L., & Caldwell, R. R. 2019, Phys. Rev. D, 100, 104055 [Google Scholar]
- Staelens, S., & Nelemans, G. 2024, A&A, 683, A139 [NASA ADS] [CrossRef] [EDP Sciences] [Google Scholar]
- Strolger, L.-G., Riess, A. G., Dahlen, T., et al. 2004, ApJ, 613, 200 [Google Scholar]
- Thrane, E., & Romano, J. D. 2013, Phys. Rev. D, 88, 124032 [NASA ADS] [CrossRef] [Google Scholar]
- Virtanen, P., Gommers, R., Oliphant, T. E., et al. 2020, Nat. Methods, 17, 261 [Google Scholar]
Appendix A Estimating the SGWB using a smoothly broken power law fit
Upon identifying uncertainties in the convergence of the method previously used in Boileau et al. (2025), we fit each computed background using the curve_fit method from Scipy (Virtanen et al. 2020). We report the updated best-fit parameters for the same smoothly broken power-law model in Table A.1 and show in Fig. A.1 an example of the best-fit result for our default COSMIC population coupled with the SFRD model of Madau & Dickinson (2014).
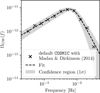 |
Fig. A.1 Updated Fig. B.1. in Boileau et al. (2025), with SGWB from extragalactic DWDs computed using our default COSMIC simulation and the SFRD model of Madau & Dickinson (2014). The solid line represents the best-fit model, and the shaded area indicates the 1σ uncertainty region. |
Best-fit parameters for the different combinations of SFRD models and COSMIC populations.
© The Authors 2026
 Open Access article, published by EDP Sciences, under the terms of the Creative Commons Attribution License (https://creativecommons.org/licenses/by/4.0), which permits unrestricted use, distribution, and reproduction in any medium, provided the original work is properly cited.
This article is published in open access under the Subscribe to Open model. This email address is being protected from spambots. You need JavaScript enabled to view it. to support open access publication.
All Tables
Best-fit parameters for the different combinations of SFRD models and COSMIC populations.
All Figures
|
Fig. 1 Updated Fig. 1 in Boileau et al. (2025), showing the spectral energy density of the SGWB from extragalactic DWDs for the various population synthesis and SFRD models considered in that study. The red, brown, and gold lines represent the SFRD models from Strolger et al. (2004), Madau & Dickinson (2014), and Madau & Fragos (2017), respectively. The black line represents the LISA sensitivity curve (Colpi et al. 2024), while the gray line shows the power-law integrated curve (Thrane & Romano 2013) for four years of observation time and S/N=10. The light blue curve represents the confusion noise from the Galactic DWDs (Robson et al. 2019), and the green band represents the 90% credible interval of the SGWB from all compact object binaries estimated from gravitational wave observations (Abbott et al. 2023). As a comparison, the shaded blue band shows the SGWB from extragalactic DWDs estimated in (Farmer & Phinney 2003), and the pink curve indicates the best-fit model obtained in (Staelens & Nelemans 2024). |
| In the text | |
|
Fig. A.1 Updated Fig. B.1. in Boileau et al. (2025), with SGWB from extragalactic DWDs computed using our default COSMIC simulation and the SFRD model of Madau & Dickinson (2014). The solid line represents the best-fit model, and the shaded area indicates the 1σ uncertainty region. |
| In the text | |
Current usage metrics show cumulative count of Article Views (full-text article views including HTML views, PDF and ePub downloads, according to the available data) and Abstracts Views on Vision4Press platform.
Data correspond to usage on the plateform after 2015. The current usage metrics is available 48-96 hours after online publication and is updated daily on week days.
Initial download of the metrics may take a while.